Article

Genetic Consequences of Fence Confinement in a Population of White-Tailed Deer

1
Behavioral and Molecular Ecology Group, Department of Biological Sciences, University of Wisconsin-Milwaukee, Milwaukee, WI 53201, USA
2
Oaks and Prairie Joint Venture, Ardmore, OK 73401, USA
3
Noble Research Institute, LLC, Ardmore, OK 73401, USA
4
Natural Science Division, Pepperdine University, Malibu, CA 90263, USA
5
Caesar Kleberg Wildlife Research Institute, Texas A&M University-Kingsville, Kingsville, TX 78363, USA
6
Department of Wildlife, Fisheries and Aquaculture, Mississippi State University, Mississippi, MS 39762, USA
7
Natural Resources Office, McAlester Army Ammunition Plant, McAlester, OK 8657, USA
*
Author to whom correspondence should be addressed.
Diversity 2021, 13(3), 126; https://doi.org/10.3390/d13030126
Submission received: 26 February 2021 / Revised: 5 March 2021 / Accepted: 8 March 2021 / Published: 16 March 2021
(This article belongs to the Special Issue Conservation Genetics of Wildlife)

Abstract

:
Fencing wildlife populations can aid wildlife management goals, but potential benefits may not always outweigh costs of confinement. Population isolation can erode genetic diversity and lead to the accumulation of inbreeding, reducing viability and limiting adaptive potential. We used microsatellite and mitochondrial DNA data collected from 640 white-tailed deer confined within a 1184 ha fence to quantify changes in genetic diversity and inbreeding over the first 12 years of confinement. Genetic diversity was sustained over the course of the study, remaining comparable to unconfined white-tailed deer populations. Uneroded genetic diversity suggests that genetic drift is mitigated by a low level of gene flow, which supports field observations that the fence is not completely impermeable. In year 9 of the study, we observed an unexpected influx of mtDNA diversity and drop in inbreeding as measured by FIS. A male harvest restriction imposed that year increased male survival, and more diverse mating may have contributed to the inbreeding reduction and temporary genetic diversity boost we observed. These data add to our understanding of the long-term impacts of fences on wildlife, but also highlight the importance of continued monitoring of confined populations.

1. Introduction

Fences are ubiquitous features used worldwide for many purposes [1,2], including as tools for enhancing wildlife research, conservation, and management [3,4]. Fencing can benefit focal species by effectively reducing mortality, defending against disease and invasive species, and facilitating population recovery [5,6,7,8]. But fencing also can exact conservation costs, for example, by inhibiting animal movement, elevating infection risk within enclosures, or restricting access to critical resources [9,10]. There also are unintended effects of fencing that extend beyond the focal species, and the ramifications are either positive or negative for nontarget species [10,11,12,13]. Empirical research on the impacts of fences is sparse thematically and taxonomically, and knowledge gaps are wide. Recent reviews [3,4] highlight the complex, widespread, and poorly understood effects of fences, and serve as a call to action for further study of both broad community-level and context-specific outcomes.
There is a wide range of fence designs, and each has advantages and disadvantages for different management objectives. For instance, high-tensile electric fences are efficient for deer research, management, and harvest control. The high-tensile strength of strands is an effective physical barrier to deer, and the high-voltage current serves as an effective behavioral deterrent [14]. When fence breaches do occur, crossings are primarily at gaps or holes in the fence (e.g., at roads or stream crossings) [15,16]. Even without completely blocking deer movement, high-tensile electric fences can reduce movement sufficiently to facilitate management. Confined deer populations have lower rates of trespass and illegal harvest, allowing better control of annual harvest limits to meet management goals (e.g., sex ratios, age structure) [17]. Additionally, confined populations often exhibit increased survival and improved physical condition when the enclosure is well-managed, harboring sufficient resources and habitats [17,18,19].
It is unclear whether the potential benefits of fences outweigh the negative effects of isolation. Fences restrict natural movements and can constrain normal behavior [20,21,22]. Isolated populations can be less demographically stable than large populations and are more susceptible to erosion of genetic variation by genetic drift [23]. In confined populations with little or no gene flow, the loss of genetic variation through genetic drift is unmitigated. A lack of genetic variation leaves populations vulnerable to inbreeding depression [24], making the population less able to adapt to changing environmental conditions [25] and ultimately impacting the long-term health of the population. Intensive management of habitats and harvest quotas are helpful in mitigating the negative effects of isolation, but factors like altered breeding and dominance patterns in confined populations exacerbate effective management [26].
To test the hypothesized effects of isolation in confined populations, we collected empirical data from a confined white-tailed deer (Odocoileus virginianus) population in Oklahoma. The population has been confined since 1993 in a 1184 ha area surrounded by a 2.5 m tall, 15-strand high-tensile electric fence. The fence is semi-permeable with observed cross-fence movement, but around 90% of the population is effectively confined when fence breaks are efficiently repaired [16]. It is unclear if cross-fence movement successfully leads to gene flow. We used microsatellite and mitochondrial DNA data to quantify temporal changes in genetic diversity and inbreeding in this confined population. These data will add to the paucity of information related to the long-term impact of fences on wildlife; these findings come at a time when fences are proliferating rapidly worldwide, while their cumulative impacts, both ecologically and genetically, remain poorly understood [3,4].

2. Materials and Methods

The study area is 1214 ha located in the Cross Timbers region of Oklahoma (at the intersection of Coal, Hughes, and Pontotoc counties), which is approximately 60% wooded and 40% open habitats with a high degree of interspersion [27]. The property was formerly owned and managed by the Samuel Roberts Noble Foundation (now known as the Noble Research Institute, LLC, Ardmore, OK, USA). A 2.5 m, high-tensile electric fence containing 15 smooth wire strands was completed in 1993 to discourage human trespass and facilitate white-tailed deer management programs [16]. Density of deer within the enclosure ranged from 1 deer/19 ha to 1 deer/5.9 ha [28]. Hunting was permitted on both sexes until 1999 (male harvest restricted through harvest criteria), limited to females only in 2000 and 2001, and restricted for both sexes after 2002 due to ongoing, long-term research projects. In years where harvest occurred, it was moderate for females (1 deer/80 ha) and limited for males (1 deer/500 ha), most of which were adults ≥2.5 years of age [29].
Deer tissue and antler samples were collected each year from 1992 through 2005, covering the entire confined space (Figure 1). Samples were collected from all harvested deer (n = 84 tissue samples), deer captured on the property as part of other ongoing research (n = 588 tissue samples), and shed antlers or carcasses found during routine activities on the property (n = 137 antler core drillings or tissue samples). Spatial locations were recorded for all 809 samples collected, and sex was recorded for most samples. Tissue samples were frozen upon collection and stored at −20 °C. We extracted DNA from samples using DNeasy Blood and Tissue Kits (Qiagen, Hilden, Germany), adding 0.6 mg proteinase K and overnight incubation to the initial lysis step.
We amplified 17 microsatellite loci using protocols outlined in [30,31]. Amplification products were electrophoresed on an ABI Prism 3130 Genetic Analyzer (Applied Biosystems, Foster City, CA, USA), and allele sizes were scored in GeneMapper software (Applied Biosystems, Foster City, CA, USA) against a GeneScan 500 ROX size standard (Chimerx, Milwaukee, WI, USA). We removed duplicate genotypes (e.g., deer captured in multiple years, a harvested male with a genotype matching a shed antler from a prior year, deer captured in one year and harvested later; n = 150) and samples with >50% missing genotypes (n = 19). The final dataset contained 640 individuals (n = 263 females, n = 326 males, and n = 51 sex unrecorded) genotyped at 17 microsatellite loci, with 0.7% missing data. We used PGDSpider (version 2.1.1.5) [32] to convert our data for different input formats.
We also generated nucleotide sequence data from a 646-bp portion of the mitochondrial control region for a subset of 219 individuals. We amplified the fragment in 25 uL reaction volumes containing 10–50 ng genomic DNA, 0.4 nM each primer (primers 283 and 1115) [33], 200 mM dNTPs, 25 mM MgCl2, and 1 U AmpliTaq Gold (Applied Biosystems, Foster City, CA, USA) in GeneAmp 10x PCR buffer II (Applied Biosystems, Foster City, CA, USA). The thermocycler profile included an initial denaturation step at 94 °C for 12 min, followed by 35 cycles of 94 °C for 35 s 51 °C for 30 sec, and 72 °C for 1 min, with a final extension at 72 °C for 15 min. We used enzyme-purified PCR products (ExoSAP-IT; Applied Biosystems, Foster City, CA, USA) as templates for sequencing reactions using the BigDye Terminator Cycle Sequencing Kit v1.1 (Applied Biosystems, Foster City, CA, USA). We removed unincorporated dye terminators using the DyeEx 2.0 Spin Kit (Qiagen, Hilden, Germany) and sequenced each sample in both directions on an ABI Prism 3130xl Genetic Analyzer (Applied Biosystems, Foster City, CA, USA). We aligned and edited sequences using Lasergene (v4.03, DNAStar Inc., Madison, WI, USA) and CLUSTAL X [34].
We estimated basic genetic diversity statistics for microsatellite data in GenAlEx (version 6.51b2) [35,36] and SpaGeDi (version 1.5 d) [37]. These estimates included the number of alleles, expected and observed heterozygosity, and FIS. Statistical significance for FIS was assessed using permutation tests with 10,000 randomizations of alleles among individuals, and false discovery rate correction for multiple tests [38]. Sequence diversity was estimated in DnaSP (version 6.12.03) [39] and includes the number of polymorphic sites (S), haplotype number (H), haplotype richness (Hd), nucleotide diversity (π), and the average number of nucleotide differences (k). We estimated genetic diversity at nuclear microsatellites and mtDNA sequence data for the total dataset and for each sex separately.
We used three complementary approaches to characterize population genetic structure, including Bayesian clustering methods in STRUCTURE [40] and BAPS [41], and the multivariate statistical technique principal coordinates analysis (PCoA). We ran STRUCTURE five times at each K for K = 1 to K = 12 with 50,000 burn-ins and 500,000 MCMC iterations and used CLUMPAK to compile and graphically represent the results [42]. We ran BAPS using the “spatial clustering of groups” option because we had samples with identical coordinates. We ran a PCoA in GenAlEx using a standardized covariance matrix. The presence of isolation by distance, in which allele frequencies vary gradually across a region, can confound population structure detection. We tested for isolation by distance using a Mantel test for correlation between genetic and geographic distance matrices in GenAlEx, excluding 62 samples without spatial coordinates.
Our sample set contained presumed mother-offspring (n = 25) and sibling pairs (n = 19; unknown as to whether full- or half-sibs). For population genetic analyses, we retained only one sample per family. However, these samples’ existence allows testing of our ability to detect relatives in our dataset using this panel of loci. We calculated pairwise kinship [43] in SpaGeDi for all pairs of individuals in the dataset, and for known mother-offspring and sibling pairs.
To better assess temporal changes in the confined population, we split the data by year. Individuals with known ages were replicated according to the years they were inferred as present in the population. For example, if a deer was captured in 1996 and harvested in 1998, it also was included in the 1997 dataset. Temporal analyses were restricted to the years 1992–2003, where sufficient sample sizes existed (n ≥ 20/year for microsatellite data and n ≥ 10/year for mtDNA data). We estimated genetic diversity for each year as described above. We also estimated relatedness using the Lynch and Ritland estimator [44] in GenAlEx, with significance assessed by 999 permutations.

3. Results

The final microsatellite dataset contained between 2 and 20 alleles per locus, with an average of 10.7 (SD = 5.79). Mean unbiased expected heterozygosity was 0.711 and mean observed heterozygosity was 0.674 (Table 1). The final mitochondrial sequence dataset contained 7 haplotypes with 61 segregating sites across 646-bp. Haplotype diversity (Hd) was 0.456 (SD = 0.037), nucleotide diversity (π) was 0.026 (SD = 0.002), and the average number of nucleotide differences between individuals (k) was 16.7. Both microsatellite and haplotype diversity were similar in males and females, and we observed no significant genetic differentiation between the sexes (microsatellite GST = 0.001, p = 0.2934; haplotype GST = 0.00650, p = 0.2873). Microsatellite diversity was nearly identical in both sexes (AR_Males = 10.00, AR_Females = 9.65; HE_Males = 0.708, HE_Females = 0.713), although haplotype diversity was slightly higher in males than females (HdMales = 0.534, HdFemales = 0.385); none of the differences were significant (pairwise t-tests, all p > 0.12).
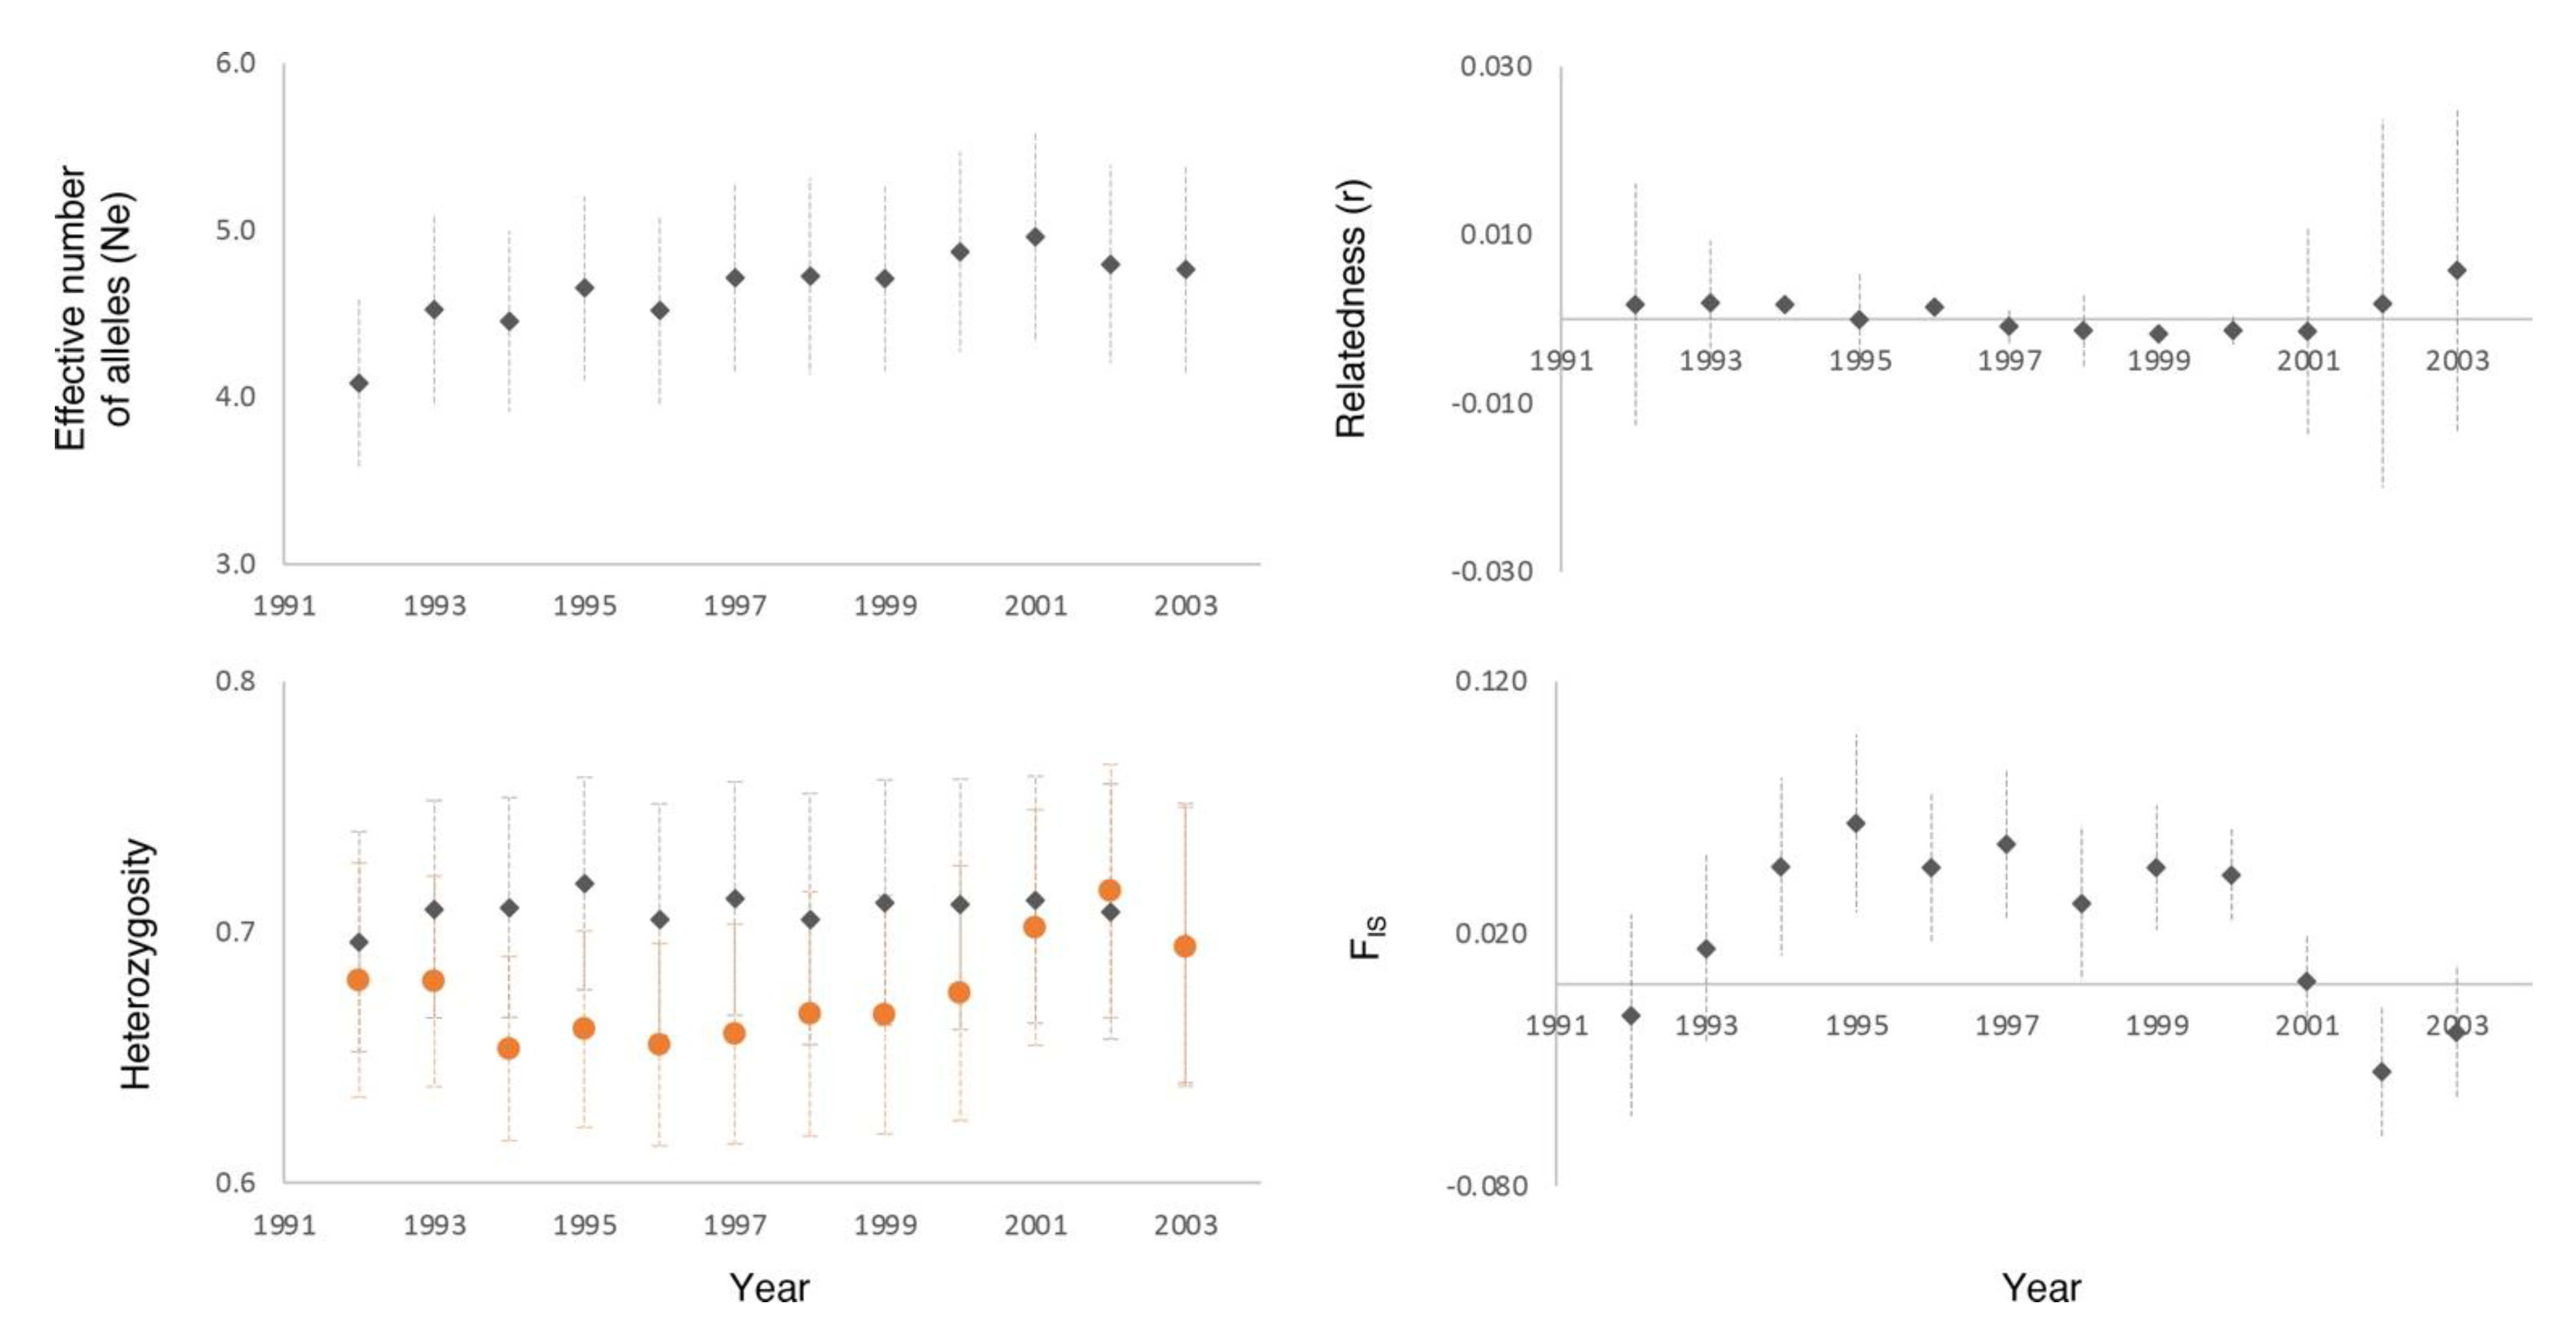
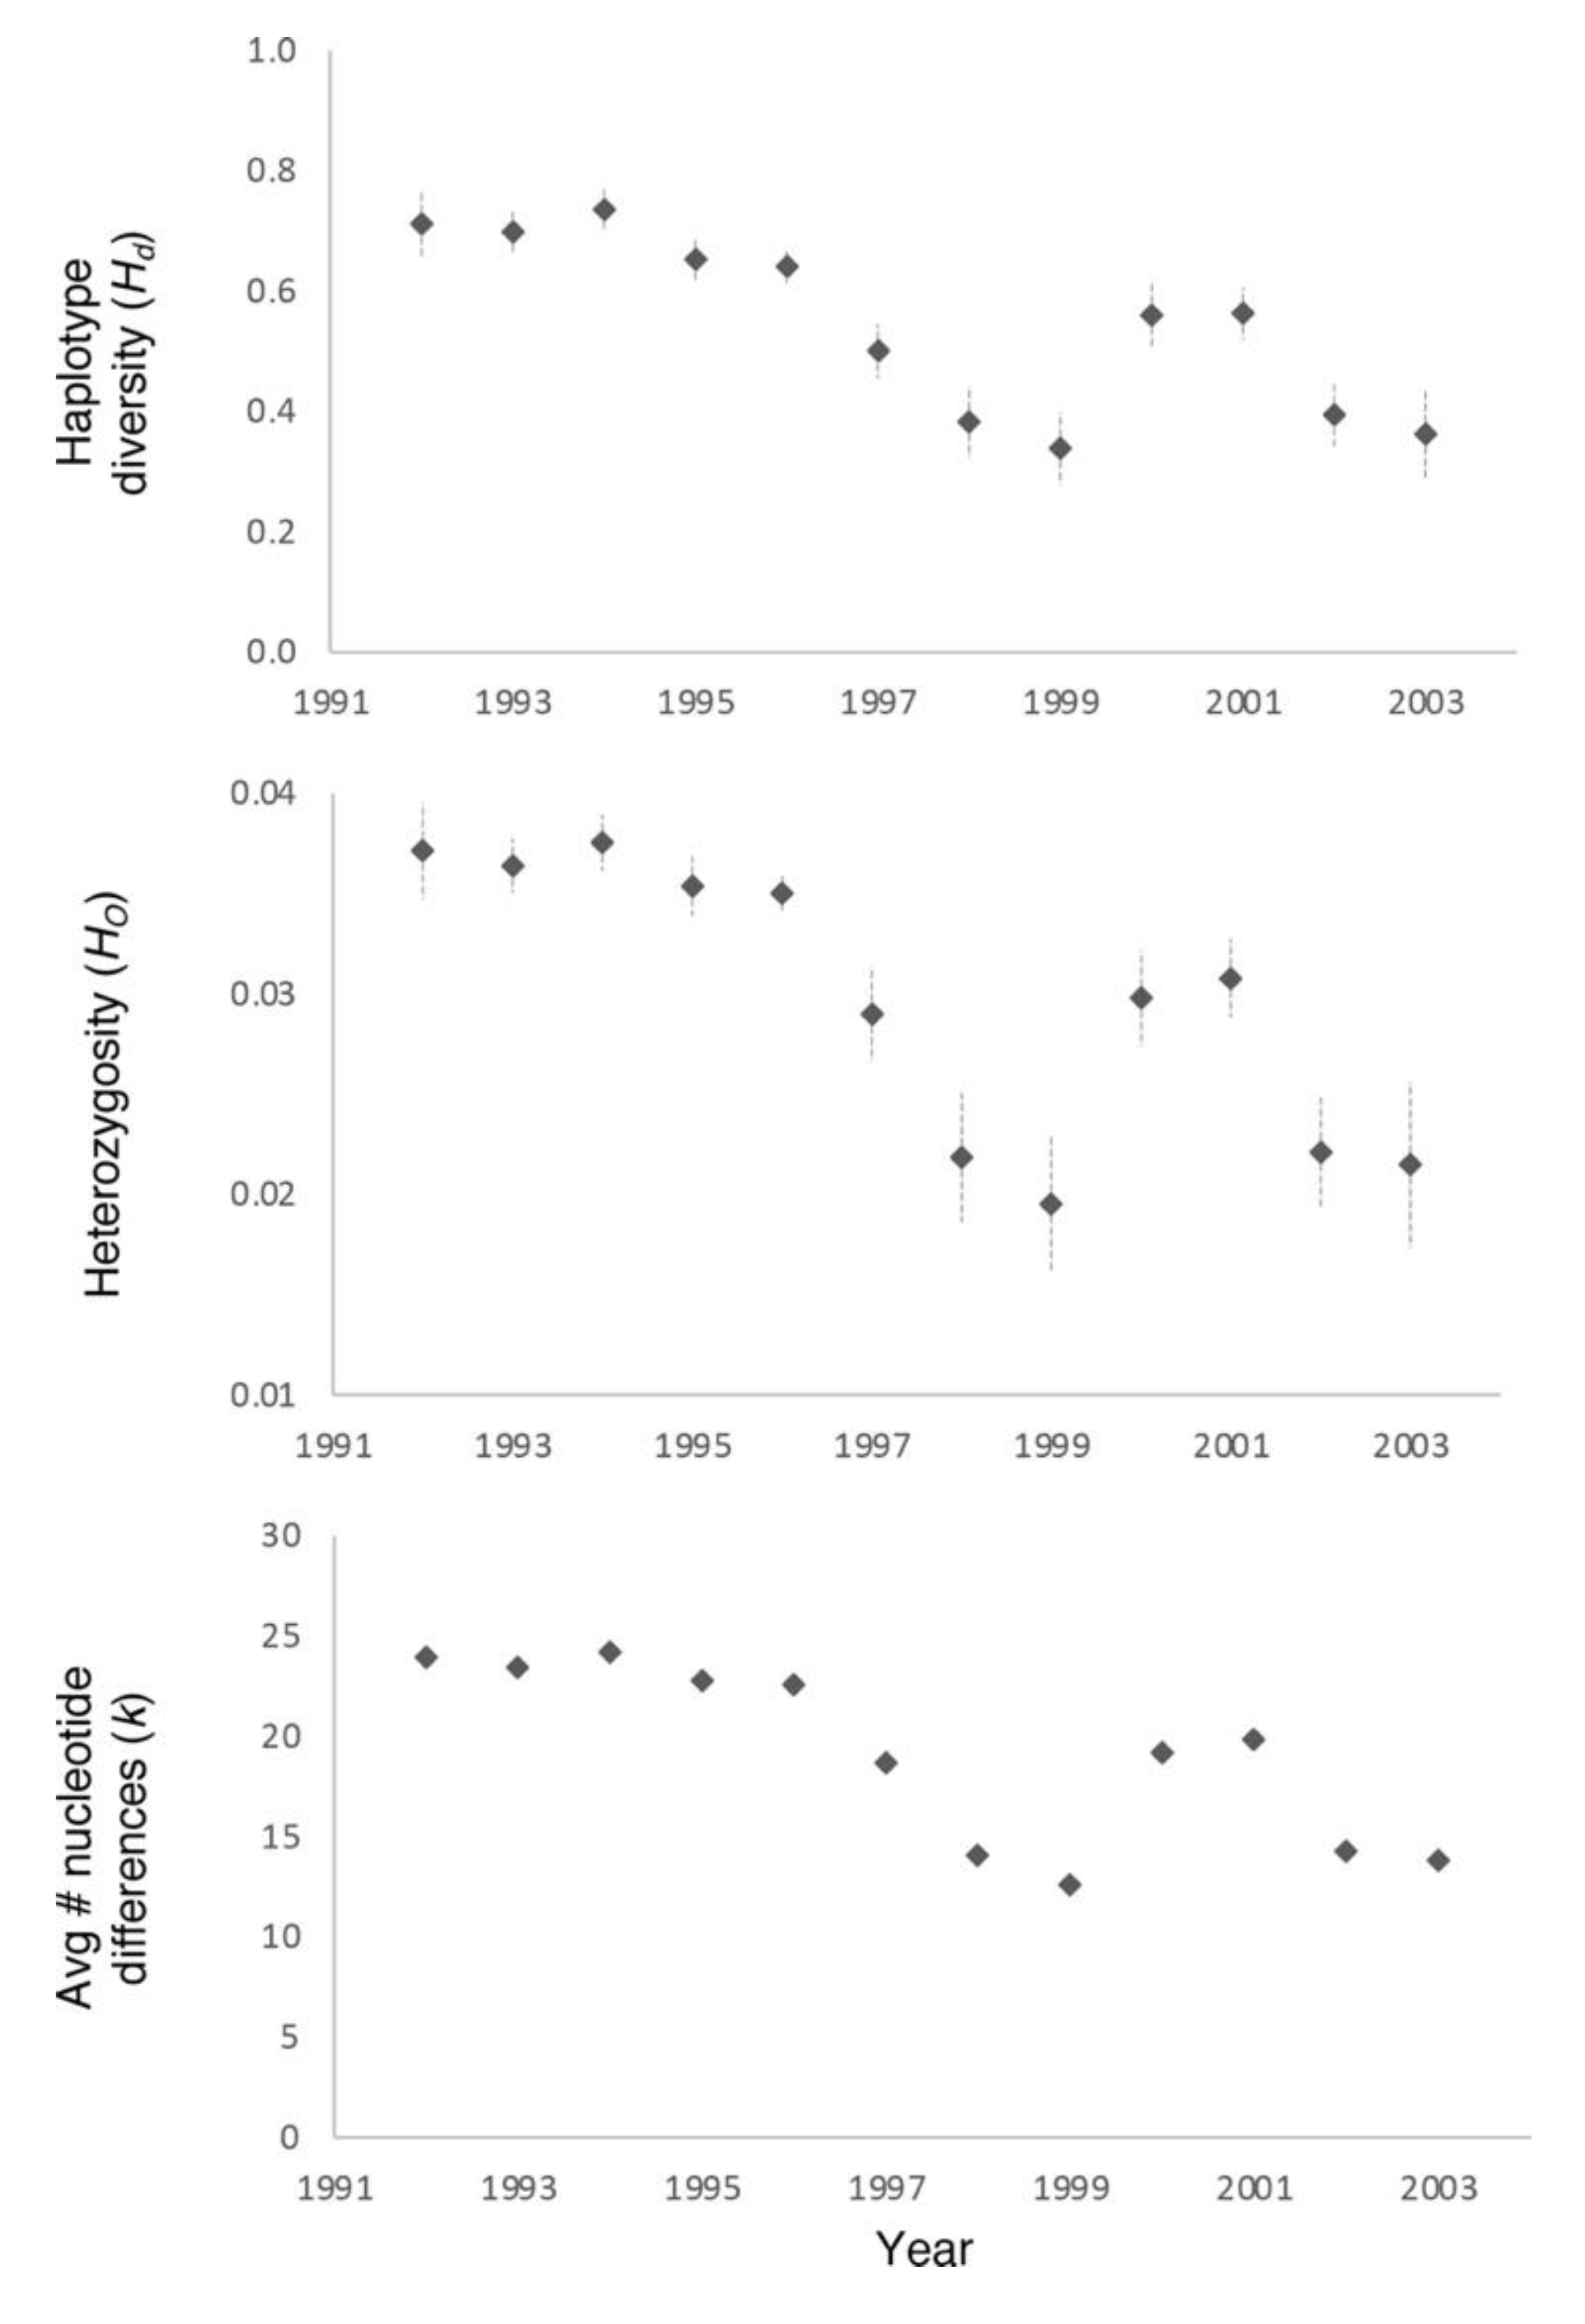
Population isolation is predicted to reduce genetic diversity over time. In this confined deer population, we did not observe any change in genetic diversity over the period 1992–2003 in the microsatellite data, regardless of the metric we used (Figure 2). Mitochondrial sequence data showed a decline in haplotype diversity across the study, with some recovery in the years 2000 and 2001 (Figure 3). Nucleotide diversity (π) and the average number of nucleotide differences between individuals (k) showed trends mirroring those observed in haplotype diversity, declining from 1992–1999, increasing in the years 2000 and 2001, and declining again in 2002–2003.
We observed an overall deficiency of heterozygotes relative to Hardy-Weinberg expectations. Though small, it was statistically significant (FIS = 0.052, p < 0.0001) and attributable to disequilibrium at 6 loci (Table 1). These 6 loci all exhibited a significant deficiency of heterozygotes (mean FIS for these 6 loci was 0.125). It is possible that these 6 loci exhibited null alleles, creating the observed global heterozygote deficiency. Three of the loci that exhibited heterozygote deficiencies in our dataset (N, BM6506, and D) were observed to have null alleles of >10% in [45], so it is possible that the global heterozygote deficiency we observed is at least partially attributable to the presence of null alleles at these three loci. However, we did not observe any evidence for null alleles in our dataset based on repeated genotypes and genotypes from the known mother-offspring pairs.
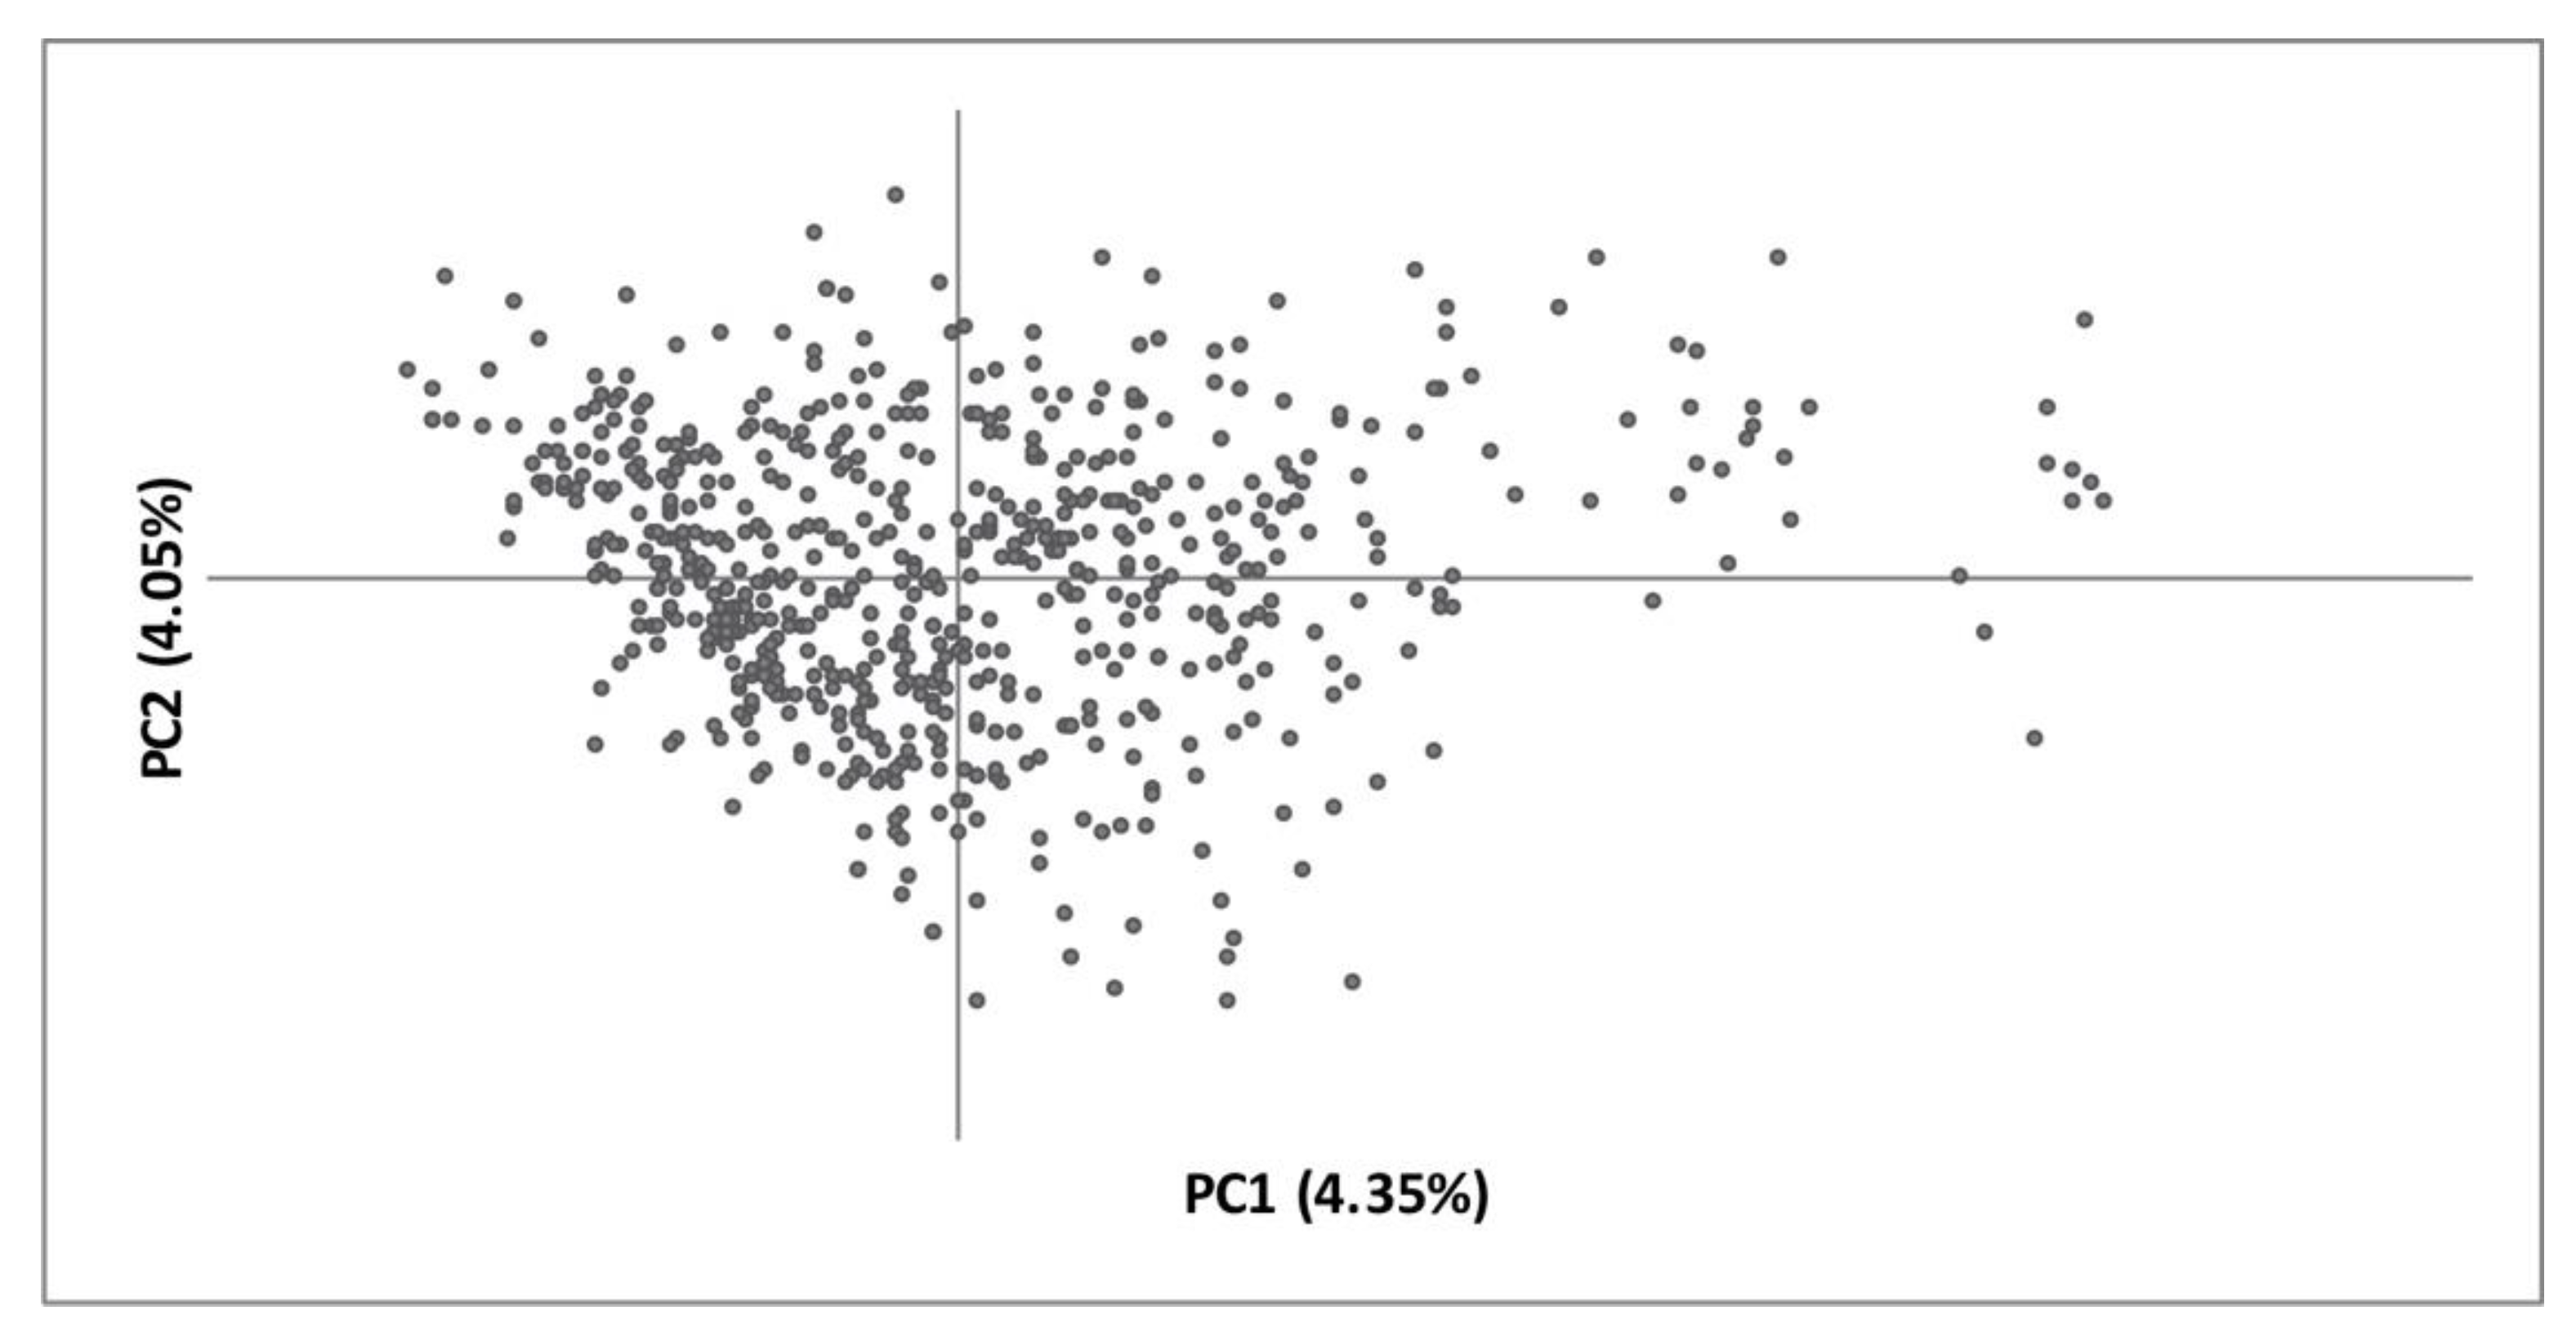
A global heterozygote deficiency could also result from cryptic population structure (Wahlund effect), inadvertent inclusion of related individuals in the dataset, or mating among relatives (inbreeding). Multiple, complementary approaches (STRUCTURE, BAPS, and PCoA) were used to evaluate the presence of cryptic population genetic structure that might explain the observed heterozygote deficiency. None of these methods revealed evidence of structure. STRUCTURE and BAPS indicated a single group, and PCoA revealed no discernable grouping of samples, with the first axis explaining only 4.35% of the variation (Figure 4). Likewise, there was no significant support for isolation by distance (R2 = 0.0002, p = 0.220), a pattern of genetic structure that can limit the power of clustering approaches [46].
The observed heterozygote deficiency also does not appear to be an artifact of sampling related individuals. Our sample contained known mother-offspring (n = 25) and sibling pairs (n = 19; unknown whether full- or half-sibs). Though we retained only one sample per family for all population genetic analyses, the estimated kinship between these mother-offspring (0.237, SD = 0.080) and sibling pairs (0.220, SD = 0.089) matches theoretical expectations (0.25 for parent-offspring and full-sibs, 0.125 for half-sibs). When we evaluated the remaining individuals in the dataset, we found no evidence that the presence of close relatives in the dataset was driving global heterozygote deficiencies (average kinship = 0.0000104, SD = 0.077). Taken together, these results suggest that either weak population structure exists but is too faint to be detected using clustering and ordination approaches [47] or that inbreeding is present in this population.
The inbreeding coefficient (FIS) was dynamic over time in contrast to genetic diversity, which remained stable. Mean pairwise relatedness also remained stable over time, and was not significantly different from zero in any year. We observed an increase in the inbreeding coefficient (FIS) early in the study (1992–1994), which remained elevated during the middle years (1995–2000) and then decreased (2001–2003) (Figure 2).

4. Discussion

Fences represent pervasive features on the landscape and are an important emerging issue for the conservation of global biodiversity [48], yet the full effects of fences remain understudied [3,4]. Fences are often effective for managing focal species but may unintentionally restrict movement. Restriction of movement, particularly immigration, may lead to isolation of populations, resulting in a loss of genetic diversity and accumulation of inbreeding whereby long-term population persistence may be affected. Despite the potential for isolation, our genetic diversity data support field observations of fence crossings [16] and suggest that the fence is not completely impermeable.
Overall, genetic diversity in the confined deer population is comparable to white-tailed deer populations in other parts of their range. This includes populations with no history of population size reductions [45,49,50,51] and populations that have undergone bottlenecks or founder events (e.g., through translocation or introductions) [31,52]. Genetic diversity of deer within our study population is considerably higher than in populations with known long-term isolation and small population sizes, such as Key deer (O. v. clavium) [53] and Columbian white-tailed deer (O. v. leucurus) [54]. Relatedness was also stable over the course of the study and hovered around zero (unrelated), consistent with estimates from both fenced and unfenced populations [49,55,56]. Levels of genetic variation that are high and comparable to wild populations with no history of size reduction or isolation suggest that, despite confinement, there is efficient long-term retention of genetic variability. Of course, rates of change in allele frequencies and overall heterozygosity relates to the number of migrants that successfully reproduce each generation, with genetic drift playing a role in isolated populations with small effective sizes. So, it is possible that the length of time that the population was confined may be too short for major genetic effects to be observed. Alternatively, genetic diversity in the confined population may be maintained by movement across the high-tensile electric fence [17]. Maintenance of genetic variation through high reproductive capacity and low-level gene flow across fences was also observed for white-tailed deer in a fenced urban metro-park, in particular when matrilineal groups remain intact [55].
Further support for the maintenance of genetic variation in our study population of deer comes from the temporal analysis of microsatellite diversity, which shows sustained levels of genetic diversity over time. In contrast, the mitochondrial sequence data show a conflicting pattern—a steady decline in diversity, mitigated by modest recovery in 2000. The increase in mitochondrial diversity in a confined population was unexpected. The most plausible explanation is an influx of new individuals with novel haplotypes, either females who would transmit novel haplotypes to their offspring, or males who would bring in new haplotypes transiently. This is a plausible explanation given the empirical evidence from GPS tracking and long-term tagging of white-tailed deer in the study area, which shows that GPS collared individuals left and returned to the study area, and tagged deer were harvested outside of the enclosure [16,17]. If deer are able to leave the study area through breaches in the fence [16], then it is just as conceivable that deer outside of the enclosure can find their way into the study population.
The presence of a global heterozygote deficiency suggests either weak and cryptic population genetic structure or mating between related individuals. Inbreeding is predicted to accumulate in isolated populations, where the number of individuals contributing to the next generation is limited [24]. We observed a steady increase in FIS following fence construction for three years, and values remained positive for 7 years. The increased inbreeding and excess of homozygosity is consistent with the hypothesized effect of confinement.
On the other hand, the decrease in FIS values from 2001–2003 was unexpected and might be caused by several factors. First, deer were sampled opportunistically, and it is possible that sampling bias exists across years. This explanation seems unlikely, as the number of deer collected in these years was high and similar to other years, and because the spatial distribution of samples was not different among years. Second, there might be accumulated weak spots (e.g., holes and water gaps) in the fence after several years of use, resulting in increased cross-fence movement [16] and thus decreased inbreeding and FIS. Mobile species have been found to continually patrol fence borders for breaks and can identify them quickly [21]. In this deer population, 80% of crossings were at or near a hole, water gap, or temporary non-electrified portion of the fence [16]. Third and most likely, the decreased FIS might reflect the restriction of harvest on males since 2000. Patterns of inbreeding accumulation that mirror changing hunting regulations suggests that hunting may affect genetic structure when populations are under confinement. White-tailed deer have a tending-bond mating system where there is a wide distribution of reproductive success among males without skew or individual dominance [57]. After male harvest was restricted, male survival increased markedly from 58% to 99% [17], which might lead directly to more diverse mating and contribute to the decreased inbreeding since 2001. Increased male survival after 2000 could also be a source of individuals contributing to the temporary increase in mtDNA diversity we observed.
In summary, our results of high genetic diversity indicate that gene flow, likely at a low level, is probably maintained between the confined and wild populations by occasional deer movements across the fence. Temporal changes in FIS indicate an increase in inbreeding shortly after confinement, which might be further driven by male harvest in the population, albeit limited, during 1993–2000. The restriction of male harvest after 2000 may have helped limit inbreeding and increase mtDNA diversity, albeit briefly. However, it is also likely that the 12-year temporal span is not long enough to detect a strong signal of genetic change in confined deer populations, and it is unknown if gene flow by cross-fence movement will be maintained despite fence repair or improvement. Continued data collection and analysis in this population can be used to measure genetic changes after a longer time of confinement and to include evaluations of other potential negative effects (e.g., restricted evolutionary potential) or effects on nontarget species [4,58] to better understand the cumulative impacts of fences. The impact of fences on infectious disease transmission between confined and unconfined populations e.g., [59,60] is particularly relevant to white-tailed deer, given the increasing occurrence of chronic wasting disease (CWD) and the importance of deer movement and spatial structure to transmission dynamics [50,61,62], though CWD is not currently found on or near this study site. Our genetic data agree with previous studies that the fence surrounding our study area has been so far effective, and protective for white-tailed deer population management [17], but we also highlight the statement by [58] that fences for conservation and management should be temporary and should avoid permanent changes to the landscape.

Author Contributions

Conceptualization, S.D., K.L.G., R.L.H., and R.A.G.; investigation, R.W.D., R.T., and R.A.G.; resources and funding, K.L.G., R.A.G., R.L.H., S.D., and S.L.W.; data curation, E.K.L., S.L.W., K.L.G., and R.A.G.; writing, E.K.L., S.L.W., and R.L.H.; formal analysis, E.K.L.; project administration, K.L.G., R.L.H., R.A.G., and S.D. All authors contributed to methodology and review, and all have read and agreed to the published version of the manuscript.

Funding

This research was funded by the Noble Research Institute, LLC (formerly the Samuel Roberts Noble Foundation).

Institutional Review Board Statement

The study was conducted according to the guidelines of the Mississippi State University Animal Care and Use Committee (protocol 98-033).

Data Availability Statement

The data used herein may be made available upon reasonable requests to the Noble Research Institute, LLC by contacting author SLW.

Acknowledgments

We thank J. Anderson for assistance with laboratory work and J. Holman for assistance with field work and sample collection. We appreciate the support of all personnel assisting during deer captures, and several anonymous reviewers for helpful comments on earlier manuscript drafts.

Conflicts of Interest

The authors declare no conflict of interest. The funders had no role in the design of the study; in the collection, analyses, or interpretation of data; in the writing of the manuscript, or in the decision to publish the results.

References

  1. Davis, R.; Williams, E. Fences and Between Fences: Cultural, Historical, and Smithsonian Perspectives. J. Southwest 2008, 50, 243–261. [Google Scholar] [CrossRef]
  2. Morris, L.R.; Rowe, R.J. Historical land use and altered habitats in the Great Basin. J. Mammal. 2014, 95, 1144–1156. [Google Scholar] [CrossRef] [Green Version]
  3. Jakes, A.F.; Jones, P.F.; Paige, L.C.; Seidler, R.G.; Huijser, M.P. A fence runs through it: A call for greater attention to the in-fluence of fences on wildlife and ecosystems. Biol. Conserv. 2018, 227, 310–318. [Google Scholar] [CrossRef]
  4. McInturff, A.; Xu, W.; Wilkinson, C.E.; Dejid, N.; Brashares, J.S. Fence Ecology: Frameworks for Understanding the Ecological Effects of Fences. Bioscience 2020, 70, 971–985. [Google Scholar] [CrossRef]
  5. Clevenger, A.P.; Chruszca, B.; Gunson, K.E. Highway mitigation fencing reduces wildlife-vehicle collisions. Wildl. Soc. Bull. 2001, 29, 646–653. [Google Scholar]
  6. Moseby, K.; Read, J. The efficacy of feral cat, fox and rabbit exclusion fence designs for threatened species protection. Biol. Conserv. 2006, 127, 429–437. [Google Scholar] [CrossRef]
  7. Mysterud, A.; Rolandsen, C.M. Fencing for wildlife disease control. J. Appl. Ecol. 2019, 56, 519–525. [Google Scholar] [CrossRef] [Green Version]
  8. Cornwall, W. To save caribou, Alberta wants to fence them in: Controversial proposal envisions the construction of a massive, predator-free pen. Science 2016, 353, 333. [Google Scholar] [CrossRef] [Green Version]
  9. Ezenwa, V.O. Parasite infection rates of impala (Aepyceros melampus) in fenced game reserves in relation to reserve charac-teristics. Biol. Conserv. 2004, 118, 397–401. [Google Scholar] [CrossRef]
  10. Ferguson, K.; Hanks, J. Fencing Impacts: A Review of the Environmental, Social, and Economic Impacts of Game and Veterinary Fencing in Africa with Particular Reference to the Great Limpopo and Kavango Zambezi Transfrontier Conservation Areas; University of Pretoria, Mammal Research Institute: Pretoria, Africa, 2010. [Google Scholar]
  11. Ferronato, B.O.; Roe, J.H.; Georges, A. Reptile bycatch in a pest-exclusion fence established for wildlife reintroductions. J. Nat. Conserv. 2014, 22, 577–585. [Google Scholar] [CrossRef]
  12. Pekor, A.; Miller, J.R.; Flyman, M.V.; Kasiki, S.; Kesch, M.K.; Miller, S.M.; Uiseb, K.; van der Merve, V.; Lindsey, P.A. Fencing Africa’s protected areas: Costs, benefits, and management issues. Biol. Conserv. 2019, 229, 67–75. [Google Scholar] [CrossRef] [Green Version]
  13. Laskin, D.N.; Watt, D.; Whittington, J.; Heuer, K. Designing a fence that enables free passage of wildlife while containing reintroduced bison: A multispecies evaluation. Wildl. Biol. 2020, 2020, 751. [Google Scholar] [CrossRef]
  14. Vercauteren, K.C.; Lavelle, M.J.; Hygnstrom, S.E. Fences and Deer-Damage Management: A Review of Designs and Efficacy. Wildl. Soc. Bull. 2006, 34, 191–200. [Google Scholar] [CrossRef]
  15. Nielsen, C.K.; Nelson, S.J.; Porter, W.F. Emigration of deer from a partial enclosure. Wildl. Soc. Bull. 1997, 25, 282–290. [Google Scholar]
  16. Webb, S.L.; Gee, K.L.; DeMarais, S.; Strickland, B.K.; Deyoung, R.W. Efficacy of a 15-Strand High-Tensile Electric Fence to Control White-tailed Deer Movements. Wildl. Biol. Pract. 2009, 5, 45–57. [Google Scholar] [CrossRef]
  17. Webb, S.L.; Gee, K.L.; Wang, G. Survival and fidelity of an enclosed white-tailed deer population using capture–recapture-reporting data. Popul. Ecol. 2009, 52, 81–88. [Google Scholar] [CrossRef]
  18. Webb, S.L.; Gee, K.L. Annual survival and site fidelity of free-ranging white-tailed deer (Odocoileus virginianus): Comparative demography before (1983–1992) and after (1993–2005) spatial confinement. Integr. Zool. 2014, 9, 24–33. [Google Scholar] [CrossRef]
  19. Ozoga, J.J.; Verme, L.J. Physical and Reproductive Characteristics of a Supplementally-Fed White-Tailed Deer Herd. J. Wildl. Manag. 1982, 46, 281. [Google Scholar] [CrossRef]
  20. Demarais, S.; DeYoung, R.W.; Lyon, L.J.; Williams, E.S.; Williamson, S.J.; Wolfe, G.J. Biological and social issues related to confinement of wild ungulates. Wildl. Soc. Tech. Rev. 2002, 2–3, 1–29. [Google Scholar]
  21. Connolly, T.A.; Day, T.D.; King, C.M. Estimating the potential for reinvasion by mammalian pests through pest-exclusion fencing. Wildl. Res. 2009, 36, 410–421. [Google Scholar] [CrossRef]
  22. Vanak, A.T.; Thaker, M.; Slotow, R. Do fences create an edge-effect on the movement patterns of a highly mobile mega-herbivore? Biol. Conserv. 2010, 143, 2631–2637. [Google Scholar] [CrossRef]
  23. Wright, S. Evolution in Mendelian Populations. Genetics 1931, 16, 97–159. [Google Scholar] [CrossRef] [PubMed]
  24. Keller, L.F.; Waller, D.M. Inbreeding effects in wild populations. Trends Ecol. Evol. 2002, 17, 230–241. [Google Scholar] [CrossRef]
  25. Falconer, D.S. Introduction to Quantitative Genetics, 2nd ed.; Longman Inc.: New York, NY, USA, 1981. [Google Scholar]
  26. Deyoung, R.W.; DeMarais, S.; Honeycutt, R.L.; Gee, K.L.; Gonzales, R.A. Social Dominance and Male Breeding Success in Captive White-Tailed Deer. Wildl. Soc. Bull. 2006, 34, 131–136. [Google Scholar] [CrossRef]
  27. Gee, K.L.; Porter, M.D.; Demarais, S.; Bryant, F.C.; Van Vreede, G. White-Tailed Deer: Their Foods and Management in the Cross Timbers, 2nd ed.; Samuel Roberts Noble Foundation: Ardmore, OK, USA, 1994. [Google Scholar]
  28. Webb, S.L.; Gee, K.L.; Deyoung, R.W.; Harju, S.M. Variance component analysis of body mass in a wild population of deer (Odocoileus virginianus): Results from two decades of research. Wildl. Res. 2013, 40, 588–598. [Google Scholar] [CrossRef] [Green Version]
  29. DeYoung, R.W. Effects of Social and Population Characteristics on the Reproductive Success of Male White-Tailed Deer. Ph.D. Thesis, Mississippi State University, Starkville, MI, USA, 2004. [Google Scholar]
  30. Anderson, J.D.; Honeycutt, R.L.; Gonzales, R.A.; Gee, K.L.; Skow, L.C.; Gallagher, R.L.; Honeycutt, D.A.; Deyoung, R.W. Development of Microsatellite DNA Markers for the Automated Genetic Characterization of White-Tailed Deer Populations. J. Wildl. Manag. 2002, 66, 67. [Google Scholar] [CrossRef]
  31. DeYoung, R.W.; Demarais, S.; Honeycutt, R.L.; Gonzales, R.A.; Gee, K.L.; Anderson, J.D. Evaluation of a DNA microsatellite panel useful for genetic exclusion studies in white-tailed deer. Wildl. Soc. Bull. 2003, 31, 220–232. [Google Scholar]
  32. Lischer, H.E.L.; Excoffier, L. PGDSpider: An automated data conversion tool for connecting population genetics and genomics programs. Bioinformatics 2011, 28, 298–299. [Google Scholar] [CrossRef] [Green Version]
  33. Bickham, J.W.; Patton, J.C.; Loughlin, T.R. High Variability for Control-Region Sequences in a Marine Mammal: Implications for Conservation and Biogeography of Steller Sea Lions (Eumetopias jubatus). J. Mammal. 1996, 77, 95–108. [Google Scholar] [CrossRef] [Green Version]
  34. Thompson, J.D.; Gibson, T.J.; Plewniak, F.; Jeanmougin, F.; Higgins, D.G. The CLUSTAL_X windows interface: Flexible strategies for multiple sequence alignment aided by quality analysis tools. Nucleic Acids Res. 1997, 24, 4876–4882. [Google Scholar] [CrossRef] [Green Version]
  35. Peakall, R.; Smouse, P.E. Genalex 6: Genetic analysis in Excel. Population genetic software for teaching and research. Mol. Ecol. Notes 2006, 6, 288–295. [Google Scholar] [CrossRef]
  36. Peakall, R.; Smouse, P.E. GenAlEx 6.5: Genetic analysis in Excel. Population genetic software for teaching and research-An update. Bioinformatics 2012, 28, 2537–2539. [Google Scholar] [CrossRef] [PubMed] [Green Version]
  37. Hardy, O.J.; Vekemans, X. SPAGeDi: A versatile computer program to analyse spatial genetic structure at the individual or population levels. Mol. Ecol. Notes 2002, 2, 618–620. [Google Scholar] [CrossRef] [Green Version]
  38. Benjamini, Y.; Hochberg, Y. Controlling the false discovery rate: A practical and powerful approach to multiple testing. J Royal Stat. Soc. B 1995, 57, 289–300. [Google Scholar] [CrossRef]
  39. Rozas, J.; Mata, F.A.; Del Barrio, S.J.C.; Rico, G.S.; Librado, P.; Onsins, R.S.E.; Gracia, S.A. DnaSP 6: DNA sequence polymorphism analysis of large datasets. Mol. Biol. Evol. 2017, 34, 3299–3302. [Google Scholar] [CrossRef]
  40. Pritchard, J.K.; Stephens, M.; Donnelly, P. Inference of population structure using multilocus genotype data. Genetics 2000, 155, 945–959. [Google Scholar]
  41. Corander, J.; Waldmann, P.; Sillanpää, M.J. Bayesian analysis of genetic differentiation between populations. Genetics 2003, 163, 367–374. [Google Scholar]
  42. Kopelman, N.M.; Mayzel, J.; Jakobsson, M.; Rosenberg, N.A.; Mayrose, I. Clumpak: A program for identifying clustering modes and packaging population structure inferences across K. Mol. Ecol. Resour. 2015, 15, 1179–1191. [Google Scholar] [CrossRef] [Green Version]
  43. Loiselle, B.A.; Sork, V.L.; Nason, J.; Graham, C. Spatial genetic structure of a tropical understory shrub, Psychotria officinalis (Rubiaceae). Am. J. Bot. 1995, 82, 1420–1425. [Google Scholar] [CrossRef]
  44. Lynch, M.; Ritland, K. Estimation of pairwise relatedness with molecular markers. Genetetics 1999, 152, 1753–1766. [Google Scholar]
  45. Miller, W.L.; Edson, J.; Pietrandrea, P.; Butterworth, M.C.; Walter, W.D. Identification and evaluation of a core microsatellite panel for use in white-tailed deer (Odocoileus virginianus). BMC Genet. 2019, 20, 49. [Google Scholar] [CrossRef] [PubMed]
  46. Schwartz, M.K.; McKelvey, K.S. Why sampling scheme matters: The effect of sampling scheme on landscape genetic results. Conserv. Genet. 2009, 10, 441–452. [Google Scholar] [CrossRef]
  47. Latch, E.K.; Dharmarajan, G.; Glaubitz, J.C.; Rhodes, O.E. Relative performance of Bayesian clustering software for inferring population substructure and individual assignment at low levels of population differentiation. Conserv. Genet. 2006, 7, 295–302. [Google Scholar] [CrossRef]
  48. Sutherland, W.J.; Barnard, P.; Broad, S.; Clout, M.; Connor, B.; Côté, I.M.; Dicks, L.V.; Doran, H.; Entwistle, A.C.; Fleishman, E.; et al. A 2017 Horizon Scan of Emerging Issues for Global Conservation and Biological Diversity. Trends Ecol. Evol. 2017, 32, 31–40. [Google Scholar] [CrossRef] [PubMed] [Green Version]
  49. Miller, B.F.; De Young, R.W.; Campbell, T.A.; Laseter, B.R.; Ford, W.M.; Miller, K.V. Fine-scale genetic and social structuring in a central Appalachian white-tailed deer herd. J. Mammal. 2010, 91, 681–689. [Google Scholar] [CrossRef] [Green Version]
  50. Cullingham, C.I.; Merrill, E.H.; Pybus, M.J.; Bollinger, T.K.; Wilson, G.A.; Coltman, D.W. Broad and fine-scale genetic analysis of white-tailed deer populations: Estimating the relative risk of chronic wasting disease spread. Evol. Appl. 2010, 4, 116–131. [Google Scholar] [CrossRef]
  51. De La Reyna, R.X.F.; Lobato, C.R.D.; Bracamonte, P.G.M.; Rincón, S.A.M.; Deyoung, R.W.; León, F.J.G.D.; Vera, A.W. Genetic diversity and structure among subspecies of white-tailed deer in Mexico. J. Mammal. 2012, 93, 1158–1168. [Google Scholar] [CrossRef] [Green Version]
  52. Kekkonen, J.; Wikström, M.; Brommer, J.E. Heterozygosity in an isolated population of a large mammal founded by four indi-viduals is predicted by an individual-based genetic model. PLoS ONE 2012, 7, 43482. [Google Scholar] [CrossRef] [PubMed] [Green Version]
  53. Villanova, V.L.; Hughes, P.T.; Hoffman, E.A. Combining genetic structure and demographic analyses to estimate persistence in endangered Key deer (Odocoileus virginianus clavium). Conserv. Genet. 2017, 18, 1061–1076. [Google Scholar] [CrossRef]
  54. Hopken, M.W.; Lum, T.M.; Meyers, P.M.; Piaggio, A.J. Molecular assessment of translocation and management of an endan-gered subspecies of white-tailed deer (Odocoileus virginianus). Conserv. Genet. 2015, 16, 635–647. [Google Scholar] [CrossRef] [Green Version]
  55. Blanchong, J.A.; Sorin, A.B.; Scribner, K.T. Genetic diversity and population structure in urban white-tailed deer. J. Wildl. Manag. 2013, 77, 855–862. [Google Scholar] [CrossRef]
  56. Webb, S.L.; DeYoung, R.W.; Demarais, S.; Strickland, B.K.; Gee, K.L. Testing a local inbreeding hypothesis as a cause of ob-served antler characteristics in managed populations of white-tailed deer. Diversity 2021, 13, 116. [Google Scholar] [CrossRef]
  57. Deyoung, R.W.; DeMarais, S.; Gee, K.L.; Honeycutt, R.L.; Hellickson, M.W.; Gonzales, R.A. Molecular Evaluation of the White-tailed Deer (Odocoileus Virginianus) Mating System. J. Mammal. 2009, 90, 946–953. [Google Scholar] [CrossRef] [Green Version]
  58. Hayward, M.W.; Kerley, G.I.H. Fencing for conservation: Restriction of evolutionary potential or a riposte to threatening processes? Biol. Conserv. 2009, 142, 1–13. [Google Scholar] [CrossRef]
  59. Vercauteren, K.C.; Lavelle, M.J.; Seward, N.W.; Fischer, J.W.; Phillips, G.E. Fence-Line Contact Between Wild and Farmed White-Tailed Deer in Michigan: Potential for Disease Transmission. J. Wildl. Manag. 2007, 71, 1603–1606. [Google Scholar] [CrossRef] [Green Version]
  60. Vercauteren, K.C.; Lavelle, M.J.; Seward, N.W.; Fischer, J.W.; Phillips, G.E. Fence-line contact between wild and farmed white-tailed deer in Colorado: Potential for disease transmission. J. Wildl. Manag. 2007, 71, 1594–1602. [Google Scholar] [CrossRef]
  61. Grear, D.A.; Samuel, M.D.; Scribner, K.T.; Weckworth, B.V.; Langenberg, J.A. Influence of genetic relatedness and spatial proximity on chronic wasting disease infection among female white-tailed deer. J. Appl. Ecol. 2010, 47, 532–540. [Google Scholar] [CrossRef]
  62. Magle, S.B.; Samuel, M.D.; Van Deelen, T.R.; Robinson, S.J.; Mathews, N.E. Evaluating Spatial Overlap and Relatedness of White-tailed Deer in a Chronic Wasting Disease Management Zone. PLoS ONE 2013, 8, e56568. [Google Scholar] [CrossRef] [Green Version]
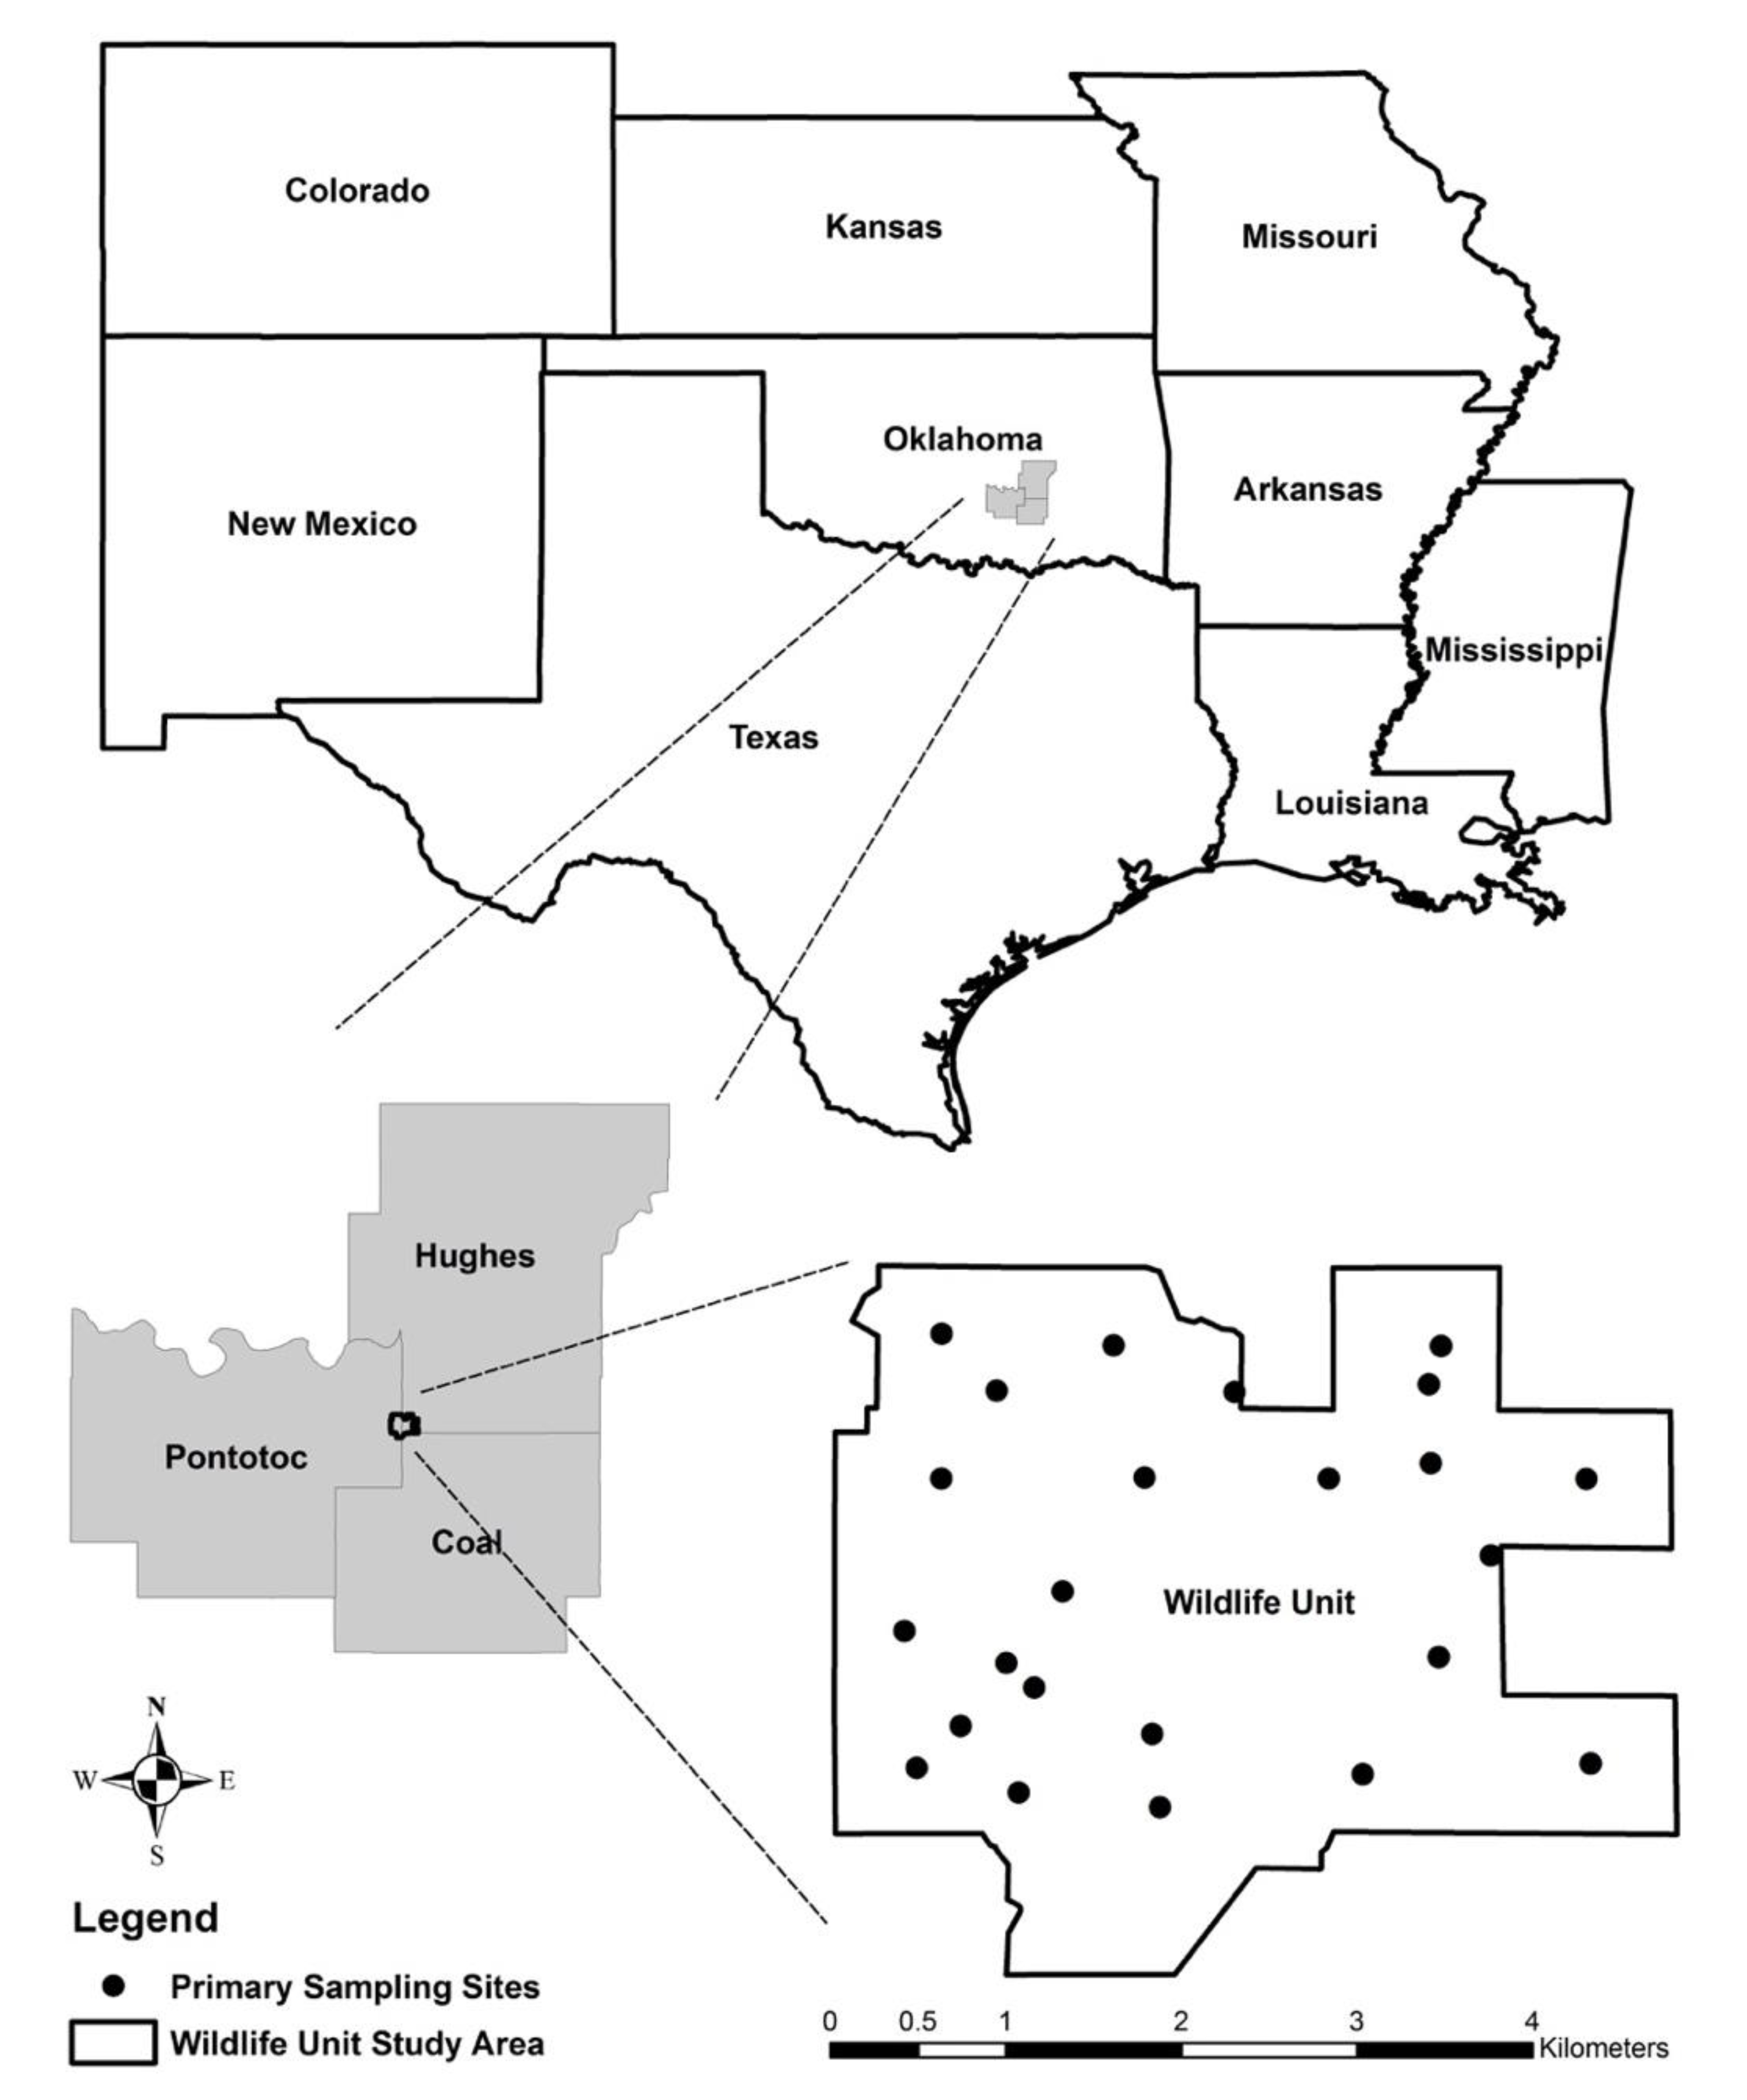
Figure 1. Sampling map of white-tailed deer confined population in Oklahoma. Sampling locations within the study area are designated; each symbol can represent multiple individuals sampled at that location.
Diversity 13 00126 g001
Figure 2. Genetic diversity over time, based on 17 microsatellite loci. The effective number of alleles (Ne, top-left panel), observed heterozygosity (HO, bottom-left panel, orange circles) and expected heterozygosity (HE, bottom-left panel, gray triangles), and relatedness (r, top-right panel) are constant over time. Wright’s inbreeding coefficient (FIS, lower-right panel) shows a significant deficiency of heterozygotes (positive FIS) during the years 1994–2000.
Diversity 13 00126 g002
Figure 3. Genetic diversity over time, based on 646-bp of sequence from the mitochondrial control region. Haplotype diversity (Hd, top panel), observed heterozygosity (HO, middle panel), and the average number of nucleotide differences (k, lower panel) all show a similar pattern of decreasing variation over time, punctuated by an increase in 2000–2001.
Diversity 13 00126 g003
Figure 4. Principal coordinates analysis shows a lack of genetic structure in this confined deer population (n = 640). The first two axes explain 4.35% and 4.05% of the total genetic variance.
Diversity 13 00126 g004
Table 1. Locus-specific genetic diversity estimates for n = 640 deer in the total population. Allelic richness (AR), observed heterozygosity (HO), unbiased expected heterozygosity (HE), and Wright’s inbreeding coefficient (FIS) are provided. Significance of FIS is given using permutation tests with 10,000 randomizations of gene copies among individuals; significant values in bold.
LocusARHOHEFISPval(FIS 0)
BovPRL2.000.3090.294−0.0530.187
Cervid114.810.8680.867−0.0020.896
ILSTS0119.980.7750.8440.0820
INRA0115.990.6760.667−0.0130.581
N19.170.7630.8710.1240
Q19.380.8100.8410.0370.020
BL254.000.4980.5300.0590.053
BM643812.790.6570.8170.1950
BM84812.820.8160.8430.0320.061
K3.990.4170.394−0.0590.116
O6.720.5310.5430.0230.425
BM420820.000.9000.9060.0070.616
BM650610.570.7120.8060.1160
D12.750.7450.8180.0890
OarFCB13.760.8460.806−0.0510.004
P9.960.6970.8160.1460
R3.000.4420.430−0.0270.505
Mean10.690.6740.7110.0520
Publisher’s Note: MDPI stays neutral with regard to jurisdictional claims in published maps and institutional affiliations.