Article

Implications of Historical and Contemporary Processes on Genetic Differentiation of a Declining Boreal Songbird: The Rusty Blackbird

by
Robert E. Wilson
1,*,
Steven M. Matsuoka
1,
Luke L. Powell
2,3,4,5,
James A. Johnson
6,
Dean W. Demarest
7,
Diana Stralberg
8,9 and
Sarah A. Sonsthagen
1
1
U.S. Geological Survey, Alaska Science Center, Anchorage, AK 99508, USA
2
Institute of Animal Health and Comparative Medicine, University of Glasgow, Glasgow G12 8QQ, UK
3
Department of Biosciences, Durham University, Stockton Road, Durham DH13LE, UK
4
Biodiversity Initiative, Houghton, MI 49931, USA
5
Smithsonian Conservation Biology Institute, National Zoological Park, Migratory Bird Center, Washington, DC 20013-7012, USA
6
United States Fish and Wildlife Service, Migratory Bird Management, Anchorage, AK 99503, USA
7
United States Fish and Wildlife Service, Division of Migratory Birds, Atlanta, GA 30345, USA
8
Department of Renewable Resources, University of Alberta, Edmonton, AB T6G 2H1, Canada
9
Natural Resources Canada, Canadian Forest Service, Northern Forestry Centre, Edmonton, AB T6H 3S5, Canada
*
Author to whom correspondence should be addressed.
Diversity 2021, 13(3), 103; https://doi.org/10.3390/d13030103
Submission received: 9 February 2021 / Revised: 16 February 2021 / Accepted: 16 February 2021 / Published: 25 February 2021
(This article belongs to the Special Issue Boreal Bird Ecology, Management and Conservation)

Abstract

:
The arrangement of habitat features via historical or contemporary events can strongly influence genomic and demographic connectivity, and in turn affect levels of genetic diversity and resilience of populations to environmental perturbation. The rusty blackbird (Euphagus carolinus) is a forested wetland habitat specialist whose population size has declined sharply (78%) over recent decades. The species breeds across the expansive North American boreal forest region, which contains a mosaic of habitat conditions resulting from active natural disturbance regimes and glacial history. We used landscape genomics to evaluate how past and present landscape features have shaped patterns of genetic diversity and connectivity across the species’ breeding range. Based on reduced-representation genomic and mitochondrial DNA, genetic structure followed four broad patterns influenced by both historical and contemporary forces: (1) an east–west partition consistent with vicariance during the last glacial maximum; (2) a potential secondary contact zone between eastern and western lineages at James Bay, Ontario; (3) insular differentiation of birds on Newfoundland; and (4) restricted regional gene flow among locales within western and eastern North America. The presence of genomic structure and therefore restricted dispersal among populations may limit the species’ capacity to respond to rapid environmental change.

1. Introduction

The spatial organization of suitable habitat across the landscape via historical and contemporary events plays an important role in the maintenance of both genetic and demographic connectivity within plant or animal populations. Discontinuities in habitat, whether from physical barriers or from natural or anthropogenic disturbances, fragment populations into smaller units and can diminish levels of connectivity when (1) the distance between suitable habitat patches exceeds the dispersal capacity of individuals or (2) dispersing individuals do not successfully reproduce. In this way, spatial habitat heterogeneity influences effective dispersal (dispersal followed by reproduction) by individuals, which in turn impacts gene flow and population dynamics (i.e., potential outcome of dispersal, [1,2]). Isolation, whether by distance or environment, often results in lower levels of intra-population genetic variation and higher levels of inter-population genetic differentiation across a species’ range, which can have major short- and long-term implications on population persistence. For example, isolated populations with reduced genetic diversity may lose adaptive potential, accumulate deleterious mutations, or experience increased inbreeding [3,4,5,6,7]—all of which can reduce individual fitness and increase vulnerability of populations to decline and extirpation [8,9,10].
While habitat configuration can have a profound influence on population structure and dynamics, species-specific responses to habitat heterogeneity vary widely due to differences in life history characteristics [11]. In some species, reduced connectivity among habitats may be offset by either high dispersal capabilities [12,13] or the presence of relatively continuous habitat during critical parts of the annual cycle that promote genetic exchange (e.g., mating). Even in highly vagile migratory species, however, habitat fragmentation and availability can contribute to genetic differentiation [14,15]. Thus, the capacity to move may be insufficient alone to offset the negative effects of habitat loss. Effective dispersal (i.e., with reproduction) can have a stronger effect on population demographics than the dispersal event alone [16,17,18]. Because of this, conservation strategies may need to promote site conditions favorable for successful reproduction in addition to general landscape connectivity, as gene flow is essential for population persistence in a changing environment [16,17,18]. However, determining the effective outcome of dispersal events is often difficult or nearly impossible with banding or telemetry data alone as neither can directly infer successful reproduction. Genetic signatures can provide insights into the success of natal dispersal and connectivity among breeding areas, which are relevant to the conservation of populations. Population genomics can help identify areas where connectivity across the landscape enriches genetic diversity and enhances the resiliency of populations to environmental perturbation. It can also identify where contemporary or historical limitations in dispersal have led to genomic structuring and distinct populations that may require specific management strategies to remain viable. Thus, population genomics provides a powerful approach to understanding implications of dispersal and can fill information gaps in traditional movement data, especially in migratory birds that nest in remote regions (see references within [15]) such as the vast boreal forest biome of North America.
North America’s boreal forest biome contains ≥ 25% of the world’s wetlands and intact forests [19,20], which provide important habitats to over 300 bird species during the breeding season [21]. While migratory songbirds across North American have undergone concerning population declines, boreal nesting species have exhibited some of the most dramatic declines over the past half century [22,23]. Rusty blackbirds (Euphagus carolinus) are an unfortunate example of this pattern; since 1966 the global population size is estimated to have decreased by 78% [23,24], with the decline likely ongoing since the late 19th century [25,26]. Loss of wooded wetlands on the wintering grounds in the southern United States is suspected as a principal driver of these declines [27]. However, methylmercury contamination on the breeding grounds [28,29,30], conversion of wetland habitats used during migration [31], alteration of boreal wetland breeding habitats, and climate change are also likely contributing factors [27,32,33].
Little is known regarding patterns of genomic connectivity and differentiation among nesting areas of rusty blackbirds, owing to their expansive and remote distribution spanning the boreal forest biome from Alaska eastward to Newfoundland and northern New England. However, banding, migration tracking, and stable-isotope analyses indicate a general migratory divide. Rusty blackbirds nesting in Alaska and western Canada migrate west of the Appalachian Mountains to winter in the Mississippi Alluvial Valley, while birds nesting in eastern Canada and the northeastern United States migrate east of the Appalachian Mountains and winter on the Southeastern Coastal Plain [34,35,36]. There have been no phylogenetic studies on the species to date, but birds breeding on Newfoundland and Magdelen Islands, Quebec and wintering in South Carolina have been described as a putative subspecies (E. c. nigrans) that is phenotypically distinct from the nominate form breeding over the remainder of the range [37].
Here we present a landscape genomic approach to examine the influence of historical (Last Glacial Maximum, LGM) and contemporary processes on patterns of diversity within the rusty blackbird, using reduced representation genomic (double-digest restriction-site associated DNA sequences, ddRAD; biparentally inherited) and mitochondrial DNA data (mtDNA, maternally inherited). Much of the present-day geographic extent of the Nearctic boreal biome was covered by ice sheets during the LGM ~20,000 years ago. Consequently, the post-glacial colonization of the region by flora and fauna expanding their ranges from south of ice sheets or from ice-free glacial refugia such as Alaska (Beringia) and the Atlantic Shelf [38] has influenced how genetic diversity within species is arrayed across boreal landscapes (e.g., [39,40,41,42]). Within glacial refugia, populations that diverged in isolation during the LGM generally harbor greater levels of genetic diversity than populations in areas recolonized after glacial retreat, except in areas where lineages from separate refugia intermixed [43]. As the present-day distribution of rusty blackbirds spans the entire North American boreal biome including previously glaciated and unglaciated areas, we hypothesize that (1) rusty blackbirds likely contracted to at least two refugia during the LGM as suggested for other avifauna (e.g., [44]). Further, we hypothesize that (2) the putative subspecies of rusty blackbird (E. c. nigrans, [37]) residing on the island of Newfoundland would be differentiated from eastern populations on the mainland through insular isolation, LGM isolation in the Atlantic Shelf refugium, or isolation through other physical barriers (e.g., [45,46]).
Just as the repeated glacial and interglacial cycles of the 2.5 million-year Pleistocene epoch were a powerful force shaping patterns of genetic diversity in boreal forest birds [47], contemporary genetic diversity and structure are also dependent on behavioral and biological aspects of individual species [48] that influence their capacity to move across the landscape [49,50]. Indeed, interpopulation variation in dispersal traits is often related to landscape structure (see [51]). The boreal biome is a mosaic of wetland complexes, upland forests, and montane areas and therefore comprises a naturally fragmented landscape for wetland habitat specialists, such as the rusty blackbird [52]. Although rusty blackbirds are able to move long distances and traverse large gaps in suitable habitat during migration (e.g., Lake Erie, [31], western cordillera, [53]), the broad level migratory connectivity observed [35] may equate to some degree of philopatry within each region (i.e., return to natal area to reproduce). We therefore hypothesize that (3) rusty blackbirds will display genetic structure within western and eastern North America.

2. Materials and Methods

2.1. Sampling and DNA Extraction

Blood was sampled from 205 rusty blackbirds captured from 5 May to 15 July 2009–2018 in mist nets placed near their nests or in post-breeding foraging areas across their breeding range (Figure 1, see Table 1 for sample sizes and locality names). Genomic DNA was extracted using a DNeasy Blood and Tissue kit following the manufacturer’s protocols (Qiagen, Valencia, CA, USA). Extractions were quantified using a Broad Range Quant-iT dsDNA Assay Kit (Thermo Fisher Scientific, Inc., Waltham, MA USA).

2.2. ddRAD-seq Library Preparation

Sample preparation for ddRAD sequencing followed the double-digest protocol outlined in DaCosta and Sorenson [54]. Genomic DNA (~1 μg) was digested with high fidelity versions of SbfI and EcoRI restriction enzymes (New England Biolabs, Ipswich, MA, USA). Amplification and sequencing adapters containing unique barcode or index sequences were ligated to the sticky ends generated by the restriction enzymes. Libraries were size selected using gel electrophoresis (size range 300–450 bp) and purified using a MinElute Gel Extraction Kit (Qiagen) following the manufacturer’s protocol. Size-selected fragments were amplified with Phusion high-fidelity DNA polymerase (Thermo Scientific, Pittsburgh, PA, USA) for 20 cycles, and purified using AMPure XP beads (Beckman Coulter, Inc., Indianapolis, IN, USA). Libraries were pooled in equimolar amounts determined via quantitative PCR (KAPA Biosystems, Wilmington, MA, USA). Single-end (150 bp) sequencing was completed on an Illumina HiSeq 4000 at the University of Oregon Core Genomics Facility. Raw Illumina reads are accessioned on National Center for Biotechnology Information (NCBI) Sequence Read Archive (BioProject PRJNA699594, Biosample accessions: SAMN17803887-SAMN17804091, see [55] for additional sample information).

2.3. Bioinformatics

Illumina reads were demultiplexed at the core facility and processed using the computational pipeline described by DaCosta and Sorenson ([54], custom Python scripts [56]). Briefly, the pipeline filters and clusters reads into putative loci based on sequence similarity (85%) using custom scripts and the uclust function in usearch v.5 [57]. Genomic positions of loci were determined by BLAST analysis [58] to the Taeniopygia guttata (Zebra Finch GenBank assembly reference GCA_003957565.1) reference genome. muscle v.3 [59] was used to align the reads within each cluster with genotyping of samples completed through custom scripts (See [60]). Genotypes were scored homozygous if > 93% of sequence reads were consistent with a single haplotype, whereas heterozygotes were scored if a second haplotype was represented by at least 29% of the reads, or if a second haplotype was represented by 20–29% of reads and the haplotype was present in other individuals. Loci were also “flagged” if the number of single-nucleotide polymorphisms (SNPs) was > 10, and if > 3 SNPs showed strong linkage. Alignments were visually inspected in Geneious (Biomatters Inc. San Francisco, CA), which allowed us to retain loci with insertion/deletions or high levels of polymorphism. To limit any biases due to sequencing error and/or allelic dropout, a minimum of 10 total reads was required to score a genotype as heterozygous with alleles with less than 5X coverage were scored as missing. Loci with a median depth of 10 per individual, < 10% missing genotypes, and < 10% flagged genotypes across all individuals were retained for downstream analyses.
Finally, autosomal and Z chromosome-linked loci were identified as described in Lavretsky et al. [60], with assignments based on differences in sequencing depth and homozygosity between males and females. Chromosomal positions across loci were attained by using blastn results against the Taeniopygia guttata reference genome from previous steps in the bioinformatic pipeline. These positions were used to verify marker type based on sequencing depth. Because females have only one Z chromosome, Z-linked markers in females are expected to appear homozygous and be recovered at about half the sequencing depth of males.

2.4. mtDNA Sequencing

Rusty blackbird individuals were sequenced at the mtDNA control region domain I and II. We amplified a 543-base pair (bp) fragment using primer pairs RUBL_CR114L (5’–TCTTTGCCCCATCAGACAGC–3’) and BBCR_Rev1 [61]. Polymerase chain reaction (PCR) amplifications, cycle-sequencing protocols, and post-sequencing processing followed Sonsthagen et al. [62], with one exception: excess dNTPs and primer were removed using ExoSAP-IT (ThermoFisher Scientific, Waltham, MA, USA). PCR products were sequenced at Functional Biosciences, Inc. (Madison, WI, USA). For quality control purposes, we extracted, amplified, and sequenced 10% of the samples in duplicate. No inconsistencies in mtDNA sequences were observed between replicates. Sequence data are accessioned on GenBank (accession numbers: MW574845-MW574901; see [55] for additional sample information).

2.5. Population Divergence and Nucleotide Diversity

We calculated (1) nucleotide diversity (π) of each ddRAD locus (autosomal and Z-linked) and overall (all loci combined) and (2) composite pairwise estimates of relative divergence (ФST) between sample locations using a custom Python script (out2phistA.py [63]).
Haplotype (h) and nucleotide (π) diversity were calculated for mtDNA in ARLEQUIN 2.0 [64]. Fu’s FS [65] and Tajima’s D [66] were calculated to test the hypothesis of selective neutrality and evidence of population fluctuations as implemented in ARLEQUIN. We applied critical significance values of 5%, which requires a p-value < 0.02 for Fu’s FS [65]. An unrooted haplotype network for mtDNA loci was constructed in NETWORK 5.0.1.1 (Fluxus Technology, Suffolk, England 2019) using the reduced median method [67] to illustrate possible reticulations in the gene tree because of homoplasy or recombination. The degree of genetic divergence within rusty blackbirds was assessed by calculating overall and pairwise FST [frequency-based) and ΦST using a nucleotide substitution model [68] in ARLEQUIN.

2.6. Population Structure—ddRAD

Population structure was analyzed using four complementary methods with different underlying assumption requirements: (1) principal components analysis (PCA, nonparametric method) to identify major trends in the distribution of genetic variation; (2) maximum likelihood clustering analysis to estimate the number of underlying populations using individual SNPs in the program ADMIXTURE (parametric method); (3) fineRADstructure utilizing haplotypes (concatenation of all variable sites at each locus) to assess contemporary genetic relationships based on shared co-ancestry; and (4) estimate effective migration surfaces (EEMS, [69]) to identify regions that deviate from a null model of isolation-by-distance (IBD).
First, a PCA was implemented on Autosomal and Z-linked loci separately using haplotypic/allelic data and the dudi.pca function in the adegenet R package [70,71]. As PCAs require individuals to be either diploid or haploid, we only included males (in birds, the sex with two copies of Z chromosome) in the analysis of the Z chromosome loci. We plotted individuals relative to the first two principal components to determine the degree that genetically similar individuals cluster into distinct geographic groups.
Second, maximum likelihood estimates of population assignments across individuals were obtained with ADMIXTURE v.1.3 [72,73]. We used all autosomal bi-allelic SNPs with singletons (i.e., rare SNPs observed in only one individual) excluded and without a priori assignment of individuals to populations. First, SNPs were formatted for analyses using plink [74], following steps outlined in Alexander et al. [75]. ADMIXTURE analysis was run with a 10-fold cross-validation, and a quasi-Newton algorithm employed to accelerate convergence [76]. Each analysis used a block relaxation algorithm for point estimation and terminated once the change (i.e., delta) in the log-likelihood of the point estimations increased by < 0.0001. To limit any possible stochastic effects from single analyses, we ran 100 iterations at each population of K (from K of 1–18). The optimum K was based on the average of CV-errors across the 100 analyses per K; however, additional K’s were analyzed for further population structure resolution. We then used the program CLUMPP v.1.1 [77] to determine the robustness of the assignments of individuals to populations at each K. First, ADMIXTURE outputs were converted into CLUMPP input files at each K using the R program PopHelper [78]. In CLUMPP, we employed the Large Greedy algorithm and 1000 random permutations to estimate final admixture proportions for each K with per sample assignment probabilities (Q estimates, the log likelihood of group assignment) based on all 100 replicates per K.
Third, we used the fineRADstructure program [79] to cluster individuals into populations with indistinguishable genetic ancestry using a haplotype-based approach. FineRADstructure focuses on the most recent coalescent events (common ancestry) providing information on recent sample relatedness which can be informative regarding levels of contemporary gene flow. Samples were assigned to populations using 5,000,000 iterations sampled every 1000 steps with a burn-in of 500,000. We used 1,000,000 iterations of the tree-building algorithm to assess genetic relationships among clusters. Finally, the output was visualized using the R scripts, fineradstructureplot.r and finestructurelibrary.r [80].
We implemented the spatial method EEMS [69] to estimate effective gene flow (m) and genetic diversity (q) in order to identify areas across the breeding range that deviate from the null expectations of IBD. This method is based on a stepping-stone model where individuals are allowed to move between neighboring demes and gene flow rates can vary by locality. Expected genetic dissimilarity under the model depends on sample location and gene flow rates. Regions where genetic dissimilarity decays more quickly than expected are identified as barriers to gene flow or, conversely, corridors where genetic dissimilarity decayed more slowly than expected. A migration surface that correlates genetic variation with geography is interpolated to visualize potential barriers or corridors to movement. In addition, the model estimates an effective diversity parameter (q), which is the expected within-deme coalescent time and is proportional to average heterozygosity.
We used the same set of SNPs as in Admixture and calculated a dissimilarity matrix using bed2diffs R code included with the EEMS package [81]. An outer coordinate file was constructed using Google Maps API v3 [82] that included the species’ entire breeding distribution [52]. Based on preliminary runs, we adjusted parameters, so the accepted proportion of proposals of variance was at least between 10% and 40%. We ran three independent analyses using 10,000,000 burn-in steps followed by 50,000,000 MCMC iterations sampled every 2000 steps for each deme size (100,250). We checked for convergence and visualized effective migration and diversity surfaces using the R package rEEMSplots [69].

2.7. Effective Population Size—ddRAD

Contemporary effective population size (Ne) was estimated from 6184 loci with NeEstimator v.2.1 [83] based on two methods: the linkage disequilibrium (LD) method [84] which tests for the nonrandom associations among alleles at different loci formed by genetic drift in small populations [85] and the molecular co-ancestry method [86] which evaluates the level of allele sharing among individuals. Further, we excluded rare alleles below a range of allele frequency values (Pcrit) from the linkage disequilibrium model to evaluate the effects of low-frequency alleles on Ne estimates. Variance in Ne estimates across a range of Pcrit values suggests a history of gene flow and/or the presence of first-generation dispersers, whereas stable Ne estimates are indicative of isolated populations [87]. We estimated Ne using a haplotype-based approach and Pcrit values between 0.01 and 0.09 and without a frequency restriction. Confidence limits (95%) were determined by jackknifing over loci. Ne was not estimated for sites with a sample size < 10.

2.8. Hindcasted Paleo-Distributions of Breeding Rusty Blackbirds

Finally, we evaluated the paleo-hindcasted maps of the potential LGM breeding range of rusty blackbirds by Stralberg et al. [53]. This was to assess whether population isolation during the LGM may have contributed to genomic structuring detected in our analyses of mtDNA and ddRAD. Models of rusty blackbird breeding density were developed by fitting boosted regression trees [88] to bioclimatic indices derived from current climate normals (1961–1990) as predictors of species abundance data derived from surveys conducted across the species’ boreal range [89]. Climate variables were chosen from a set of bioclimatic indices [90] based on several criteria, including relevance to vegetation distributions, avoidance of extreme collinearity, and a preference for seasonal over annual variables when they showed high correlations. The final set of variables included extreme minimum temperature, chilling degree days below 0 °C, growing degree days above 5 °C, seasonal temperature difference, mean summer precipitation, climate moisture index [91], and summer climate moisture index.
Models were then fed inputs from downscaled paleo-climate projections for 21,000 years before present, according to two global climate models, Community Climate Model (CCM1) and Geophysical Fluid Dynamics Laboratory model (GFDL, [92]), to develop hindcast projections of the species’ potential LGM breeding distribution [53]. We used projections from Stralberg et al. [53] to develop modified maps of potential LGM density that included areas thought to be covered by the Cordilleran and Laurentide ice sheets. This was to show where suitable habitats may have existed in unglaciated micro-refugia within the major ice sheets or along coastlines adjacent to known refugia now submerged under the sea (e.g., Bering Land Bridge, Grand and Georges Banks; [38]).

3. Results

3.1. Bioinformatics—ddRAD

We obtained over 294,699,715 million raw sequencing reads (median = 1,432,707 reads per individual, range 901,000–1,943,040) with a maximum 150 bp length. Initial exploration of genotyping results revealed that most loci were unambiguously genotyped across samples. We removed seven samples that were deemed to be of close familial relationship (e.g., siblings) based on preliminary PCAs and fineRADstructure results, and field notes (location, date, and age of individuals sampled). For the remaining 198 samples, a total of 6443 clusters (i.e., putative single-copy loci) met the depth/genotype threshold. Of these loci, 6436 passed automated checks for alignment quality or passed thresholds after manual edits that yielded 42,446 SNPs or insertion/deletion (polymorphic sites) from 6381 polymorphic loci. Of those, 6205 loci and 231 loci were assigned to autosomal and the Z chromosome, respectively. Final datasets comprised loci with a median sequencing depth of 118 reads per locus per individual (median range = 73−175 reads/locus/individual), and on average 98.5% (minimum of 80.0%) of alleles per individual per locus were scored.

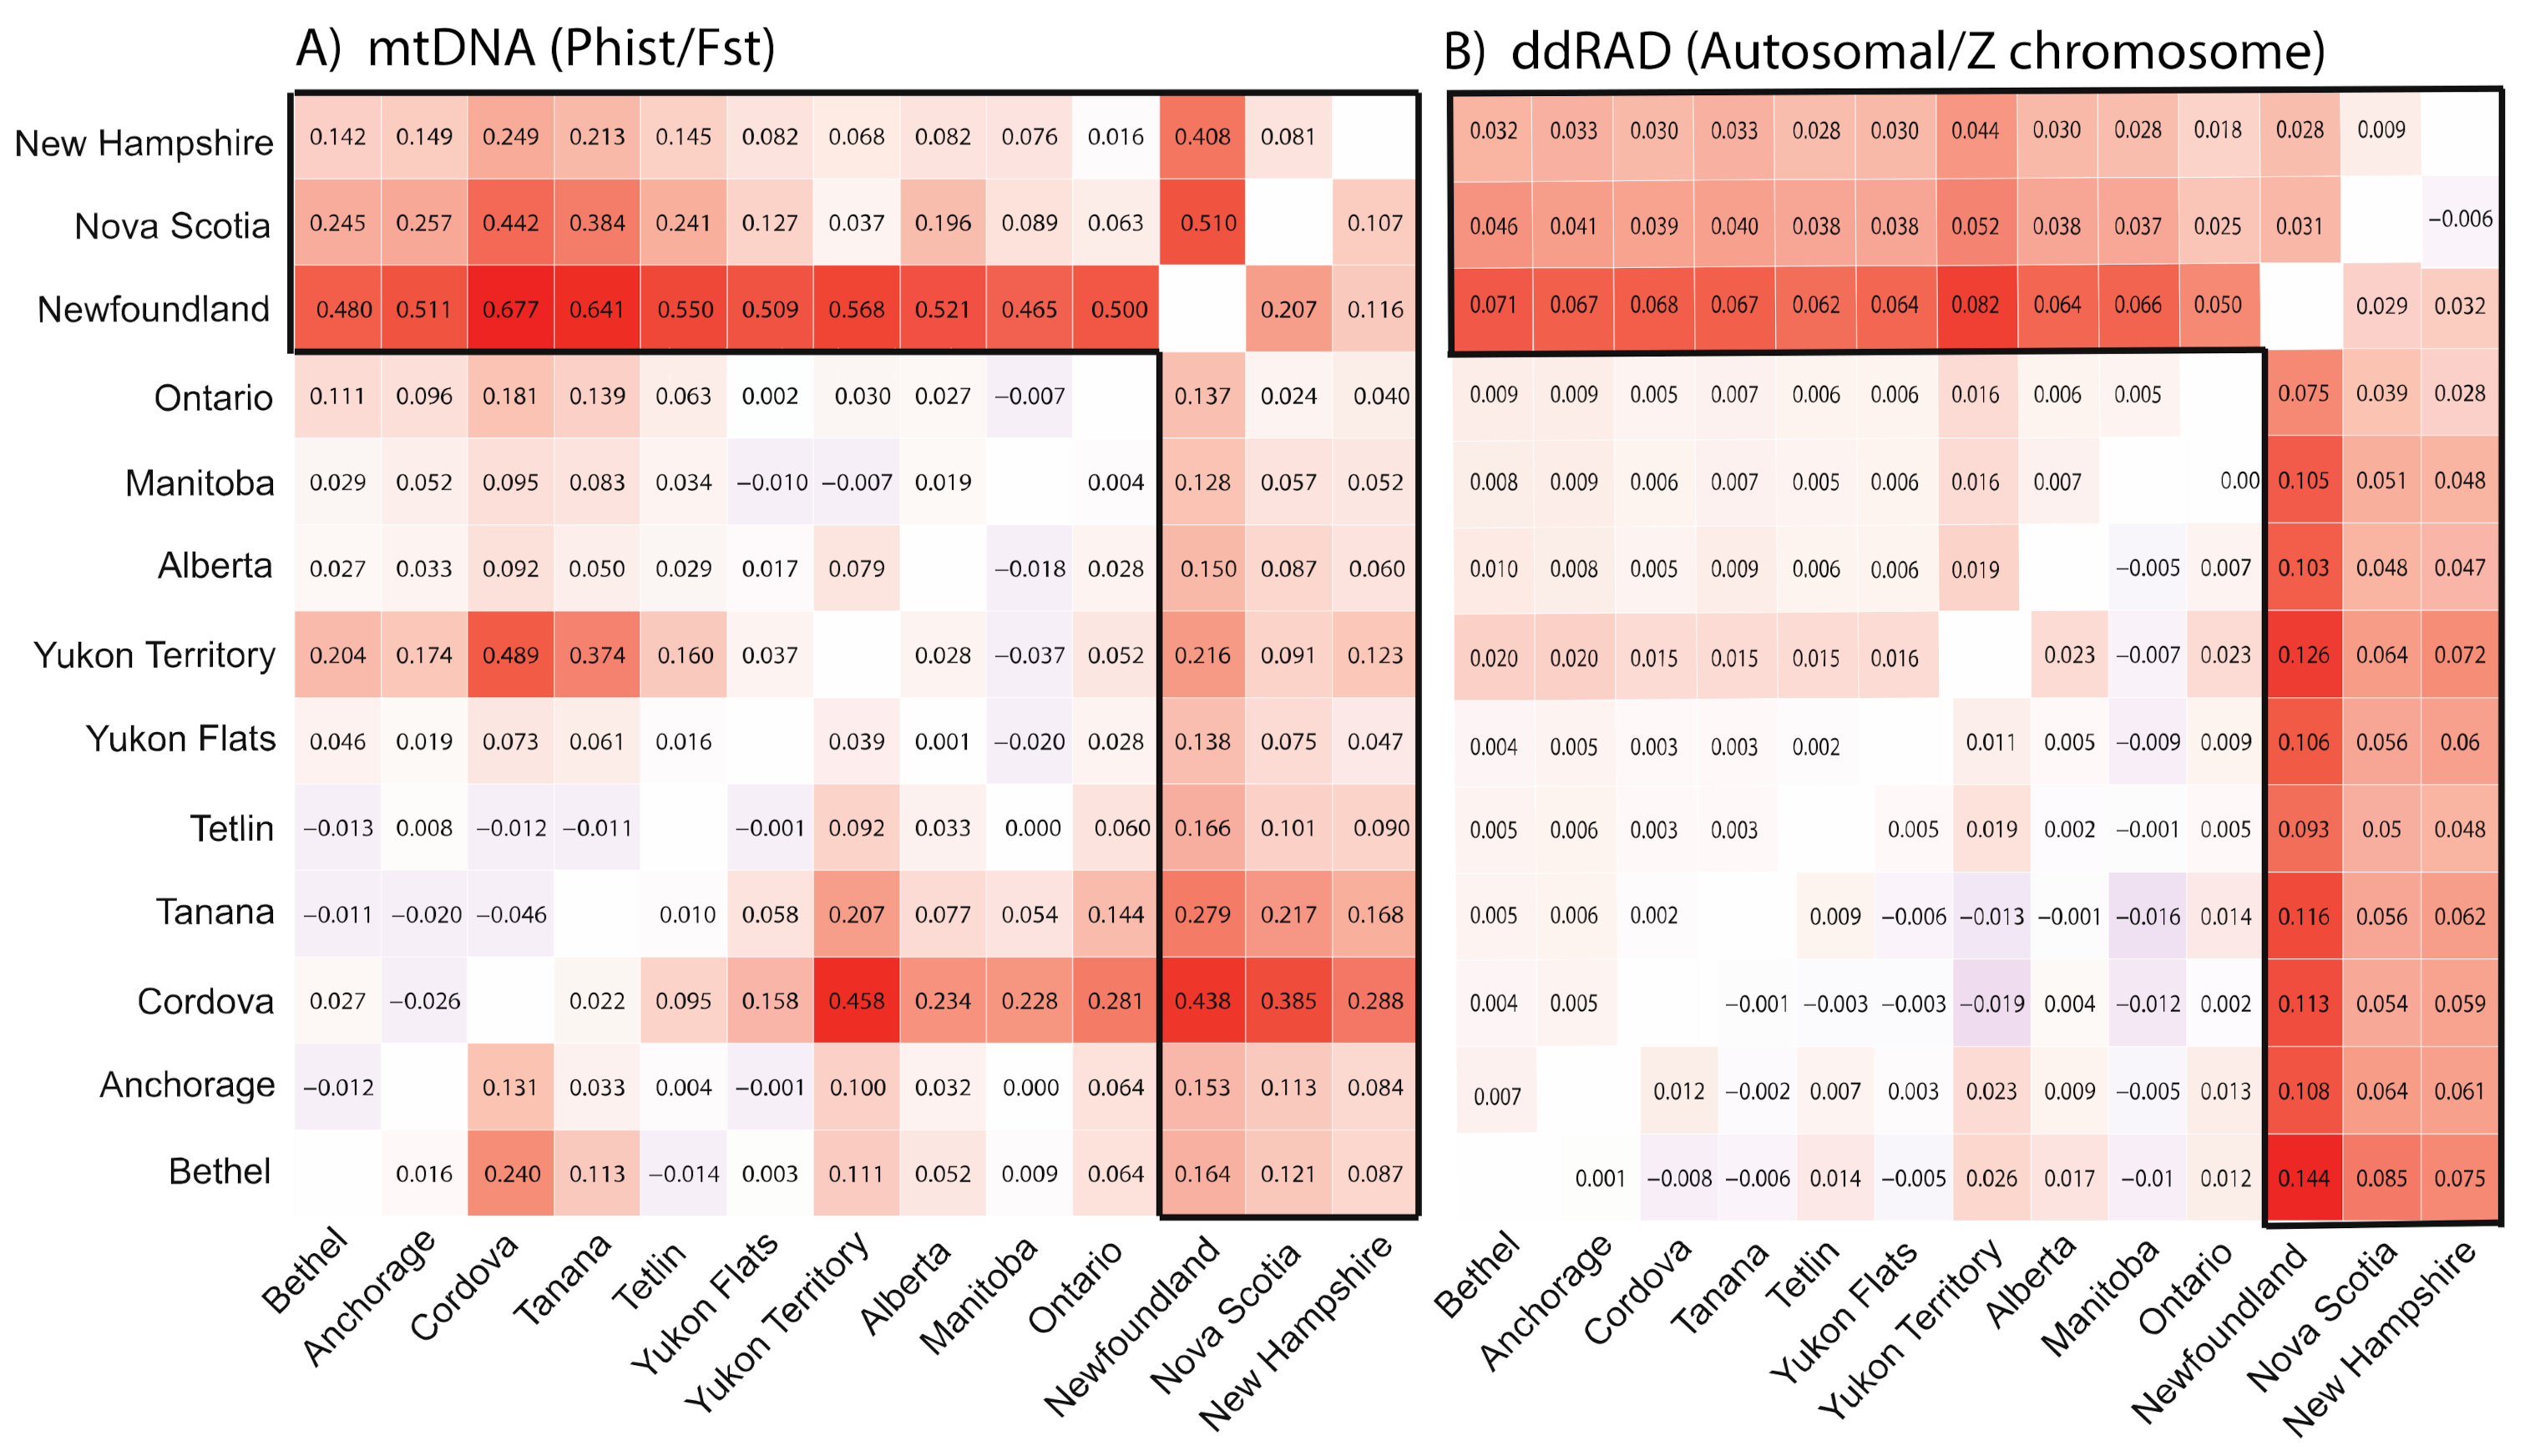
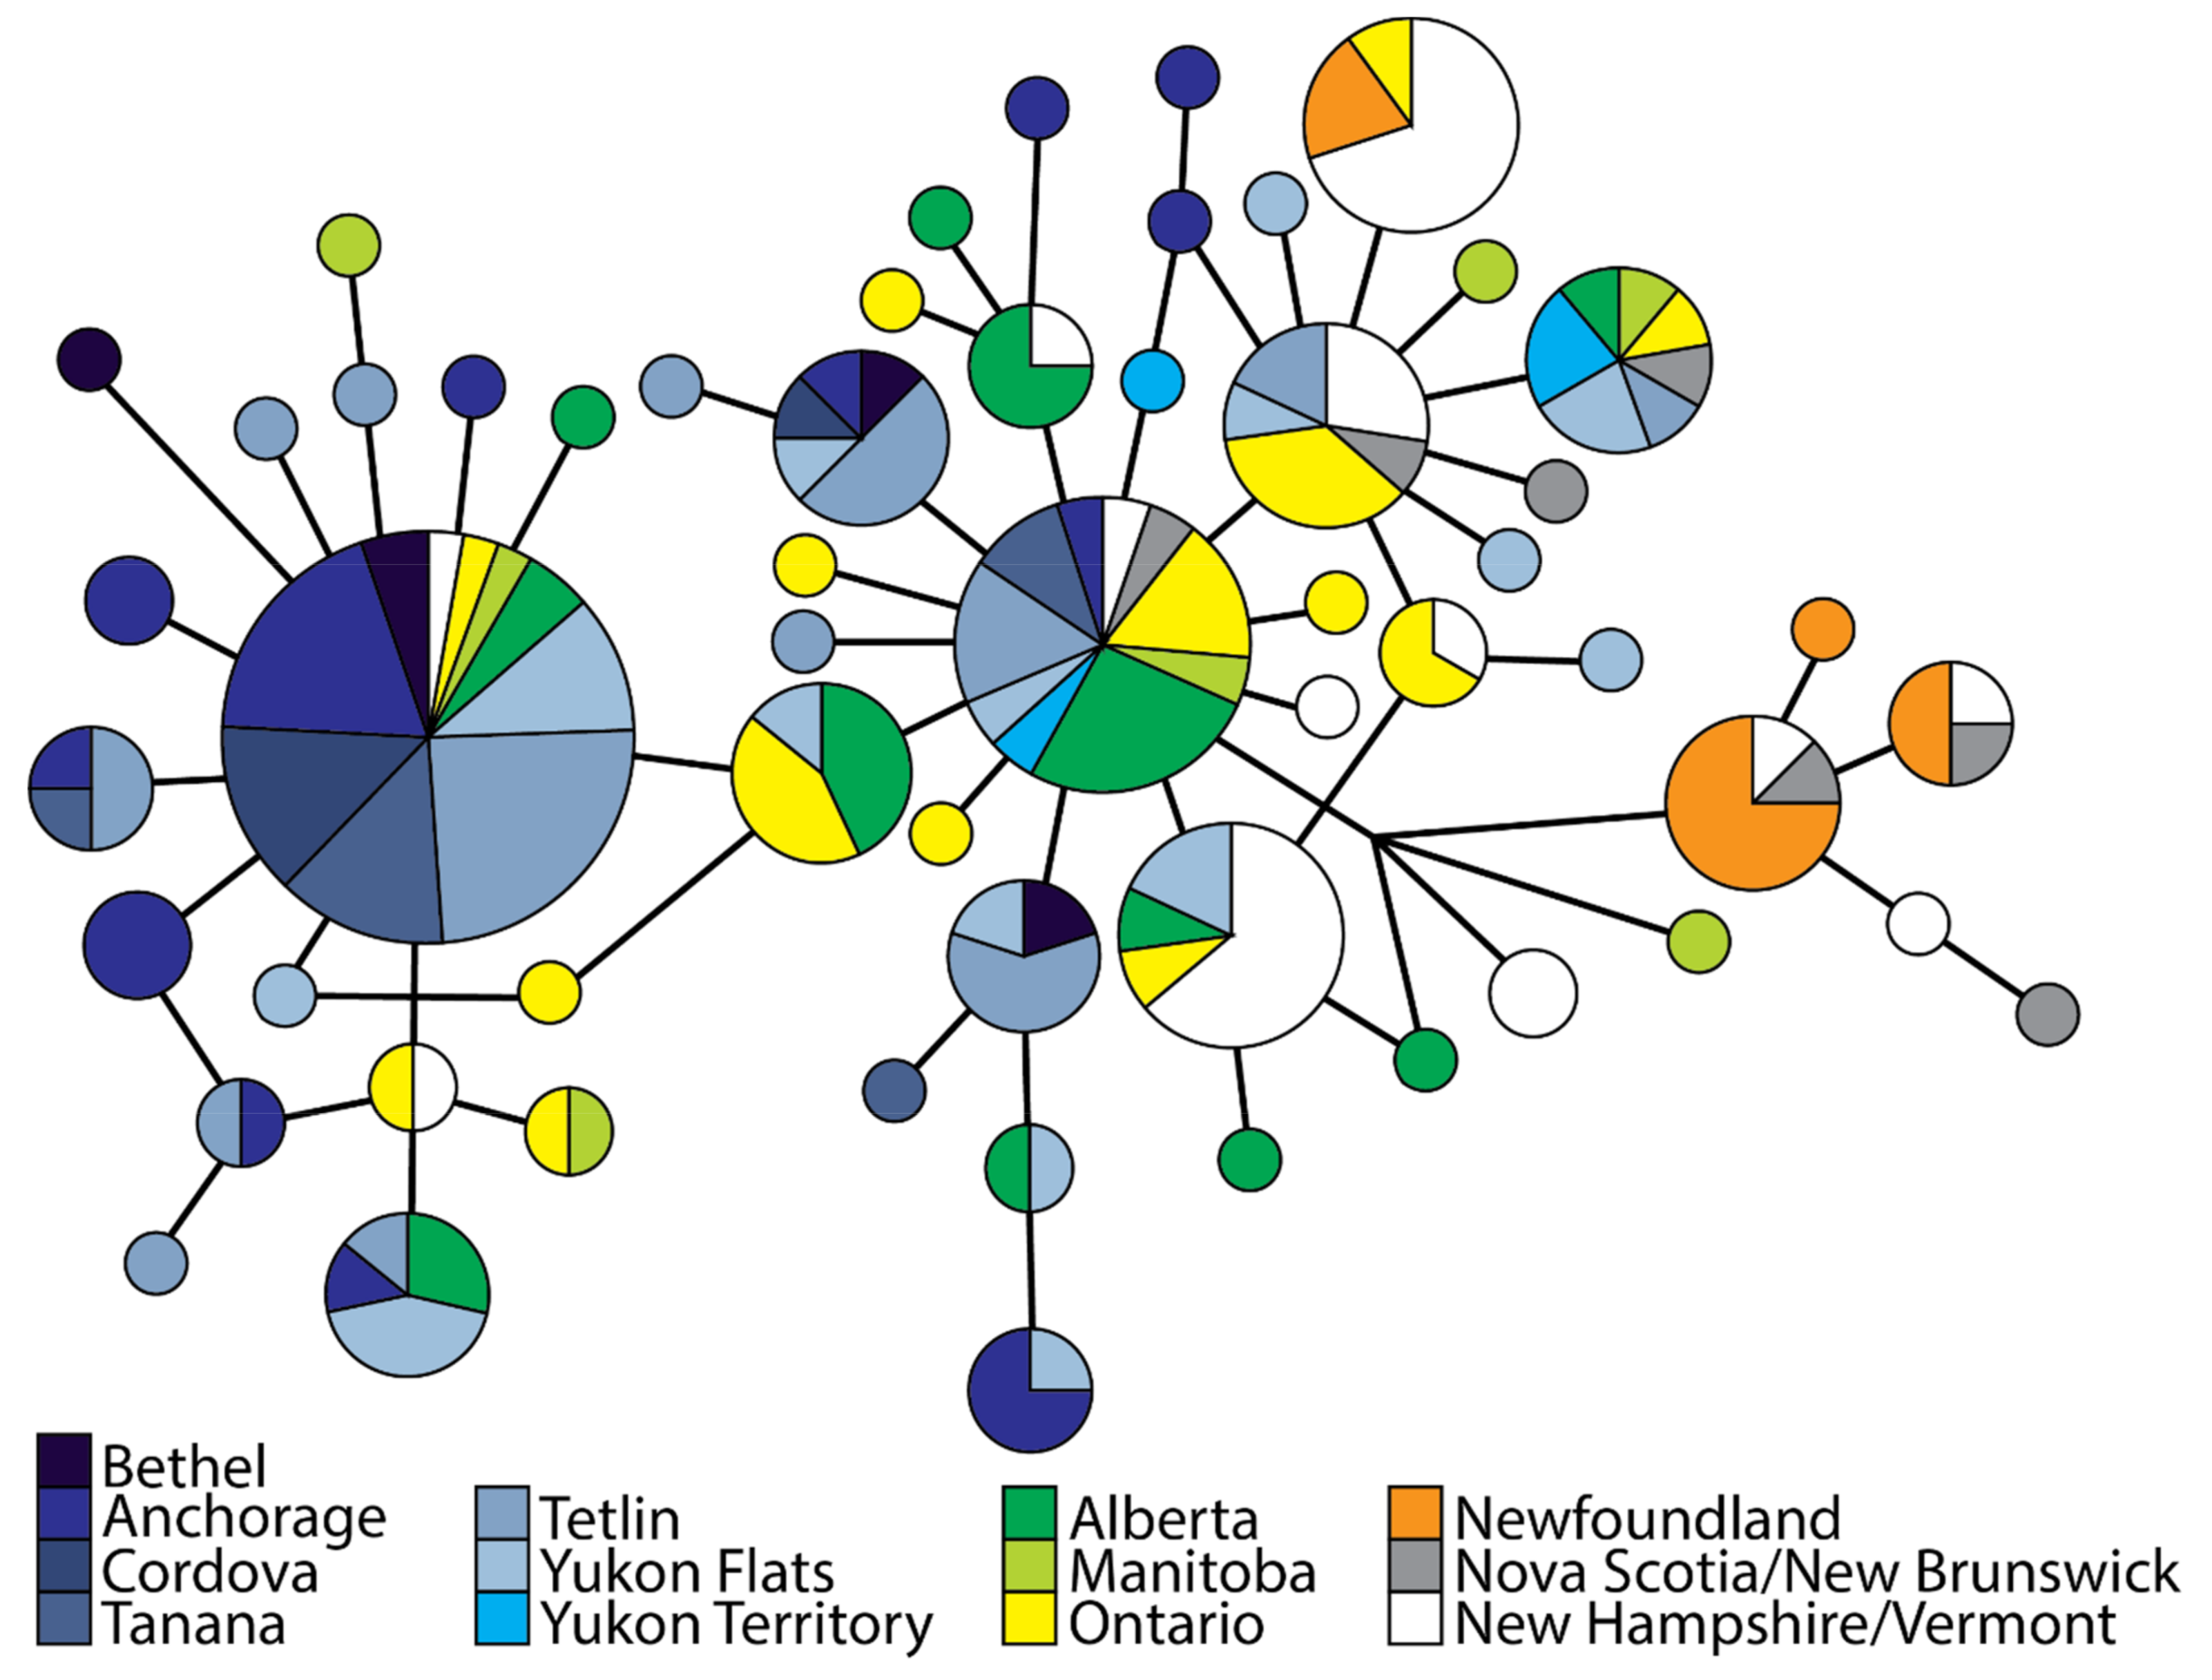
3.2. Population Divergence and Molecular Diversity

Autosomal nucleotide diversity across the 6205 ddRAD loci was similar for all locations (0.0058–0.0070) with overall value of 0.0061 (Table 1). The highest percentage of loci with no variation (i.e., nucleotide diversity equals zero) was found within Yukon Territory, Canada (21.9%) and Vermont, USA (19.5%). Similar pattern was observed with Z-linked loci with overall nucleotide diversity of 0.0050 (range 0.0037–0.0049, Table 1). Among the 231 Z loci, Yukon Territory (39.4%) and Vermont (38.5%) had the highest percentage of non-variable loci. It should be noted that these populations also had the smallest sample size.
Overall, we uncovered relatively moderate levels of genetic differentiation across sample locations with Z-linked loci showing a 1.5× higher level of differentiation than autosomal (Figure 2; ФSTAutosomal = 0.019; ФSTZ-linked= 0.029). Autosomal and Z-linked loci ΦST values ranged from 0.002 to 0.082 and −0.016 to 0.144, respectively, with highest degrees of pairwise differentiation found between Newfoundland and other locations and between eastern and western locales (Figure 2). This pattern is reflective in the number of loci showing elevated pairwise divergence (ФST > 0.1) which ranged from 0.2–30.3% of loci (12–1880 loci) across all comparisons (overall 0.8%, n = 52) for autosomal loci and from 0.9–33.3% for Z-linked loci (overall 5.2%, n = 12).
We uncovered 56 unique mtDNA haplotypes characterized by 36 variable sites. Nucleotide and haplotype diversity were generally similar across sampled locations, except Cordova, Alaska which exhibited lower levels of diversity (n = 4, π = 0.0012, h = 0.333), and Nova Scotia/New Brunswick, Canada (n = 7, π = 0.0069, h = 1.000) and Manitoba (n = 7, π = 0.0063, h = 1.000) which exhibited higher diversity (Table 1). Tajima D was not significant, which is consistent with a hypothesis of selective neutrality of mtDNA. Fu’s Fs was significantly negative for eight populations, suggestive of historical population growth.
Two main haplotype groups were observed in the mtDNA network, although separated by one or three variable sites depending on evolutionary pathway (e.g., presence of reticulations, Figure 3). The first group consisted of mainly Alaska locales with only 2 samples from eastern region and 17 haplotypes though only one haplotype was predominately represented. Conversely, the second group consisted of samples from both regions but was predominately comprised of central and eastern locations and 39 haplotypes with no one dominate haplotype. Genomic structure was uncovered with higher levels of differentiation estimated between Newfoundland and other sample locales, as well as between northeastern and Alaska locales. Similar results were observed with ddRAD loci; pairwise ΦST values ranged from −0.046 to 0.677 (overall ΦST = 0.147), and pairwise FST values ranged −0.014 to 0.438 (overall FST = 0.073, Figure 2).

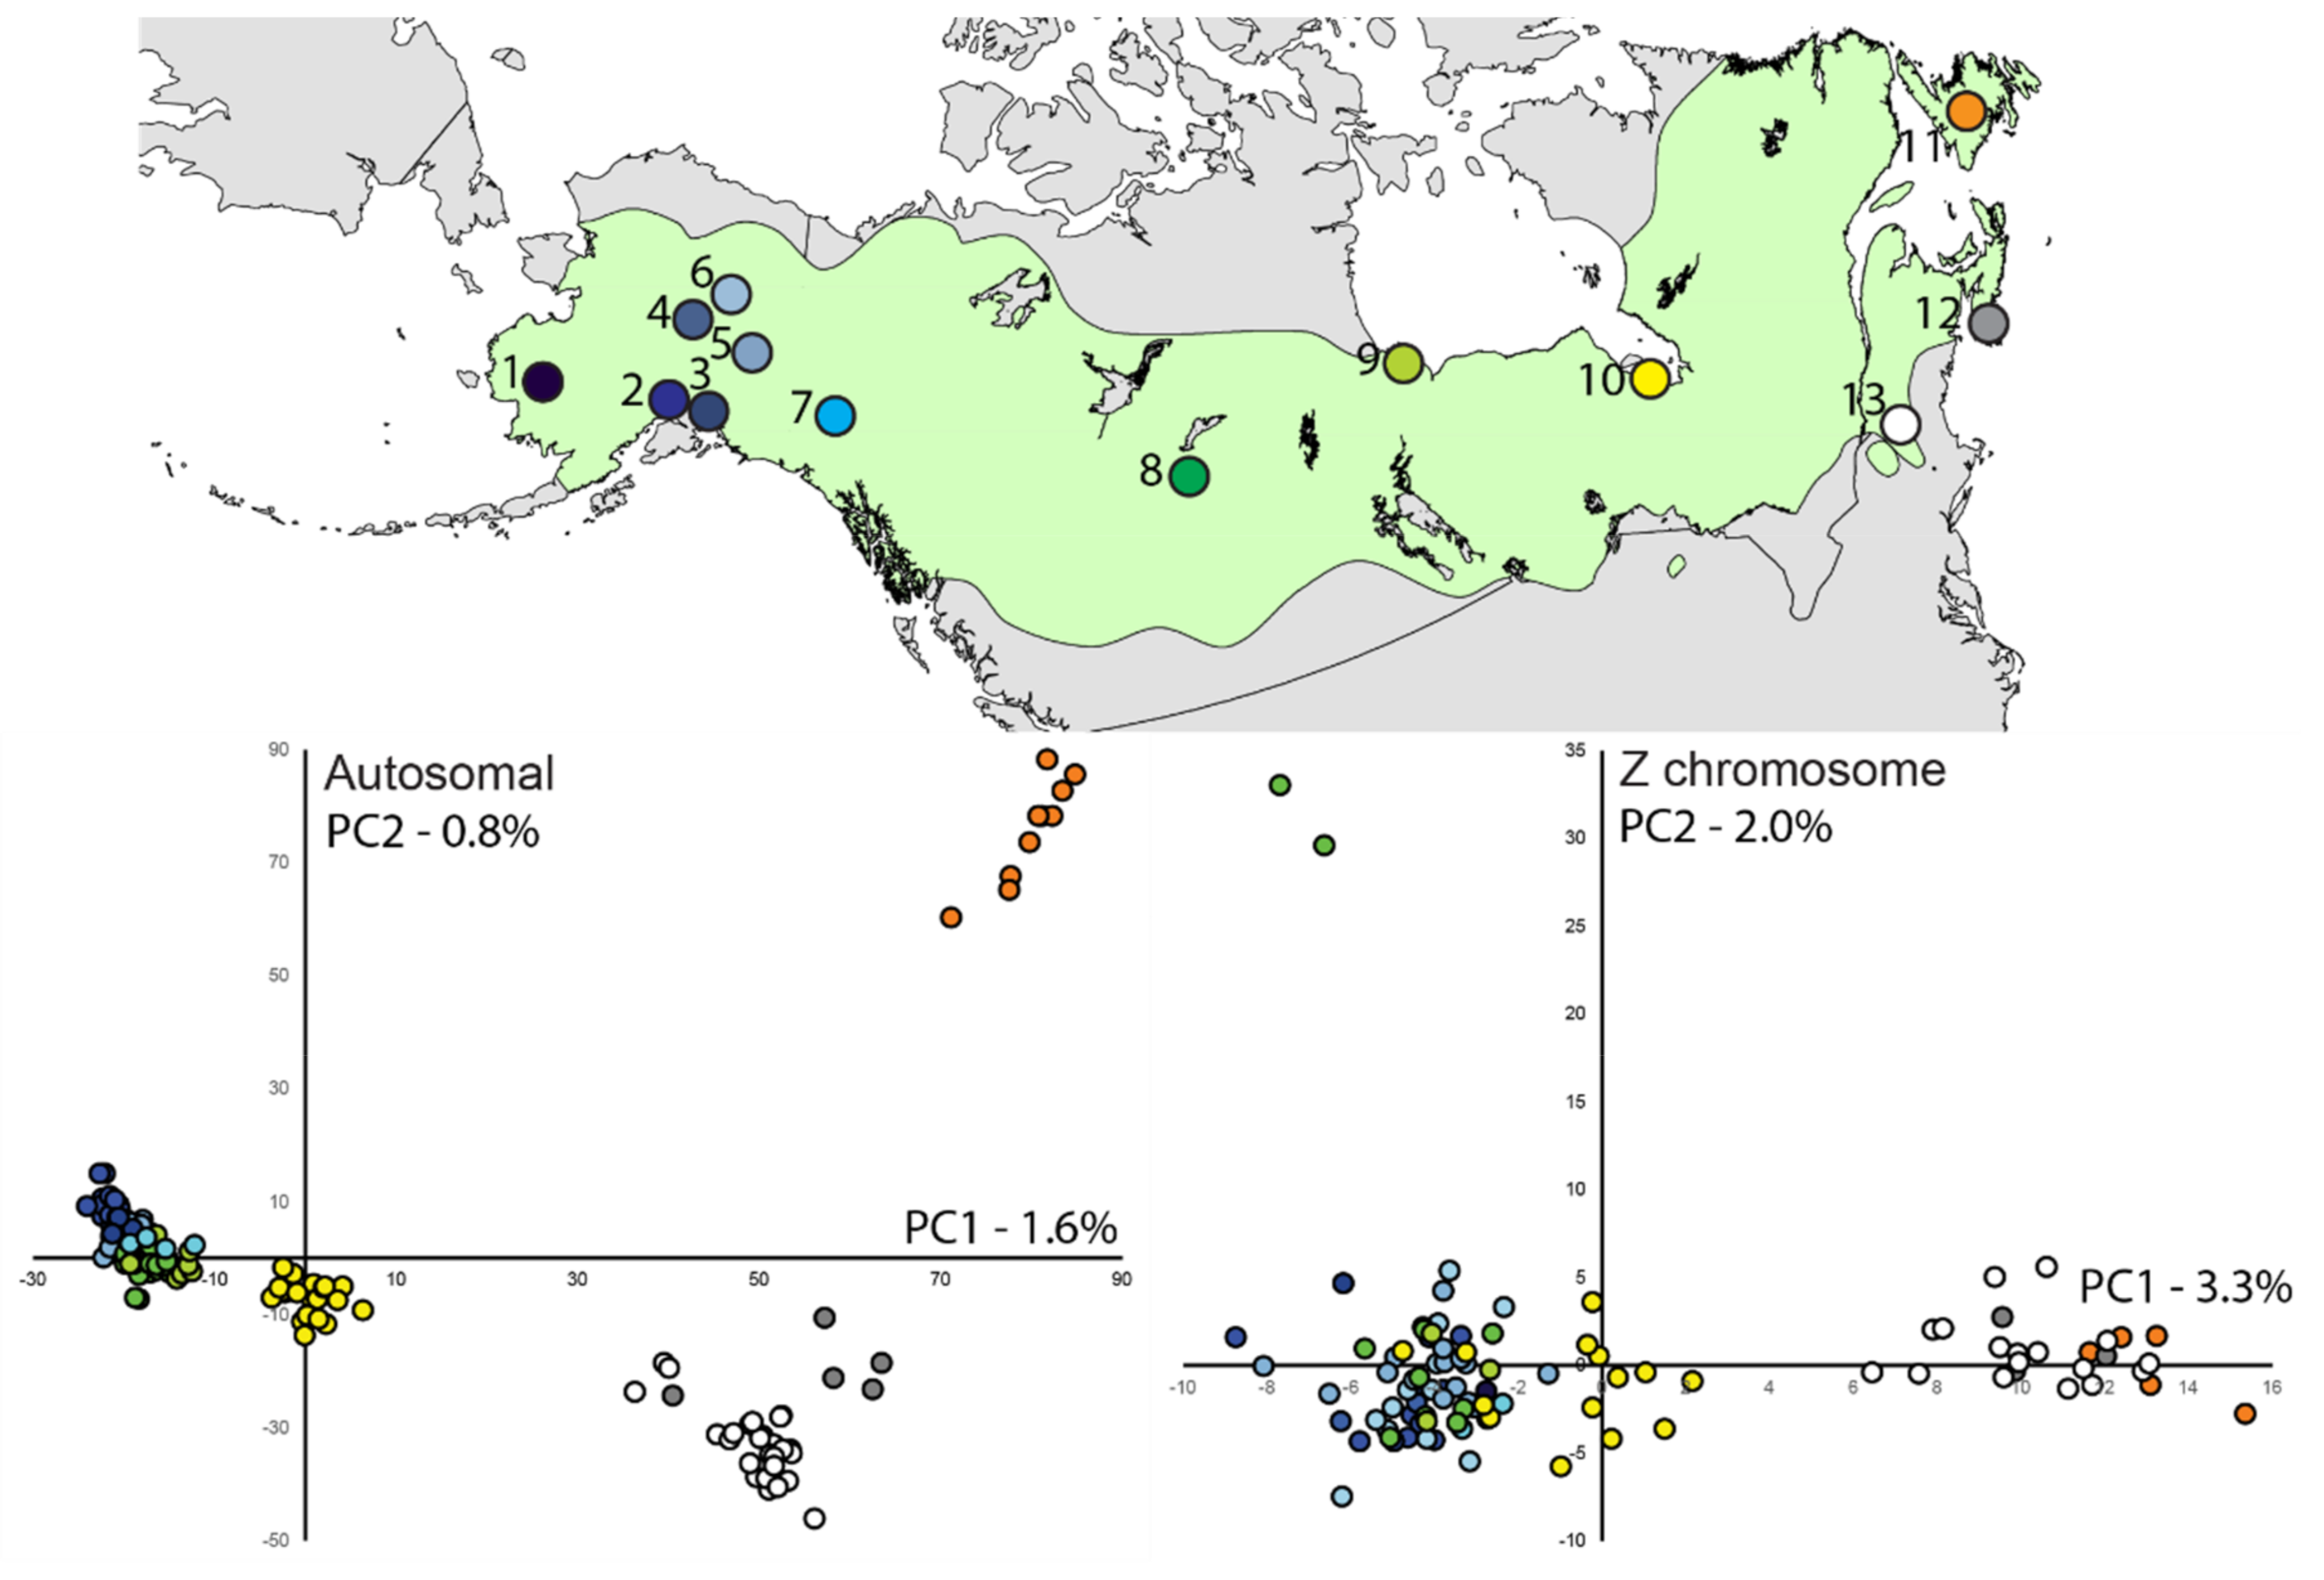
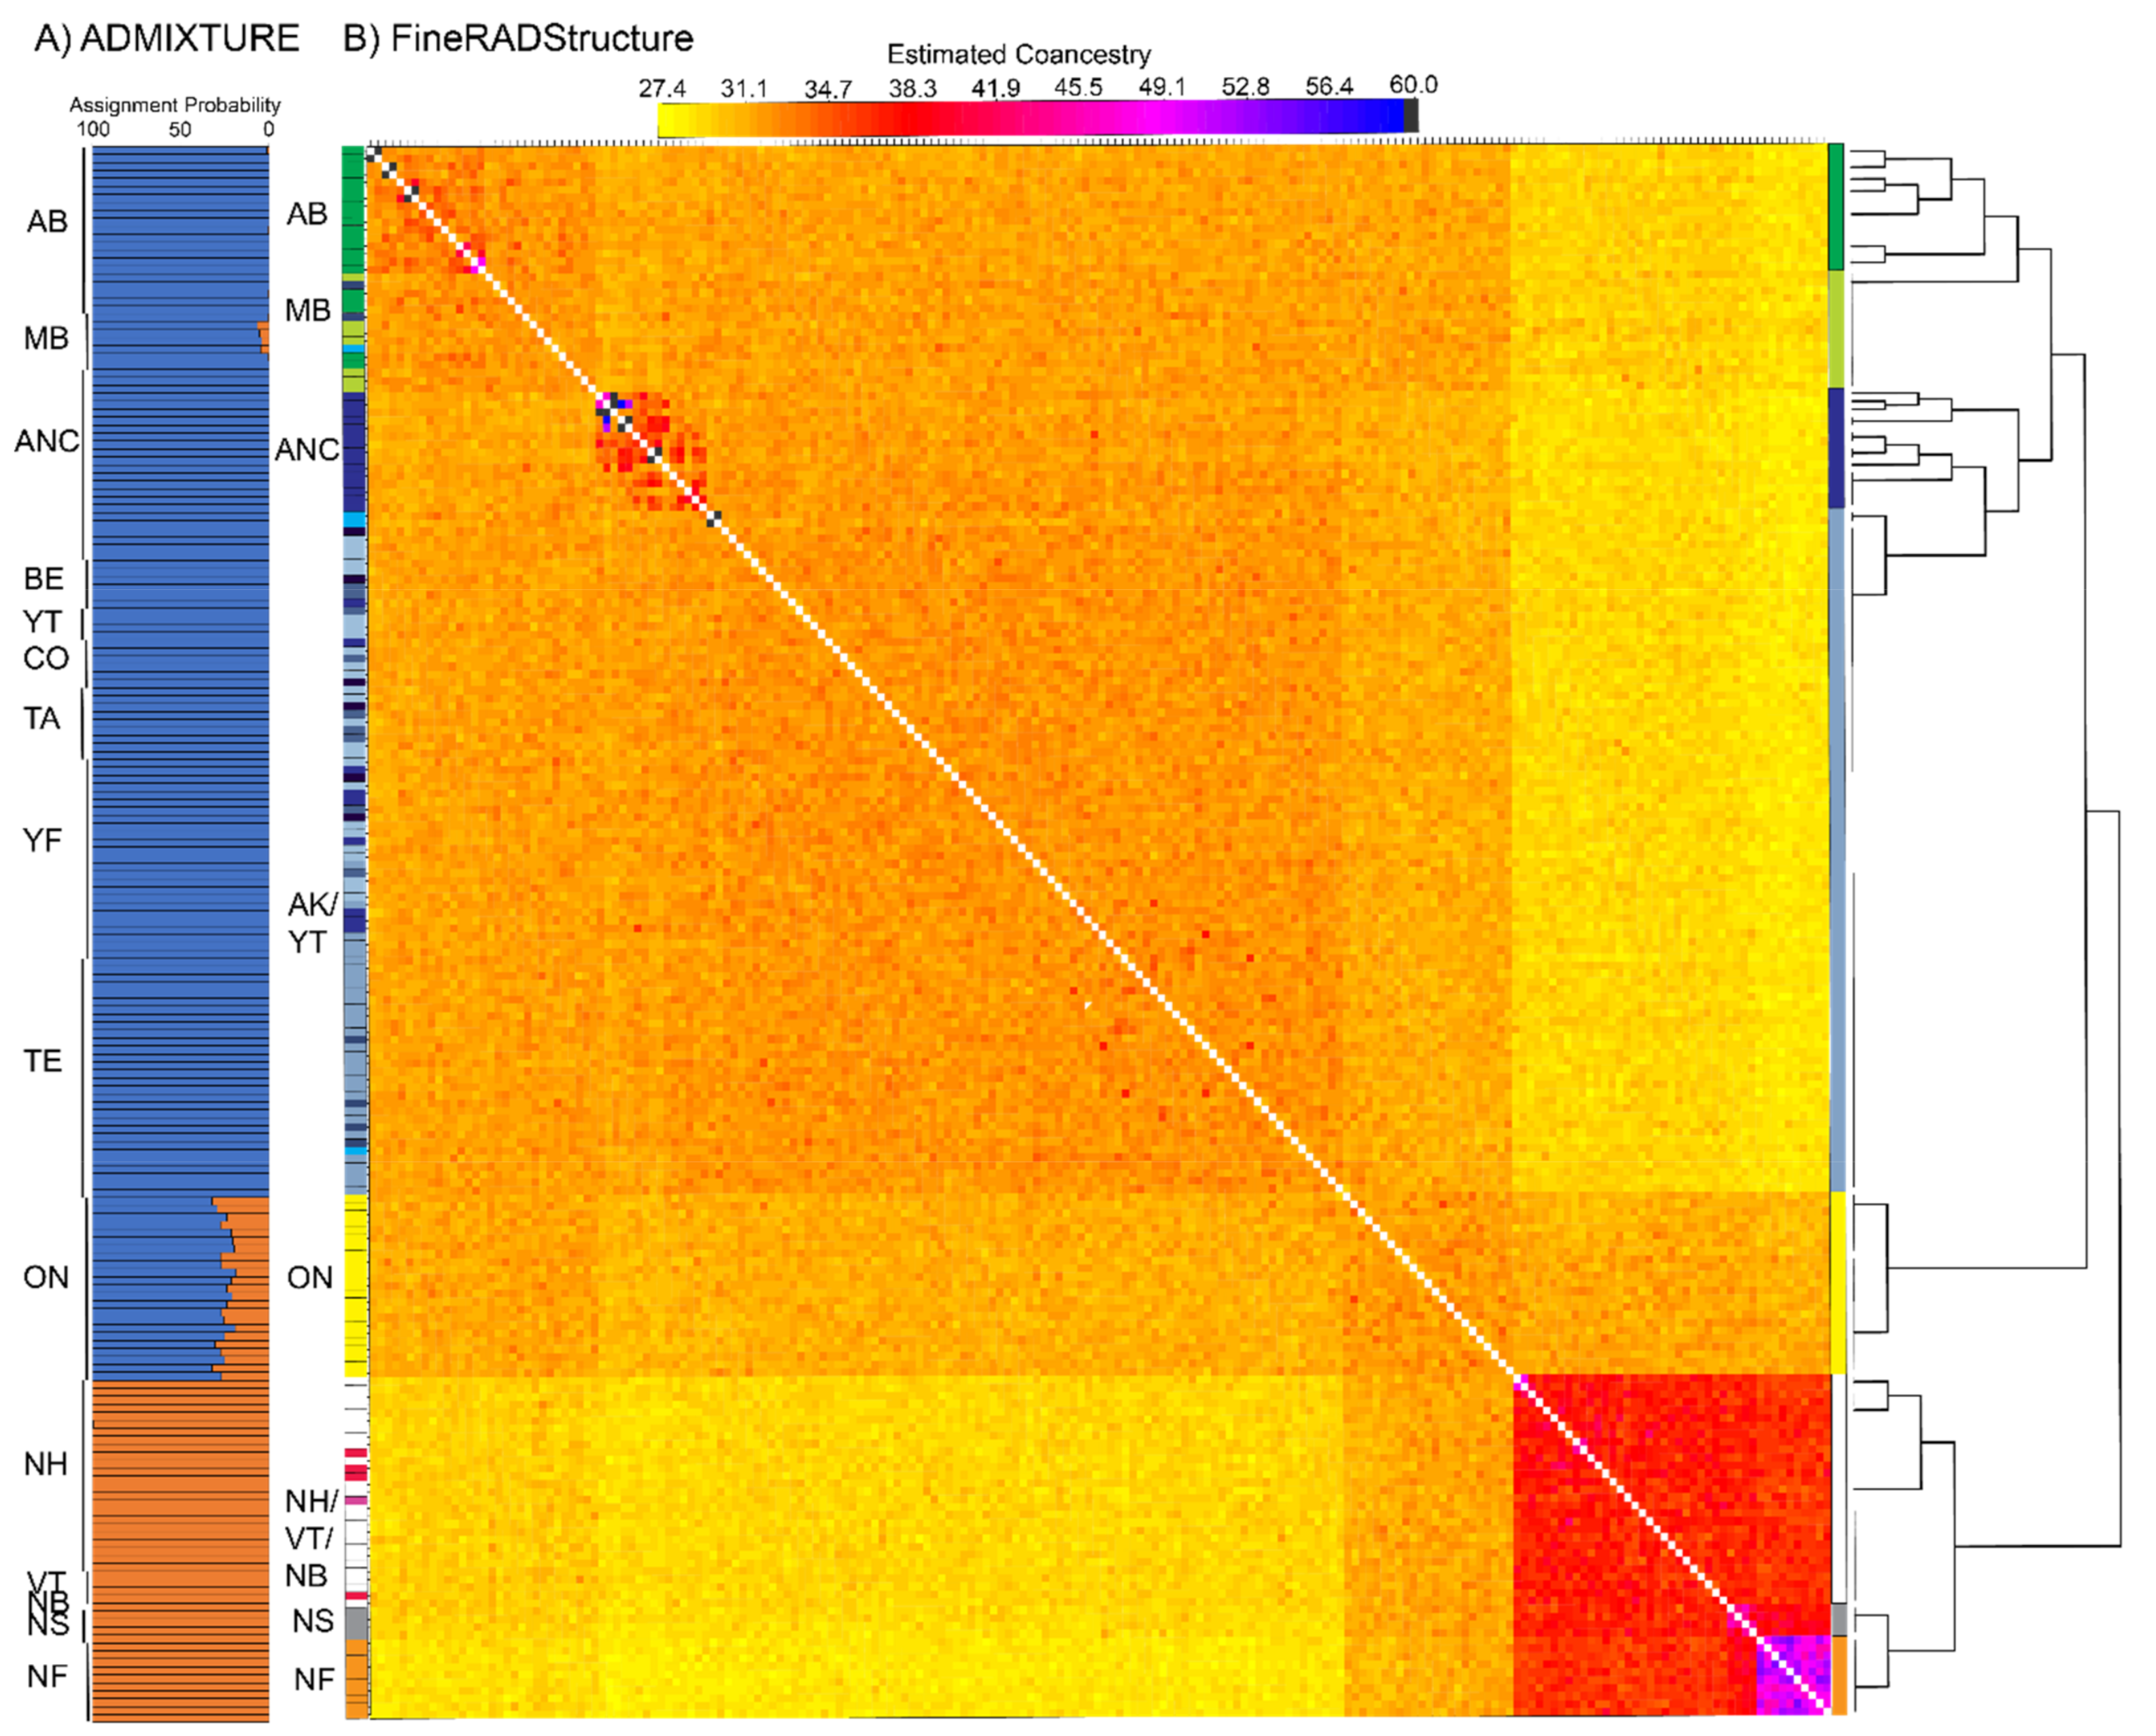
3.3. Population Structure—ddRAD

For PCA, plotting samples relative to the first two principal component axes based on autosomal loci recovered four main clusters that included (1) Newfoundland, (2) Nova Scotia and northeast United States, (3) Ontario, and (4) central Canada and Alaska (Figure 1). These four clusters were also retained but overlapped more when using only Z-linked loci. When PCA included samples only from Cluster 4 (central Canada through Alaska), Anchorage and Canada (Manitoba and Alberta) samples appear slightly differentiated from all other Alaska samples, although there is overlap in PC components (results not shown).
All possible K values were explored across ADMIXTURE analyses (Figure 4A). When K = 2, samples from northeastern locales (Clusters 1 and 2 in PCA) and Alaska and central Canada (PCA Cluster 4) were assigned with high probability to unique clusters. Ontario (PCA Cluster 3) was intermediate between (~70–80% assignment to Alaska cluster) the two main groups. When K = 3 or 4 are considered, the same overall pattern remained except central Canada (Manitoba and Alberta) and Ontario make up a third cluster with variable assignment probability (40–98%, see Supplementary Figure S1).
FineRADstructure revealed more sub-structuring than ADMIXTURE analyses, with individuals clustering mainly by geographic proximity (Figure 4B, Supplementary Figure S2). Locales in northeast North America had the highest shared co-ancestry values with samples being assigned to (1) Newfoundland, (2) Nova Scotia, and (3) northeast United States. Ontario samples were assigned to their own population but in agreement with ADMIXTURE, it shared higher co-ancestry with all other groups/populations indicating connectivity to western (overall higher with central Canada than Alaska) and northeastern locales. Samples from the central and western breeding range were primarily assigned to three main groups: (1) Alaska (excluding most Anchorage samples), (2) Anchorage, and (3) central Canada (Alberta and Manitoba). Unlike northeastern North America and Ontario where groups were mutually exclusive, there was some admixture indicated by individuals being placed in a non-origin group within these central Canada and western populations, for example, Cordova, Alaska and Yukon Territory individuals being grouped with central Canada.
EEMS analysis highlighted regions of lower gene flow than expected under IBD. Migration surfaces were similar across deme sizes with one exception. Regions with reduced gene flow were (1) south-central Alaska, (2) Yukon Territory (only present with deme size 250), (3) Alberta, (4) eastern and western Ontario, and (5) Maritime provinces of Canada (Newfoundland, New Brunswick, and Nova Scotia; Figure 5). All these regions had high posterior probabilities (> 0.90) except for the western boundary of Ontario. These boundaries roughly correspond to the population clustering observed in fineRADstructure. High gene flow was characteristic across the remaining distribution.

3.4. Effective Population Size—ddRAD

Although Ne estimates were 10-fold lower for Anchorage, Alaska, and Alberta based on the linkage disequilibrium method, 95% confidence limits overlapped for all of the sampled sites as the upper bounds were infinity (Figure 6). Variation in Ne estimates across Pcrit values was observed for Alaska sites (Tetlin and Yukon Flats), Ontario, and New Hampshire, indicative of past gene flow or the presence of first-generation dispersers affecting Ne estimates. Point estimates for Ne for Newfoundland were infinity, indicating there is no evidence that the population is not very large. However, lower bounds of 95% confidence levels using jackknife method ranged from 83.5 (Pcrit = 0.09) to 372.9 (Pcrit = 0.01) providing a plausible limit for Ne [93]. Conversely, Ne estimates based on the molecular co-ancestry method were lower for two Alaska sites (Anchorage and Tetlin) and Ontario (Table 1).

3.5. Hindcasted Paleo-Distributions of Breeding Rusty Blackbirds

Suitable climate conditions for breeding rusty blackbirds hindcasted to the LGM by Stralberg et al. [53] were located primarily in what is now the central and eastern United States, with some potential suitable habitat in northwestern regions of the United States and Canada (Figure 7). Projected LGM densities were lower, and distributions were more limited and fragmented compared to the species’ current distribution and abundance patterns. Despite substantial variation between them, both CCM1 and GFDL models hindcasted suitable climates for paleo-populations of rusty blackbirds in or adjacent to glacial refugia in (1) Alaska and Yukon Territory (Beringia), (2) insular British Columbia (Vancouver Island and Haida Gwaii), (3) Newfoundland (Grand Banks), and (4) New England and the Canadian Maritimes (Georges Banks), as well as south of the ice sheets in (5) British Columbia and Washington and (6) the Great Plains, Upper Midwest, and Northeast United States (Figure 7).

4. Discussion

The geographic patterns in genomic structure we detected across the rusty blackbird’s breeding range conformed to our hypotheses. (1) An east–west partition in genomic structure was observed between rusty blackbirds nesting in the western and central boreal regions versus the eastern boreal region. This was consistent with the east–west migratory divide detected for the species using stable isotopes [35] and suggests long-term separation of populations. (2) As expected, based on insular isolation and plumage differences [37], birds in Newfoundland were differentiated from birds from other sampled sites. (3) Populations within both eastern and western regions exhibited subtle genomic structuring and restricted gene flow, indicating dispersal is limited by discontinuities in habitat, physical barriers, philopatry, or migratory behavior. Further, Ontario appears to be an area of secondary contact between birds originating from eastern and western lineages identified in ADMIXTURE and fineRADstructure analyses. Together, these results indicate that historical and contemporary processes are shaping the distribution of genomic variation among populations of rusty blackbirds across their boreal distribution.

4.1. Pleistocene Influences on Patterns of Genomic Diversity

While the species’ current nesting distribution is largely contiguous across the boreal forest biome, the distribution hindcasted to 21,000 years before present was displaced south (other than portions of Beringian Alaska) and was fairly discontinuous and limited (Figure 7, [53]). During the LGM, the glacial ice sheets covered most of northern North America, except Alaska and areas along Pacific and Atlantic coasts [97], and may have sundered the rusty blackbird’s nesting range, isolating populations in separate western and eastern refugia, and promoting the partition in genomic variation we detected in multiple analyses of mtDNA and ddRAD (autosomal and Z-linked) loci. In the same way, glacial vicariance is hypothesized to have led to Pleistocene speciation in several sister pairs of temperate conifer boreal bird species [47,98,99]. In addition, several passerines with trans-boreal distributions share this east–west divide in genomic diversity with secondary contact between divergent lineages occurring in the central boreal: mixing occurs from Alberta to Manitoba within the yellow warbler (Setophaga petechia, [100,101]), from Alberta to Ontario within Wilson’s warbler (Cardellina pusilla, [15,102]), from Saskatchewan to Manitoba within the Canada jay (Perisoreus canadensis, [41,44]), from Alberta to Ontario within the golden-crowned kinglet (Regulus satrapa, [103]), and from Manitoba to Ontario within the rusty blackbird (this study). However, the east–west divide within the blackpoll warbler (Setophaga striata) was attributed to isolation by distance and not glacial vicariance [46]. These concordant breaks in genomic diversity across multiple trans-boreal species emphasize the strong influence that the Pleistocene ice sheets played in shaping how genomic variation is arrayed across northern North America in boreal avifauna.
Models of the paleo-breeding distribution indicated that the nesting habitat for rusty blackbirds could have been present in four potential glacial refugia: (1) Alaska (Beringia), (2) Atlantic Shelf, and south of the ice sheets in (3) western (Cordilleran) United States, and (4) eastern (Laurentide) United States, with the eastern region likely a core area based on the relatively high densities inferred during the LGM [53]. These four regions coincide with the locations of glacial refugia proposed for the boreal chickadee [42], the Canada jay [41,44], and the black spruce (Picea mariana, [104])—the tree species most often selected for nesting by rusty blackbirds [105]. Rusty blackbirds and other spruce-associated species may have therefore followed the post-glacial colonization routes inferred for black spruce from pollen, fossils, genetics, and ecological modeling [41,106,107]. The spatial apportionment of genomic diversity does suggest that rusty blackbirds occupied at least two refugia during the LGM, although it is not clear from model hindcasts which regions were the refugia nor from the genetic data which sample locations represent refugial populations. Recent colonization of deglaciated areas, whether via long-distance dispersal or leading-edge expansion from glacial refugia, leaves predictable signatures, notably reduced genomic diversity associated with founder events followed by founders preventing subsequent waves of colonizers [108]. Levels of genomic diversity, however, were similar across the rusty blackbird distribution (Table 1). Dispersal likely continued from refugial populations into founding populations in deglaciated areas either via short movements or continued long-distance dispersal. Connectivity between refugial and founding populations would have maintained genomic diversity because effective population sizes would not have been markedly reduced [39,109], thereby erasing the genetic legacy of founder events associated with post-glacial colonization. Further, the eastern clade had high haplotype diversity with no single dominate haplotype suggesting that Newfoundland, Canada Maritime provinces, and New England states were colonized by rusty blackbirds originating from the “core” eastern refugium and possibly the Atlantic Shelf refugium as the effective population size would need to be large to retain and maintain genetic diversity through the LGM. Conversely, the mtDNA network for the western clade had a star-like pattern with a single dominant haplotype predominately represented by Alaska birds. This suggests that the western breeding range from Alaska to Manitoba was colonized by a small refugial population of rusty blackbirds expanding their range from a western or Alaska (Beringia) refugium that supported lower nesting density, and therefore presumably lower effective population size during the LGM.

4.2. Isolation in Newfoundland

Rusty blackbirds occupying Newfoundland were genetically divergent from all sampled locations across marker types. The presence of genetic structure is concordant with the putative subspecies, Euphagus carolinus nigrans, described by Burleigh and Peters [37] to nest on Newfoundland and Magdelen Islands, winter in South Carolina, and have a distinctive plumage that is darker, glossier, and bluer than the nominate form. Burleigh and Peters [37] described an additional 12 endemic subspecies of passerines breeding on Newfoundland that also had darker plumages than their mainland counterparts. Similar to rusty blackbird, several of these species and others have since been found to have genetically distinct populations on Newfoundland: the American redstart (Setophaga ruticilla, [45]), the blackpoll warbler [46], the boreal chickadee [42], the purple finch (Haemorhous purpureus, [110], the Canada jay [44], the gray-cheeked thrush [111], and the black-capped chickadee (Poecile atricapillus, [112]). Cabot Strait (≥104-km wide) and the Strait of Belle Isle (≥15-km wide) separating Newfoundland from mainland Canada therefore seemingly act as strong physical barriers to dispersal by the rusty blackbird and several other passerines.
While Newfoundland rusty blackbirds were genetically differentiated, they were peripheral on the mtDNA network and shared several mtDNA haplotypes with birds breeding elsewhere in eastern North America. This coupled with the limited structure we observed in ADMIXTURE and other analyses of ddRAD loci indicate that divergence between Newfoundland and other eastern locales likely arose post-Pleistocene and has been maintained through restricted dispersal. The observation of shallow divergence is consistent with several other passerines that nest on Newfoundland [44,46,110]. In contrast, other species show much deeper genetic divisions between birds in nesting areas along the northern Atlantic coast versus nearby locales [40,42,112]. In these species, it is more plausible that Newfoundland populations were isolated during the Pleistocene on the Atlantic Shelf refugium offshore of Newfoundland along the Grand Banks [38,97]. Although hindcasting models indicate that suitable habitat was available in Newfoundland during the LGM, the Laurentide ice sheet covered most of the region. Therefore, if rusty blackbirds currently occupying Newfoundland were present in the Atlantic Shelf refugium (Grand Banks, [38,97]), individuals were likely restricted into small isolated area(s) with low numbers. As genetic drift is a strong force shaping genomic diversity in small isolated populations, the lack of deep partitions in genomic variation suggests rusty blackbirds colonized Newfoundland post-Pleistocene and that genomic and morphological variation likely evolved recently as shown for the widely distributed and phenotypically diverse Junco species complex [113].

4.3. Contemporary Influences on Patterns of Genomic Variation

We also found several lines of evidence that contemporary processes are limiting dispersal of rusty blackbird populations. First, the maintenance of two distinct genetic groups in western versus eastern North America is indicative of continued restrictions to dispersal between regional nesting areas. This genetic divide mirrored the general migratory divide between western and eastern flyways identified with stable isotopes [35]. Thus, differences in migratory pathways or timing of migration may reinforce reproductive isolation or spatial segregation of regional rusty blackbird populations in the same way as suggested for other passerines with northern distributions [114,115,116,117]. We also identified a potential area of secondary contact between eastern and western lineages of rusty blackbirds from a single sample location at the northern border between Ontario and Quebec which had similar levels of recently shared ancestry with both western and eastern regions. Genetic samples coupled with tracking studies from additional eastern locales would help determine the geographic extent of the mixing zone and the degree that migratory behavior may be restricting genomic connectivity [115].
Second, we found evidence of restricted dispersal within eastern and western North America in the form of subtle structure in ddRAD loci among most sampled locales (e.g., Nova Scotia versus other northeastern locales and Alberta/Manitoba versus Alaska) that deviated from expectations based on IBD on a regional scale (Figure 5). Furthermore, three areas (Anchorage, Alberta, and Newfoundland) had similar estimates of effective population size (Ne) across a range of rare alleles, suggesting genomic diversity in these populations is not influenced by ongoing gene flow from adjacent populations. While mountain ranges and ocean bodies are obvious barriers isolating rusty blackbirds in Anchorage and Newfoundland, respectively, there are no clear physical barriers restricting dispersal between Alberta and Manitoba within central Canada. Despite the lack of physical barriers, Alberta individuals were assigned to a non-origin grouping (24%, 5/21) less often than Anchorage individuals (38%, 9/24) in the fineRADstructure analysis, suggesting that other factors are impeding dispersal. Indeed, rusty blackbird nest in boreal forest wetlands that are often distributed in discrete patches separated by unsuitable upland habitat or fragmented by frequent natural disturbance [104,118]. Although rusty blackbirds as well as other passerines migrate over long distances, many species return to near their natal sites to nest where local landscape features influence movements to locate new nesting areas [119]. Other forest dependent birds have shown a reluctance to disperse across large gaps of non-forested habitat to locate new nesting grounds [14,51,120,121]. This type of behavior, if exhibited by rusty blackbirds, may limit dispersal and contribute to genomic structuring among some rusty blackbird nesting areas.

5. Conclusions

Across the breeding range, rusty blackbirds exhibited genomic structuring evident of restricted gene flow, which may limit the species’ adaptive capacity to respond to rapid environmental change. The North American boreal biome is a mosaic of wetland complexes and forests that are projected to be transformed as the Earth’s climate continues to warm and increase the frequency and magnitude of boreal disturbances such as drought, permafrost thaw, fire, and insect outbreaks [122]. Under various simulations of climate-mediated ecological change over the 21st century, the boreal biome is projected to contract by up to 42% [123], and boreal birds are projected to both dramatically shift their ranges northwards and upwards in elevation and suffer disproportionately high losses in population size and range extent among North America avifauna [22,89,122,124,125]. The rusty blackbird is particularly vulnerable to projected reductions in suitable breeding habitat, which could result in the loss of more than half of the species’ breeding range [125] and population numbers [89]. These future declines will exacerbate the species’ already steep global population decline and southern range retraction since the mid-20th century [25,26]—the latter already linked to regional trends in warming [33]. Additional research on genotype-environment associations using functionally relevant loci (e.g., transcriptome or gene expression analysis) can build off of the foundation of this study to identify breeding areas that may be more vulnerable to stochastic events as well as areas that pose high conservation value for the species as the climate continues to change (e.g., [101,126]).
The rusty blackbird has an immense migratory range (breeding across the continental boreal biome, wintering over the eastern half of United States) and the many stressors suspected to be contributing to its decline are hypothesized to vary widely across breeding areas and over the annual cycle [26,27,127]. Efforts to understand the causes of decline and efficiently link conservation across this species’ annual cycle will therefore benefit from a more comprehensive knowledge of migratory connectivity than the general east–west migratory divide identified through stable isotope and tracking studies [34,35,36]. Our study is a foundational step in gaining this knowledge as it provides a basis for researchers to infer the natal origins of birds sampled at key migration stopover sites and important wintering areas (e.g., [15]). Understanding migratory connectivity across the rusty blackbird’s non-breeding range would, for example, allow researchers to weigh the relative contributions of summer versus winter environmental change on vital rates and population trends (e.g., [128,129]) and enable wildlife managers to strategically target habitat restorations throughout the annual cycle for genetically distinct populations [130]. As the boreal avifauna is among the most rapidly declining groups of birds in North America [23], the integration of information on connectivity with the science and management of recovering rusty blackbird populations could serve as a model for how to restore other poorly studied declining boreal species [27].

Supplementary Materials

The following are available online at https://www.mdpi.com/1424-2818/13/3/103/s1, Figure S1: Admixture results for population clustering, Figure S2: FineRADStructure co-ancestry matrix.

Author Contributions

Conceptualization, R.E.W., S.A.S., L.L.P., S.M.M., J.A.J., D.W.D.; resources, S.M.M., J.A.J., L.L.P., D.W.D.; methodology, R.E.W., S.A.S.; formal analysis, R.E.W., S.A.S., D.S.; investigation, R.E.W., S.A.S.; writing—original draft, R.E.W., S.A.S.; writing—review and editing, R.E.W., S.A.S., L.L.P., S.M.M., J.A.J., D.S., D.W.D.; funding Acquisition, J.A.J., D.W.D., S.A.S.; project administration, S.A.S., L.L.P., S.M.M., J.A.J., D.W.D.; data curation, R.E.W., S.A.S.; fieldwork, J.A.J., L.L.P., S.M.M., All authors have read and agreed to the submitted version of manuscript.

Funding

This research was funded by the U.S. Fish and Wildlife Service, Division of Migratory Bird Management and U.S. Geological Survey, Wildlife Program of the Ecosystems Mission Area.

Institutional Review Board Statement

Sample collections were approved by Institutional Animal Care and Use Committees of the U.S. Fish and Wildlife Service, Alaska Department of Fish and Game (Alaska: IACUC #2008004, approved May 2008) and University of Alberta (Alberta: #AUP00001523).

Informed Consent Statement

Not applicable.

Data Availability Statement

The data used in the present study are accessioned in Sonsthagen et al. [55], NCBI Sequence Read Archive (BioProject PRJNA699594, Biosample accessions: SAMN17803887-SAMN17804091) and NCBI nucleotide database (MW574845-MW574901).

Acknowledgments

We thank Erin Bayne, Paulson Des Brisay, Matthew Brooks, Terry Chesser, Andrew Curtis, Niels Dau, Lucas DeCicco, David Evers, Carol Foss, April Harding-Scurr, David Loomis, Bruce Rodrigues, Pam Sinclair, David Shaw, Marian Snively, David Tessler, and James Wright for their critical contributions to sample collection. Sample collections in Alaska were approved by Institutional Animal Care and Use Committees of the U.S. Fish and Wildlife Service and Alaska Department of Fish and Game. This research used resources provided by the Core Science Analytics, Synthesis, and Libraries (CSASL) Advanced Research Computing (ARC) group at the U.S. Geological Survey. Any use of trade, product or firm names is for descriptive purposes only and does not imply endorsement by the US Government. The findings and conclusions in this article are those of the authors and do not necessarily represent the views of the USFWS. This article has been peer reviewed and approved for publication consistent with USGS Fundamental Science Practices.

Conflicts of Interest

The authors declare no conflict of interest.

References

  1. Johnson, A.R.; Wiens, J.A.; Milne, B.T.; Crist, T.O. Animal movements and population dynamics in heterogeneous landscapes. Landsc. Ecol. 1992, 7, 63–75. [Google Scholar] [CrossRef]
  2. Robbins, A.M.; Robbins, M.M. Fitness consequences of dispersal decisions for male mountain gorillas (Gorilla beringei beringei). Behav. Ecol. Sociobiol. 2005, 58, 295–309. [Google Scholar] [CrossRef]
  3. Frankham, R.; Ballou, J.D.; Briscoe, D.A. Introduction to Conservation Genetics; Cambridge University Press: Cambridge, UK, 2002. [Google Scholar]
  4. Keyghobadi, N. The genetic implications of habitat fragmentation for animals. Can. J. Zool. 2007, 85, 1049–1064. [Google Scholar] [CrossRef]
  5. Radespiel, U.; Bruford, M.W. Fragmentation genetics of rainforests animals: Insights from recent studies. Conserv. Genet 2014, 15, 245–260. [Google Scholar] [CrossRef]
  6. Oretgo, J.; Aguiree, M.P.; Noguerales, V.; Cordero, P.J. Consequences of extensive habitat fragmentation in landscape-level patterns of genetic diversity and structure in the Mediterranean esparto grasshopper. Evol. Appl. 2015, 8, 621–632. [Google Scholar] [CrossRef] [PubMed] [Green Version]
  7. de Villemeruil, P.; Rutschmann, A.; Lee, K.D.; Ewen, J.G.; Brekke, P.; Santure, A.W. Little adaptive potential in a threatened passerine bird. Curr. Biol. 2019, 29, 889–894. [Google Scholar] [CrossRef] [Green Version]
  8. Ouborg, N.J.; Vergeer, P.; Mix, C. The rough edges of the conservation genetics paradigm for plants. J. Ecol. 2006, 94, 1233–1248. [Google Scholar] [CrossRef]
  9. Leonardi, S.; Piovani, P.; Scalfi, M.; Piotti, A.; Giannini, R.; Menozzi, P. Effect of habitat fragmentation on the genetic diversity and structure of peripheral populations of beech in central Italy. J. Hered. 2012, 103, 408–417. [Google Scholar] [CrossRef] [PubMed] [Green Version]
  10. Stevens, K.; Harrisson, K.A.; Hogan, F.E.; Cooke, R.; Clarke, R.H. Reduced gene flow in a vulnerable species reflects two centuries of habitat loss and fragmentation. Ecosphere 2018, 9, e02114. [Google Scholar] [CrossRef] [Green Version]
  11. Ewers, R.M.; Didham, R.K. Confounding factors in the detection of species responses to habitat fragmentation. Biol. Rev. 2006, 81, 117–142. [Google Scholar] [CrossRef] [PubMed]
  12. Amos, J.N.; Bennett, A.F.; Mac Nally, R.; Newell, G.; Pavlova, A.; Radford, J.Q.; Thomson, J.R.; White, M.; Sunnucks, P. Predicting landscape-genetic consequences of habitat loss, fragmentation and mobility for multiple species of woodland birds. PLoS ONE 2012, 7, e30888. [Google Scholar] [CrossRef] [Green Version]
  13. Dharmarajan, G.; Beasley, J.C.; Fike, J.A.; Rhodes, O.E., Jr. Effects of landscape, demographic and behavioral factors on kin structure: Testing ecological predictions in a mesopredator with high dispersal capability. Anim. Conserv. 2014, 17, 225–234. [Google Scholar] [CrossRef]
  14. Lindsay, D.L.; Barr, K.R.; Lance, R.F.; Tweddale, S.A.; Hayden, T.J.; Leberg, P.L. Habitat fragmentation and genetic diversity of an endangered, migratory songbird, the golden-cheeked warbler (Dendroica chrysoparia). Mol. Ecol. 2008, 17, 2122–2133. [Google Scholar] [CrossRef]
  15. Ruegg, K.C.; Anderson, E.C.; Paxton, K.L.; Apkenas, V.; Lao, S.; Siegel, R.B.; DeSante, D.F.; Moore, F.; Smith, T.B. Mapping migration in a songbird using high-resolution genetic markers. Mol. Ecol. 2014, 23, 5726–5739. [Google Scholar] [CrossRef]
  16. Robertson, E.P.; Fletcher, R.J., Jr.; Cattau, C.E.; Udell, B.J.; Reichert, B.E.; Austin, J.D.; Valle, D. Isolating the roles of movement and reproduction on effective connectivity alters conservation priorities for an endangered bird. Proc. Natl. Acad. Sci. USA 2018, 115, 8591–8596. [Google Scholar] [CrossRef] [Green Version]
  17. Robertson, E.P.; Fletcher, R.J., Jr.; Austin, J.D.; Valle, D. The number of breeders explains genetic connectivity in an endangered bird. Mol. Ecol. 2019, 28, 2746–2756. [Google Scholar] [PubMed]
  18. Coulon, A.; Fitzpatrick, J.W.; Bowman, R.; Lovette, J.J. Effects of habitat fragmentation on effective dispersal of Florida scrub jays. Conserv. Biol. 2019, 24, 1080–1088. [Google Scholar] [CrossRef]
  19. Schindler, D.W.; Lee, P.G. Comprehensive conservation planning to protect biodiversity and ecosystem services in Canadian boreal regions under a warming climate and increasing exploitation. Biol. Conserv. 2010, 143, 1571–1586. [Google Scholar] [CrossRef]
  20. Wells, J.V. Chapter 1: Threats and conservation status. In Boreal Birds of North America: A Hemispheric View of Their Conservation Links and Significance; Studies in Avian Biology; Wells, J.V., Ed.; University of California Press: Berkeley, CA, USA, 2011; Volume 41, pp. 1–6. [Google Scholar]
  21. Wells, J.V.; Blancher, P.J. Global role for sustaining bird populations. In Boreal Birds of North America: A Hemispheric View of Their Conservation Links and Significance; Studies in Avian Biology; Wells, J.V., Ed.; University of California Press: Berkeley, CA, USA, 2011; Volume 41, pp. 7–22. [Google Scholar]
  22. Wells, J.; Stralberg, D.; Childs, D. Boreal Forest Refuge: Conserving North America’s Bird Nursery in the Face of Climate Change; Boreal Songbird Initiative: Seattle, WA, USA, 2018. [Google Scholar]
  23. Rosenberg, K.V.; Dokter, A.M.; Blancher, P.J.; Sauer, J.R.; Smith, A.C.; Smith, P.A.; Stanton, J.C.; Panjabi, A.; Helft, L.; Parr, M.; et al. Decline of the North American avifauna. Science 2019, 366, 120–124. [Google Scholar] [CrossRef]
  24. Soykan, C.U.; Sauer, J.; Schuetz, J.G.; LeBaron, G.S.; Dale, K.; Langham, G.M. Population trends for North American winter birds based on hierarchical models. Ecosphere 2016, 7, e01351. [Google Scholar] [CrossRef]
  25. Greenberg, R.; Droege, S. On the decline of the rusty blackbird and the use of ornithological literature to document long-term population trends. Conserv. Biol. 1999, 13, 553–559. [Google Scholar] [CrossRef] [Green Version]
  26. Greenberg, R.; Matsuoka, S.M. Rusty blackbird: Mysteries of a species in decline (Euphagus carolinus). Condor 2010, 112, 770–777. [Google Scholar] [CrossRef]
  27. Greenberg, R.; Demarest, D.W.; Matsuoka, S.M.; Mettke-Hofmann, C.; Evers, D.; Hamel, P.B.; Luscier, J.; Powell, L.L.; Shaw, D.; Avery, M.L.; et al. Understanding declines in rusty blackbirds. In Boreal Birds of North America: A Hemispheric View of Their Conservation Links and Significance; Studies in Avian Biology; Wells, J.V., Ed.; University of California Press: Berkeley, CA, USA, 2011; Volume 41, pp. 107–126. [Google Scholar]
  28. Edmonds, S.T.; Evers, D.C.; Cristol, D.A.; Mettke-Hofmann, C.; Powell, L.L.; McGann, A.J.; Armiger, J.W.; Lane, O.P.; Tessler, D.F.; Newell, P.; et al. Geographic and seasonal variation in mercury exposure of the declining rusty blackbird. Condor 2010, 112, 789–799. [Google Scholar] [CrossRef]
  29. Edmonds, S.T.; O’Driscoll, N.J.; Hillier, N.K.; Atwood, J.L.; Evers, D.C. Factors regulating the bioavailability of methylmercury to breeding rusty blackbirds in northeastern wetlands. Environ. Pollut. 2012, 171, 148–154. [Google Scholar] [CrossRef]
  30. Perkins, M.; Lane, O.P.; Evers, D.C.; Sauer, A.; Adams, E.M.; O’Driscoll, N.J.; Edmunds, S.T.; Jackson, A.K.; Hagelin, J.C.; Trimble, J.; et al. Historical patterns in mercury exposure for North American songbirds. Ecotoxicology 2020, 29, 1161–1173. [Google Scholar] [CrossRef]
  31. Wright, J.R.; Powell, L.L.; Tonra, C.M. Automated telemetry reveals staging behavior in a declining migratory passerine. Auk Ornithol. Adv. 2018, 135, 461–476. [Google Scholar] [CrossRef] [Green Version]
  32. Powell, L.L.; Hodgman, T.P.; Glanz, W.E.; Osenton, J.D.; Fisher, C.M. Nest-site selection and nest survival of the rusty blackbird: Does timber management adjacent to wetlands create ecological traps? Condor 2010, 112, 800–809. [Google Scholar] [CrossRef]
  33. McClure, C.J.W.; Rolek, B.W.; McDonald, K.; Hill, G.E. Climate change and the decline of a once common bird. Ecol. Evol. 2012, 2, 370–378. [Google Scholar] [CrossRef]
  34. Hamel, P.B.; De Stevens, D.; Leininger, T.; Wilson, R. Historical trends in rusty blackbird nonbreeding habitat in forested wetlands. In Proceedings of the 4th International Partners in Flight Conference, McAllen, TX, USA, 13–16 February 2008; Rich, T., Arizmendi, C., Thompson, C., Demarest, D., Eds.; Partners in Flight, 2009; pp. 341–353. [Google Scholar]
  35. Hobson, K.A.; Greenberg, R.; Van Wilgenburg, S.L.; Mettke-Hofmann, C. Migratory connectivity in the rusty blackbird: Isotopic evidence from feathers of historical and contemporary specimens. Condor 2010, 112, 778–788. [Google Scholar] [CrossRef] [Green Version]
  36. Johnson, J.A.; Matsuoka, S.M.; Tessler, D.F.; Greenberg, R.; Fox, J.W. Identifying migratory pathways used by rusty blackbirds breeding in southcentral Alaska. Wilson J. Ornithol. 2012, 124, 698–703. [Google Scholar] [CrossRef]
  37. Burleigh, T.D.; Peters, H.S. Geographic variation in Newfoundland birds. Proc. Biol. Soc. Wash. 1948, 61, 111–126. [Google Scholar]
  38. Dyke, A.S. Late Quaternary vegetation history of northern North America based on pollen, macrofossil, and faunal remains. Geogr. Phys. Quatern. 2005, 59, 211–262. [Google Scholar]
  39. Shafer, A.B.A.; Cullingham, C.I.; Cote, S.D.; Coltman, D.W. Of glaciers and refugia: A decade of study sheds new light on the phylogeography of northwestern North America. Mol. Ecol. 2010, 19, 4589–4621. [Google Scholar] [CrossRef]
  40. Sonsthagen, S.A.; Talbot, S.L.; Scribner, K.T.; McCracken, K.G. Multilocus phylogeography and population structure of common eiders breeding in North America and Scandinavia. J. Biogeogr. 2011, 38, 1368–1380. [Google Scholar] [CrossRef]
  41. van Els, P.; Cicero, C.; Klicka, J. High latitudes and high genetic diversity: Phylogeography of a widespread boreal bird, the gray jay (Perisoreus canadensis). Mol. Phylogenet. Evol. 2012, 63, 456–465. [Google Scholar] [CrossRef] [PubMed]
  42. Lait, L.A.; Burg, T.M. When east meets west: Population structure of high-latitude resident species, the boreal chickadee (Poecile hudsonicus). Heredity 2013, 111, 321–329. [Google Scholar] [CrossRef] [PubMed] [Green Version]
  43. Hewitt, G.M. Genetic consequences of climatic oscillations in the Quaternary. Philos. Trans. R. Soc. B Biol. Sci. 2004, 359, 183–195. [Google Scholar] [CrossRef] [Green Version]
  44. Dohms, K.M.; Graham, B.A.; Burg, T.M. Multilocus genetic analysis and spatial modeling reveal complex population structure and history in a widespread resident North American passerine (Perisoreus canadensis). Ecol. Evol. 2017, 7, 9869–9889. [Google Scholar] [CrossRef] [Green Version]
  45. Colbeck, G.J.; Gibbs, H.L.; Marra, P.P.; Hobson, K.; Webster, M.S. Phylogeography of a widespread North American migratory songbird (Setophaga ruticilla). J. Hered. 2008, 99, 453–463. [Google Scholar] [CrossRef] [Green Version]
  46. Ralston, J.; Kirchman, J.J. Continent-scale genetic structure in a boreal forest migrant, the blackpoll warbler (Setophaga striata). Auk 2012, 129, 467–478. [Google Scholar]
  47. Lovette, I.J. Glacial cycles and the tempo of avian speciation. Trends Ecol. Evol. 2005, 20, 57–59. [Google Scholar] [CrossRef]
  48. Zamudio, K.R.; Bell, R.C.; Mason, N.A. Phenotypes in phylogeography: Species’ traits, environmental variation, and vertebrate diversification. Proc. Natl. Acad. Sci. USA 2016, 113, 8041–8048. [Google Scholar] [CrossRef] [PubMed] [Green Version]
  49. Cote, J.; Bestion, E.; Jacob, S.; Travis, J.; Legrand, D.; Baguette, M. Evolution of dispersal strategies and dispersal syndromes in fragmented landscapes. Ecography 2017, 40, 56–73. [Google Scholar] [CrossRef]
  50. Cayuela, H.; Rougemont, Q.; Prunier, J.G.; Soore, J.-S.; Clobert, J.; Besnard, A.; Bernatchez, L. Demographic and genetic approaches to study dispersal in wild animal populations: A methodological review. Mol. Ecol. 2018, 27, 3976–4010. [Google Scholar] [CrossRef]
  51. Cornelius, C.; Awade, M.; Cândia-Gallardo, C.; Sieving, K.E.; Metzger, J.P. Habitat fragmentation drives inter-population variation in dispersal behavior in a Neotropical rainforest bird. Perspect. Ecol. Conserv. 2017, 15, 3–9. [Google Scholar] [CrossRef]
  52. Avery, M.L. Rusty blackbird (Euphagus carolinus), Version 1.0. In Birds of the World; Poole, A.F., Ed.; Cornell Lab of Ornithology: Ithaca, NY, USA, 2020. [Google Scholar]
  53. Stralberg, D.; Matsuoka, S.M.; Handel, C.M.; Bayne, E.M.; Schmiegelow, F.K.A.; Hamman, A. Biogeography of boreal passerine range dynamics in western North America: Past, present, and future. Ecography 2017, 40, 1050–1066. [Google Scholar] [CrossRef]
  54. DaCosta, J.M.; Sorenson, M.D. Amplification biases and consistent recovery of loci in a double-digest RAD-seq protocol. PLoS ONE 2014, 9, e106713. [Google Scholar] [CrossRef] [PubMed]
  55. Sonsthagen, S.A.; Wilson, R.E.; Matsuoka, S.M.; Johnson, J.A.; Demarest, D.W.; Stralberg, D.; Powell, L.L. Rusty blackbird (Euphagus carolinus) genetic data, North America. U.S. Geological Survey Data Release. 2021. [Google Scholar] [CrossRef]
  56. BU-RAD-seq ddRAD-seq Pipeline. Available online: http://github.com/BU-RAD-seq/ddRAD-seq-Pipeline (accessed on 30 June 2020).
  57. Edgar, R.C. Search and clustering orders of magnitude faster than BLAST. Bioinformatics 2010, 26, 2460–2461. [Google Scholar] [CrossRef] [Green Version]
  58. Altschul, S.F.; Gish, W.; Miller, W.; Myers, W.E.; Lipman, D.J. Basic local alignment search tool. J. Mol. Biol. 1990, 2015, 403–410. [Google Scholar] [CrossRef]
  59. Edgar, R.C. MUSCLE: Multiple sequence alignment with high accuracy and high throughput. Nucleic Acids Res. 2004, 32, 1792–1797. [Google Scholar] [CrossRef] [PubMed] [Green Version]
  60. Lavretsky, P.; DaCosta, J.M.; Hernández-Baños, B.E.; Engils, A., Jr.; Sorenson, M.D.; Peters, J.L. Speciation genomics and a role for the Z chromosome in the early stages of divergence between Mexican ducks and mallards. Mol. Ecol. 2015, 25, 661–674. [Google Scholar] [CrossRef]
  61. Dufort, M.J.; Barker, F.K. Range dynamics, rather than convergent selection, explain the mosaic distribution of red-winged blackbird phenotypes. Ecol. Evol. 2013, 3, 4910–4924. [Google Scholar] [CrossRef]
  62. Sonsthagen, S.A.; Talbot, S.L.; McCracken, K.G. Genetic characterization of common eiders (Somateria mollissima) breeding on the Yukon-Kuskokwim Delta, Alaska. Condor 2007, 109, 879–894. [Google Scholar] [CrossRef]
  63. BU-RAD-Seq Out-Conversions. Available online: http://github.com/BU-RAD-seq/Out-Conversions (accessed on 30 June 2020).
  64. Schneider, S.; Roessli, D.; Excoffier, L. ARLEQUIN Version 2.0: A Software for Population Genetic Analyses; Genetics and Biometry Laboratory, University of Geneva: Geneva, Switzerland, 2000. [Google Scholar]
  65. Fu, Y.X. Statistical tests of neutrality of mutations against population growth, hitchhiking and background selections. Genetics 1997, 147, 915–925. [Google Scholar] [CrossRef]
  66. Tajima, F. The effect of change in population size on DNA polymorphism. Genetics 1989, 123, 597–601. [Google Scholar] [CrossRef]
  67. Bandelt, H.J.; Forster, P.; Sykes, B.C.; Richards, M.B. Mitochondrial portraits of human populations. Genetics 1995, 152, 743–753. [Google Scholar] [CrossRef]
  68. Tamura, K.; Nei, M. Estimation of the number of nucleotide substitutions in the control region of the mitochondrial DNA in humans and chimpanzees. Mol. Biol. Evol. 1993, 10, 512–526. [Google Scholar] [PubMed]
  69. Petkova, D.; Novembre, J.; Stephens, M. Visualizing spatial population structure with estimated effective migration surfaces. Nat. Genet. 2016, 48, 94–100. [Google Scholar] [CrossRef] [Green Version]
  70. Dray, S.; Dufour, A.-B. The ade4 package: Implementing the duality diagram for ecologists. J. Stat. Softw. 2007, 22, 1–20. [Google Scholar] [CrossRef] [Green Version]
  71. Jombart, T. adegent: An R package for the multivariate analysis of genetic markers. Bioinfomatics 2008, 24, 1403–1405. [Google Scholar] [CrossRef] [Green Version]
  72. Alexander, D.H.; Novembre, J.; Lange, K. Fast model-based estimation of ancestry in unrelated individuals. Genome Res. 2009, 19, 1655–1664. [Google Scholar] [CrossRef] [PubMed] [Green Version]
  73. Alexander, D.H.; Lange, K. Enhancements to the ADMIXTURE algorithm for individual ancestry estimation. BMC Bioinfomatics 2011, 12, 246. [Google Scholar] [CrossRef] [Green Version]
  74. Purcell, S.; Neale, B.; Todd-Brown, K.; Thomas, L.; Ferreira, M.A.; Bender, D.; Maller, J.; Sklar, P.; de Bakker, P.I.W.; Daly, M.J.; et al. PLINK: A toolset for whole-genome association and population-based linkage analysis. Am. J. Hum. Genet. 2007, 81, 559–575. [Google Scholar] [CrossRef] [Green Version]
  75. Alexander, D.H.; Novembre, J.; Lange, K. Admixture 1.22 Software Manual; Cold Spring Harbor Lab: New York, NY, USA, 2012. [Google Scholar]
  76. Zhou, H.; Alexander, D.; Lange, K. A quasi-Newton acceleration for high-dimensional optimization algorithms. Stat. Comput. 2011, 21, 261–273. [Google Scholar] [CrossRef] [PubMed] [Green Version]
  77. Jakobsson, M.; Rosenberg, N.A. CLUMPP: A cluster matching and permutation program for dealing with label switching and multimodality in analysis of population structure. Bioinformatics 2007, 23, 1801–1806. [Google Scholar] [CrossRef] [Green Version]
  78. Francis, R.M. Pophelper: An R package and web app to analyse and visualize population structure. Mol. Ecol. Resour. 2017, 17, 27–32. [Google Scholar] [CrossRef] [Green Version]
  79. Malinksy, M.; Trucchi, E.; Lawson, D.J.; Falush, D. RADpainter and fineRADstructure: Population inference from RADseq data. Mol. Biol. Evol. 2018, 35, 1284–1290. [Google Scholar]
  80. fineRADstructure. Available online: http://cichlid.gurdon.cam.ac.uk/fineRADstructure.html (accessed on 30 June 2020).
  81. EEMS. Available online: https://github.com/dipetkov/eems (accessed on 30 June 2020).
  82. Google Maps API v3 Tool. Available online: http://www.birdtheme.org/useful/v3tool.html (accessed on 30 June 2020).
  83. Do, C.; Waples, R.S.; Peel, D.; Macbeth, G.M.; Tillett, B.J.; Ovenden, J.R. NeEstimator v2: Re-implementation of software for the estimation of contemporary effective population size (Ne) from genetic data. Mol. Ecol. Resour. 2014, 14, 209–214. [Google Scholar] [CrossRef]
  84. Waples, R.S.; Do, C. LDNE: A program for estimating effective population size from data on linkage disequilibrium. Mol. Ecol. Resour. 2008, 8, 753–756. [Google Scholar] [CrossRef] [Green Version]
  85. Luikart, G.; Ryman, N.; Tallmon, D.A.; Schwartz, M.K.; Allendorf, F.W. Estimation of census and effective population sizes: The increasing usefulness of DNA-based approaches. Conserv. Genet. 2010, 11, 355–373. [Google Scholar] [CrossRef]
  86. Nomura, T. Estimation of effective number breeders from molecular coancestry of single cohort sample. Evol. Appl. 2008, 1, 462–474. [Google Scholar] [CrossRef]
  87. Waples, R.S.; England, P.R. Estimating contemporary effective population size on the basis of linkage disequilibrium in the face of migration. Genetics 2011, 189, 633–644. [Google Scholar] [CrossRef] [Green Version]
  88. Elith, J.; Leathwick, J.R.; Hastie, T. A working guide to boosted regression trees. J. Anim. Ecol. 2008, 77, 802–813. [Google Scholar] [CrossRef] [PubMed]
  89. Stralberg, D.; Matsuoka, S.M.; Hamann, A.; Bayne, E.M.; Sólymos, P.; Schmiegelow, F.K.A.; Wang, X.; Cumming, S.G.; Song, S.J. Projecting boreal bird responses to climate change: The signal exceeds the noise. Ecol. Appl. 2015, 25, 52–69. [Google Scholar] [CrossRef] [Green Version]
  90. Wang, T.; Hamann, A.; Spittlehouse, D.L.; Murdock, T.Q. ClimateWNA—high-resolution spatial climate data for western North America. J. Appl. Meteorol. Climatol. 2012, 51, 16–29. [Google Scholar] [CrossRef] [Green Version]
  91. Hogg, E.H. Temporal scaling of moisture and the forest-grassland boundary in western Canada. Agric. For. Meteorol. 1997, 84, 115–122. [Google Scholar] [CrossRef] [Green Version]
  92. Roberts, D.R.; Hamann, A. Predicting potential climate change impacts with bioclimate envelope models: A palaeoecological perspective. Glob. Ecol. Biogeogr. 2012, 21, 121–133. [Google Scholar] [CrossRef]
  93. Waples, R.S.; Do, C. Linage disequilibrium estimates of contemporary Ne using highly variable genetic markers: A largely untapped resource for applied conservation and evolution. Evol. Appl. 2010, 3, 244–262. [Google Scholar] [CrossRef]
  94. CEC. Ecological Regions of North America: Toward a Common Perspective; Commission for Environmental Cooperation: Montreal, QC, Canada, 1997; 60p. [Google Scholar]
  95. Ehlers, J.; Gibbard, P.L.; Hughes, P.D. (Eds.) Quaternary Glaciations—Extent and Chronology; Elsevier: Amsterdam, The Netherlands, 2011; 1108p. [Google Scholar]
  96. LGM Glaciation Extends. Available online: https://crc806db.uni-koeln.de/layer/show/6 (accessed on 18 February 2021).
  97. Dyke, A.S. An outline of North American deglaciation with emphasis on central and northern Canada. In Quaternary Glaciations—Extent and Chronology, Part II: North America, Developments in Quaternary Science; Ehlers, J., Gibbard, P.L., Eds.; Elsevier: Amsterdam, The Netherlands, 2004; Volume 2b, pp. 373–424. [Google Scholar]
  98. Johnson, N.K.; Cicero, C. New mitochondrial DNA data affirm the importance of Pleistocene speciation in North American birds. Evolution 2004, 58, 1122–1130. [Google Scholar] [CrossRef] [PubMed]
  99. Weir, J.; Schluter, D. Ice sheets promote speciation in boreal birds. Proc. R. Soc. Lond. B Biol. Sci. 2004, 271, 1881–1887. [Google Scholar] [CrossRef] [Green Version]
  100. Boulet, M.; Gibbs, H.L.; Hobson, K.A. Integrated analysis of genetic, stable isotope, and banding data reveal migratory connectivity and flyways in the northern yellow warbler (Dendroica petechia; Aestiva group). Ornithol. Monogr. 2006, 61, 29–78. [Google Scholar] [CrossRef]
  101. Bay, R.A.; Harrigan, R.J.; Underwood, V.L.; Gibbs, H.L.; Smith, T.B.; Ruegg, K. Genomic signals of selection predict climate-driving population declines in a migratory bird. Science 2018, 359, 83–86. [Google Scholar] [CrossRef] [Green Version]
  102. Irwin, D.E.; Irwin, J.H.; Smith, T.B. Genetic variation and seasonal migratory connectivity in Wilson’s warblers (Wilsonia pusilla): Species-level differences in nuclear DNA between western and eastern populations. Mol. Ecol. 2011, 20, 3102–3115. [Google Scholar] [CrossRef] [PubMed]
  103. Graham, B.A.; Carpenter, A.M.; Friesen, V.L.; Burg, T.M. A comparison of neutral genetic differentiation and genetic diversity among migratory and resident populations of golden-crowned kinglets (Regulus satrapa). J. Ornithol. 2020, 161, 509–519. [Google Scholar] [CrossRef]
  104. Gérardi, S.; Jaramillo-Correa, J.P.; Beaulieu, J.; Bousquet, J. From glacial refugia to modern populations: New assemblages of organelle genomes generated by differential cytoplasmic gene flow in transcontinental black spruce. Mol. Ecol. 2010, 19, 5265–5280. [Google Scholar] [CrossRef]
  105. Matsuoka, S.M.; Shaw, D.; Sinclair, P.H.; Johnson, J.A.; Corcoran, R.M.; Dau, N.C.; Meyers, P.M.; Rojek, N.A. Nesting ecology of Rusty Blackbirds in Alaska and Canada. Condor 2010, 112, 810–824. [Google Scholar] [CrossRef]
  106. Jaramillo-Correa, J.P.; Beaulieu, J.; Bousquet, J. Variation in mitochondrial DNA reveals multiple distant glacial refugia in black spruce (Picea mariana), a transcontinental North American conifer. Mol. Ecol. 2004, 13, 2735–2747. [Google Scholar] [CrossRef] [PubMed]
  107. Roberts, D.R.; Hamann, A. Glacial refugia and modern genetic diversity of 22 western North American tree species. Proc. R. Soc. B 2015, 282, 2014–2903. [Google Scholar] [CrossRef] [PubMed] [Green Version]
  108. Hewitt, G.M. The genetic legacy of the Quaternary ice ages. Nature 2000, 405, 907–913. [Google Scholar] [CrossRef] [PubMed]
  109. Hewitt, G.M. Some genetic consequences of ice ages, and their role in divergence and speciation. Biol. J. Linn. Soc. 1996, 58, 247–276. [Google Scholar] [CrossRef]
  110. Macfarlane, C.B.A.; Natola, L.; Brown, M.W.; Burg, T.M. Population genetic isolation and limited connectivity in the purple finch (Haemorphous purpureus). Ecol. Evol. 2016, 6, 8304–8317. [Google Scholar] [CrossRef] [PubMed] [Green Version]
  111. FitzGerald, A.M.; Whitaker, D.M.; Ralston, J.; Kirchman, J.J.; Warkentin, I.G. Taxonomy and distribution of the imperilled Newfoundland gray-cheeked thrush, Catharus minimus minimus. Avian Conserv. Ecol. 2017, 12, 10. [Google Scholar] [CrossRef] [Green Version]
  112. Hindley, J.; Graham, B.A.; Burg, T.M. Pleistocene glacial cycles and physical barriers influence phylogeographic structure in black-capped chickadees (Poecile atricapillus), a widespread North American passerine. Can. J. Zool. 2018, 96, 1366–1377. [Google Scholar] [CrossRef] [Green Version]
  113. Friis, G.; Aleixandre, P.; Rodríguez-Estrella, R.; Navarro-Sigüenza, A.G.; Milá, B. Rapid postglacial diversification and long-term stasis within the songbird genus Junco: Phylogeographic and phylogenomic evidence. Mol. Ecol. 2016, 25, 6175–6195. [Google Scholar] [CrossRef] [Green Version]
  114. Ruegg, K. Genetic, morphological, and ecological characterization of a hybrid zone that spans a migratory divide. Evolution 2008, 62, 452–466. [Google Scholar] [CrossRef]
  115. Delmore, K.E.; Fox, J.W.; Irwin, D.E. Dramatic intraspecific differences in migratory routes, stopover sites and wintering areas, revealed using light-level geolocators. Proc. R. Soc. B 2012, 279, 4582–4589. [Google Scholar] [CrossRef] [PubMed] [Green Version]
  116. Delmore, K.E.; Irwin, D.E. Hybrid songbirds employ intermediate routes in a migratory divide. Ecol. Lett. 2014, 17, 1211–1218. [Google Scholar] [CrossRef]
  117. Cohen, E.B.; Rushing, C.R.; Moore, F.R.; Hallworth, M.T.; Hostetler, J.A.; Ramirez, M.G.; Marra, P.P. The strength of migratory connectivity for birds en route to breeding through the Gulf of Mexico. Ecography 2019, 42, 658–669. [Google Scholar] [CrossRef] [Green Version]
  118. Machtans, C.S.; Van Wilgenburg, S.L.; Armer, L.A.; Hobson, K.A. Retrospective comparison of the occurrence and abundance of rusty blackbird in the Mackenzie Valley, Northwest Territories. Avian Conserv. Ecol. 2007, 2, 3. [Google Scholar] [CrossRef] [Green Version]
  119. Belisle, M.; Desrochers, A.; Fortin, M.J. Influence of forest cover on the movements of forest birds: A homing experiment. Ecology 2001, 82, 1893–1904. [Google Scholar]
  120. Matthysen, E.; Adriaensen, F.; Dhondt, A.A. Dispersal of nuthatches, Sitta europaea, in a highly fragmented forest habitat. Oikos 1995, 72, 375–381. [Google Scholar] [CrossRef]
  121. Matthysen, E.; Currie, D. Habitat fragmentation reduces disperser success in juvenile Sitta europaea: Evidence from patterns of territory establishment. Ecography 1996, 19, 67–72. [Google Scholar] [CrossRef]
  122. Stralberg, D.; Berteaux, D.; Drever, C.R.; Drever, M.; Naujokaitis-Lewis, I.; Schmiegelow, F.K.A.; Tremblay, J.A. Conservation planning for boreal birds in a changing climate: A framework for action. Avian Conserv. Ecol. 2019, 14, 13. [Google Scholar] [CrossRef]
  123. Rehfeldt, G.E.; Crookston, N.L.; Sáenz-Romero, C.; Campbell, E.M. North American vegetation model for land-use planning in a changing climate: A solution to large classification problems. Ecol. Appl. 2012, 22, 119–141. [Google Scholar] [CrossRef] [PubMed]
  124. Bateman, B.L.; Taylor, L.; Wilsey, C.; Wu, J.; LeBaron, G.S.; Langham, G. Risk to North American birds from climate change-related threats. Conserv. Sci. Pract. 2020, 2, e243. [Google Scholar] [CrossRef]
  125. Bateman, B.L.; Wilsey, C.; Taylor, L.; Wu, J.; LeBaron, G.S.; Langham, G. North American birds require mitigation and adaptation to reduce vulnerability to climate change. Conserv. Sci. Pract. 2020, 2, e242. [Google Scholar] [CrossRef]
  126. Fitzpatrick, M.C.; Keller, S.R. Ecological genomics meets community-level modelling of biodiversity: Mapping the genomic landscape of current and future environmental adaptation. Ecol. Lett. 2015, 18, 1–16. [Google Scholar] [CrossRef]
  127. Greenberg, R.S. Bye bye blackbird: Rusty blackbirds are vanishing from our southern swamps and northern forests. Zoogoer 2008, 37, 11–15. [Google Scholar]
  128. Rushing, C.S.; Ryder, T.B.; Marra, P.P. Quantifying drivers of population dynamics for a migratory bird throughout the annual cycle. Proc. R. Soc. B 2016, 283, 20152846. [Google Scholar] [CrossRef]
  129. Rushing, C.S.; Hostetler, J.A.; Sillett, T.S.; Marra, P.P.; Rotenberg, J.A.; Ryder, T.B. Spatial and temporal drivers of avian population dynamics across the annual cycle. Ecology 2017, 98, 2837–2850. [Google Scholar] [CrossRef]
  130. Williams, C.K.; Castelli, P.M. 2012. A historical perspective of the connectivity between waterfowl research and management. In Wildlife Science: Connecting Research with Management; Sands, J.P., Brennan, L.A., DeMaso, S.J., Schnupp, M.J., Eds.; CRC Press: Boca Raton, FL, USA, 2012; pp. 155–178. [Google Scholar]
Figure 1. Nesting distribution of rusty blackbirds with sampling locations color-coded and numbered (see Table 1). We note that location 13 (white circle) includes sample locations in Vermont and New Hampshire, USA, and location 12 (grey circle) includes both Nova Scotia and New Brunswick, Canada. The scatter plots are of the first two principal components plotted for haplotypic data, with the proportion of variance explained, from 6205 autosomal and 231 Z-linked loci (males only, because principal components analysis (PCA) does not accommodate heterogamy).
Diversity 13 00103 g001
Figure 2. Pairwise ΦST (above diagonal) and FST (below diagonal) for mtDNA control region (A) and pairwise ΦST estimate for 6205 autosomal loci (above diagonal) and 231 Z loci (below diagonal (B). Darker colors indicate higher values. The northeastern region where higher levels of genetic differentiation were found is outlined.
Diversity 13 00103 g002
Figure 3. Unrooted mitochondrial DNA haplotype median-joining network for rusty blackbirds. Size of circle is proportional to the frequency of each haplotype observed.
Diversity 13 00103 g003
Figure 4. Population assignment analysis using the program (A) Admixture and (B) fineRADstructure. Average assignment probabilities for K = 2 inferred from bi-allelic single nucleotide polymorphisms in ADMIXTURE. FineRADStructure co-ancestry matrix indicating pairwise genetic similarity between individuals. Inferred populations are indicated by clustering in accompanying dendrogram and locations are indicated by color blocks for general region (solid blocks on right, color was chosen based on locale making up highest proportion of cluster) and by individual (single bars at left). Colors correspond to sampling locations indicated in Figure 1. Co-ancestry values were capped at 60 for illustrative purposes as only a few comparisons were above that value (see Supplementary Figure S2).
Diversity 13 00103 g004
Figure 5. The estimated effective migration surfaces between all sampling locales (black circles) for deme size 250. White areas indicate gene flow rates consistent with isolation by distance expectations whereas shaded areas have dispersal rates that are higher (blue, corridors) or lower (orange, barriers) than expected under isolation-by-distance (IBD). We note that orange area around the Yukon Territory sampling location showed opposite pattern when deme size was lower than 250 (higher than average gene flow rate). For all other areas deme size did not change results.
Diversity 13 00103 g005
Figure 6. Effective population size (Ne) estimates as a function of excluding rare alleles (Pcrit) in rusty blackbirds sampled across their North American distribution. Point estimates of Ne are log transformed with values >5 signifying infinitely large estimates. Colors correspond to Figure 1.
Diversity 13 00103 g006
Figure 7. Predictions of current breeding density (left) versus hindcasted paleo-breeding densities of rusty blackbirds (based on [53]. Paleo-breeding densities were hindcasted by fitting models of current rusty blackbird density with bioclimatic indices downscaled by Roberts and Hamann [92] for the last glacial maximum (21,000 YBP) using two global climate models: Community Climate Model (CCM1, middle) and Geophysical Fluid Dynamics Laboratory (GFDL, right). Model-predicted density values range from 0 to 1.4 pairs/ha. Overlaid on hindcast projections are level 1 ecoregion boundaries in black [94] and the extent of Last Glacial Maximum (LGM) ice sheets in transparent gray [95,96].
Diversity 13 00103 g007
Table 1. Indices of genetic diversity for rusty blackbirds sampled across their North American nesting distribution. Descriptive statistics are listed by marker type (ddRAD autosomal and Z-linked loci, and mtDNA control region) and include nucleotide diversity (π: autosomal [A], z-linked [Z]), effective population size (Ne) based on the molecular co-ancestry method, number of haplotypes (H), haplotype diversity (h) along with sample size (n). Locations are listed west to east. Single standard deviation and 95% confidence limits are in parentheses. Significant values are indicated by asterisks. Refer to Figure 1 for location numbers.
LocationddRADmtDNA
π − Aπ − ZNenHπhFsDn
1Bethel, Alaska, USA0.00650.0041640.0046
(0.0033)
0.867
(0.129)
0.3−0.46
2Anchorage, Alaska, USA0.00690.004846.7
(38.5–55.7)
24130.0050
(0.0031)
0.899
(0.046)
−5.1*−1.224
3Cordova, Alaska, USA0.00650.0045620.0012
(0.0013)
0.333
(0.215)
1.6−1.16
4Tanana, Alaska, USA0.00670.0048940.0022
(0.0017)
0.694
(0.147)
0.0−0.89
5Tetlin NWR, Alaska, USA0.00700.004948.7
(36.6–62.5)
30140.0038
(0.0025)
0.893
(0.040)
−6.3*−1.431
6Yukon Flats, Alaska, USA0.00700.004921.3
(18.4–24.5)
25150.0048
(0.0030)
0.952
(0.029)
−9.2*−0.822
7Yukon Territory, Canada0.00580.0043430.0034
(0.0029)
0.833
(0.222)
0.01.14
8Alberta, Canada0.00690.004826.5
(23.5–29.7)
21120.0039
(0.0025)
0.922
(0.035)
−5.8*−1.122
9Manitoba, Canada0.00660.0048770.0063
(0.0042)
1.000
(0.076)
−3.6*−0.47
10Ontario, Canada0.00700.004841.3
(33.9–49.3)
23150.0036
(0.0024)
0.949
(0.028)
−11.6*−1.223
11Newfoundland, Canada0.00620.003719.1
(16.7–21.6)
1040.0040
(0.0027)
0.691
(0.128)
0.9−0.411
12Nova Scotia/New Brunswick, Canada0.00610.0040570.0069
(0.0045)
1.000
(0.076)
−3.8*0.17
13New Hampshire/Vermont, USA0.00680.004622.4
(19.4–25.6)
28130.0047
(0.0029)
0.878
(0.041)
−5.2*−0.328
All populations0.00610.0050198200
Publisher’s Note: MDPI stays neutral with regard to jurisdictional claims in published maps and institutional affiliations.

