Article

Prediction of Sites with a High Probability of Wild Mammal Roadkill Using a Favourability Function

by
Hugo Ignacio Coitiño
1,2,3,*,
Marcel Achkar
3 and
José Carlos Guerrero
3,*
1
NGO Ecología y Conservación de la Biodiversidad de Uruguay (ECOBIO Uruguay), Montevideo C.P. 11000, Uruguay
2
Dirección Nacional de Biodiversidad y Servicios Ecosistémicos, Ministerio de Ambiente, Montevideo C.P. 11100, Uruguay
3
Laboratorio de Desarrollo Sustentable y Gestión Ambiental del Territorio, Facultad de Ciencias, Universidad de la República, Montevideo C.P. 11400, Uruguay
*
Authors to whom correspondence should be addressed.
Diversity 2021, 13(11), 585; https://doi.org/10.3390/d13110585
Submission received: 29 September 2021 / Revised: 12 November 2021 / Accepted: 15 November 2021 / Published: 17 November 2021

Abstract

:
Roads are one of the main causes of loss of biodiversity, with roadkill one of the main causes of mortality. The aim of this research was to identify sites with a high probability of roadkill of medium and large mammals, and the environmental variables that would explain it. We used the favourability function (F) to build the predictive models. There were 57 explanatory variables, and we collected 685 records of 10 species of medium and large native wild mammals from the ECOBIO Uruguay databases. They were grouped into native forest and grassland species, according to the main habitat. Two models were developed, one with all the variables and one with the anthropogenic variables. For both groups, the model obtained with all the variables was the most significant according to the evaluation indices used. This made it possible to identify the hot spots of roadkill (F > 0.6) for each of the groups. The anthropic variables were the ones that best explained these hot spots. This allowed the identification of sites where the probability of roadkill is high and requires a monitoring plan to implement mitigation measures in the future.

1. Introduction

Road systems generate changes in the landscape and in the territory, causing direct and indirect effects on the structure and composition of ecosystems. Some of these effects include, but are not limited to, animal roadkill, barrier effect, edge effect, dispersion of exotic species, changes in microclimates, contamination of water resources, and fragmentation of ecosystems [1,2,3,4,5,6,7]. As a consequence of the above, the loss of biodiversity has significantly increased, with vertebrate species being the most affected [6,7,8,9,10].
Of the vertebrates, large mammals are among the taxa most vulnerable to the impact of roads, since they generally present low values in both abundance and reproductive rate, and they also have large territories of occupation, travelling long distances during their life cycle [2].
Research related to the impacts of roads on biodiversity began in developed countries in the Northern Hemisphere (e.g., [9,10,11,12,13]). In Latin America, these studies are very few in number, and recently, Brazil was the first country where research on this subject was conducted [2,4,14,15,16]. In Uruguay, in 2015, the Civil Association ECOBIO Uruguay, composed of researchers, began to research this problem, generating baseline information on the presence of roadkill [17,18]. A study conducted by the NGO Vida Silvestre in 1999, in which the presence of roadkill on a main road in Uruguay was surveyed [19,20], provided a precedent in this area.
To reduce the impact of road network infrastructure on wildlife, several mitigation measures have been implemented worldwide, including wildlife crossings and signage [6,7,10,16]. In order to implement such measures, it is important to accurately identify the sites where mitigation measures should be carried out. However, it is difficult to determine these precisely, since it is necessary to collect field information, which carries a high cost. One way to overcome this difficulty is to use mathematical models to identify those sites where conditions for wildlife roadkill are present [21,22].
In recent decades, there has been an increase in the use of mathematical algorithms to model various spatial processes [18,21,22,23,24], including the favourability function [25,26,27]. For this, explanatory variables that can be grouped into climatic, anthropic, and geographical factors [28] related to the phenomenon to be modelled, such as roadkill, are used. In the case of the favourability function, it had not yet been used to identify and predict the sites where the conditions for roadkill occur.
Based on the aforementioned points, in this work we used favourability as a tool to identify the sites with favourable conditions for roadkill of medium and large mammals in the Eastern region of Uruguay. In addition, predictive models of roadkill were generated and the most important environmental variables that explain roadkill were determined.

2. Materials and Methods

2.1. Study Area

The present work was carried out in the Eastern region of Uruguay, covering the ecoregions of Sierras del Este and Graben de la Laguna Merín (departments of Maldonado, Rocha, Treinta y Tres, Lavalleja, and Cerro Largo, Uruguay) reaching an area of about 3,672,457 ha (9,074,839 acres) (Figure 1) [29]. This region presents a wide heterogeneity of ecosystems (wetlands, natural forests, coastal zone, natural grasslands, and diverse crops), a great diversity of species, and concentrates the largest number of national protected areas and international reserves such as the Ramsar sites [30].
With respect to biodiversity, the Graben de la Laguna Merín ecoregion features a richness of 57 species of mammals, of which 8 are classified as indicator species of that ecoregion [29], whereas the Sierras del Este ecoregion features a richness of 56 species of mammals, 3 of which are indicators of the same [29].

2.2. Collection of Roadkill Data

The surveys were completed on the main roads with high vehicular traffic (Annual average daily traffic of 134,487 vehicles) (Figure 1), where several routes connecting the main tourist areas of the country converge.
The study area covered an extension of ca. 1000 km in the Eastern region. Sampling campaigns were carried out every two months during one year (from July 2015 to June 2016). Each road was travelled in both directions by vehicle at a speed of 60 km/h (37 miles/h) [31] where all roadkill were georeferenced and photographically recorded. Once the animal was registered, it was removed from the road so as not to be recorded again in subsequent trips. Should the animal fail to be removed, it was marked with a coloured spray.
The data collected in the field were digitized and then spatialized using the open access Geographic Information System (GIS) QGIS 3.10 [32].
Then, the records obtained in the period 2017–2019 were used to validate the models generated. For this, records obtained through citizen science and the NGO ECOBIO Uruguay during that period were compiled and the abundance of roadkill per square kilometre was calculated.

2.3. Model Preparation

In order to prepare the models, we used a grid mesh made up of 177,708 cells measuring 1 km², which covered the entire national territory. It was created by the Laboratory of Sustainable Development and Environmental Management of the Territory (Laboratorio de Desarrollo Sustentable y Gestión Ambiental del Territorio, LDSGAT, Montevideo, Uruguay) of the School of Sciences and included 55 environmental variables (Supplementary Materials Tables S1 and S2). Before modelling, this grid was cropped for the study area using the QGIS 3.10 software.

2.3.1. Explanatory Variables

The explanatory variables used in the models comprise the 55 environmental variables elaborated by LDSGAT and two road-related variables: sites where watercourses are crossed by the roadway (Curs-cam) and Annual Average Daily Traffic (AADT) for 2017 obtained from the Ministry of Transportation and Public Works of Uruguay. The variables were grouped into climatic, geographic, and anthropic factors [33,34]. In total, 57 variables were used: 32 climatic, 14 geographic, and 11 anthropic (Supplementary Materials Table S1).

2.3.2. Response Variable

The roadkill data obtained were used as a response variable. The data were spatialized with the QGIS program and classified as “presence” (1: if we have at least one record) and “absence” (0: where no record was observed) on the grid. Only grids that overlapped with the roads to be modelled were considered in the analysis (number of grids = 1372). Subsequently, the species were classified into two groups: grassland and native forest species. These groups were based on the most important habitats for each species according to the literature [20,35]. A total of six species were assigned to the “native forest” group (margay (Leopardus wiedii), Geoffroy’s cat (Leopardus geoffroyi), neotropical otter (Lontra longicaudis), South American raccoon (Procyon cancrivorus), nine-banded armadillo (Dasyus novemcinctus), and forest fox (Cerdocyon thous)) and four “grassland” species (Andes skunk (Conepatus chinga), lesser grison (Galictis cuja), southern long-nosed armadillo (Dasypus hybridus) and grey pampean fox (Lycalopex gymnocercus)).
Once the groups were established, we then began to unify the records with the grid mesh. For this purpose, QGIS was used, where a union by location was made between both layers. After the union, the attribute table was exported to develop the predictive models.

2.3.3. Predictive Models

The favourability function (FF) was used to elaborate the predictive models [25]:
F = ey / [(n1/n0) + ey]
where y is a linear regression equation (y = α + β1x1 + β2x2 +···+ βnxn), n1 is the number of observed presences, and n0 is the number of absences. This function is a generalized linear model (GLM) with binomial distribution and logit link function.
To build the predictive models, a script was developed using the fuzzySim package [36]. The analysis was performed sequentially using the multGLM function. First, the false discovery rate or [37] was applied to determine the proportion of falsely rejected null hypotheses [38,39]. A second filter was applied to the resulting variables, which consisted of analysing the Pearson correlation between variables with the corSelect function, considering a threshold value of 0.8 to discard those variables that were correlated [36]. The script used is presented in the supplementary material.
With the variables that passed the two filters, a forward and backward stepwise selection method was applied. After this procedure, the modelTrim function was applied to eliminate any remaining nonsignificant variables [40,41].
A total of four predictive models were constructed, two models for each of the groups (“native forest” and “grassland”): one called the complete model, in which all the explanatory variables of the three factors were used (57 variables), and another, called the anthropic model, in which only the variables related to the anthropic factor were used (11 variables). Finally, the survey package was [42] used to calculate the Wald Index [43] and obtain the relative importance of each variable in the final model.
The QGIS program (QGIS, version 3.10) was used to represent the models obtained and to create the final maps. The favourability (F) values were classified into ten categories from 0 to 1, in intervals of 0.1, for each geographic unit (cells).

2.3.4. Model Evaluation

Each predictive model was evaluated for performance using various indices such as Area Under the Curve (AUC), Specificity, Sensitivity, Over Prediction (OPR) and Under Prediction (UPR), and True Skill Statistic (TSS) using the package {modEvA} [44].

2.3.5. Model Validation

To validate what was obtained in the models, we used the roadkill records obtained in the period 2017–2019 and calculated the density of roadkill per square kilometre. For this purpose, the roadkill abundances were overlapped with the favourability values, and the spatial relationship between both layers was analysed. For this, the spatial coincidence between roadkill abundance and favourability was analysed using QGIS.
All analyses were performed in the statistical program R (version 3.5.3) [45].

3. Results

3.1. Records of Roadkill Presence

A total of 685 roadkill records were obtained for the most affected medium and large mammal species, based on the number of roadkill records and those that present some degree of threat at a national and international level, as in the case of the margay or the mulita (Table 1). Of the total number of records, 186 corresponded to forest species and 499 to grassland species. Among the forest species was the margay (Leopardus wiedii), which requires conservation at a national and international level. The grassland species group included the Southern long-nosed armadillo (Dasypus hybridus), which is listed as internationally threatened (Table 1 and Figure 2).

3.2. Predictive Models

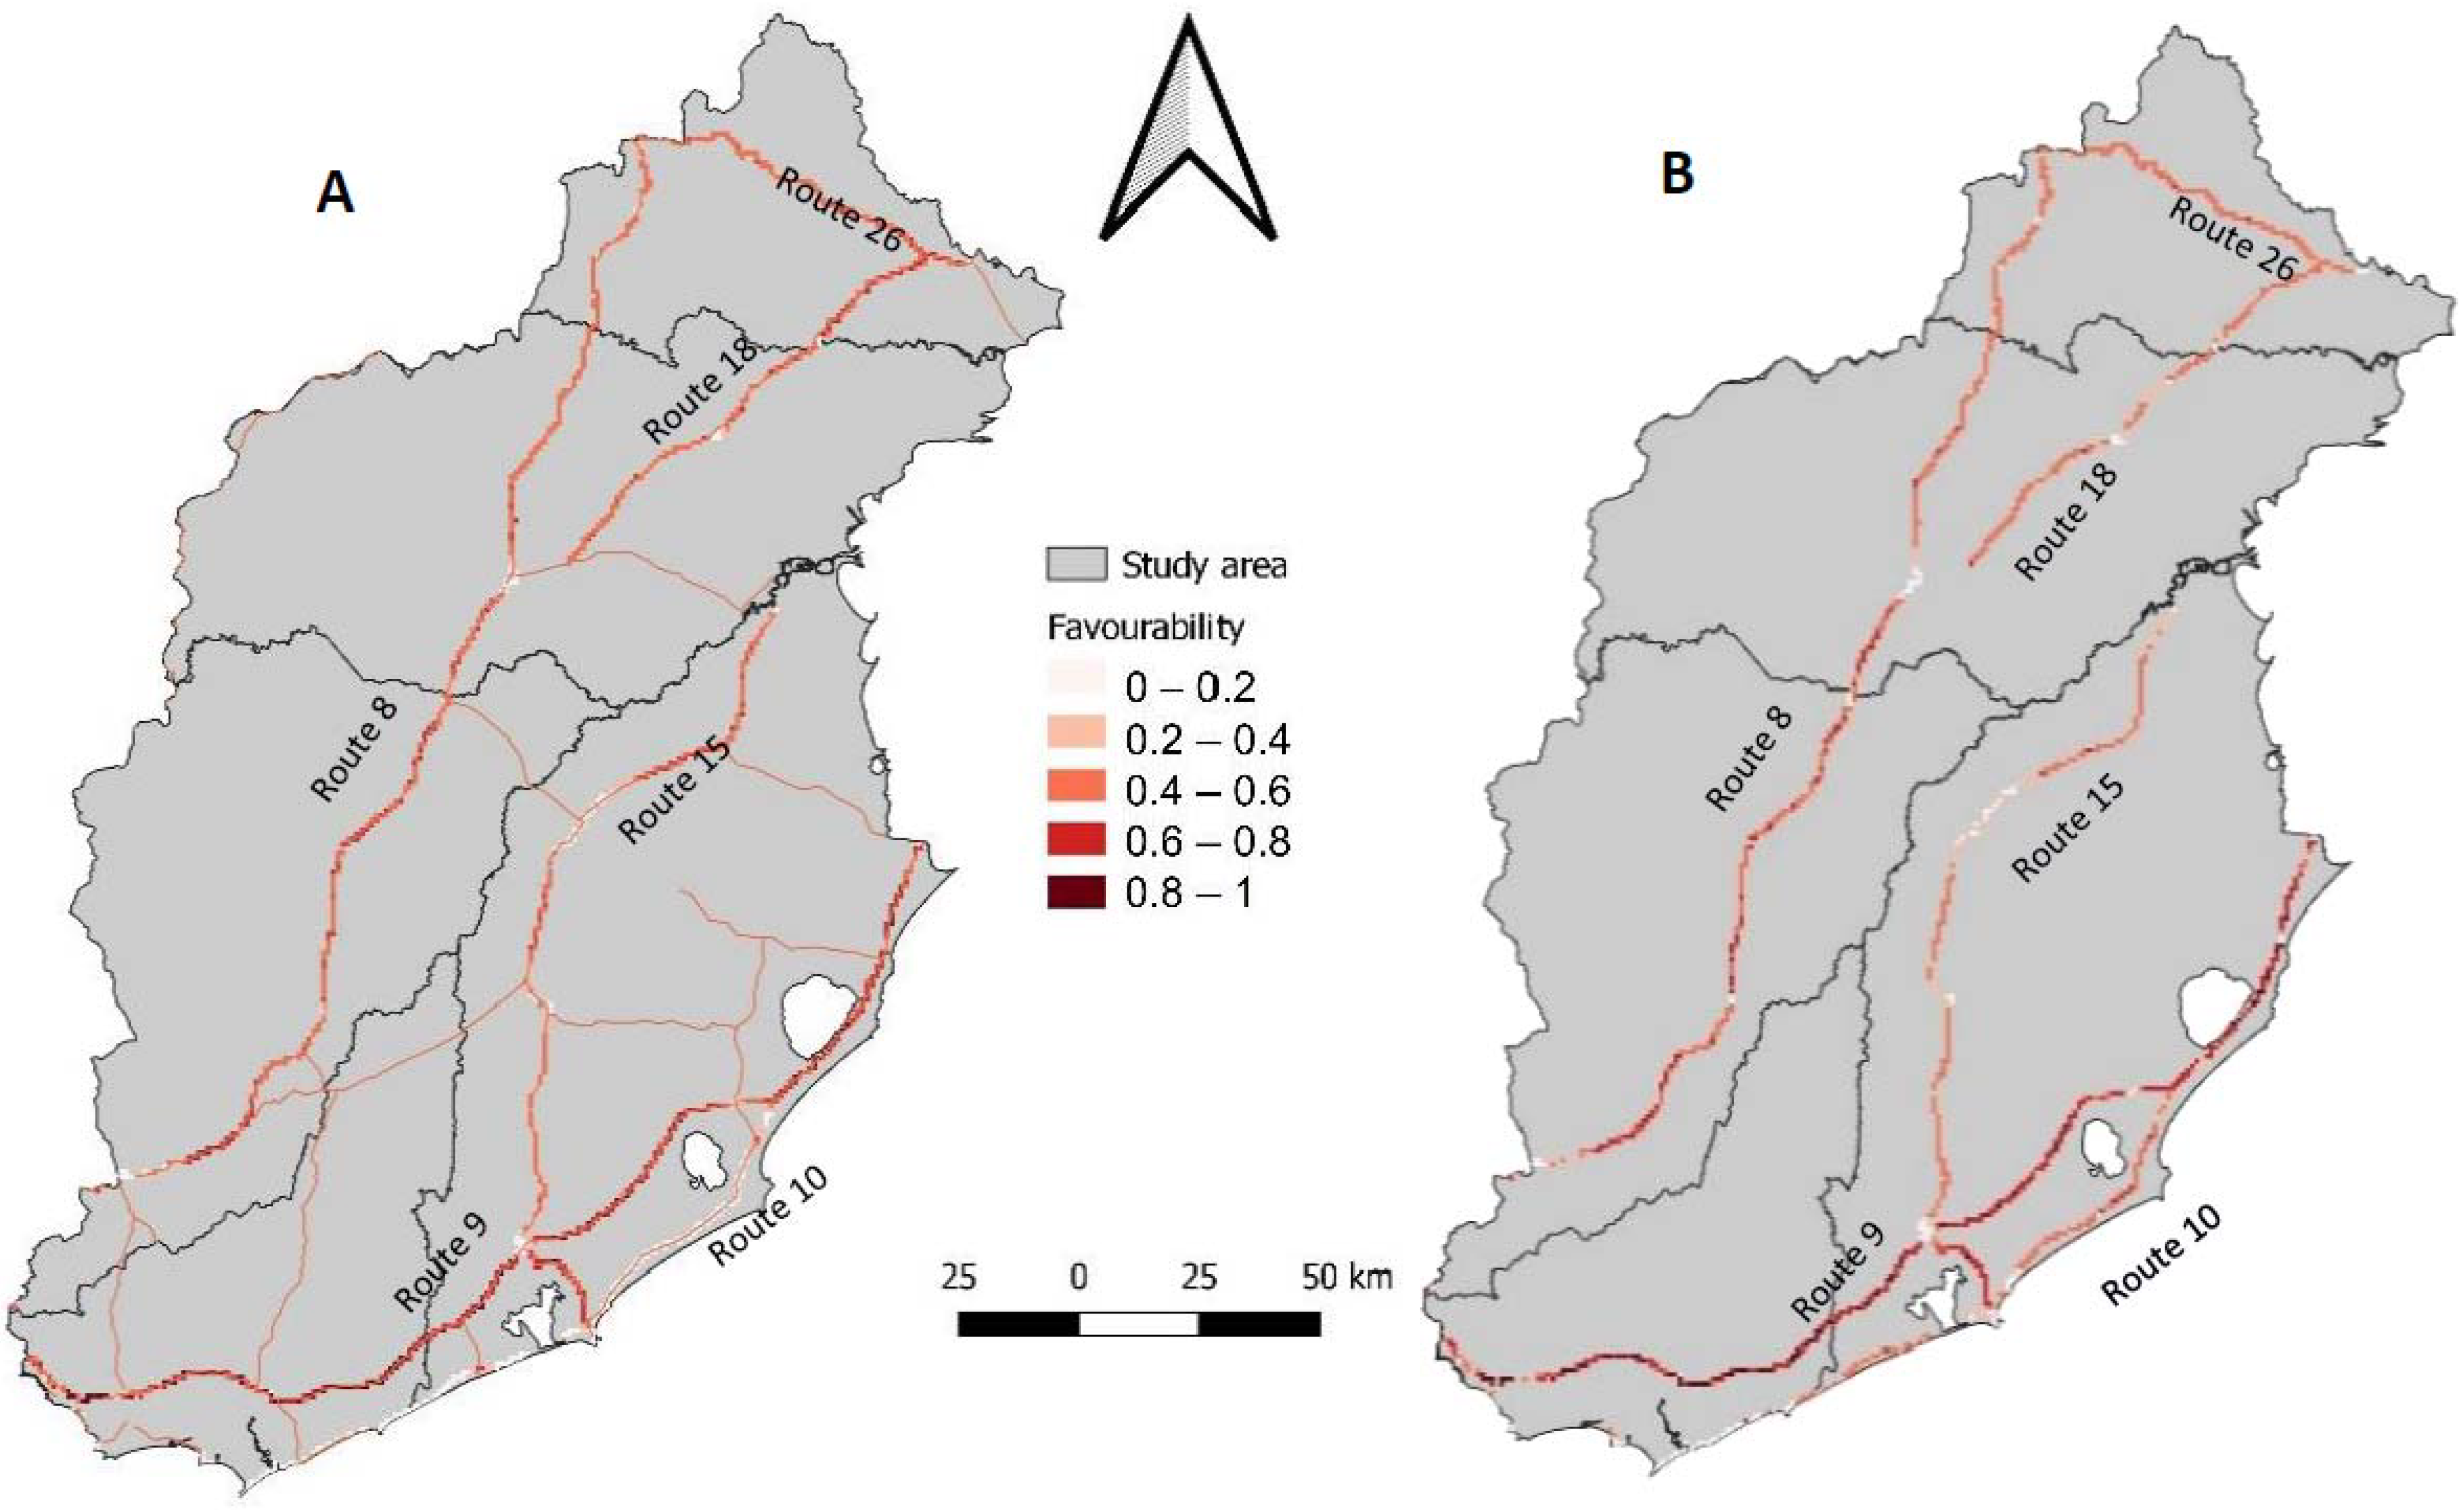
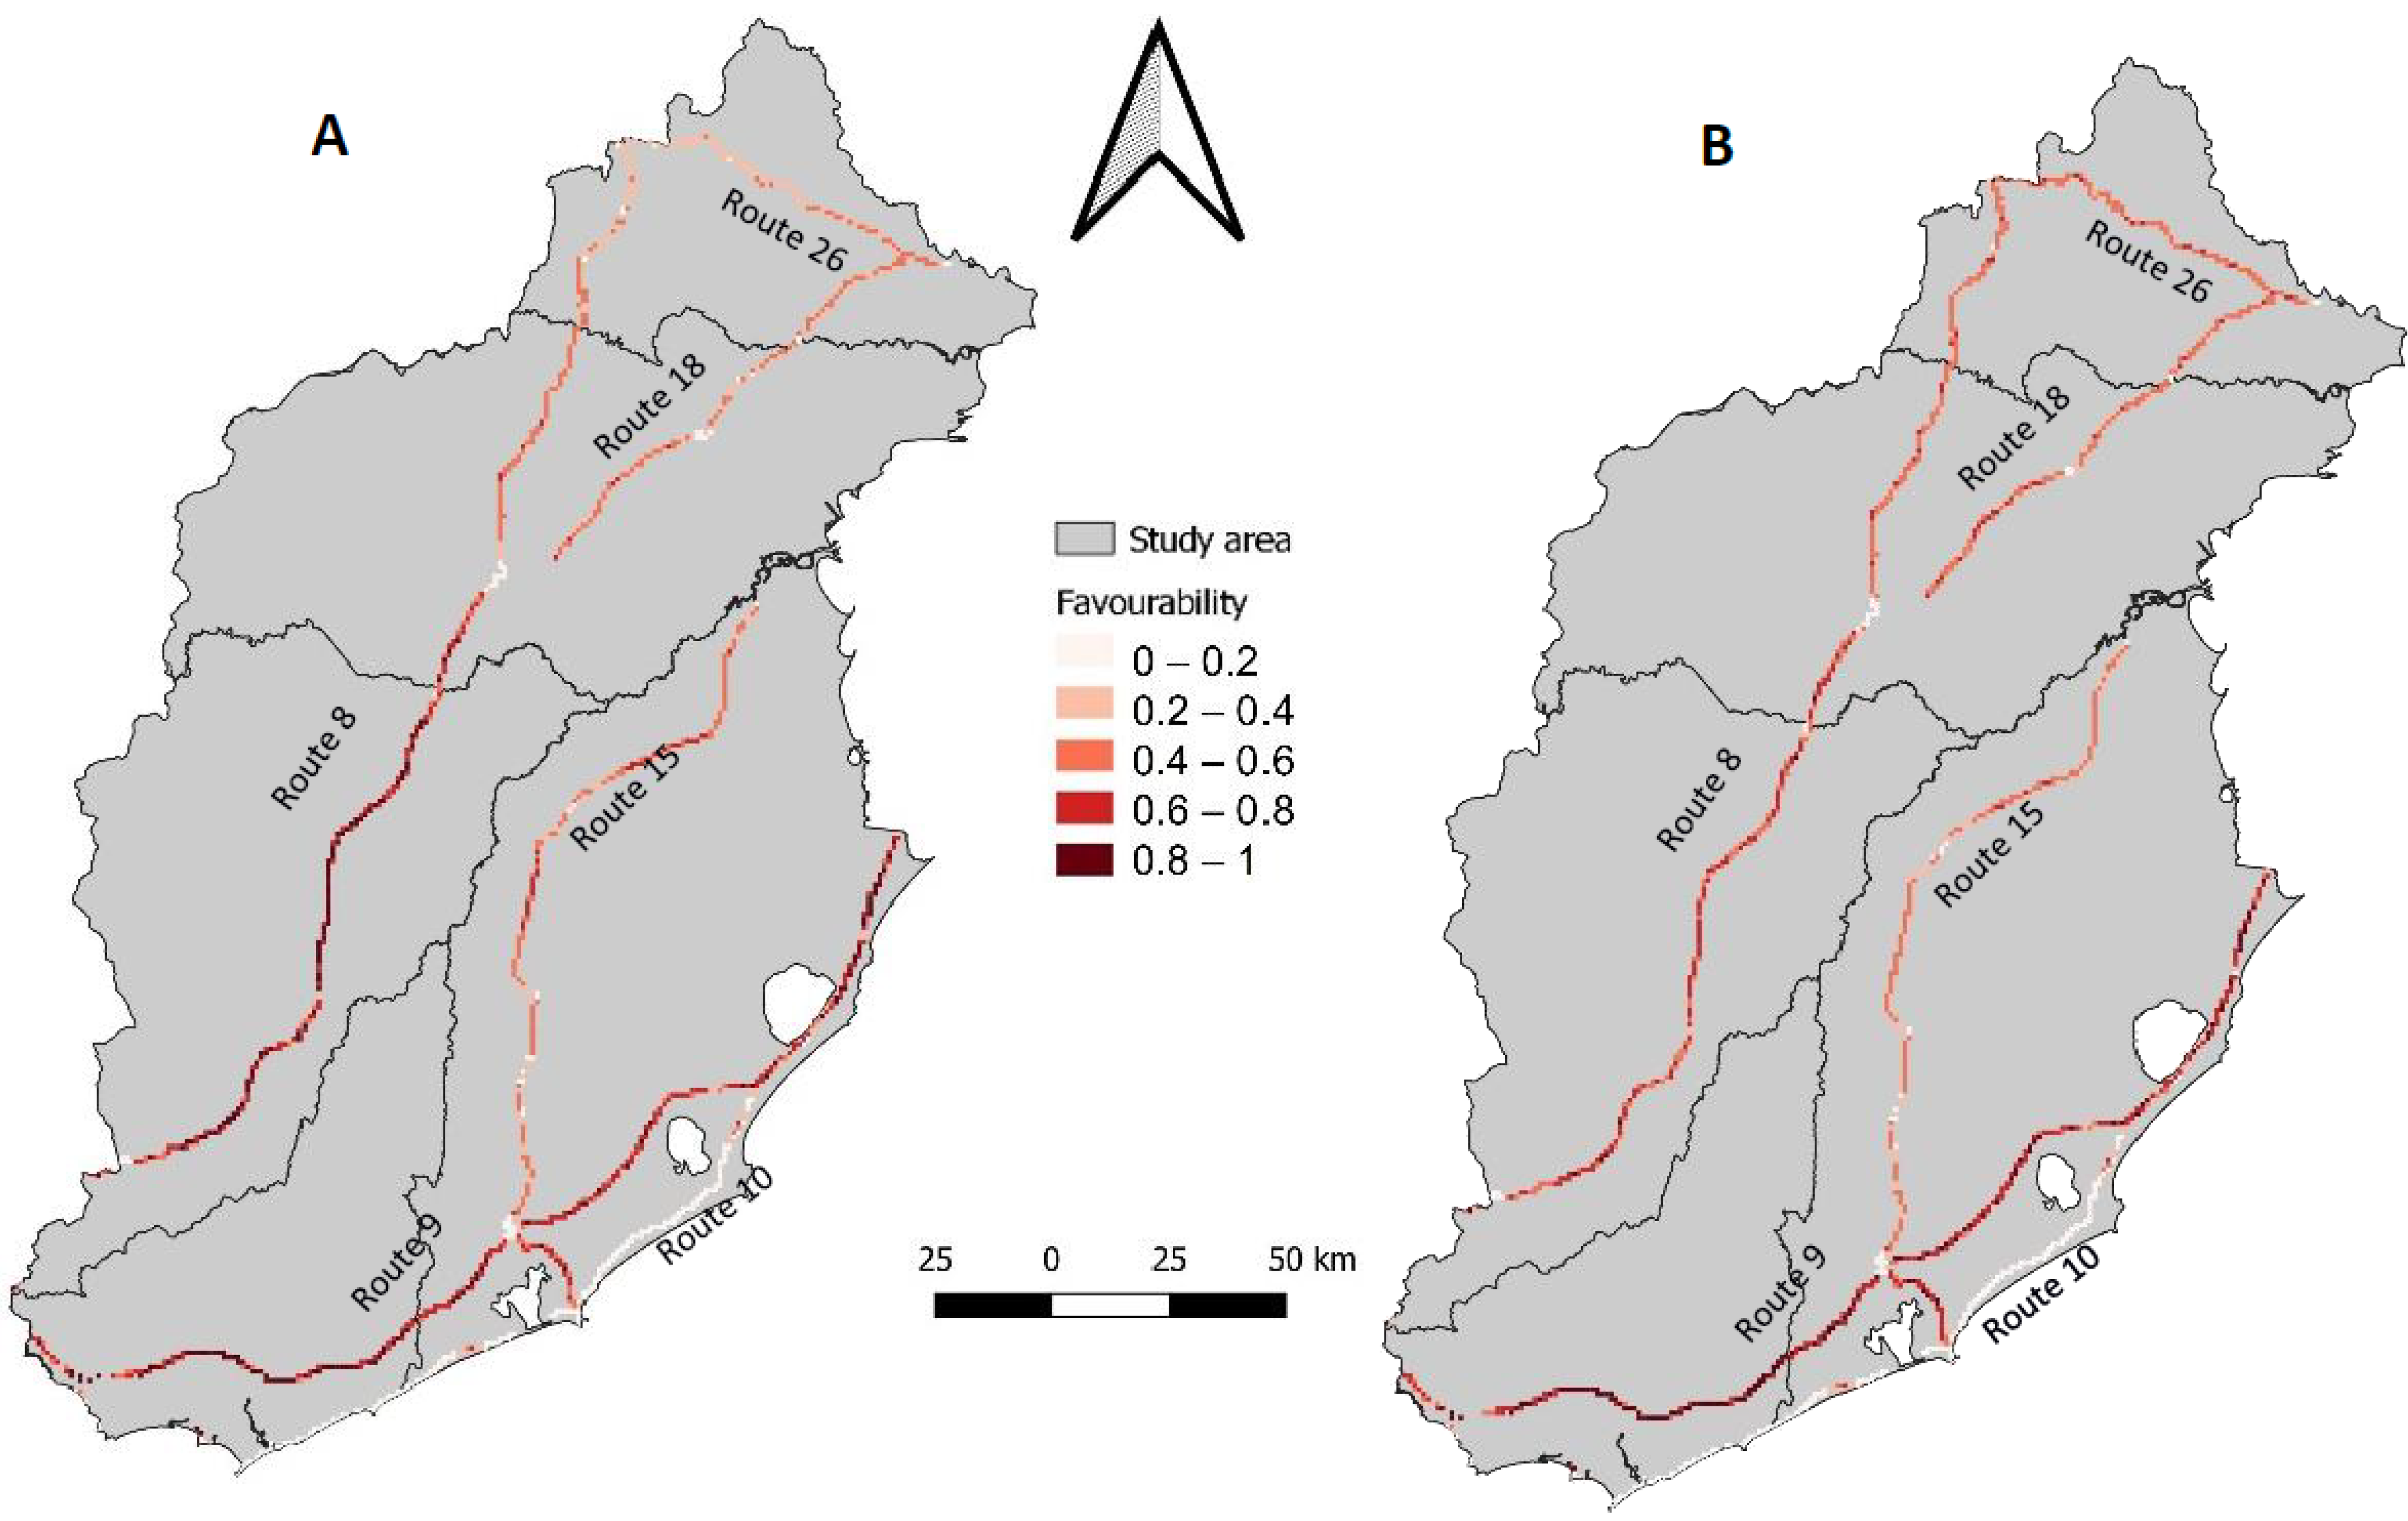
The models obtained, both complete and anthropic, for both groups (grassland and native forest species) showed that Route 9 was the one with the largest surface area (85% in both models for both groups) with high favourability values (F ≥ 0.5). This was followed by Route 8, where for grassland species, 60% of the surface area presented values of F ≥ 0.5 in both models. However, for native forest species, the surface area of the anthropic model was 43%, and for the complete model 37% (Figure 3 and Figure 4). On the other hand, it was observed that Route 15 presented favourability values greater or equal to 0.5 in the 30 km section that connects the city of Rocha with La Paloma (Figure 3 and Figure 4).

3.3. Most Important Environmental Variables

The variable Annual Average Daily Traffic (AADT) was the most important explanatory variable for both the full and anthropic models for native forest species and for the anthropic model for grassland species. The full model for the grassland species showed that the most important variable was Precipitation in the Wettest Quarter (BIO 16) followed by the AADT variable (Table 2 and Table 3). However, AADT presented a Wald Index close to the first variable and thus presented a significant importance (Table 3).
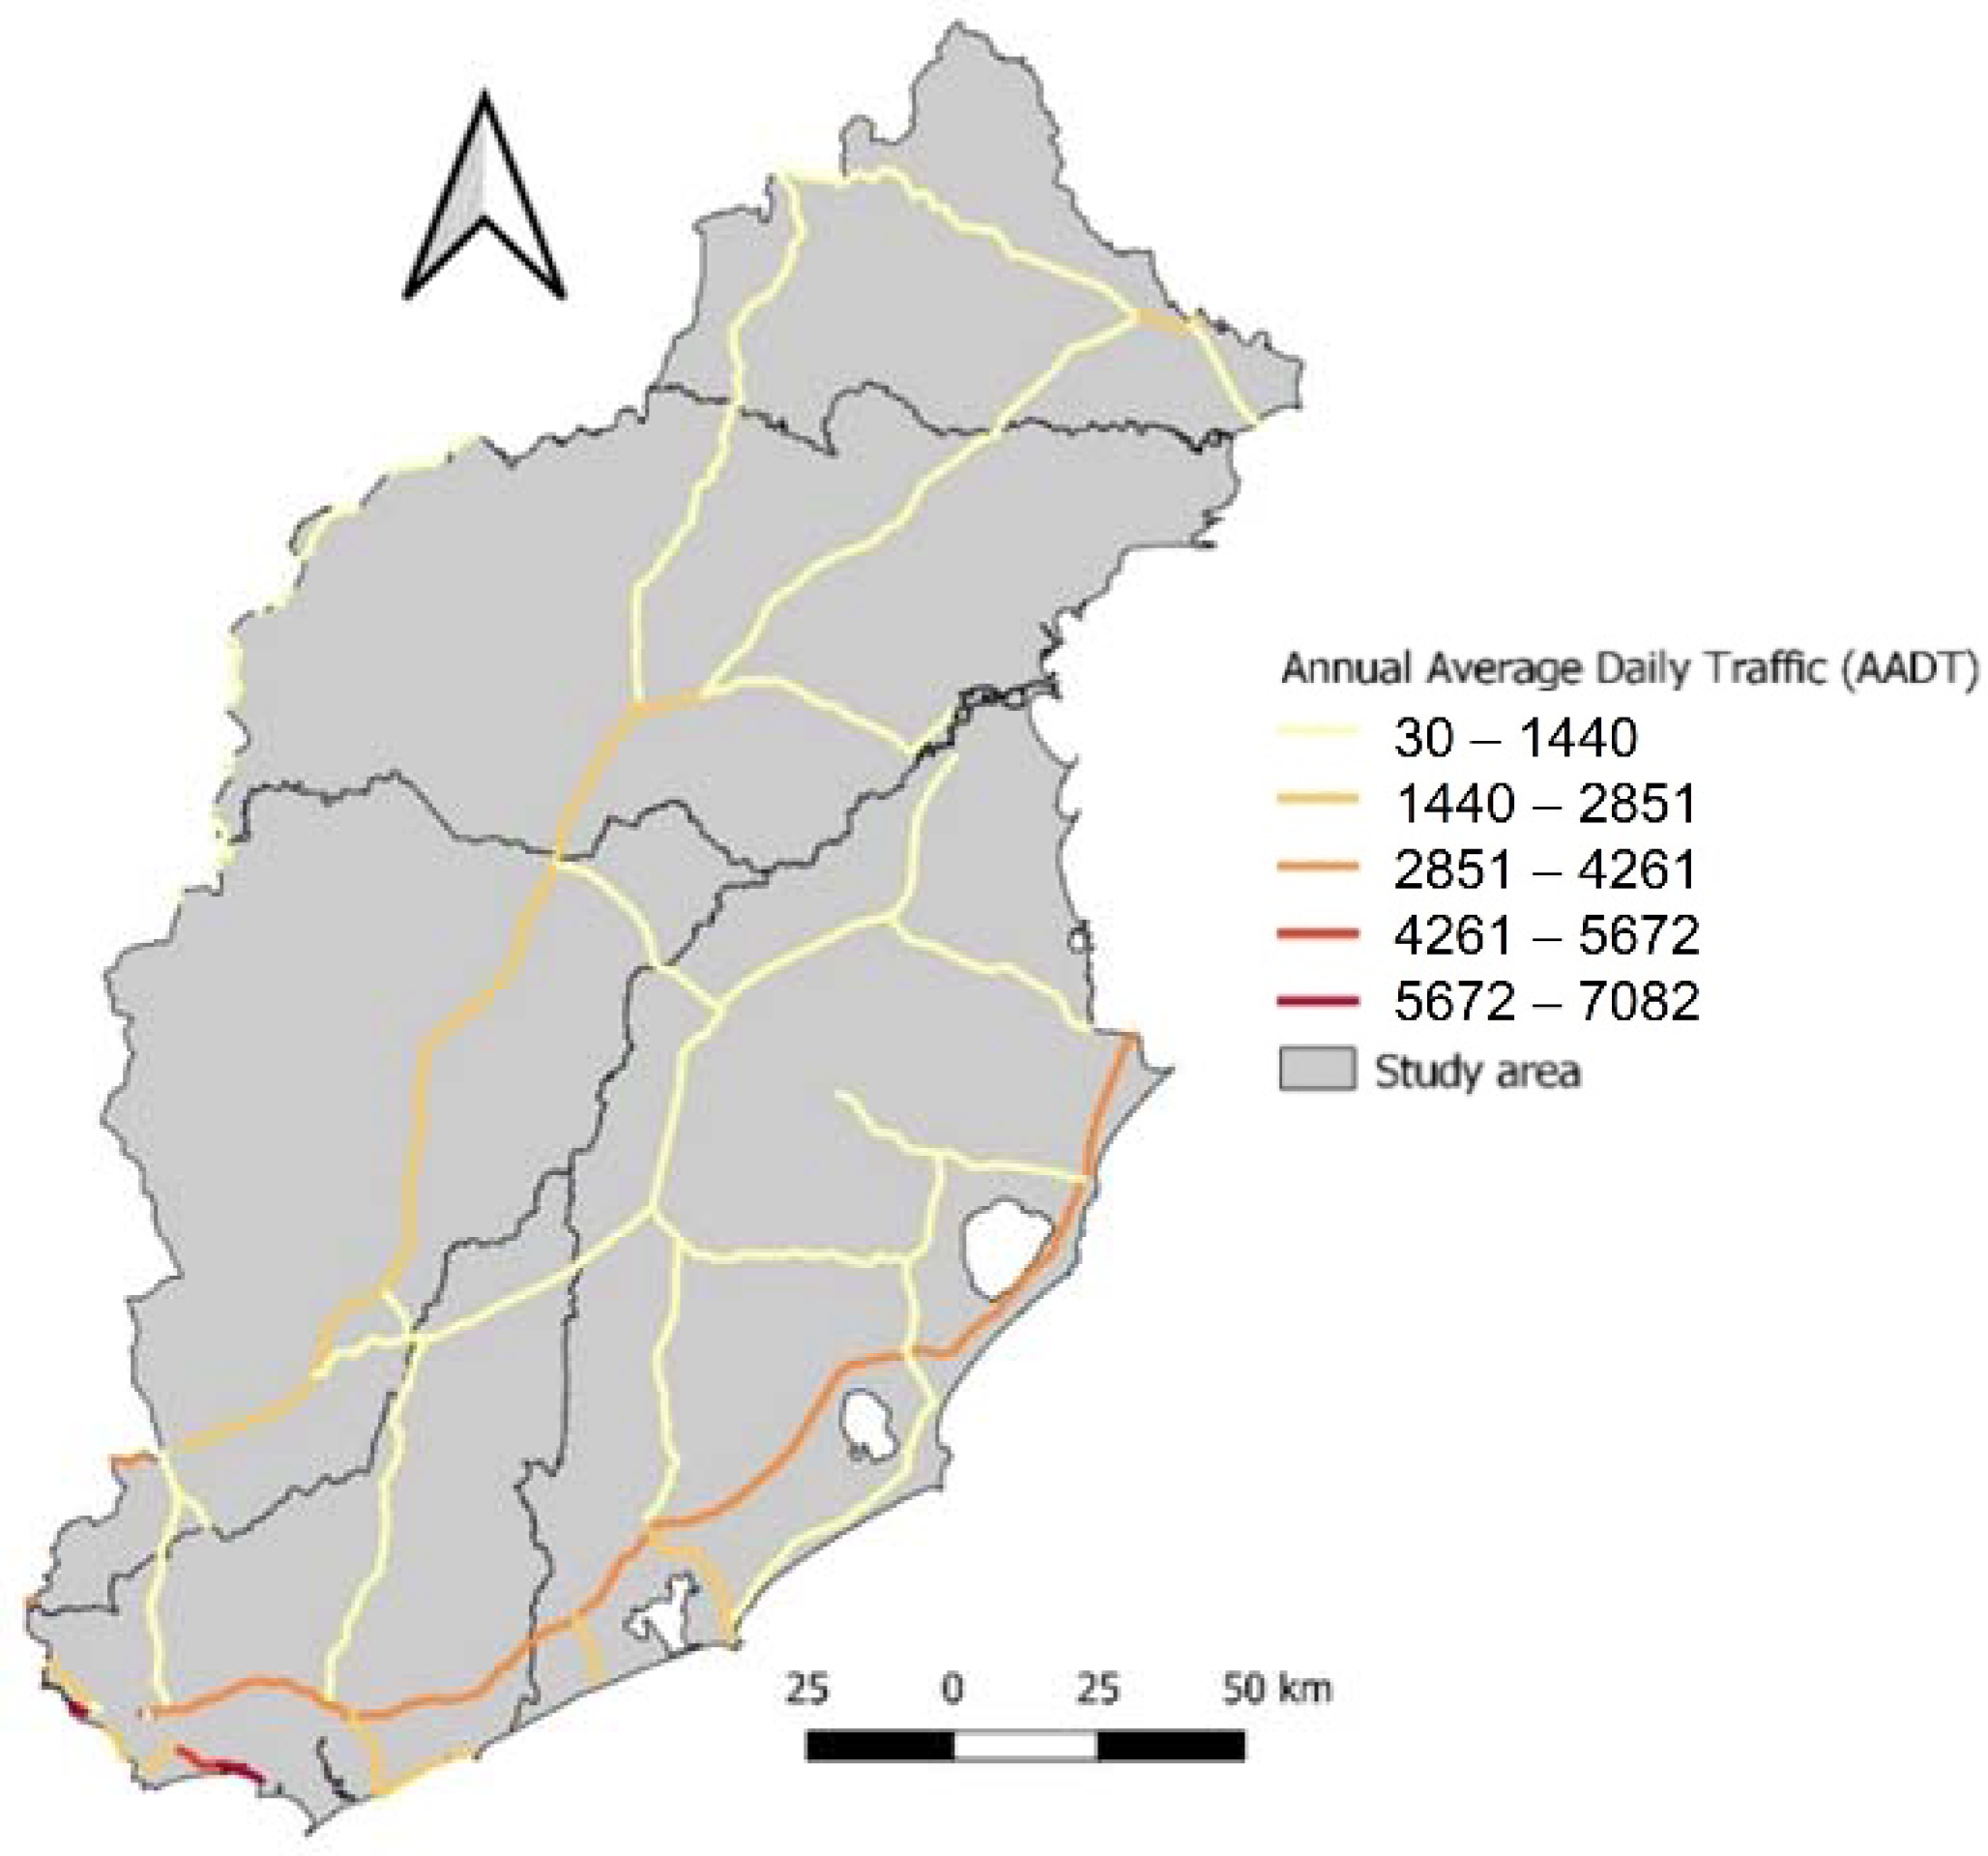
Analysing the two routes with the highest roadkill favourability for both groups, Route 9 had four sections with AADT values ranging from 1440 to 2146 vehicles per day. Route 8 showed three sections with values ranging from 1440 to 2851 vehicles per day (Figure 5).

3.4. Model Evaluation

The prepared models of roadkill performed well based on the indices: AUC, CCR, TSS, UPR, UPR, OPR, and Sensitivity and Specificity (Table 4). In the case of native forest species, the complete model obtained higher AUC and TSS values than the anthropic model. However, the CCR and specificity and sensitivity values were higher in the anthropic model, whereas in the case of grassland species, most of the indices (AUC, CCR, Specificity, TSS, and UPR) showed higher values in the complete model (Table 4).

3.5. Model Validation

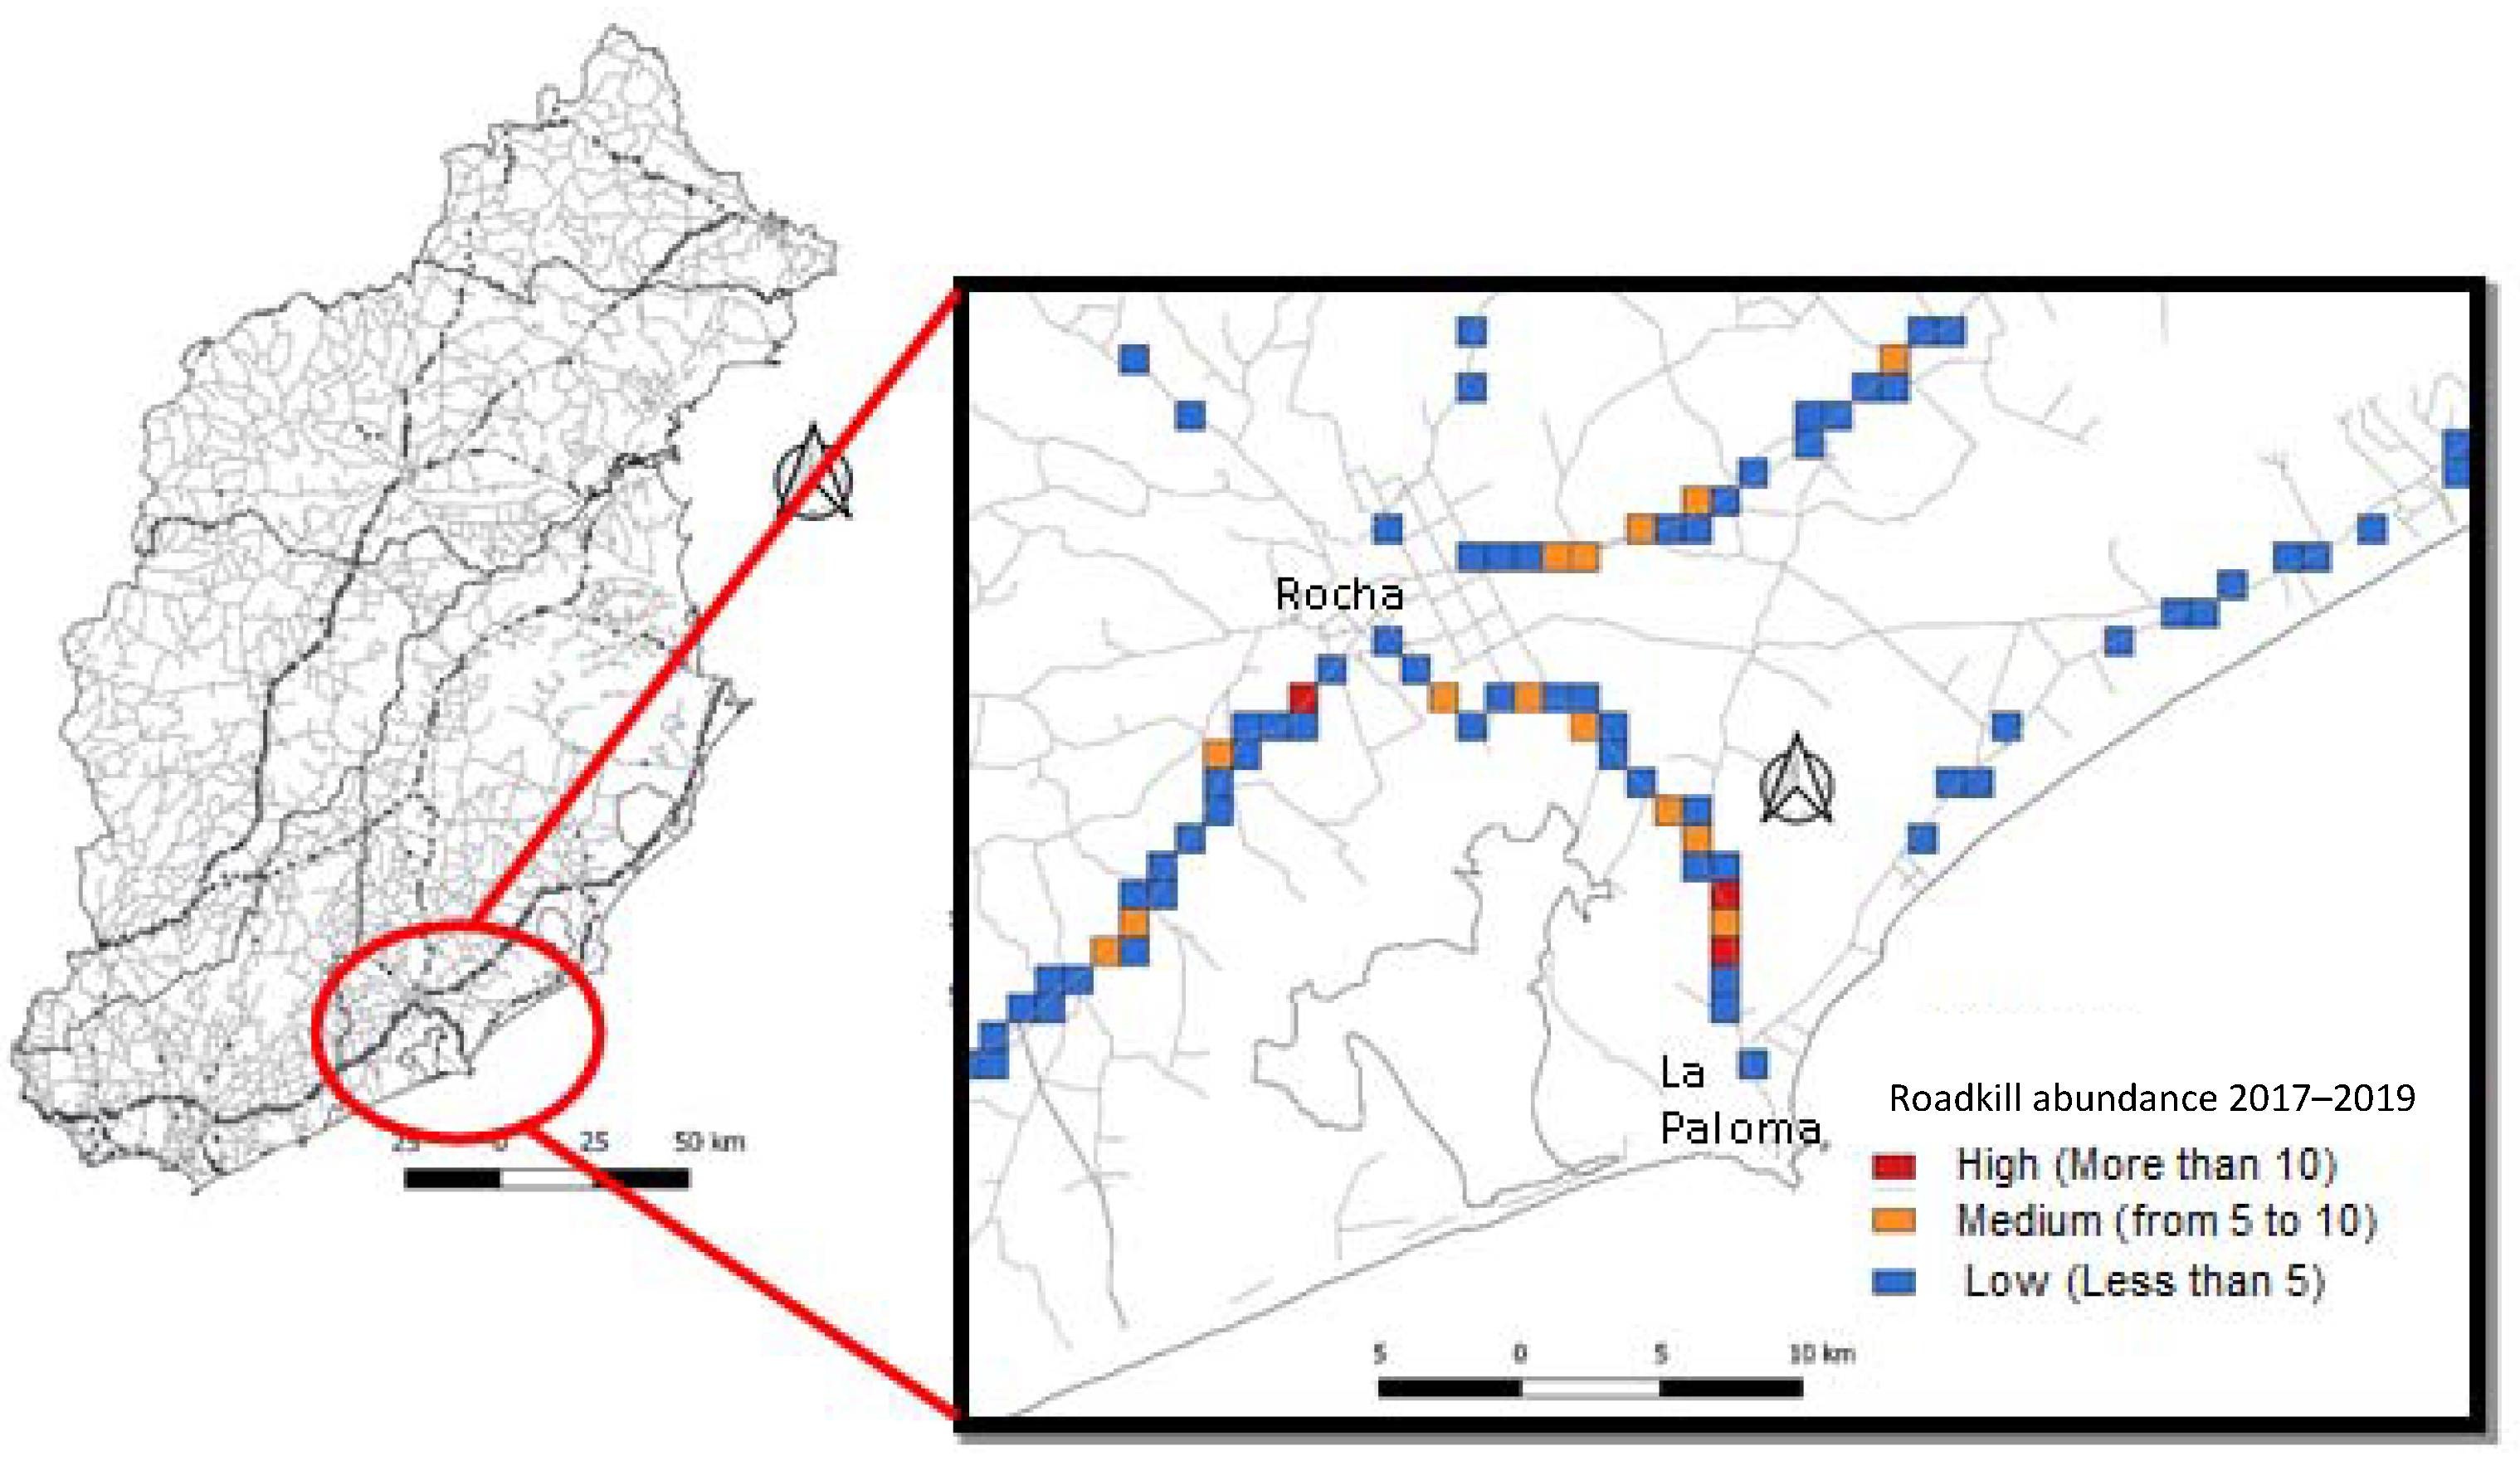
With the roadkill mammal data obtained between 2017 and 2019, a map of roadkill abundance per square kilometre was produced (Figure 6). The section of Route 15 that connects the city of Rocha with La Paloma was the one with the highest mortality rates during this period. This section has an AADT ranging from 2146 to 2851 (Figure 6).
When the cells of roadkill abundances for the period 2017–2019 were overlapped with the models that were elaborated, it was observed that for native forest species, 64% (complete model) and 52% (anthropic model) matched the sites with F-favourability values of ≥0.5, whereas for grassland species, 66% (complete model) and 68% (anthropic model) matched with F-favourability values of ≥0.5. This confirmed what was obtained in the models, since the spatial overlap of the cells was higher than 60% of the surface with F-favourability values of ≥0.5.

4. Discussion

In this paper, the favourability function was used to model and predict the spatiotemporal patterns of the roadkill effect for six species of medium and large mammals in native forests and four in natural grasslands, and to identify (favourable) hotspots for roadkill. This represents a key contribution to the subject of road ecology in Uruguay, since it allowed us to identify the places with the highest probability of wildlife roadkill and to determine which environmental variables influence roadkill. On the other hand, the results obtained are a significant input at the national level to advance the implementation of mitigation measures in the identified hotspots.
Using the favourability function, models were obtained that provided high predictive and explanatory power according to the applied evaluations. There are research studies that used various mathematical algorithms (e.g., generalized linear models, Random Forest, Support Vector Machine, Habitat Suitability) to explain and predict the effect of roadkill on wildlife [18,21,24,46,47,48,49,50,51,52]. However, there is no research where the favourability function was applied to predict and explain the roadkill effect; moreover, it has usually been used as a tool for the identification of favourable habitats for biodiversity [23,27,50].
For both modelled groups (grassland and forest species) the (AADT) variable (Average Daily Annual Daily Transit) was the most important for three of the four models. It was observed that the higher the vehicle traffic, the higher the probability of roadkill. This is in agreement with other authors who also identified that vehicle density is directly related to roadkill, increasing wildlife mortality with increased vehicle density [22,53,54]. In this regard, it is important to take into account the variable of vehicular traffic when implementing a mitigation measure to reduce mammal roadkill.
Roads and urban centres negatively affect the species studied through road traffic and habitat fragmentation. [6,7,10,18,49,55,56,57,58]. This study further confirms these findings, since the most important environmental variables for both groups of mammals studied were related to anthropic factors, mainly those related to infrastructures such as the AADT, bridges, and roads.
Human infrastructures directly relate to one another. Urban areas have a higher density of road and transit infrastructures, thus increasing the probability for wildlife roadkill [6,7,10,56,57,58]. In contrast, as we move away from urban areas the probability decreases [55,58]. However, in the present work, with the models carried out, the urbanization variable decreased the probability of roadkill. This may be due to the effects of urbanization on species distribution [57].
In relation to crossings between watercourses and road infrastructure (bridges and sewers), this variable was found to be the second most important for native forest species in the complete model. This indicates that the greater the number of bridges, the greater the probability of roadkill. Several studies highlight the importance of bridges and sewers as potential wildlife passageways [59,60,61,62]. These structures maintain landscape connectivity and strengthen permeability by allowing animal circulation. However, it is essential that such structures have particular characteristics such as the presence of dry margins underneath that allow animal circulation [59,60,61,62]. The results obtained in this study suggest that most of the bridges or sewers found in the study area did not have a dry section that allowed fauna to cross underneath. For those that did have a dry section, the section was flooded most of the year, forcing wildlife to cross over it, increasing the likelihood of roadkill. Some mitigation measures implemented in these cases include the construction of concrete platforms to allow wildlife to cross. Such platforms usually have a height such that, when the watercourse rises, the level does not affect the crossing of fauna, nor the presence of an access slope to these platforms [60,61,62]. It is worth mentioning that bridges and/or sewers are important for native forest species, since in Uruguay they are associated with native forest watercourses. Therefore, the importance of these structures is paramount to allow the mobility of mammal species. However, it is necessary to conduct studies that analyse how the fauna use these areas and if they are indeed a problem for their displacement [59,61,62].
With regard to the roads that showed the greatest surface area favourability for roadkill, Route 9 is particularly noteworthy. This highway is characterized by high AADT values, as it is one of the international corridors that connects Uruguay with Brazil [63]. In turn, it also presents other characteristics that could explain the high favourability for roadkill, such as the high flow of tourists mainly in spring–summer as it connects the main tourist resorts in the department of Rocha. In addition, it crosses the Bañados del Este Biosphere Reserve, and it is located near several protected areas included in the National System of Protected Areas [29]. Baudi et al. (2017) found that roadkill increases within protected areas because they have greater species richness and abundance. This supports the models obtained in this study since, as mentioned above, Route 9 crosses several national and international conservation areas [31].
Another important aspect of Route 9 is that the shoulders of this route have, to a large extent, natural vegetation typical of the ecosystems of the area. In this regard, in recent years, researchers and government agencies related to transportation management, public works, and environmental protection, have put the focus on roadsides as an important reservoir of public land that, if managed properly, can become a shelter for biodiversity [64,65]. Thus, the promotion of suitable vegetation on these verges can contribute, as a nature-based solution, to minimizing the impacts associated with the roads themselves [65,66], whereas at the same time, it provides a suitable habitat for other species such as micromammals, birds, amphibians, reptiles, and various groups of invertebrates that may be of interest for conservation and for which road verges can become small biological corridors [65].
Finally, it is important to further strengthen the results obtained from the models and the GIS analysis; therefore, it is advisable to monitor the locations where there is a threat of roadkill and analyse the territorial conditions of each one in order to then implement mitigation measures tailored to each site. It is also important to carry out the analyses of this study on each species separately so as to identify areas of high mortality and generate mitigation measures tailored to each species.

5. Conclusions

This study is a key contribution to road ecology in Uruguay, which allowed us to understand how roads affect the populations of medium and large mammals, using the favourability function as a tool to generate predictive models. Models were generated to predict and identify sites where there is a negative interaction between roads, natural habitats, and the species of medium and large mammals under study. The main environmental variables that affect roadkill are related to anthropic factors (traffic, roads, and bridges). This will make it possible to monitor these sites in order to implement mitigation measures to reduce the loss of medium and large mammals, as well as to identify sites of value for landscape connectivity. However, despite being an important input, it is necessary to survey these sites to validate the models.

Supplementary Materials

The following are available online at https://www.mdpi.com/article/10.3390/d13110585/s1, Table S1: List of explanatory variables used to model favourability grouped according to climatic, geographical, and anthropic factors, Table S2: Records of roadkill obtained in the period 2015–2016 for the native bush and grassland species selected for this study. R modeling script used.

Author Contributions

Conceptualization, H.I.C., M.A. and J.C.G.; methodology, H.I.C., J.C.G.; formal analysis, H.I.C.; investigation, H.I.C., M.A. and J.C.G.; data curation, H.I.C.; writing—original draft preparation, H.I.C.; writing—review and editing, H.I.C., M.A. and J.C.G.; visualization, H.I.C., M.A. and J.C.G.; supervision, H.I.C., M.A. and J.C.G. All authors have read and agreed to the published version of the manuscript.

Funding

This study was partially funded by PEDECIBA Geosciences and the National Agency for Innovation and Research (Agencia Nacional de Innovación e Investigación, ANII) of Uruguay.

Institutional Review Board Statement

Not applicable.

Informed Consent Statement

Not applicable.

Data Availability Statement

The data are annexed as supplementary material.

Acknowledgments

We would like to thank the members of the National Network of Wildlife Collisions for allowing us to collect information on wildlife roadkill throughout the country. We also thank Gabriela Martínez de la Escalera for contributing to the editing of the manuscript. This article was completed in partial fulfilment of the requirements of Hugo Ignacio Coitiño Banquero for his master’s degree at PEDECIBA Geosciences. J. C. Guerrero and Marcel Achkar thank the Programa de Desarrollo de las Ciencias Básicas (PEDECIBA) and the Sistema Nacional de Investigadores (SNI) of the Agencia Nacional de Investigación e Innovación (ANII). The first version of the manuscript was revised by Denise Rugo (official translator). We are grateful for the valuable comments of the anonymous reviewers who have improved this manuscript.

Conflicts of Interest

The authors declare no conflict of interest.

References

  1. Forman, R.T.; Sperling, D.; Bissonette, J.A.; Clevenger, A.P.; Cutshall, C.D.; Dale, V.H.; Fahrig, L.; France, R.L.; Goldman, C.R.; Heanue, K. Road Ecology: Science and Solutions; Island Press: Washington, DC, USA, 2003; ISBN 1-55963-933-4. [Google Scholar]
  2. Barri, F.R. Evaluación Preliminar de La Mortandad de Mastofauna Nativa Por Colisión Con Vehículos En Tres Rutas Argentinas. Ecol. Appl. 2010, 9, 161–165. [Google Scholar] [CrossRef] [Green Version]
  3. Benítez-López, A.; Alkemade, R.; Verweij, P.A. The Impacts of Roads and Other Infrastructure on Mammal and Bird Populations: A Meta-Analysis. Biol. Conserv. 2010, 143, 1307–1316. [Google Scholar] [CrossRef] [Green Version]
  4. Puc-Sánchez, J.; Delgado-Trejo, C.; Mendoza-Ramírez, E.; Suazo-Ortuño, I. Las Carreteras Como Una Fuente de Mortalidad de Fauna Silvestre En México. CONABIO Biodiversitas 2013, 11, 12–16. [Google Scholar]
  5. Van der Ree, R.; Smith, D.J.; Grilo, C. (Eds.) Handbook of Road Ecology; Wiley-Blackwell: Hoboken, NJ, USA; Chichester, UK, 2015; ISBN 978-1-118-56816-3. [Google Scholar]
  6. Cervantes-Huerta, R.; Escobar, F.; García-Chávez, J.H.; González-Romero, A. Atropellamiento de Vertebrados En Tres Tipos de Carretera de La Región Montañosa Central de Veracruz, México. Acta Zool. Mex. 2017, 33, 472–481. [Google Scholar] [CrossRef]
  7. Villanueva-Vázquez, G.E.; Aguilar-Herrera, V.; Jaimes-López, R.; Nigenda-Quezada, M.; Rios, E. Biología y Sociedad. Facultad de Ciencias Biológicas; Universidad Autónoma de Nuevo León: San Nicolas de los Garza, Mexico, 2018; pp. 45–54. [Google Scholar]
  8. Grilo, C.; Bissonette, J.A.; Santos-Reis, M. Spatial–Temporal Patterns in Mediterranean Carnivore Road Casualties: Consequences for Mitigation. Biol. Conserv. 2009, 142, 301–313. [Google Scholar] [CrossRef]
  9. George, L.; Macpherson, J.; Balmforth, Z.; Bright, P. Using the Dead to Monitor the Living: Can Road Kill Counts Detect Trends in Mammal Abundance? Appl. Ecol. Environ. Res. 2011, 9, 27–41. [Google Scholar] [CrossRef]
  10. D’Amico, M. On the Road: Los Distintos Impactos Del Tráfico Motorizado Sobre Poblaciones Animales; Universidad Pablo de Olavide: Sevilla, Spain, 2015. [Google Scholar]
  11. Seiler, A.; Helldin, J. Mortality in wildlife due to transportation. In The Ecology of Transportation: Managing Mobility for the Environment; Springer: Berlin/Heidelberg, Germany, 2006; pp. 165–189. [Google Scholar]
  12. Ford, A.T.; Fahrig, L. Diet and Body Size of North American Mammal Road Mortalities. Transp. Res. Part Transp. Environ. 2007, 12, 498–505. [Google Scholar] [CrossRef]
  13. Ontario Road Ecology Group. A Guide to Road Ecology in Ontario, Prepared for the Environmental Canada Habitat Stewardship Program for Species at Risk; Toronte Zoo: Toronto, ON, Canada, 2010. [Google Scholar]
  14. Chacón, E.R. Atropello de Vertebrados En Una Carretera Secundaria En Costa Rica. UNED Res. J. 2011, 3, 81–84. [Google Scholar] [CrossRef] [Green Version]
  15. Vargas-Salinas, F.; Lopez-Aranda, F. Could Roads Restraint the Movement of Small Mammals in Andean Forests of Colombia? Study Case in the Bosque de Yotoco, Valle Del Cauca. Caldasia 2012, 34, 409–420. [Google Scholar]
  16. Bager, A.; da Silva Lucas, P.; Bourscheit, A.; Kuczach, A.; Maia, B. Os Caminhos Da Conservação Da Biodiversidade Brasileira Frente Aos Impactos Da Infraestrutura Viária. Biodivers. Bras.-BioBrasil 2016, 7, 75–86. [Google Scholar]
  17. Coitiño, H.; Montenegro, F.; Guerrero, J. Uruguay y El Impacto de Las Carreteras: Contexto y Perspectivas a Futuro. In Infraestructra Viária & Biodiversidade: Métodos e Diagnósticos; Bager, A., Ed.; UFLA: Lavras, Brazil, 2018; pp. 244–269. [Google Scholar]
  18. Serrón, A.; Coitiño, H.; Segura, Á. Atropellos de Mamíferos En La Región Este de Uruguay y Su Relación Con Los Atributos Del Paisaje. Innotec 2020, 20, 139–157. [Google Scholar]
  19. González, E.M. Guía de Campo de Los Mamíferos de Uruguay: Introducción al Estudio de Los Mamíferos; Vida Silvestre: Montevideo, Uruguay, 2001; ISBN 9974-7589-1-2. [Google Scholar]
  20. González, E.M.; Martínez Lanfranco, J.A. Mamíferos de Uruguay: Guía de Campo e Introducción a Su Estudio y Conservación; Banda Oriental: Montevideo, Uruguay, 2010; ISBN 9974-1-0674-5. [Google Scholar]
  21. Visintin, C.; Van Der Ree, R.; McCarthy, M.A. A Simple Framework for a Complex Problem? Predicting Wildlife–Vehicle Collisions. Ecol. Evol. 2016, 6, 6409–6421. [Google Scholar] [CrossRef] [PubMed] [Green Version]
  22. Ha, H.; Shilling, F. Modelling Potential Wildlife-Vehicle Collisions (WVC) Locations Using Environmental Factors and Human Population Density: A Case-Study from 3 State Highways in Central California. Ecol. Inform. 2018, 43, 212–221. [Google Scholar] [CrossRef]
  23. Coelho, L.; Romero, D.; Queirolo, D.; Guerrero, J.C. Understanding Factors Affecting the Distribution of the Maned Wolf (Chrysocyon brachyurus) in South America: Spatial Dynamics and Environmental Drivers. Mamm. Biol. 2018, 92, 54–61. [Google Scholar] [CrossRef]
  24. Ascensão, F.; Yogui, D.; Alves, M.; Medici, E.P.; Desbiez, A. Predicting Spatiotemporal Patterns of Road Mortality for Medium-Large Mammals. J. Environ. Manag. 2019, 248, 109320. [Google Scholar] [CrossRef] [PubMed]
  25. Real, R.; Barbosa, A.M.; Vargas, J.M. Obtaining Environmental Favourability Functions from Logistic Regression. Environ. Ecol. Stat. 2006, 13, 237–245. [Google Scholar] [CrossRef]
  26. Acevedo, P.; Real, R. Favourability: Concept, Distinctive Characteristics and Potential Usefulness. Naturwissenschaften 2012, 99, 515–522. [Google Scholar] [CrossRef] [Green Version]
  27. Russo, L.F.; Barrientos, R.; Fabrizio, M.; Di Febbraro, M.; Loy, A. Prioritizing Road-kill Mitigation Areas: A Spatially Explicit National-scale Model for an Elusive Carnivore. Divers. Distrib. 2020, 26, 1093–1103. [Google Scholar] [CrossRef]
  28. Pablos, N.S.; Barbosa, A.M.; Freiría, F.M.; Real, R. Los Modelos de Nicho Ecológico En La Herpetología Ibérica: Pasado, Presente y Futuro. Boletín Asoc. Herpetológica Española 2010, 21, 2–24. [Google Scholar]
  29. Brazeiro, A. Eco-Regiones de Uruguay: Biodiversidad, Presiones y Conservación: Aportes a La Estrategia Nacional de Biodiversidad; Universidad de la República: Montevideo, Uruguay, 2015; ISBN 9974-0-0940-5. [Google Scholar]
  30. Soutullo, A.; Clavijo, C.; Martínez-Lanfranco, J. Especies Prioritarias Para La Conservación En Uruguay. Vertebrados, Moluscos Continentales y Plantas Vasculares; Sistema Nacional de Áreas Protegidas/Dirección Nacional de Medio Ambiente/Ministerio de Vivienda Desarrollo Territorial y Medio Ambiente/Dirección de Ciencia y Tecnología/Ministerio de Educación y Cultura: Montevideo, Uruguay, 2013. [Google Scholar]
  31. Bauni, V.; Anfuso, J.; Schivo, F. Wildlife Roadkill Mortality in the Upper Paraná Atlantic Forest, Argentina. Ecosistemas 2017, 26, 54–66. [Google Scholar] [CrossRef] [Green Version]
  32. QGIS Development Team. QGIS Geographic Information System; Open Source Geospatial Foundation Project: Beaverton, OR, USA, 2016. [Google Scholar]
  33. Mateo, R.G.; Felicísimo, Á.M.; Muñoz, J. Modelos de Distribución de Especies: Una Revisión Sintética. Rev. Chil. Hist. Nat. 2011, 84, 217–240. [Google Scholar] [CrossRef] [Green Version]
  34. López-Sandoval, J.A.; López-Mata, L.; Cruz-Cárdenas, G.; Vibrans, H.; Vargas, O.; Martínez, M. Modelado de Los Factores Ambientales Que Determinan La Distribución de Especies Sinantrópicas de Physalis. Bot. Sci. 2015, 93, 755–764. [Google Scholar] [CrossRef] [Green Version]
  35. Achaval, F.; Clara, M.; Olmos, A. Mamíferos de La República Oriental Del Uruguay. 2da Edición Corregida y Aumentada; Zonalibro: Montevideo, Uruguay, 2007. [Google Scholar]
  36. Barbosa, A.M. FuzzySim: Applying Fuzzy Logic to Binary Similarity Indices in Ecology. Methods Ecol. Evol. 2015, 6, 853–858. [Google Scholar] [CrossRef]
  37. Benjamini, Y.; Hochberg, Y. Controlling the False Discovery Rate: A Practical and Powerful Approach to Multiple Testing. J. R. Stat. Soc. Ser. B Methodol. 1995, 57, 289–300. [Google Scholar] [CrossRef]
  38. García, L.V. Controlling the False Discovery Rate in Ecological Research. Trends Ecol. Evol. 2003, 18, 553–554. [Google Scholar] [CrossRef]
  39. Barbosa, A.M.; Real, R.; Vargas, J.M. Transferability of Environmental Favourability Models in Geographic Space: The Case of the Iberian Desman (Galemys pyrenaicus) in Portugal and Spain. Ecol. Model. 2009, 220, 747–754. [Google Scholar] [CrossRef]
  40. Barbosa, A.M.; Real, R. Favourable Areas for Expansion and Reintroduction of Iberian Lynx Accounting for Distribution Trends and Genetic Diversity of the European Rabbit. Wildl. Biol. Pract. 2010, 6, 34–47. [Google Scholar] [CrossRef]
  41. Barbosa, A.M.; Real, R. Applying Fuzzy Logic to Comparative Distribution Modelling: A Case Study with Two Sympatric Amphibians. Sci. World J. 2012, 2012, 1–10. [Google Scholar] [CrossRef] [PubMed] [Green Version]
  42. Lumley, T. Analysis of Complex Survey Samples. J. Stat. Softw. 2004, 9, 1–19. [Google Scholar] [CrossRef] [Green Version]
  43. Wald, A. Tests of Statistical Hypotheses Concerning Several Parameters When the Number of Observations Is Large. Trans. Am. Math. Soc. 1943, 54, 426–482. [Google Scholar] [CrossRef]
  44. Barbosa, A.M.; Real, R.; Muñooz, A.R.; Brown, J.A. New measures for assessing model equilibrium and prediction mismatch in species distribution models. Divers. Distrib. 2015, 19, 1333–1338. [Google Scholar] [CrossRef]
  45. R Core Team. R: A Language and Environment for Statistical Computing; R Core Team: Vienna, Austria, 2013. [Google Scholar]
  46. Lee, E.; Klöcker, U.; Croft, D.B.; Ramp, D. Kangaroo-Vehicle Collisions in Australia’s Sheep Rangelands, during and Following Drought Periods. Aust. Mammal. 2004, 26, 215–226. [Google Scholar] [CrossRef] [Green Version]
  47. Ramp, D.; Caldwell, J.; Edwards, K.A.; Warton, D.; Croft, D.B. Modelling of Wildlife Fatality Hotspots along the Snowy Mountain Highway in New South Wales, Australia. Biol. Conserv. 2005, 126, 474–490. [Google Scholar] [CrossRef]
  48. Klöcker, U.; Croft, D.B.; Ramp, D. Frequency and Causes of Kangaroo–Vehicle Collisions on an Australian Outback Highway. Wildl. Res. 2006, 33, 5–15. [Google Scholar] [CrossRef]
  49. Litvaitis, J.A.; Tash, J.P. An Approach toward Understanding Wildlife-Vehicle Collisions. Environ. Manag. 2008, 42, 688–697. [Google Scholar] [CrossRef]
  50. Gunson, K.E.; Clevenger, A.P.; Ford, A.T.; Bissonette, J.A.; Hardy, A. A Comparison of Data Sets Varying in Spatial Accuracy Used to Predict the Occurrence of Wildlife-Vehicle Collisions. Environ. Manag. 2009, 44, 268–277. [Google Scholar] [CrossRef]
  51. Roger, E.; Ramp, D. Incorporating Habitat Use in Models of Fauna Fatalities on Roads. Divers. Distrib. 2009, 15, 222–231. [Google Scholar] [CrossRef]
  52. González-Vélez, J.C.; Torres-Madronero, M.C.; Murillo-Escobar, J.; Jaramillo-Fayad, J.C. An Artificial Intelligent Framework for Prediction of Wildlife Vehicle Collision Hotspots Based on Geographic Information Systems and Multispectral Imagery. Ecol. Inform. 2021, 63, 101291. [Google Scholar] [CrossRef]
  53. Tenés, A.; Cahill, S.; Llimona, F.; Molina, G. Atropellos de Mamíferos y Tráfico en la Red Viaria de un Espacio Natural en el Área Metropolitana de Barcelona: Quince Años de Seguimiento En El Parque de Collserola. Galemys 2007, 19, 169–188. [Google Scholar]
  54. Colino Rabanal, V.J. Contribuciones al Análisis de Mortalidad de Vertebrados En Carreteras. Biol. Anim. (Zoología) 2011. [Google Scholar] [CrossRef]
  55. San Vicente, M.G.; Valencia, P.J.L. Causas de Los Procesos Territoriales de Fragmentación de Hábitats. Lurralde Inves. Espac. 2010, 33, 147–158. [Google Scholar]
  56. Vélez, C.A.D. Adiciones al Atropellamiento Vehicular de Mamíferos En La Vía de El Escobero, Envigado (Antioquia), Colombia. Rev. EIA 2014, 11, 147–153. [Google Scholar]
  57. Espinosa-Flores, M. Efecto de La Matriz En Un Paisaje Fragmentado Sobre La Riqueza de Especies de Mamíferos Terrestres En El Estado de Guanajuato, México. Master’s Thesis, Universidad Autónoma de Querétaro, Querétaro, Mexico, 2014. [Google Scholar]
  58. Sauzo-Ortuño, I.; Mendoza, E.; Meléndez-Herrera, E. Resiliencia de los Vertebrados a la Antropización del Hábitat. In Ecología y Conservación de Fauna en Ambientes Antropizados; Ramírez-Bautista, A., Ed.; REFAMA-CONACyT-UAQ: Querétaro, Mexico, 2018; p. 403. [Google Scholar]
  59. San Vicente, M.G.; Valencia, P.J.L. Criterios Para Contemplar La Conectividad Del Paisaje En La Planificación Territorial y Sectorial. Investig. Geográficas Esp. 2007, 44, 75–88. [Google Scholar] [CrossRef] [Green Version]
  60. Manteca-Rodríguez, M.; Félix-Burruel, R.E.; Aguilar-Morales, C.; Bravo, J.C.; Traphagen, M.; Larios, E. Wildlife Use of Drainage Structures under 2 Sections of Federal Highway 2 in the Sky Island Region of Northeastern Sonora, Mexico. Air Soil Water Res. 2021, 14, 1178622120988721. [Google Scholar] [CrossRef]
  61. Ministerio de Agricultura, Alimentación y Medio Ambiente Identificación de Áreas a Desfragmentar Para Reducir Los Impactos de Las Infraestructuras Lineales de Transporte En La Biodiversidad. Documentos Para La Reducción de La Fragmentación de Hábitats Causada Por Infraestructuras de Transporte, Número 6. España. 2013. Available online: https://www.miteco.gob.es/es/biodiversidad/temas/ecosistemas-y-conectividad/6_identificac_areas_a_defragmentar_tcm30-195797.pdf (accessed on 5 October 2021).
  62. Quintero, J. Guía de Buenas Prácticas Para Carreteras Ambientalmente Amigables; The Nature Conservancy & Latin America Conservation Council: Panama City, Panama, 2016. [Google Scholar]
  63. Cacciali, E.; Cammarota, M.; Scavone, M. Situación de la Vialidad Uruguaya 2017; Asociación Uruguaya de Caminos: Montevideo, Uruguay, 2017. [Google Scholar]
  64. Gardiner, M.M.; Riley, C.B.; Bommarco, R.; Öckinger, E. Rights-of-way: A Potential Conservation Resource. Front. Ecol. Environ. 2018, 16, 149–158. [Google Scholar] [CrossRef]
  65. Silva, C.; Simões, M.P.; Mira, A.; Santos, S.M. Factors Influencing Predator Roadkills: The Availability of Prey in Road Verges. J. Environ. Manag. 2019, 247, 644–650. [Google Scholar] [CrossRef] [PubMed]
  66. Hilty, J.; Worboys, G.L.; Keeley, A.; Woodley, S.; Lausche, B.; Locke, H.; Carr, M.; Pulsford, I.; Pittock, J.; White, J.W. Guidelines for Conserving Connectivity through Ecological Networks and Corridors; IUCN: Gland, Switzerland, 2020. [Google Scholar]
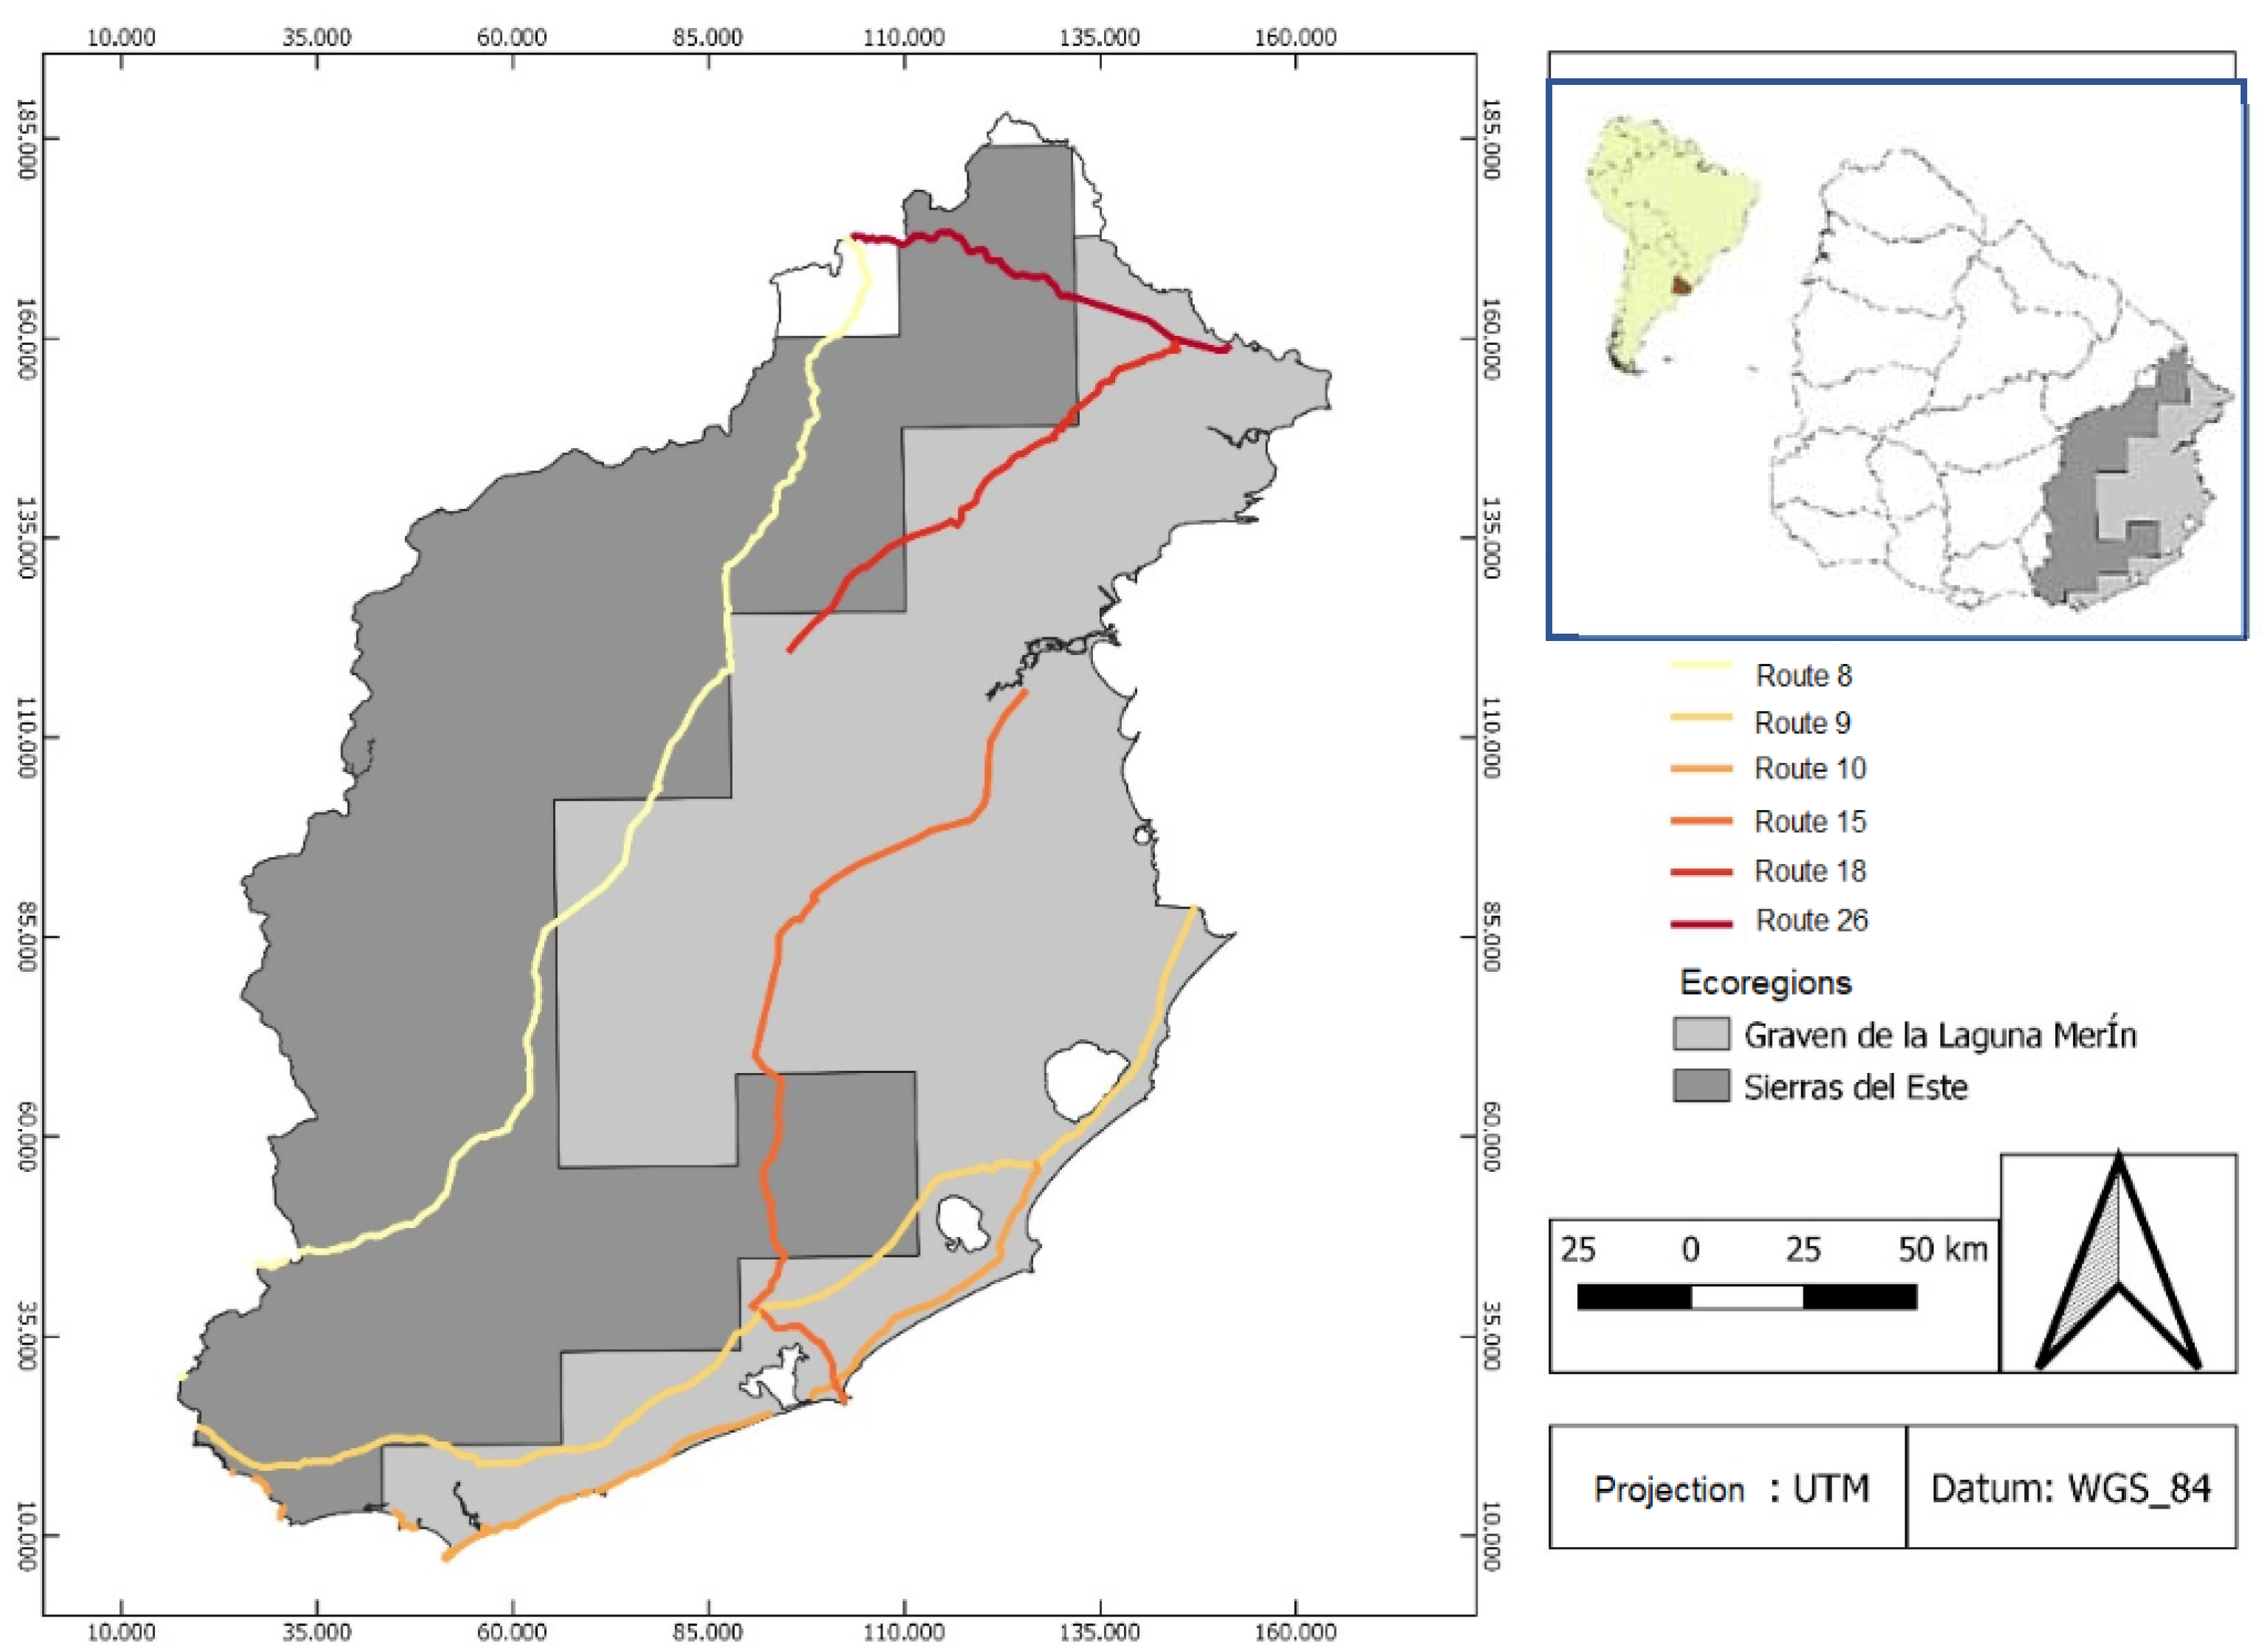
Figure 1. Study area in Uruguay, which includes the Sierras del Este (dark grey) and Graben de la Laguna Merín (light grey) ecoregions. We marked the roads used for modelling.
Diversity 13 00585 g001
Figure 2. Roadkill records of the selected medium and large mammal species (period 2015–2016). (A)—Native Forest species (186 roadkill), (B)—Grassland species (499 roadkill).
Diversity 13 00585 g002
Figure 3. Models obtained for native forest species. (A) Model with the 3 factors (climatic, geographic, and anthropic), (B) Model with the anthropic factor.
Diversity 13 00585 g003
Figure 4. Models obtained for grassland species. (A) Model with the 3 factors (climatic, geographic, and anthropic), (B) Model with the anthropic factor.
Diversity 13 00585 g004
Figure 5. Map of Annual Average Daily Traffic (AADT) for the year 2017 obtained from the Ministry of Transport and Public Works. Here, the different road sections with vehicular circulation were observed.
Diversity 13 00585 g005
Figure 6. Map of roadkill abundances in the period 2017–2019 showing the section of Route 15 that connects the city of Rocha with La Paloma with the sites with the highest mortality.
Diversity 13 00585 g006
Table 1. Medium and large mammal species used to generate the favourability models. * Native forest species. ** Grassland species.
Scientific NameCommon NameNumber of RoadkillsStatus UICNWeight (KG)
Cerdocyon thous *Forest fox117LC8
Procyon cancrivorus *South American raccoon32LC8
Dasypus novemcinctus *Nine-banded armadillo16LC6
Leopardus geoffroyi *Geoffroy’s cat14LC6
Lontra longicaudis *Neotropical otter4NT8
Leopardus wiedii *Margay3NT3
Conepatus chinga **Andes skunk347LC2
Lycalopex gymnocercus **Gray pampean fox125LC4.6
Dasypus hybridus **Southern long-nosed armadillo 14NT2
Galictis cuja **Lesser grison13LC2
Table 2. Explanatory variables obtained for native forest species. The table on the left corresponds to the complete model, whereas the one on the right corresponds to the anthropic model. Sign: indicates the sign of the variable in the model. Wald Index: indicates the relative importance of each variable in the model.
Explanatory VariableSignWald Index
Annual Average Daily Traffic (AADT)+18.94
Bridges+9.12
Urban6.6
Land depth+6.57
Population density6.5
Distance to roads4.23
Annual Average Daily Traffic (AADT)+31.91
Urban10.95
Roads+5.96
Population density4.7
Table 3. Explanatory variables obtained for grassland species. The table on the left corresponds to the complete model, whereas the one on the right corresponds to the anthropic model. Sign: indicates the sign of the variable in the model. Wald Index: indicates the relative importance of each variable in the model.
Explanatory VariableSignWald Index
Precipitation in the wettest quarter (BIO 16)24.38
Urban+21.85
Annual Average Daily Traffic (AADT)21
Roads +17.5
Average temperature in the wettest quarter (BIO 8)13.85
Annual average temperature (BIO 1)+11.22
Population density9
Distance to roads6.78
Forestation5.89
Precipitation seasonality (BIO 15)4.56
Annual Average Daily Traffic (AADT)+57.38
Urban23.18
Roads+17.77
Distance to roads7.66
Forestation5.28
Population density3.93
Table 4. Evaluation index for the complete model (with climatic, geographic, and anthropic factors) for both groups (native forest and grassland species). Area Under the Curve (AUC); Correct Classification Rate (CCR); True Skill Statistic (TSS); Sensitivity; Specificity; Under Prediction Rate (UPR) and Over Prediction Rate (OPR).
AUCCCRSensitivitySpecificityTSSUPROPR
Complete model
(forest sp.)
0.760.650.780.630.420.0380.80
Complete model
(Grassland sp.)
0.780.700.750.450.690.0930.58
Anthropic model
(forest sp.)
0.720.670.630.670.300.0590.81
Anthropic model
(Grassland sp.)
0.770.670.790.430.640.0880.61
Publisher’s Note: MDPI stays neutral with regard to jurisdictional claims in published maps and institutional affiliations.