Article

Seagrass Patch Complexity Affects Macroinfaunal Community Structure in Intertidal Areas: An In Situ Experiment Using Seagrass Mimics

1
Departamento de Biología, Facultad de Ciencias del Mar y Ambientales, Instituto Universitario de Investigación Marina (INMAR), CEI·MAR, Universidad de Cádiz, 11510 Puerto Real, Spain
2
Departamento de Higiene y Tecnología de los Alimentos, Universidad de León, 24071 León, Spain
*
Author to whom correspondence should be addressed.
Diversity 2021, 13(11), 572; https://doi.org/10.3390/d13110572
Submission received: 30 September 2021 / Revised: 3 November 2021 / Accepted: 5 November 2021 / Published: 9 November 2021
(This article belongs to the Special Issue 2021 Feature Papers by Diversity’s Editorial Board Members)

Abstract

:
Seagrasses, as key ecosystem engineers in coastal ecosystems, contribute to enhancing diversity in comparison with nearby bare areas. It has been proved mainly for epifauna, but data on infauna are still scarce. The present study addresses how seagrass structural complexity (i.e., canopy properties) affects the diversity of infaunal organisms inhabiting those meadows. Canopy attributes were achieved using seagrass mimics, which were used to construct in situ vegetation patches with two contrasting canopy properties (i.e., shoot density and morphology) resembling the two seagrass species thriving in the inner Cadiz Bay: Zostera noltei and Cymodocea nodosa. After three months, bare nearby areas, two mimicked seagrass patches (‘Zostera’ and ‘Cymodocea’), and the surrounding natural populations of Zostera noltei were sampled in a spatially explicit way. Shifts in organism diets were also determined using 15N and 13C analyses in available food sources and main infaunal organisms, mixing models, and niche metrics (standard ellipse area). Seagrass-mimicked habitats increased the species richness (two-fold), organism abundance (three to four times), and functional diversity compared with bare nearby areas. The clam Scrobicularia plana (deposit/filter feeder) and the worm Hediste diversicolor (omnivore) were dominant in all of the samples (> 85%) and showed an opposite spatial distribution in the reconstructed patches: whilst S. plana accumulated in the outer-edge parts of the meadow, H. diversicolor abounded in the center. Changes in the isotopic signature of both species depending on the treatment suggest that this faunal distribution was associated with a shift in the diet of the organisms. Based on our results, we concluded that facilitation processes (e.g., reduction in predation and in bioturbation pressures) and changes in food availability (quality and quantity) mediated by seagrass canopies were the main driving forces structuring this community in an intertidal muddy area of low diversity.

Graphical Abstract

1. Introduction

Seagrass ecologists broadly agree that anthropogenic activities are the main drivers of the current regression of seagrass ecosystems worldwide [1]. This brings into awareness that most of the crucial functions and services provided by these valuable ecosystems [2] may decline or even become lost. One of the most important functions of seagrasses is to act as ecosystem engineers [3], supporting higher biodiversity levels than bare areas [4,5,6]. The ongoing regression of seagrasses and/or associated diversity might impair the functioning of coastal ecosystems, with profound consequences for human welfare [7,8,9]. Deepening our understanding on the potential positive interactions between seagrasses and their associated communities is essential for successful conservation and restoration strategies [10,11].
Seagrasses constitute a reduced group of vascular plants that successfully colonized coastal areas through different morphological, physiological, and ecological adaptations allowing for overcoming most of the constraints imposed by the marine environment (e.g., salinity, tides, hydrodynamics, etc.). As a main outcome for such adaptations, most of the seagrass species show an adaptive convergence for morphological (e.g., very flexible aboveground structures and buried rhizomes and roots) and/or ecological traits (e.g., hydrophilic pollination and clonal growth) [12,13]. Seagrasses can occur either as large meadows or as scattered patches along the shore. However, regardless of the spatial pattern, the structural complexity of these habitats, both above and below the sediment surface, is higher than that in neighboring bare areas [14]. Seagrass canopy (i.e., aboveground structures) creates a boundary contrast with the surrounding unvegetated areas [15], which modifies the strength of both top-down and bottom-up processes [16]. Among the most widely studied biotic (i.e., top-down) mechanisms positively affecting the seagrass-inhabiting fauna are (1) the reduction in the strength of the predation intensity; (2) the creation of new habitats and niches, and (3) the reduction in the bioturbation activity of some organisms [5,6,17]. Within the abiotic (i.e., bottom-up), hydrodynamics is probably among the most important variables. In fact, the flexible aboveground biomass (AG) allows plants to reduce the drag force they support by bending in the same direction as the water flow [18,19], reducing the flow velocity throughout the canopy [20] and creating more favorable environmental conditions for fauna development [21,22,23,24,25,26].
Although the effect of increasing AG structural complexity (e.g., total biomass, shoot density, and length) on epifauna diversity has already been largely addressed [5,26,27,28,29,30], similar studies on infauna are scarce. Furthermore, the underlying mechanisms affecting infauna and epifauna are probably different. For instance, whereas a high AG complexity could increase epifaunal diversity either by widening the range of new colonizing areas or by reducing predation rates, such structural complexity could not produce the same outcome for infauna. High AG structural complexity can benefit infauna by (1) reducing predation rates [14], (2) increasing the settling probability of juveniles within the canopy [28,31], (3) improving the environmental conditions for instance for hydrodynamics [24,32], (4) modifying the food availability [33], and (5) excluding bioturbator species [17]. However, AG structural complexity may also produce negative effects on infauna since it may limit the water turnover within the canopy reducing food availability for organisms [33,34,35,36,37]. Furthermore, the dynamics of AG and belowground (BG) compartments in seagrasses are rather coupled [38,39]. Thus, large AG standing stocks are usually accompanied by high BG biomass values, which may affect negatively to infauna due to the reduction in the penetrability of the sediment [17,40]. Therefore, the predicted effects of increasing AG and BG structural complexity on infaunal organisms are not so straightforward as those described for epifauna and are less known so far.
Interactions between seagrass canopy and water flow may alter resource and particle fluxes from and towards the beds affecting seagrass meadows itself [20,41,42] as well as accompanying organisms [22,23,43,44,45]. That is, the quantity and quality (e.g., size) of edible particles is expected to change when water crosses through seagrass canopy, since both the reduction in velocity and the collision of suspended particles with shoots may produce a differential spatial arrangement of the suspended material and may also affect the resuspension of the particles already settled on the sediment surface. The resulting gradients of resource availability within the canopy might play a critical role in the spatial distribution patterns of benthic organisms inhabiting seagrass meadows, since macrofauna, especially filter feeders (such as bivalves), are highly selective for particle collection, filtration, and rejection [33,46,47,48].
The present study aims to explore two hypotheses: first, how changes in the seagrass meadow complexity (i.e., shoot density and morphometry) affect the macroinfaunal community structure (e.g., diversity) of soft-bottom intertidal communities. To answer this question, an in situ experiment was carried out using seagrass mimics to build artificial patches with different canopy properties (i.e., complexity) resembling two species (Zostera noltei and Cymodocea nodosa) thriving on the intertidal areas of Cádiz Bay. Both species have contrasting effects on canopy volumetric flow rate [20,32], which can be considered a proxy for food availability for filter feeders inhabiting seagrass patches [23]. The second hypothesis was to determine whether food availability (i.e., quantity and quality) promoted by changes in canopy properties may induce a diet shift in the macroinfaunal community and therefore contribute to explaining the expected changes in community structure. The stable isotope composition (i.e., 13C and 15N) in the collected macroinfaunal species and in the potential food sources, combined with mixing models and niche metrics (standard ellipse area), were used to determine changes in the diet of the organisms that could be ascribed to the alteration in the hydrodynamically driven food supply by the artificial seagrass patches.

2. Materials and Methods

2.1. Sampling Site

Los Toruños salt marsh is a sea arm at Cádiz Bay Natural Park (36°33′35.11″ N, 6°12′25.69″ W, Figure 1), where mono-specific as well as mixed meadows of the seagrasses Zostera noltei and Cymodocea nodosa occur in intertidal areas at mean depths between 1 and 1.5 m (relative to mean high water level, MHWL [49]). While mixed meadows usually thrive at the sandy mouth of this sea arm, the muddy edges of the channel are colonized by mono-specific Z. noltei stands either in a continuous or a patchy distribution [49]. During ebb and flow tides, there is a strong unidirectional flow parallel to the shoreline, reaching high flow velocities and turbulence levels (up to 75 cm s−1) that completely mix the water body [50]. The sediment is muddy with a high organic matter content, which promotes anoxic conditions and low redox potentials at the sediment surface, with Eh values from −122 mV to −28.3 mV [51].

2.2. Mimics Design

Two types of artificial seagrass shoots (henceforward ‘mimics’) were designed to easily build artificial patches of Zostera noltei (ZNAP) and of Cymodocea nodosa (CNAP) with different canopy properties (i.e., shoot size and density) as well as to imitate the autogenic ecosystem engineer role played by above- and belowground structures [3]. Mimics were made with a silicon tube sealed at both ends (AG structure) attached to a wood stick (BG part) (Figure 2; Figure S1 in Supplementary Material [17,52]). Silicon tubes were rather flexible when interacting with water flow, while the central air chamber, resembling air-lacunae, warranted buoyancy at high tide allowing mimics to be held upright. During emersion, mimics lie on the sediment surface as seagrass leaves do. Wood sticks kept the structures anchored to the sediment while imitating the physical BG network to some extent. Mimic lengths and densities were within those recorded for Z. noltei and C. nodosa meadows in this area [23,53] (Table 1).

2.3. In Situ Experimental Set-Up

The experiment took place in spring and lasted three months (from March to June) in an intertidal muddy-clay location where natural populations of Zostera noltei thrive. This location was selected because of (1) the lack of direct anthropogenic disturbances (it was only accessible by boat), and (2) the low benthic macrofaunal diversity in bare neighboring areas [17]. Mimics were individually planted into the bare sediment to build Zostera (3500 mimics m−2) and Cymodocea (1700 mimics m−2) artificial patches (ZNAP and CNAP, respectively; 0.6 m in diameter each) with similar AG surface areas (i.e., leaf area index, LAI; Table 1). The belowground complexity, estimated as the percentage of sediment occupied, was similar for both types of patches (≈2.7% volume; Table 1). Six artificial patches (1 ZNAP and 1 CNAP × 3 replicates each) were randomly placed into the bare sediment (BS), leaving a minimum gap of 3 m between them and more than 5 m from the nearby natural seagrass populations.

2.4. Sampling Procedure

After 3 months, sediment samples were collected at low tide from ZNAPs, CNAPs, and BSs for infaunal studies. Furthermore, to compare the behavior of artificial patches with natural ones, surrounding Zostera noltei natural patches (ZNNP) of 10 m wide and up to 100 m long) were also sampled. A spatial explicit sampling was designed (Figure 2) to detect if there was a spatial gradient within the artificial patches. Thus, 5 samples (10 cm × 10 cm area, 25 cm depth) were collected per artificial patch along a transect parallel to the shoreline (i.e., main tidal flow direction): two samples at the outer-edges, two samples at the inner-edges, and one sample at the center of the patch (Figure 2). The sampling procedure for BS and ZNNP was different from that for the artificial patches. Previous sampling in the area showed that organism density and diversity levels were quite low in BS. For that reason in BS, five samples were randomly collected using a metal frame (16 cm × 16 cm area, 25 cm depth), while for ZNNP, five samples (10 cm × 10 cm area, 25 cm depth) were taken from the central part of the meadow. Since the highest proportion of the infauna inhabits within the uppermost 10 cm, this depth was considered large enough to ensure the collection of most of the organisms [55,56,57]. All of the samples were cleaned of muddy sediment in situ using a mesh bag (1 mm) and were transported refrigerated to the laboratory within two hours. All mimics were also collected, wrapped into plastic bags, and transported to the laboratory to measure epiphyte coverage and the presence of other settling organisms (e.g., egg masses, bryozoans, etc.).
Sediment organic matter (SOM) was also determined by measuring its concentration and its isotopic signature. Thus, additional sediment samples, close to the previously collected ones, were taken with a core (3 cm diameter, 5 cm depth; Figure 2). Cores were transported refrigerated to the laboratory. In addition, three independent water samples (1.5 L per sample) were collected from the main channel at approximately 1 m depth, kept in darkness, and refrigerated to measure particulate organic matter (POM) and its isotopic signatures. All of these samples were collected at the end of the experimental period.

2.5. Analytical Methods

Once in the laboratory, water samples were split in fine (<200 μm) and large (>200 μm) fractions with a mesh and then filtered at low vacuum in pre-combusted filters (Whatman GF/F, 0.7 μm) to retain all edible particles for infauna (e.g., plankton, feces, uneaten food particles from fish farm, etc.). Subsequently, filters were freeze-dried and sent for isotope analysis (δ13C and δ15N) of POM.
Individual sediment samples were mixed and split. One portion was used for isotopic analysis of SOM. A sub-sample was acidified by adding 2N HCl drop-by-drop to remove carbonates (cessation of bubbling was used as a signal to stop the acidification) and subsequently freeze-dried, ground, and sent for δ13C analysis, while for δ15N analysis, non-acidified replicates were used [58]. The remaining portion of the sediment was oven-dried (60 °C until a constant weight) and, afterwards, burned in a muffle oven (525 °C until constant weight, ≈ 3 h) in pre-weighed ceramic cups. SOM was estimated as weight losses and expressed in %DW [59].
Ten mimics per artificial patch were randomly selected, and epiphytes were removed from the AG structures. The collected epiphytes were oven dried (60 °C) for 24 h and weighed. The data were scaled to AG area and expressed as gDW epiphytes cm−2 mimic. Five extra mimics from each artificial patch were cleaned of epiphytes, and the scraped material was subsequently freeze-dried, ground, and used for isotope analysis of the epiphyte community.
At a first glance, infauna samples revealed that the worm Hediste diversicolor (Müller, 1776) and the clam Scrobicularia plana (da Costa, 1778) were the dominant species (abundance >85 %). Accordingly, a minimum of five individuals of each species per sample were quickly selected once in the laboratory. These specimens were individually weighted, freeze-dried (only soft tissues in S. plana), ground (5 organisms per sample), and used for isotope analysis. Remaining fauna material was soaked in rose bengal (70% ethanol), identified to the species level, and weighed after drying (60 °C for 48–72 h). The species were also sorted out into functional groups based on the feeding type [44]. Seagrass material from ZNNP was split into AG and BG biomass, dried (48 h at 60 °C), and weighed (Table 2). Before drying, some shoots were collected from each sample, freeze-dried, ground, and used for isotope analysis.

2.6. Carbon and Nitrogen Composition and Isotopic Analysis

Samples were analyzed in an elemental analyzer coupled with an isotope ratio mass spectrometer (Europa Hydra IRMS coupled to a Carlo Erba NC250) for the determination of nitrogen and carbon content (% DW), and stable isotopes. Stable isotope ratios were converted to ‰ notation using Peedee Belamite (PDB) and air-N2 as standards for C and N, respectively. The stable isotope ratio in the tissues of organisms (Scrobicularia plana and Hediste diversicolor) is directly related to its diet (e.g., potential food sources such as POM, SOM, epiphytes, and Zostera noltei leaves [60,61]). As the number of potential food sources exceeded the number of isotopes analyzed plus 1 (2 isotopes), a Bayesian mixing model (v4.0.3) (MixSIAR [62]) was applied to estimate the contribution of the different sources to diet, employing trophic enrichment factors previously used for H. diversicolor and S. plana13C = 0.30 ± 0.21 and Δ15N = 2.5 ± 0.05) [63]. Since epiphytes from artificial patches of Z. noltei and C. nodosa were only available under such treatments, these food sources were only utilized in ZNAP and CNAP treatments. The isotopic niche width for each treatment in both species was estimated using stable isotope Bayesian ellipses in R (SIBER [64]), which generates standard ellipse corrected areas (SEAc, containing 40% of the data) in a δ 13C-δ 15N bi-plot space. SEAc overlap between treatments was calculated as the proportion of the non-overlapping area (total overlap area divided by the sum of the areas of two ellipses minus the total overlap area). SEAc overlap values ≥ 60% were considered biologically significant [65].

2.7. Statistics

A one-way ANOVA test was used to determine the effects of AG mimics with different canopy properties on infauna species richness and abundance. Therefore, we specifically tested the factors (1) bare sediment (BS), (2) Zostera noltei artificial patches (ZNAP), (3) Cymodocea nodosa artificial patches (CNAP), and (4) Z. noltei natural populations (ZNNP). This latter factor was used for comparison purposes with the artificial patches. A two-way ANOVA was also applied to check differences across spatial gradient and between both types of artificial patches. Therefore, in this second case, we specifically tested the factors (1) position within the patch, (2) type of artificial patches, and (3) interaction between factors. In those cases where significant differences were found, post hoc Tukey tests were accomplished. Differences in isotopic signatures (δ13C and δ15N) between treatments were also checked with a one-way ANOVA analysis. Homoscedasticity and normality of the data were checked before conducting ANOVA tests, and data were log- or arcsine-transformed since heteroscedasticity was found in some of the variables. The data are shown as means ± standard error (SE). The significance level was set at 5% probability (α = 0.05).
A multidimensional scaling MDS [66,67], ANOSIM [68], and permutational multivariate analyses of variance (PERMANOVA [69,70]) were applied to identify community similarities between treatments. After four-root transformation, a Bray–Curtis resemblance matrix was obtained from an abundance benthic data matrix. Additionally, the taxa contributing to dissimilarities observed were checked by the SIMPER analysis [71]. The multivariate analysis was developed using PRIMER (Plymouth Routines In Multivariate Ecological Research, 6.1.13 software [72]).

3. Results

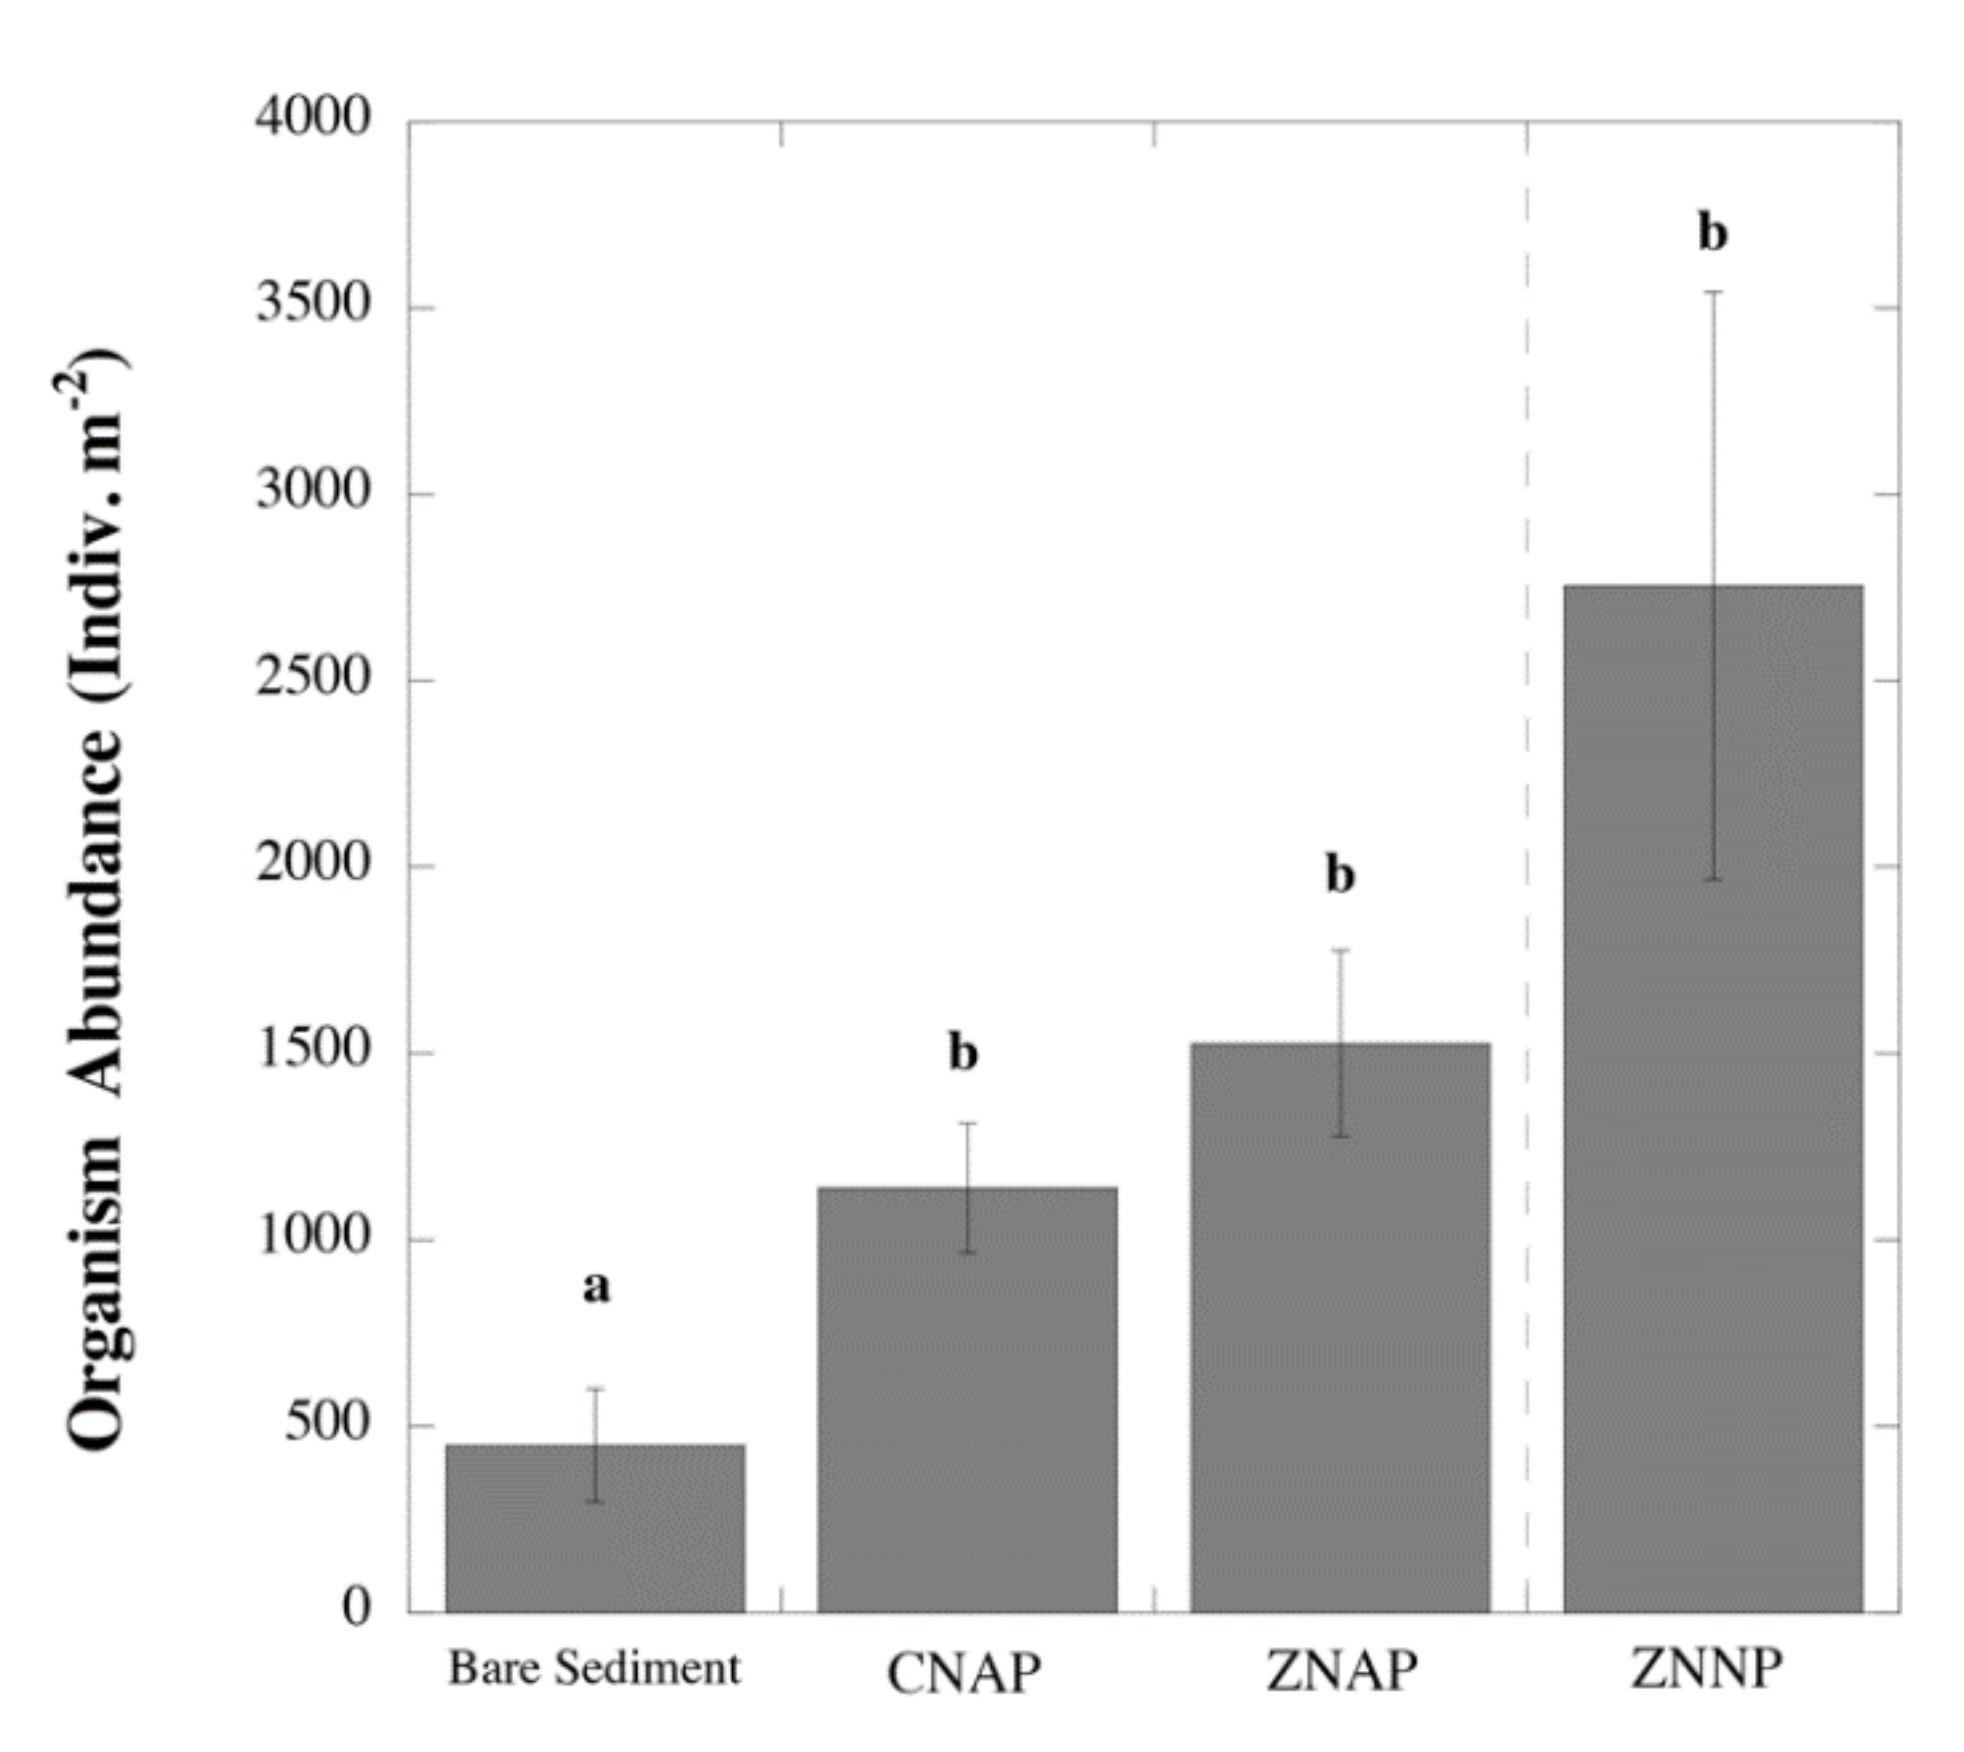
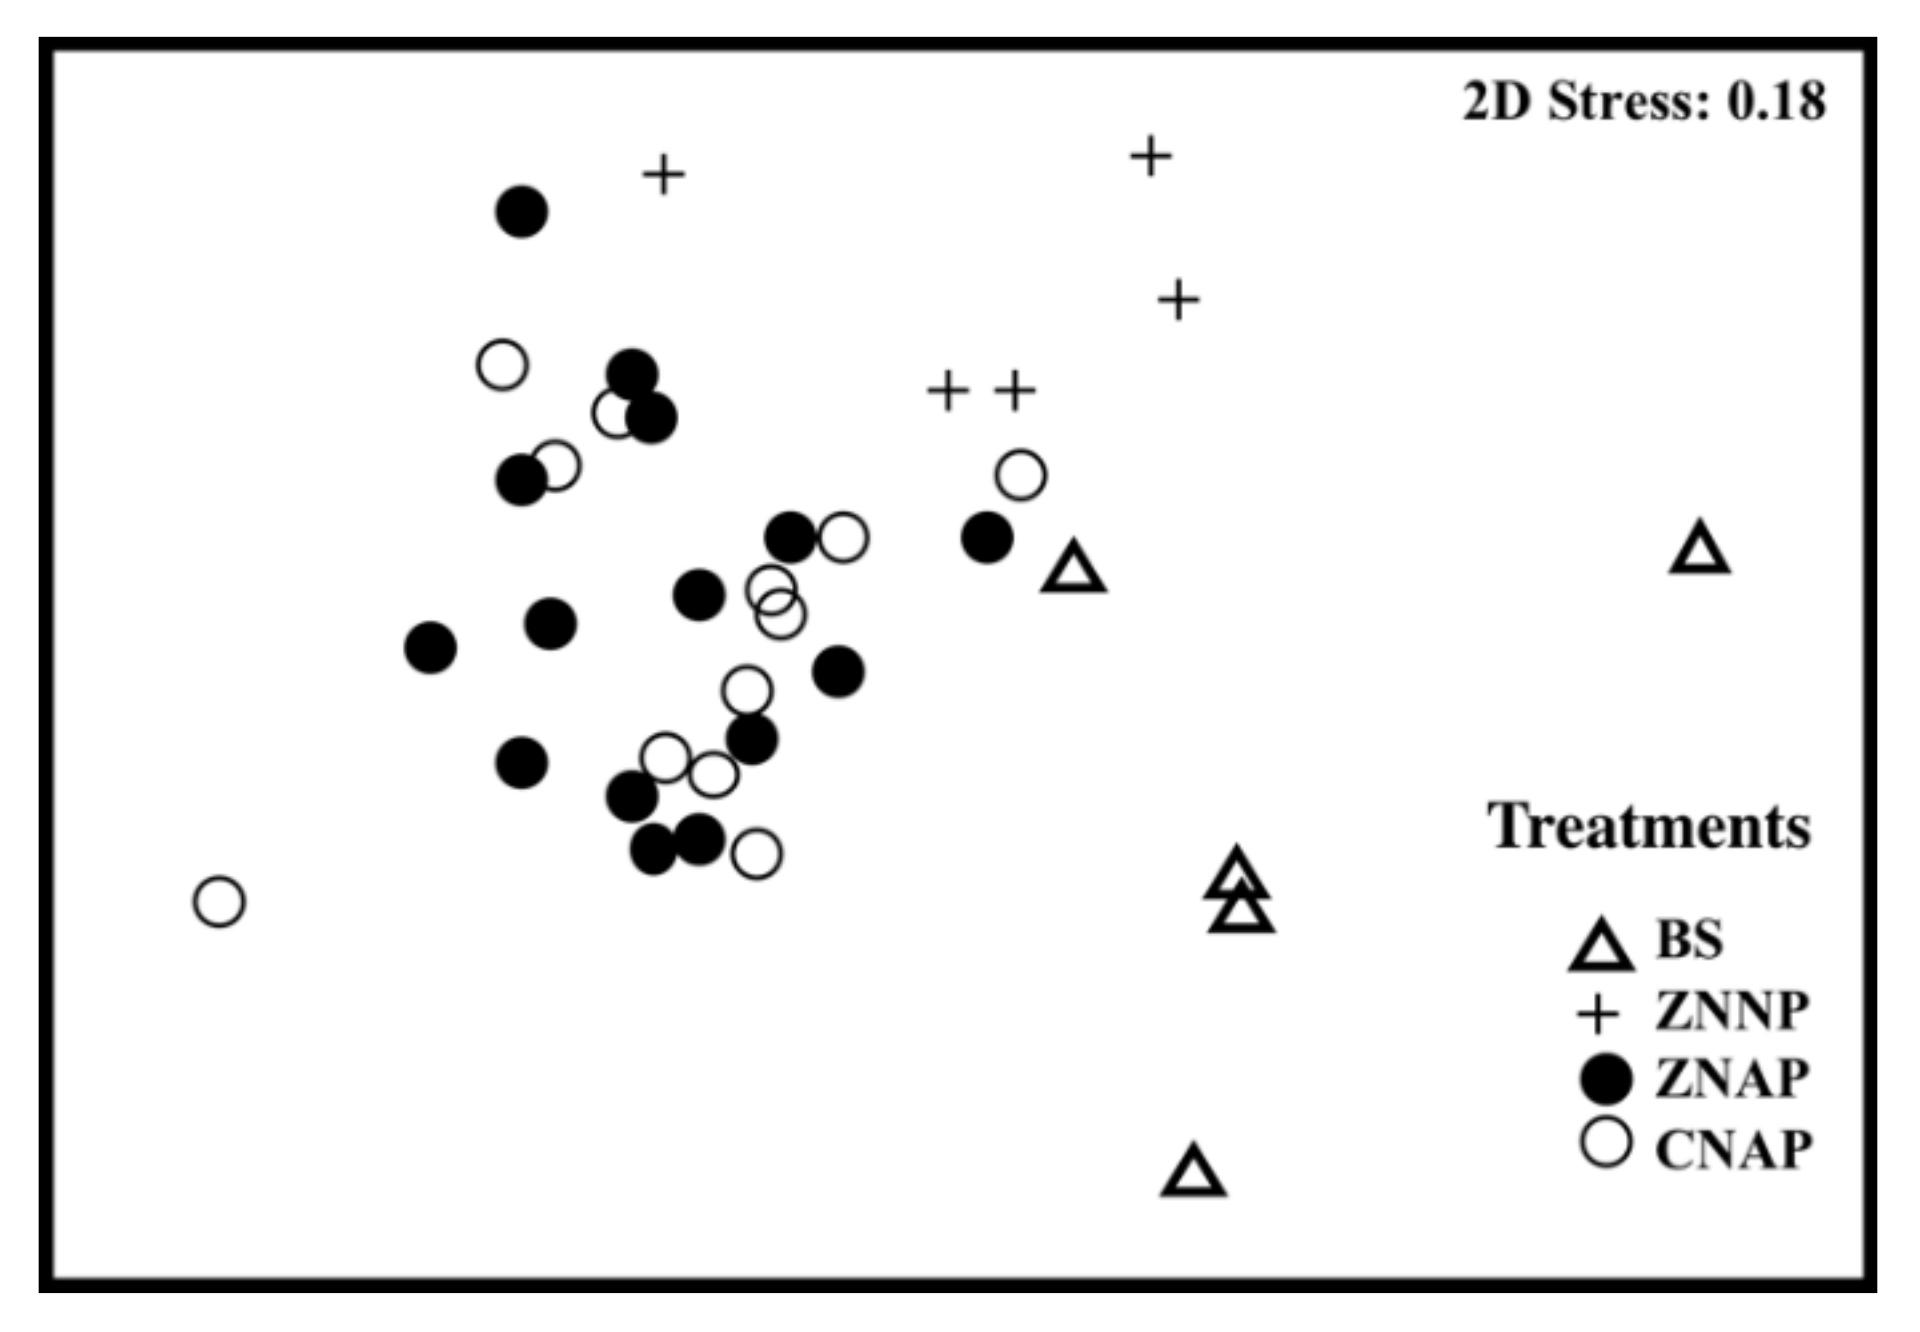
3.1. Effects of Canopy Properties on Species Richness and Abundance

Overall, infaunal species richness, functional diversity (measured as increase in feeding types) and organism density were higher in artificial patches (ZNAP and CNAP) than in BS (Figure 3; Table 2). Particularly, species richness doubled that in BS and was similar to ZNNP. Such an increase was associated with a rise in functional diversity, where mainly carnivore polychaetes increased in number (Table 2). Infaunal abundance also increased 4 to 6 times (F3.31 = 6.14, p < 0.001) in comparison with BS but without significant differences between ZNAP and CNAP (Figure 3).
Differences in species composition were found among treatments. Even though the MDS plot was a relatively poor 2-D representation (stress = 0.18; 3-D, stress = 0.11) (Figure 4), the differences among the dominant species were significant (ANOSIM: R = 0.367, p < 0.001; PERMANOVA p < 0.001). Maximum differences were found between BS and artificial patches (ANOSIM: BS-ZNAP, R = 0.795, p < 0.005; BS-CNAP, R = 0.723, p < 0.005) with the latter displaying the highest values. In contrast, no significant differences were found between artificial patches (ZNAP-CNAP, R = −0.039, p = 0.08). The clam Scrobicularia plana was the dominant species in all of the sampled points and had the maximum contribution to similarity between treatments (SIMPER). The second-most abundant species was the worm Hediste diversicolor (Table 2). Although both species were found in all of the sampled plots, H. diversicolor was recorded only in one of the five samples from BS. Furthermore, although the total contribution of both species to the total infauna was quite constant in all of the sampled points (>85%), it changed drastically when artificial patches were included in the system (Table 2); whereas H. diversicolor represented less than 7% in untreated plots (BS and ZNNP), its abundance increased up to 32% in ZNAP and CNAP (Table 2).

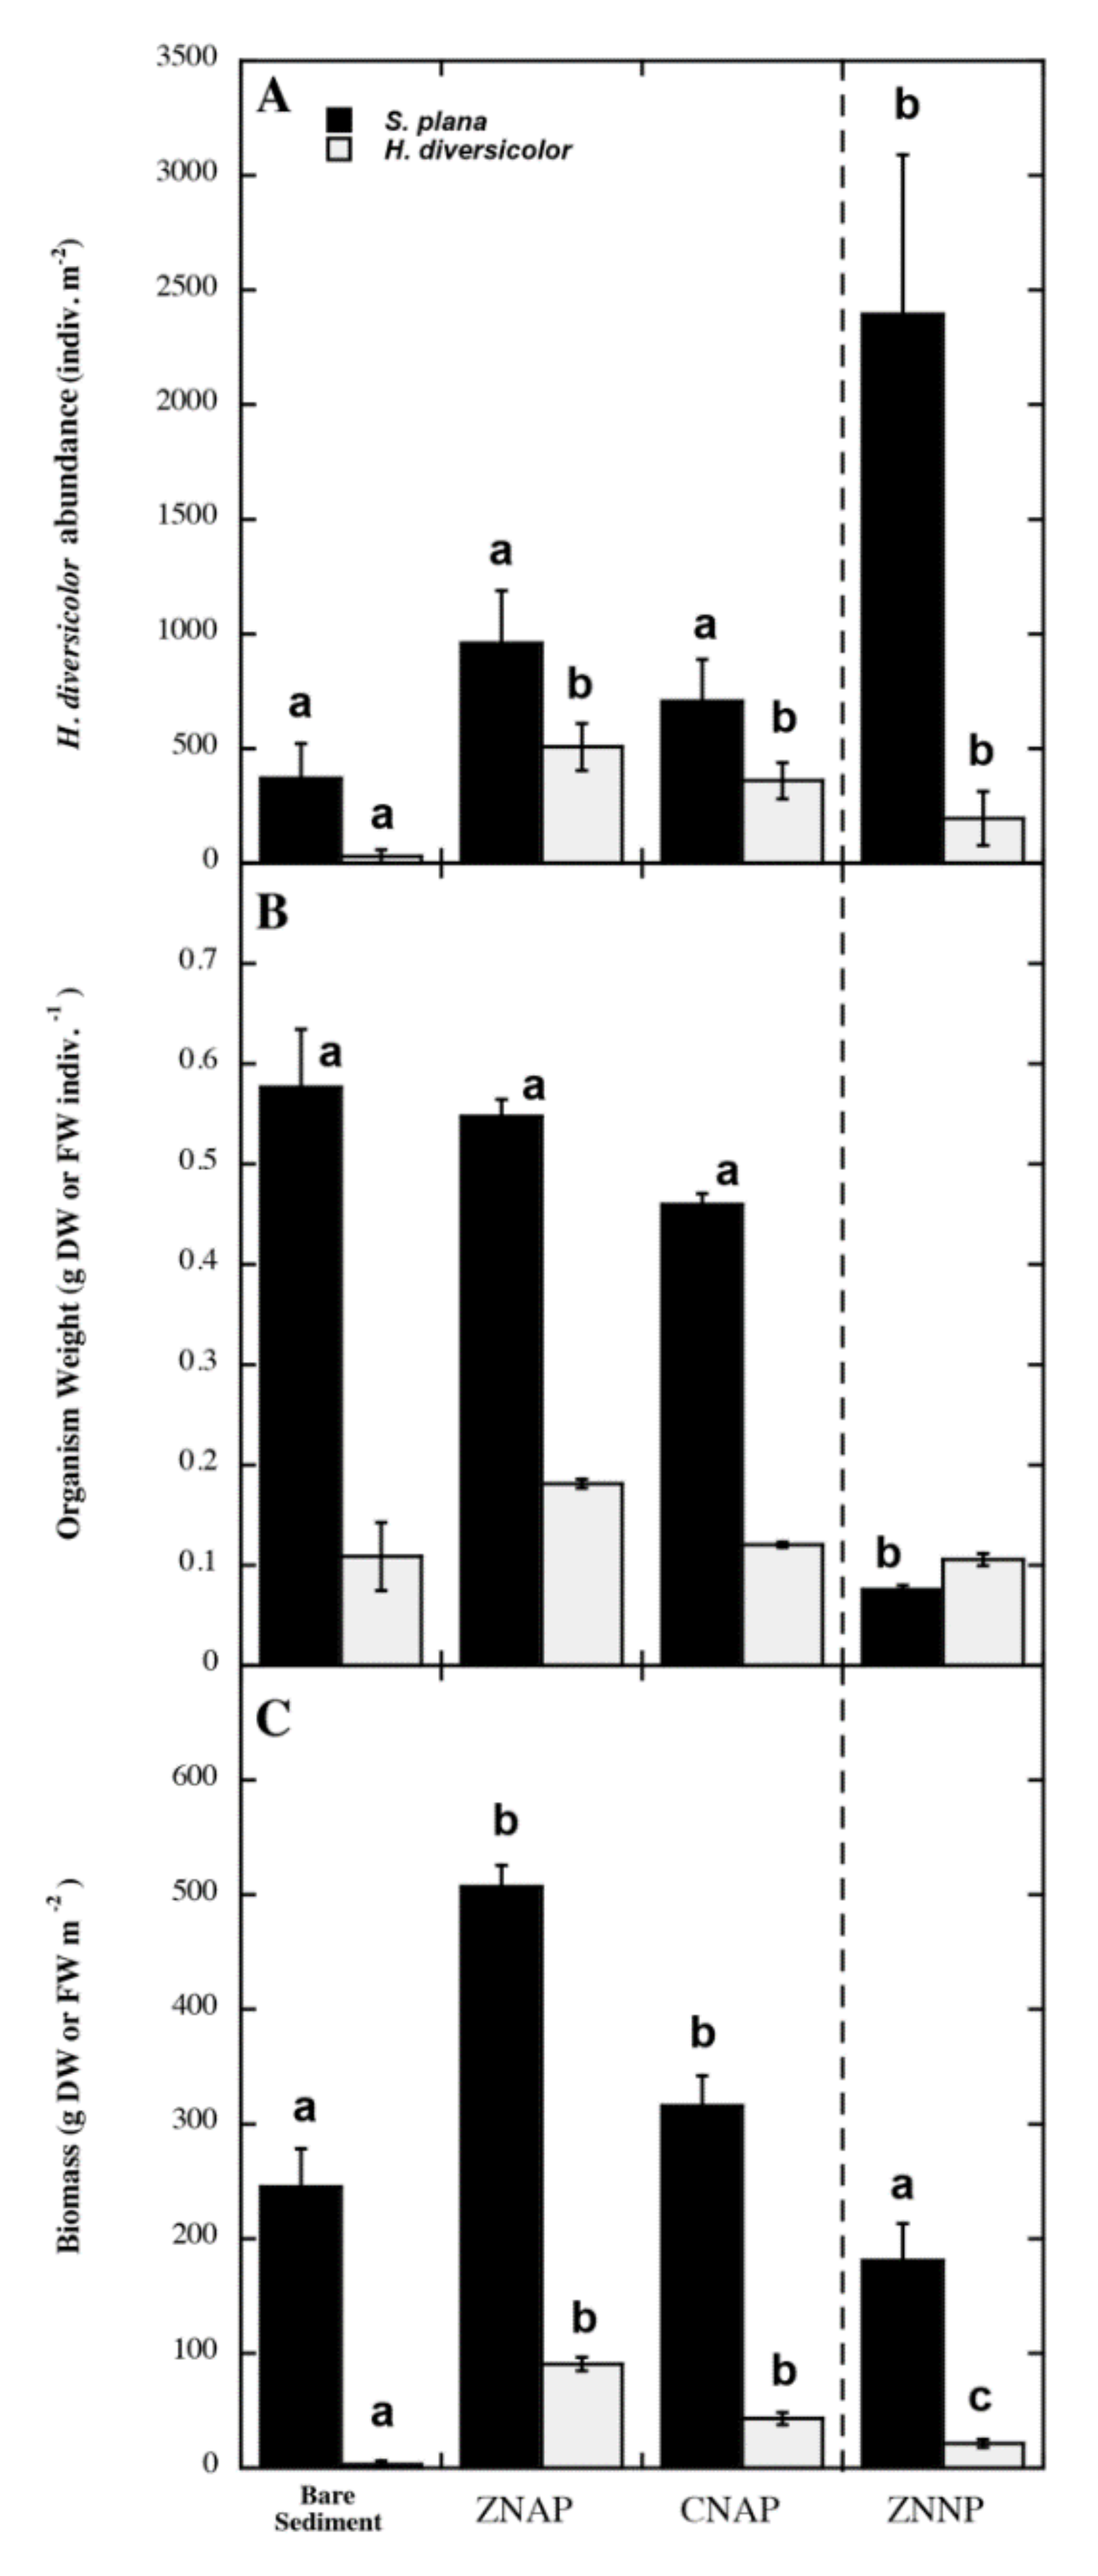
3.2. Effects of Canopy Properties on Scrobicularia Plana and Hediste Diversicolor Abundance

Although the abundance of both species was higher in artificial patches than in BS (Figure 5A), significant differences were only found for Hediste diversicolor, since large within-patch variability was found for Scrobicularia plana. The weights of S. plana and H. diversicolor individuals were not statistically different among treatments (BS, ZNAP, and CNAP), while the weight and size (data not shown) of S. plana were significantly lower in ZNNP (Figure 5B). The total biomass recorded within both types of artificial patches was similar for each species but significantly higher than that found either in BS or ZNNP (Figure 5C).

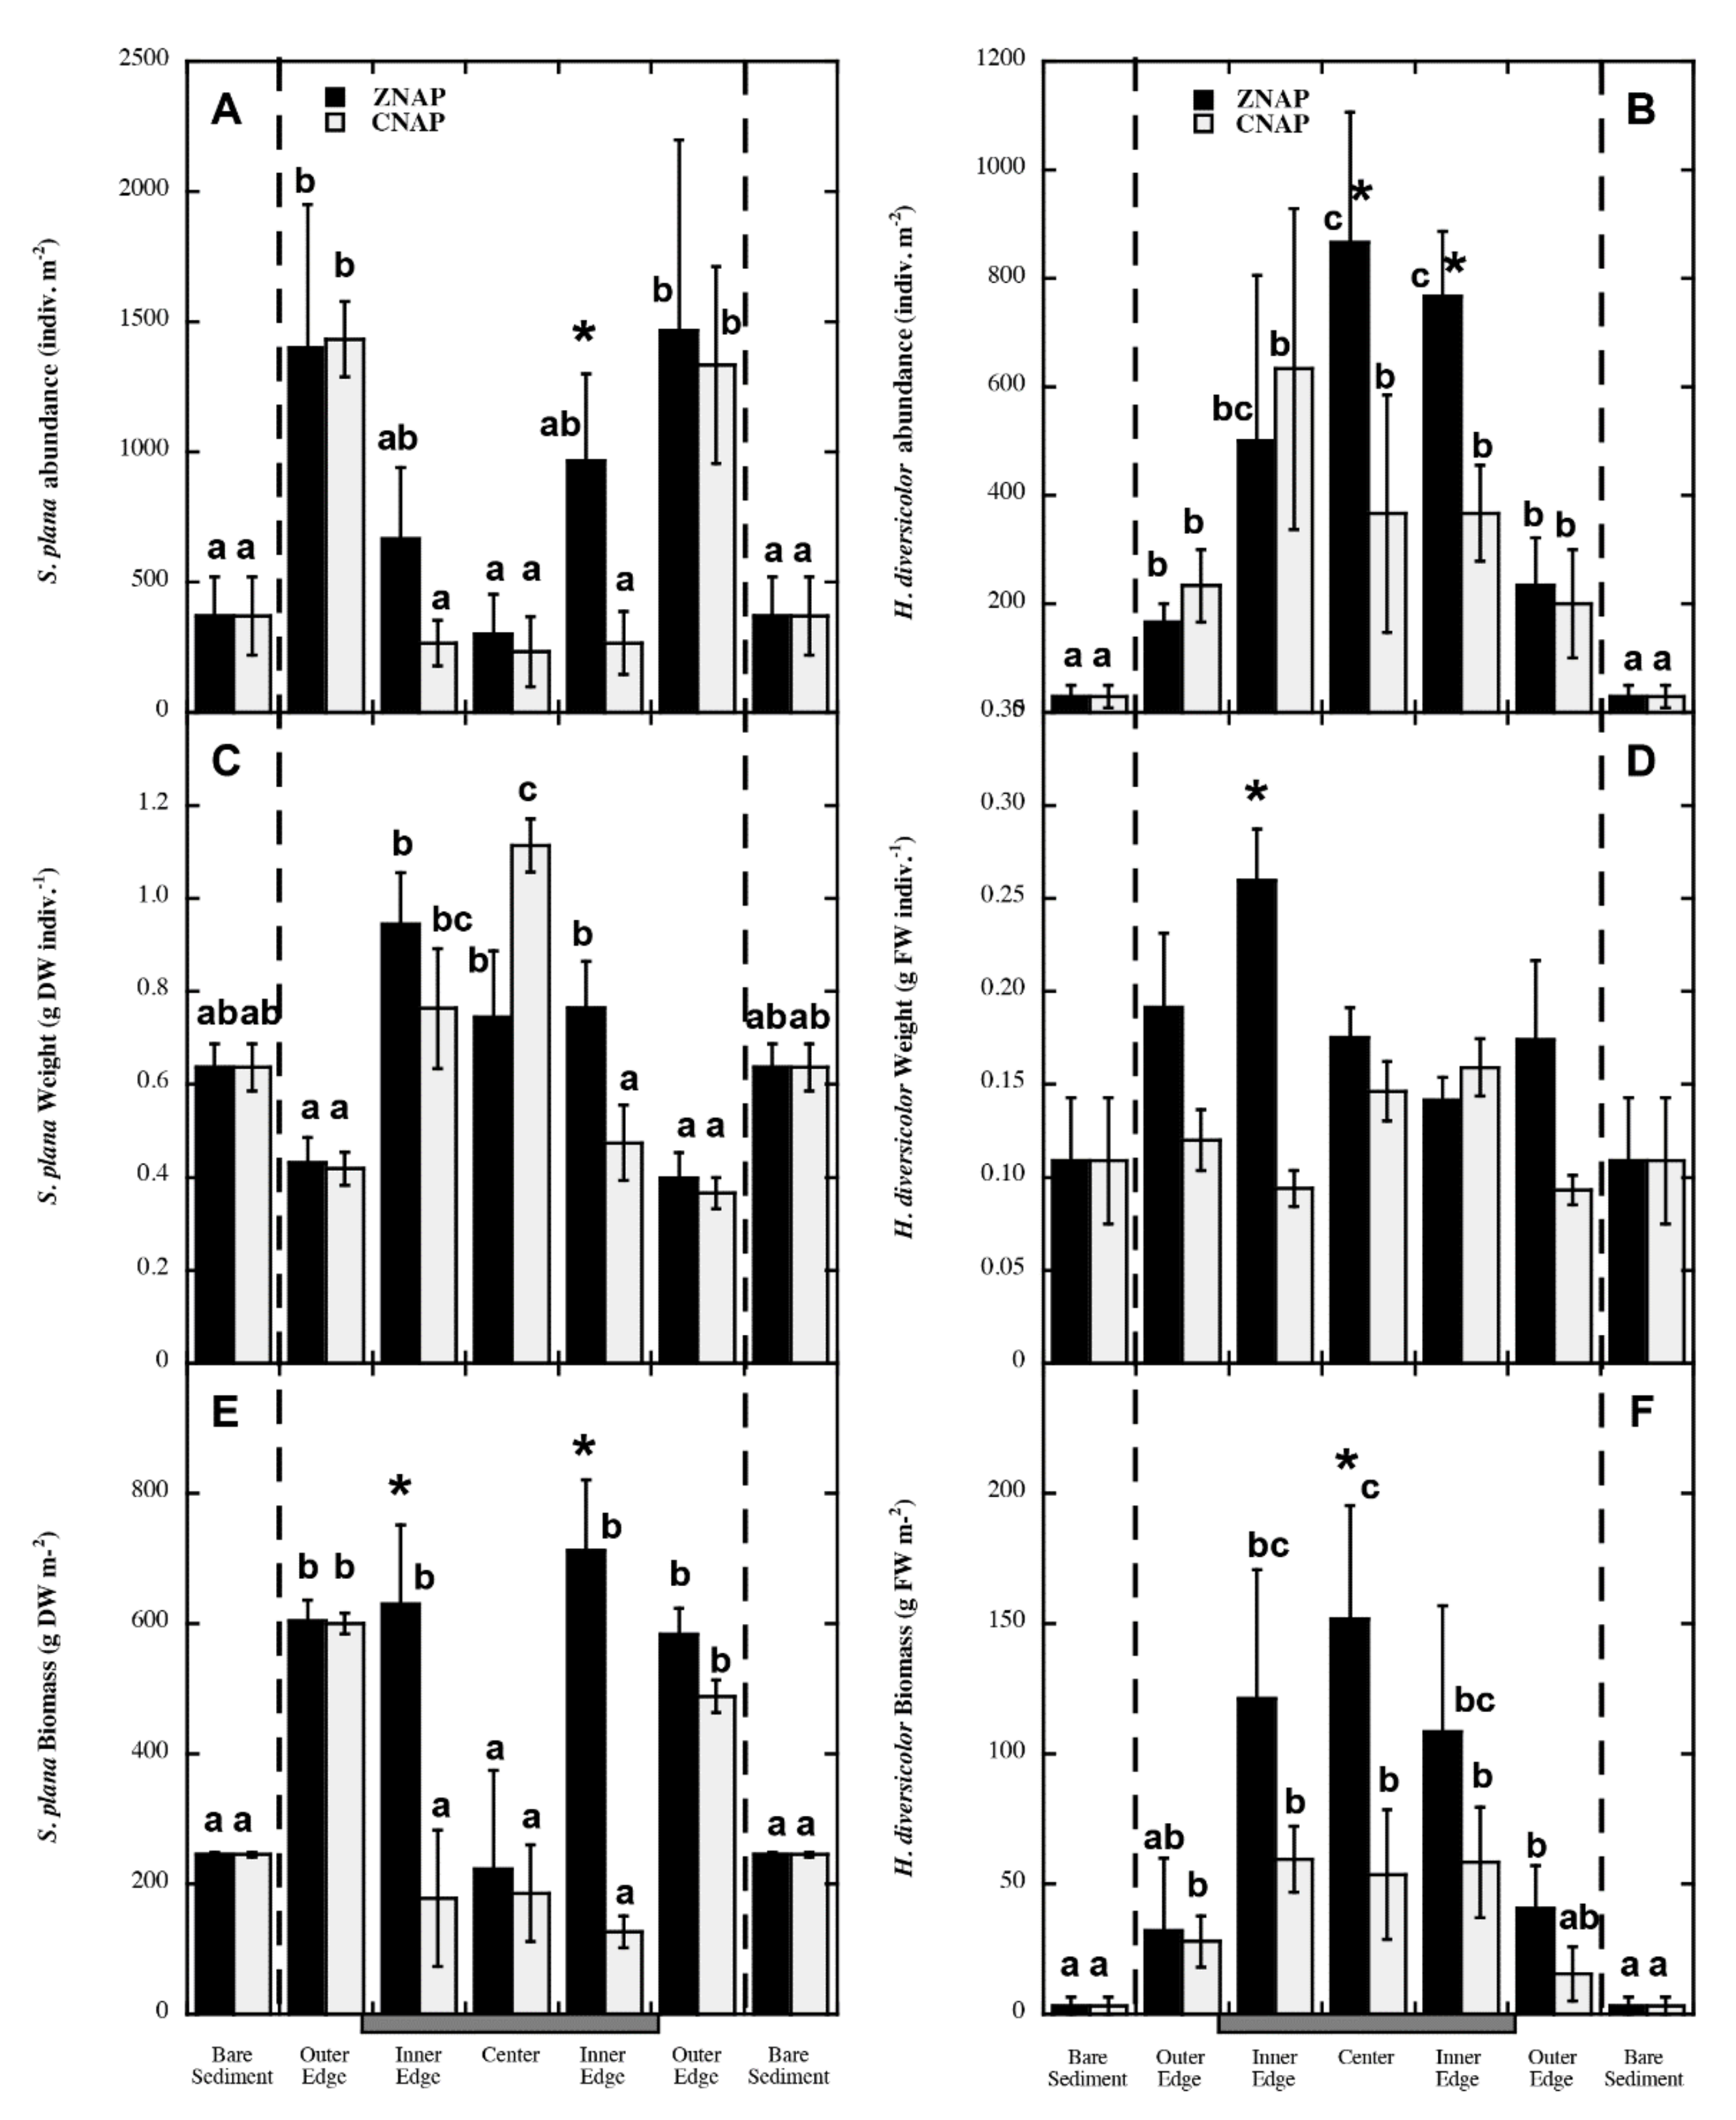
3.3. Spatial Explicit Gradients on S. plana and H. diversicolor Distribution within the Canopy

A clear and significant species-specific spatial explicit gradient was recorded for both species regardless of the artificial patch type: whereas S. plana abundance increased centrifugally (Figure 6A), the pattern was centripetal for H. diversicolor (Figure 6B). This spatial gradient was accompanied, mainly in the case of S. plana, by changes in the individual body weight and size (Figure 6C,D): individuals of S. plana were, in general, smaller (weight and size) in the outer-edges than in the center of artificial patches (Figure 6C). As for individual abundance, total biomass for S. plana accumulated significantly at the periphery of the artificial patches. In addition, there were significant interactions between patch types (i.e., ZNAP or CNAP) and position (i.e., inner edge) in the total biomass of S. plana (Figure 6E). The total biomass for H. diversicolor was higher at the patch regardless of the patch type (Figure 6F), although only spatial explicit significant differences were found for ZNAP. In addition, lower biomass values were recorded at BS than at either ZNAP or CNAP for H. diversicolor (Figure 6F).

3.4. Organic Matter Content, Epiphytes, and Egg Masses

Overall, sediment organic matter content (SOM) was relatively high (Table 2). Although a minor decrease in SOM was recorded in ZNAP and CNAP in comparison with BS, differences were not statistically significant. Spatial gradients within the patches did not reveal any significant effect on the SOM content either (data not shown). Canopy properties affected epiphyte (mostly green algae) abundance, with a three-fold increase in CNAP compared with ZNAP at the end of the experiment (Table 2). The net production of epiphytes, estimated from biomass accumulation along the experiment (92 days) was 5.5 and 17 g DW × m−2 meadow d−1 for ZNAP and CNAP. Mimics also favored the anchorage of egg-laying. The most abundant and widely distributed egg masses in all artificial patches were from the cuttlefish Sepia officinalis, with a mean value of 52 ± 32 and 72 ± 42 eggs m−2 meadow for ZNAP and CNAP, respectively.

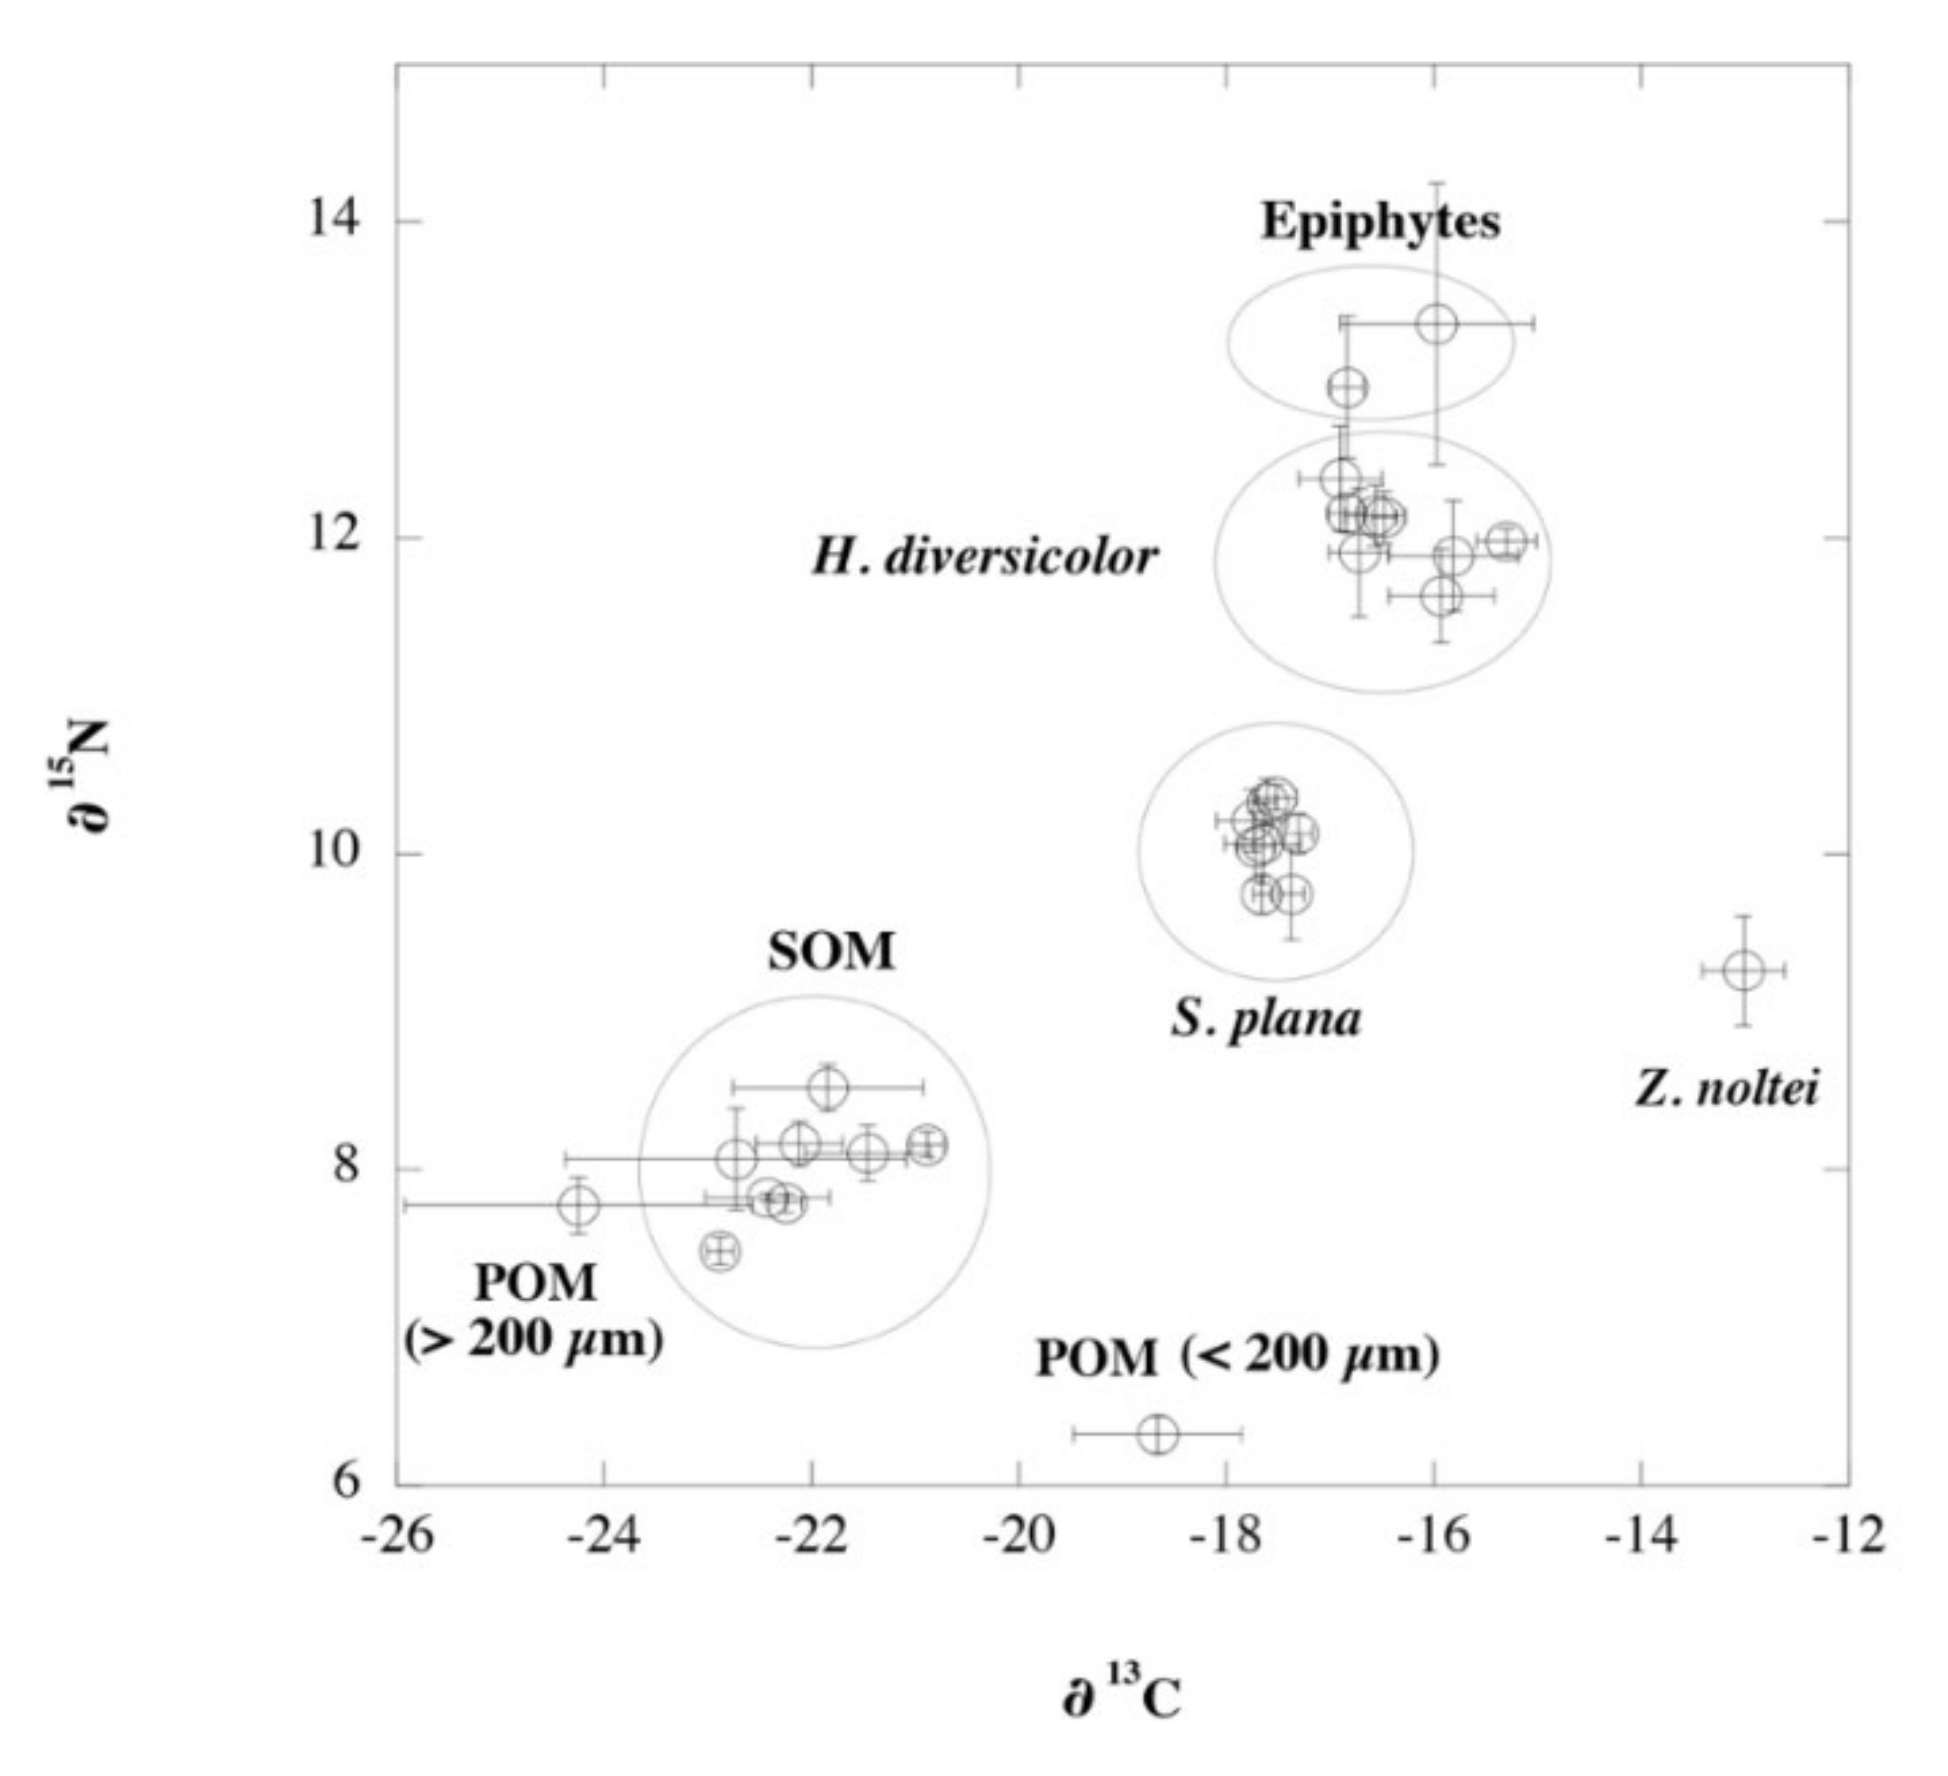
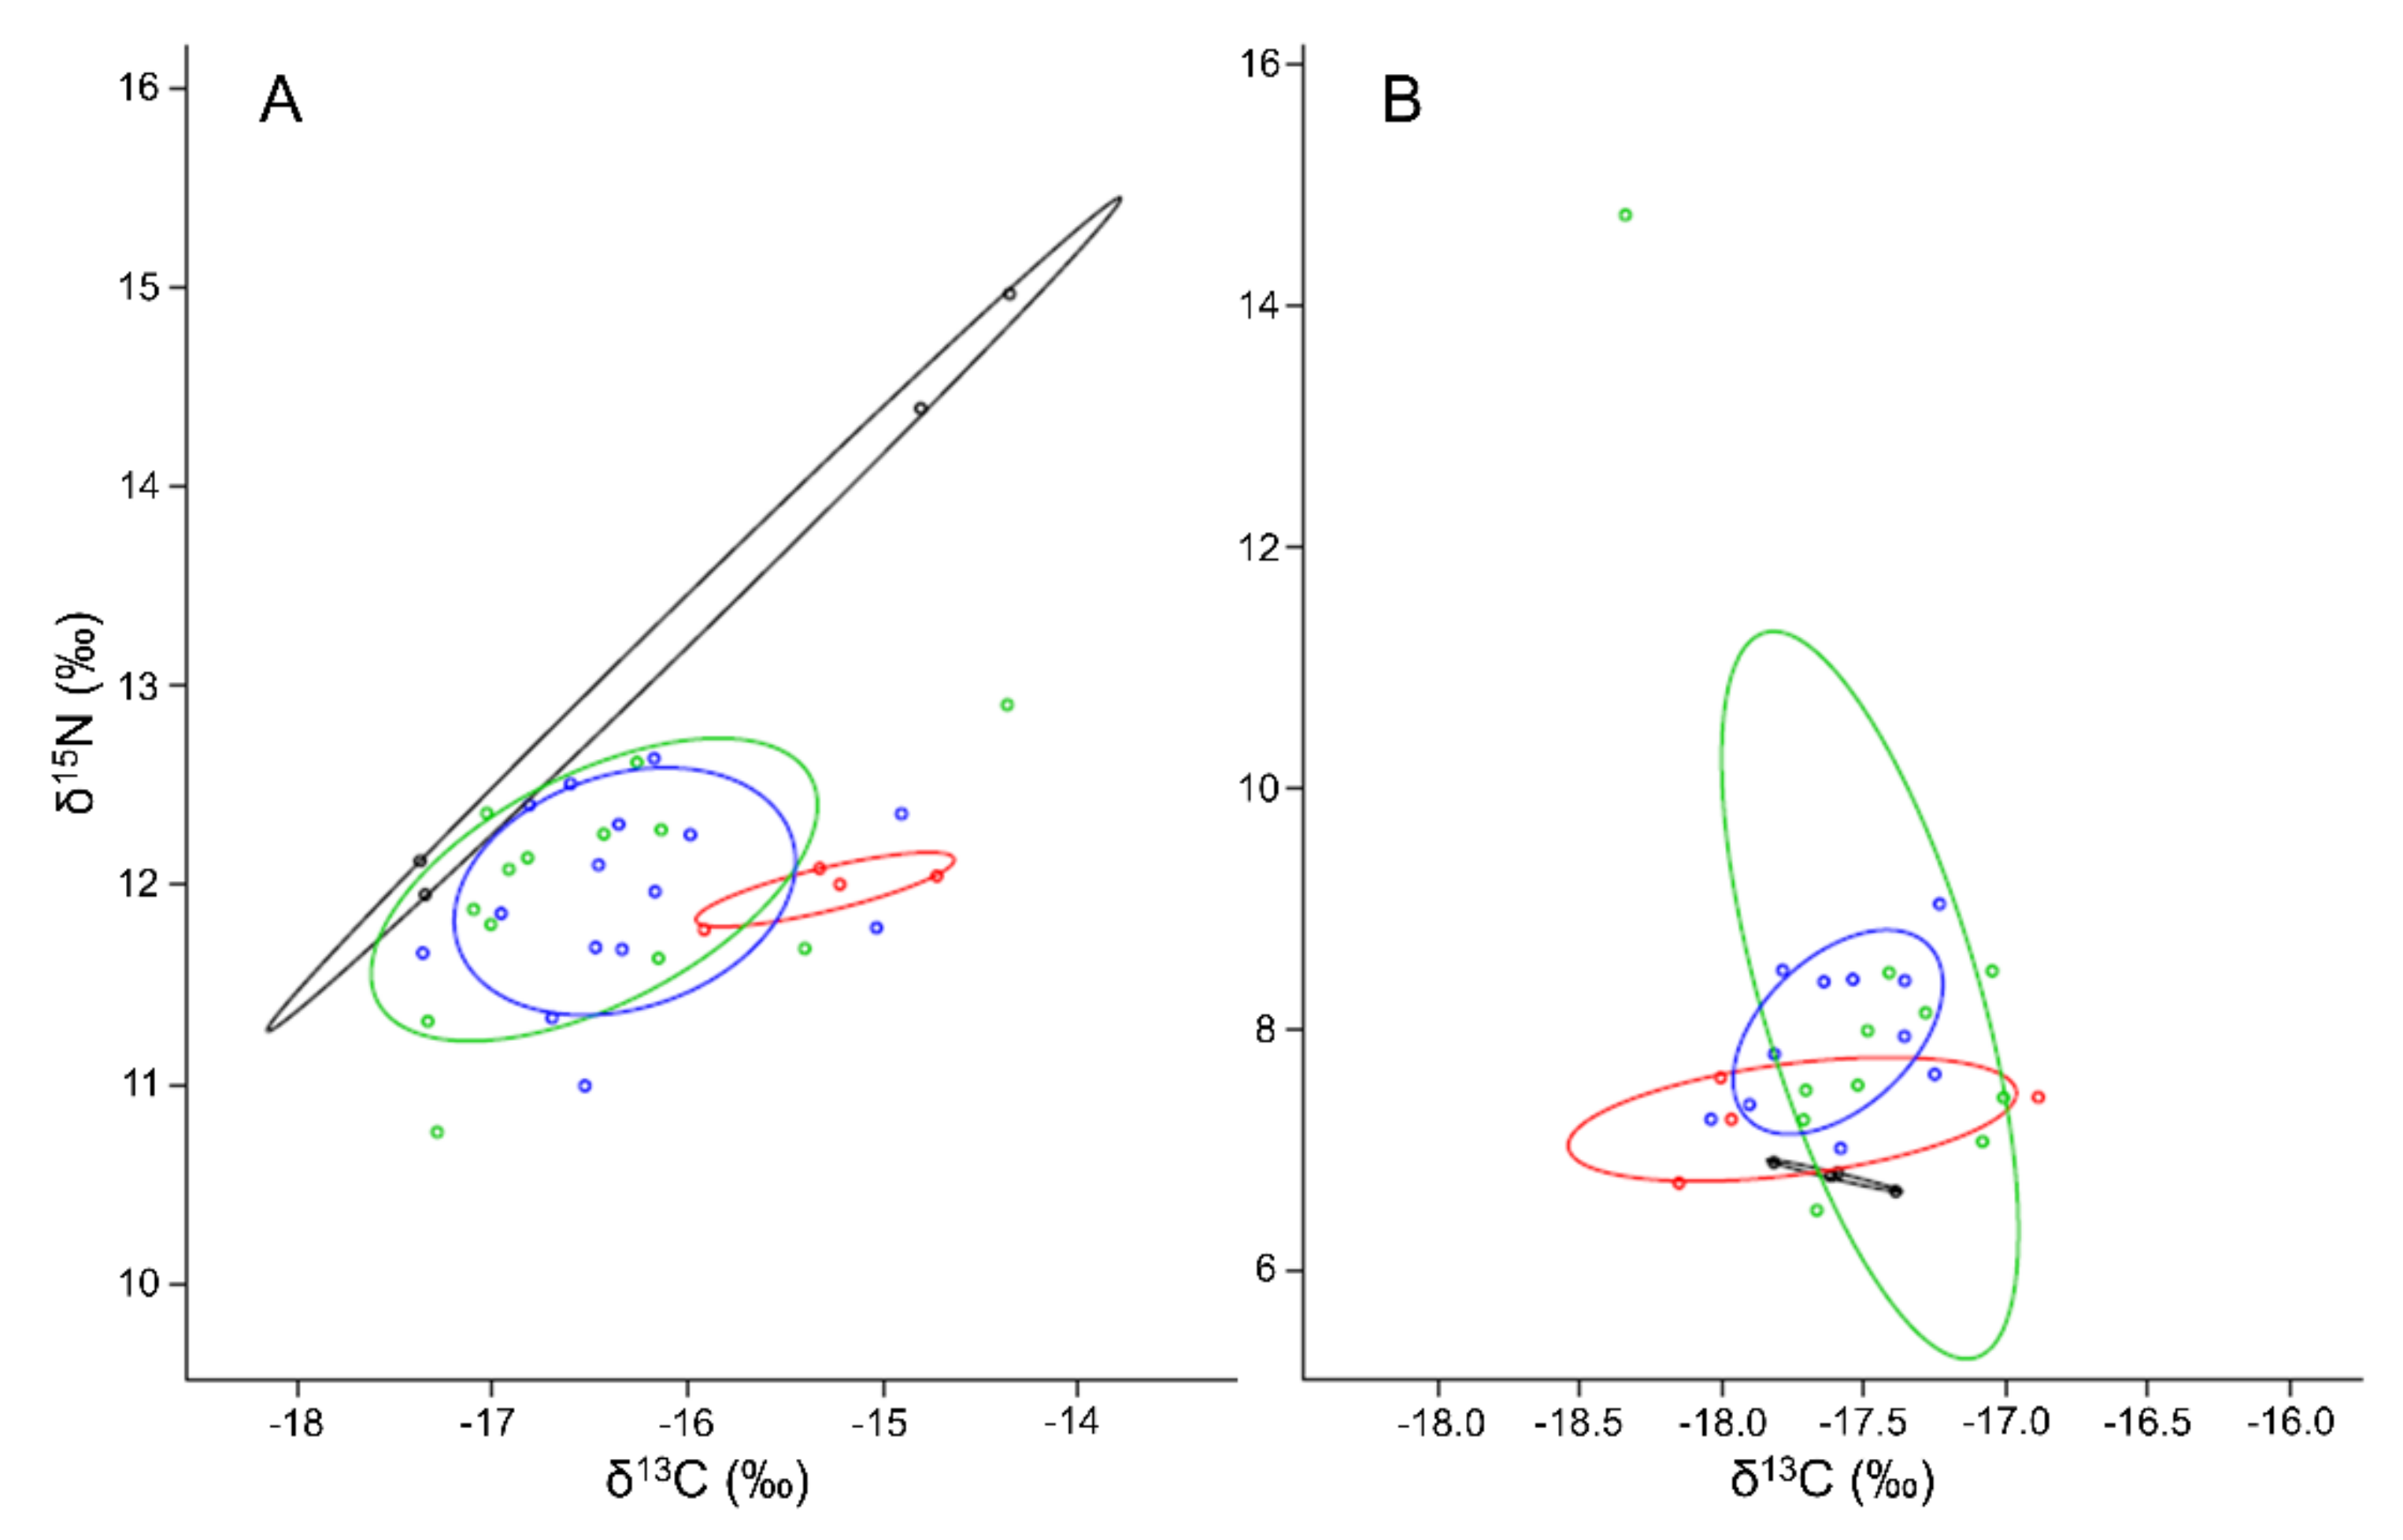
3.5. Deriving Diet Shifts from Stable Isotopes

The analysis of stable isotopes revealed that the different compartments studied could be easily distinguished of each other using the δ15N and δ13C signatures (Figure 7). In general, δ13C values showed higher variability than δ15N ones. Zostera noltei leaves were enriched in 13C with δ values close to −12 ‰, while SOM and the gross fraction of the POM showed the lowest values (δ values from −20 to −26 ‰). Moreover, the lowest values for δ15N were also found in SOM and POM (from 6.3 to 8.8 ‰). Interestingly, very large differences in δ13C and, to some extent, in δ15N were found between the fine and coarse fractions of POM (Figure 7). The ANOVA revealed nonsignificant differences among treatments (BS, ZNAP, and CNAP) for the δ13C composition of SOM, Scrobicularia plana, and Hediste diversicolor (data not shown). Some significant differences among treatments were found for δ15N. For instance, δ15N values for S. plana were significantly different between BS and CNAP (F3,26 = 3.19, p < 0.05), while δ15N from SOM did not show any significant differences among treatments (data not shown). Moreover, δ15N values of H. diversicolor from both types of artificial patches were significantly different from those of BS (F3,32 = 4.73, p < 0.001). The isotopic Bayesian mixing model (MixSIAR) showed that S. plana inhabiting artificial patches fed mainly on the fine fraction of the POM with a minor contribution of other sources to the diet. However, when S. plana inhabited natural populations of Z. noltei or bare sediment the contribution of all the food sources was more uniform (Table 3).
Contrastingly, H. diversicolor seemed to feed from all available food sources in a quite variable proportion, although Z. noltei leaves were the source more consumed in all of the treatments (Table 3). However, the results derived from MixSIAR should be interpreted with caution, since a potential food source might be not considered as indicated by the model. The isotopic niche and overlap estimated from isotopic data by SIBER showed that, in both species, the largest niche width was observed in ZNAP. Otherwise, SIBER overlap was significant between ZNAP and CNAP for H. diversicolor. A considerable overlap was also estimated between ZNAP and CNAP, and between ZNAP and ZNNP for S. plana (Figure 8 A,B, and Table 4).

4. Discussion

This study supports previous studies reporting positive effects of seagrasses (in this case, seagrass mimics) on diversity levels (i.e., species richness, abundance, and functional diversity). However, most of these studies were conducted in epifauna [5], while the present work was focused on infauna. Furthermore, the present results evidenced that, in the short term, the colonization of artificial seagrass patches followed a spatially explicit pattern and that the diet of the organisms shifted depending on their location (BS, ZNNP, and artificial patches), and even considering the position within the artificial meadows. It suggests that the alteration of the hydrodynamically driven food supply may be an important underlying factor contributing to structure seagrass communities.

4.1. Response of Macrobenthic Community

Our results agree with the general finding that seagrasses increase habitat complexity and ecological diversity (i.e., species richness and abundance) in harsh areas with low diversity [73,74,75] by fostering positive effects on fauna (e.g., facilitation) [17,26,30,76,77]. The presence of flexible mimics resembling the role played by wild seagrasses could facilitate the entrance of new species because of the amelioration of environmental conditions fostered by aboveground structures (mainly flow reduction), the reduction in predation rates, the presence of new food sources (epiphytes and preys), and the generation of gradients in food availability. In addition, belowground parts may also play an important role in diversity levels by reducing the effects of bioturbator species, as it has been demonstrated in the studied area [17]. However, belowground complexity (i.e., architectural attributes) was quite similar between both artificial patches and should affect the infauna in both treatments in a similar way.
Our results agreed with the general finding that the increase in habitat complexity associated with ecosystem engineers leads also to higher diversity levels in areas of low diversity. This enhancement of species richness and abundance in artificial patches was accompanied by both a shift in the abundance of some dominant species (mainly Scrobicularia plana and Hediste diversicolor) and by the increase in some functional groups. For instance, infaunal predators increased in artificial patches compared with BS. This could be the result of an increase in the abundance of prey, which also attracts predators ([78] and references therein), and/or the role of the artificial canopy as a refuge for predators against their own [79].
The enhancement of species richness and organism abundance in artificial patches seemed to be mainly promoted by an active behavior of the organisms that moved from nearby areas towards the patches, since no significant differences in organism size or weight were found between artificial patches and bare sediment (Figure 5B). Field observations and laboratory experiments with Scrobicularia plana indicated that this species is capable of a substantial horizontal movement (<20cm) in response to some unfavorable conditions, but territoriality or overcrowding did not trigger such migration responses [55]. Therefore, the accumulation of S. plana in the periphery of the artificial patches suggests that this species actively migrated from nearby bare areas because of a more favorable habitat within the mimics. Such favorable growing conditions in the periphery are supported by previous studies in the area [33], where both the concentration of suspended edible particles and the food intake rate of cockles (i.e., an active filter feeding organisms) significantly increased in the leading edge of a reconstructed seagrass patch subjected to unidirectional flow.
For the two dominant species, Scrobicularia plana and Hediste diversicolor, the spatial explicit sampling design revealed that processes controlling their abundances differed. For instance, S. plana accumulated at the outer edges of the artificial patches (Figure 6A), where it is not expected that they would benefit from shelter against predators (mainly oystercatcher and other shorebirds [55,80]) siphon nipping (mainly by crabs or fishes [55]) or hydrodynamics [81] as it would occur within the patch. In addition, while there were not significant differences in the weight of the specimens between BS and both types of artificial patches, individuals of S. plana occurring within the mimics were significantly larger than those thriving in the outer edges (Figure 6C). This indicates that belowground structures did not hamper S. plana presence within the artificial patches.

4.2. Shifts of Diets for Macrobenthic Fauna

A likely explanation for the accumulation of S. plana at the outer patch edges could be related to a higher food availability at that point, as it was demonstrated for pipefishes and in artificial seagrass meadows in flume tank studies [17,82]. The interaction between canopy edges and flow results in a sudden decrease in velocity and a higher particle collision and loss of momentum of these particles, favoring the sedimentation of the suspended material [42,83,84,85]. It would increase the food availability at the patch periphery, stimulating the preferential occurrence of S. plana in this area (Figure 6A–C) as occurred for cockles in flume tank studies [17]. The measured differences in the isotopic signature and niche width in S. plana15N) depending on its location (i.e., in BS or within artificial patches) is a clear sign of diet shifting, which agrees with this explanation. Moreover, the niche width (SEAc values in Table 4; Figure 8B) becomes wider within natural and artificial seagrass populations when compared with bare sediments. It may indicate that S. plana has access to more diverse food sources under such conditions as it was found in S. plana [86] and in other suspension-feeders [87], or by contrast, the higher density values recorded of S. plana may induce food competition [33], driving individuals to feed on other less preferred available food sources.
Abundance and total biomass of H. diversicolor increased centripetally in both types of artificial patches (Figure 6B,D), although only spatial significant differences were found for ZNAP. The effects on abundance might be partially attributed to an enhanced protection against predation, in comparison with BS, since this species is highly predated by fishes and shore birds [88,89]. However, a lower predation pressure cannot totally explain the preferential accumulation of H. diversicolor at the outer edge of the patches, where it does not obtain any protection against predation. In addition, differences between both types of artificial patches were also found, in spite of their similar above and belowground complexity (i.e., architectural attributes), which may render a similar predation effectiveness of predator species [90]. It is known that H. diversicolor is highly predated by different species and that it has a large plasticity in feeding behavior [61,91]. This feeding plasticity allows H. diversicolor to occur in a variety of habitats [88]. The isotope composition (Figure 8; Table 3 and Table 4) confirmed this point, showing that (1) H. diversicolor fed from all the potential sources studied and (2) the contribution of the different sources shifted depending on the habitat (mainly BS versus artificial patches—ZNAP and CNAP—and ZNNP). This might indicate that food availability (quantity and/or quality) depended highly on the type of habitat. It is important to note the large contribution of Z. noltei leaves to the diet of H. diversicolor (Table 3), which agrees with previous findings of a direct assimilation of plant detritus by this species [61] and with field observations where individuals of H. diversicolor were observed feeding directly over seagrass leaves [Brun, personal observations]. Therefore, changes in food availability could partially explain the distribution pattern of H. diversicolor within the artificial patches. However, our experimental set-up did not allow us to reach further conclusions; additional experimentation is required to determine the strength of different processes affecting its distribution within patches.
Mimics were heavily loaded by epiphytes and egg masses (i.e., Sepia officinalis) (Table 2). This serves as additional evidence of the role of seagrass meadows as physical structures increasing not only the diversity but also providing shelter and nursery grounds for species of commercial importance [92]. The net production of epiphytes along the experimental period was high and even higher than the total production of Zostera noltei populations in the area [49]. The daily net epiphyte production measured in CNAP was almost threefold higher than that of ZNAP and five times higher than the epiphyte production measured in natural populations of Cymodocea nodosa in the area (circa. 3.4 ± 1.1 g DW m−2 d−1 [93]). This result could be partly explained by the lack of aboveground biomass turnover and of chemical defenses in mimics in comparison with natural seagrass meadows [94,95], thus facilitating the epiphyte accumulation in mimics.

4.3. Ecological Significance

The presence of artificial seagrass patches resembling the autogenic ecosystem-engineering role of those plants positively affected species richness, organism abundance, and functional diversity of infauna. Such increases showed a distinctive component (both in canopy properties and macrofaunal species) and seemed to be the result of (1) changes in the hydrodynamically driven food supply to the organisms and (2) facilitation processes mediated by physical structures (reduction in predation pressure, amelioration of environmental conditions, reduction in bioturbators activity, etc.). In addition, the presence of egg masses and large epiphyte loads in the experimental plots highlight the importance of seagrass populations as “diversity and productivity boosters”, since its presence allows for not only increases in the diversity levels of fauna but also enhancements in the presence of other primary producers that contribute in a significant manner to the community and ecosystem productivity.

Supplementary Materials

The following are available online at www.mdpi.com/article/10.3390/d13110572/s1, Figure S1: Images of the mimic set-up in Rio San Pedro.

Author Contributions

Conceptualization, F.G.B., J.L.P.-L. and J.J.V.; methodology, V.G.-O., J.F.C.-D., F.G.B., J.L.V. and J.J.V.; field experiments, F.G.B., J.F.C.-D., V.G.-O., J.L.P.-L. and J.J.V.; isotope analysis, J.L.V.; data curation, F.G.B., J.F.C.-D. and J.L.V.; writing—original draft preparation, F.G.B., J.L.V., J.L.P.-L. and J.J.V.; writing—review and editing, F.G.B., J.L.P.-L. and J.J.V.; supervision, F.G.B. and J.J.V.; project administration, J.L.P.-L. and F.G.B.; funding acquisition, F.G.B. and J.L.P.-L. All authors have read and agreed to the published version of the manuscript.

Funding

This work was supported by the Spanish Project PAVAROTTI (CTM2017-85365-R) from the Ministry of Science and Innovation and by the Junta de Andalucía Excellence Project PAMBIO (P08-RNM-03783).

Institutional Review Board Statement

Not applicable. Ethical review and approval were waived for this study due to neither humans nor protected animals being involved. The Cadiz Bay Natural Park approved the experiments as the responsible environmental agency for the site.

Informed Consent Statement

Not applicable.

Data Availability Statement

All data generated or analyzed during this study are included in this published article. Any additional information is available upon request.

Conflicts of Interest

The authors declare no conflict of interest.

References

  1. Waycott, M.; Duarte, C.M.; Carruthers, T.J.B.; Orth, R.J.; Dennison, W.C.; Olyarnik, S.; Calladine, A.; Fourqurean, J.W.; Heck, K.L., Jr.; Hughes, A.R.; et al. Accelerating loss of seagrasses across the globe threatens coastal ecosystems. Proc. Natl. Acad. Sci. USA 2009, 106, 12377–12381. [Google Scholar] [CrossRef] [Green Version]
  2. Vassallo, P.; Paoli, C.; Rovere, A.; Montefalcone, M.; Morri, C.; Bianchi, C.N. The value of the seagrass Posidonia oceanica: A natural capital assessment. Mar. Pol. Bull. 2013, 75, 157–167. [Google Scholar] [CrossRef]
  3. Jones, C.G.; Lawton, J.H.; Shachak, M. Organisms as ecosystem engineers. Oikos 1994, 69, 373–386. [Google Scholar] [CrossRef]
  4. Hemminga, M.A.; Duarte, C.M. Seagrass Ecology; Cambridge University Press: New York, NY, USA, 2000; 310p. [Google Scholar] [CrossRef]
  5. Boström, C.; O’Brien, K.; Roos, C.; Ekebom, J. Environmental variables explaining structural and functional diversity of seagrass macrofauna in an archipelago landscape. J. Exp. Mar. Biol. Ecol. 2006, 335, 52–73. [Google Scholar] [CrossRef]
  6. Larkum, A.W.D.; Orth, R.J.; Duarte, C.M. (Eds.) Seagrasses: Biology, Ecology and Conservation; Springer: Dordrecht, The Netherlands, 2006; 691p. [Google Scholar] [CrossRef]
  7. Duffy, J.E. Biodiversity and the functioning of seagrass ecosystems. Mar. Ecol. Prog. Ser. 2006, 311, 233–250. [Google Scholar] [CrossRef] [Green Version]
  8. Stachowicz, J.J.; Bruno, J.F.; Duffy, J.E. Understanding the effects of marine biodiversity on communities and ecosystems. Annu. Rev. Ecol. Evol. Syst. 2007, 38, 739–766. [Google Scholar] [CrossRef] [Green Version]
  9. Telesca, L.; Belluscio, A.; Criscoli, A.; Ardizzone, G.; Apostolaki, E.T.; Fraschetti, S.; Gristina, M.; Knittweis, L.; Martin, C.S.; Pergent, G.; et al. Seagrass meadows (Posidonia oceanica) distribution and trajectories of change. Sci. Rep. 2015, 5, 12505. [Google Scholar] [CrossRef] [PubMed] [Green Version]
  10. Thrush, S.F.; Dayton, P.K. Disturbance to marine benthic habitats by trawling and dredging: Implications for marine biodiversity. Annu. Rev. Ecol. Syst. 2002, 33, 449–473. [Google Scholar] [CrossRef] [Green Version]
  11. Norkko, A.; Hewitt, J.E.; Thrush, S.F.; Funnell, G.A. Conditional outcomes of facilitation by a habitat-modifying subtidal bivalve. Ecology 2006, 87, 226–234. [Google Scholar] [CrossRef]
  12. Vogel, S. Life in Moving Fluids; Willard Grant: Boston, MA, USA, 1981; 352p. [Google Scholar]
  13. Kuo, J.; den Hartog, C. Seagrass morphology, anatomy, and ultrastructure. In Seagrasses: Biology, Ecology and Conservation; Larkum, A.W.D., Orth, R.J., Duarte, C.M., Eds.; Springer: Dordrecht, The Netherlands, 2006; pp. 51–87. [Google Scholar] [CrossRef]
  14. Hovel, K.A.; Lipcius, R.N. Effects of seagrass habitat fragmentation on juvenile blue crab survival and abundance. J. Exp. Mar. Biol. Ecol. 2002, 271, 75–98. [Google Scholar] [CrossRef]
  15. Holmquist, J.G. Permeability of patch boundaries to benthic invertebrates: Influences of boundary contrast, light level, and faunal density and mobility. Oikos 1998, 81, 558–566. [Google Scholar] [CrossRef] [Green Version]
  16. Hovel, K.A.; Regan, H.M. Using an individual-based model to examine the roles of habitat fragmentation and behavior on predator–prey relationships in seagrass landscapes. Landsc. Ecol. 2008, 23, 75–89. [Google Scholar] [CrossRef]
  17. González-Ortiz, V.; Egea, L.G.; Jiménez-Ramos, R.; Moreno-Marín, F.; Pérez-Lloréns, J.L.; Bouma, T.J.; Brun, F.G. Interactions between seagrass complexity, hydrodynamic flow and biomixing alter food availability for associated filter-feeding organisms. PLoS ONE 2014, 9, e104949. [Google Scholar] [CrossRef] [PubMed] [Green Version]
  18. Verduin, J.J.; Backhaus, J.O. Dynamics of plant–flow interactions for the seagrass Amphibolis antarctica: Field observations and model simulations. Estuar. Coast. Shelf Sci. 2000, 50, 185–204. [Google Scholar] [CrossRef]
  19. Bouma, T.J.; De Vries, M.B.; Low, E.; Peralta, G.; Tánczos, C.; Van de Koppel, J.; Herman, P.M.J. Trade-offs related to ecosystem engineering: A case study on stiffness of emerging macrophytes. Ecology 2005, 86, 2187–2199. [Google Scholar] [CrossRef] [Green Version]
  20. Morris, E.P.; Peralta, G.; Brun, F.G.; van Duren, L.A.; Bouma, T.J.; Pérez-Lloréns, J.L. Interaction between hydrodynamics and seagrass canopy structure: Spatially explicit effects on ammonium uptake rates. Limnol. Oceanogr. 2008, 53, 1531–1539. [Google Scholar] [CrossRef]
  21. Irlandi, E.A.; Peterson, C.H. Modification of animal habitat by large plants: Mechanisms by which seagrasses influence clam growth. Oecologia 1991, 87, 307–318. [Google Scholar] [CrossRef]
  22. Peterson, B.J.; Heck, K.L., Jr. Positive interactions between suspension-feeding bivalves and seagrass - a facultative mutualism. Mar. Ecol. Prog. Ser. 2001, 213, 143–155. [Google Scholar] [CrossRef]
  23. Brun, F.G.; Van Zetten, E.; Cacabelos, E.; Bouma, T.J. Role of two contrasting ecosystem engineers (Zostera noltii and Cymodocea nodosa) on the food intake rate of Cerastoderma edule. Helgol. Mar. Res. 2009, 63, 19–25. [Google Scholar] [CrossRef]
  24. Tagliapietra, D.; Pessa, G.; Cornello, M.; Zitelli, A.; Magni, P. Temporal distribution of intertidal macrozoobenthic assemblages in a Nanozostera noltii-dominated area (Lagoon of Venice). Mar. Environ. Res. 2016, 114, 31–39. [Google Scholar] [CrossRef]
  25. Jiménez-Ramos, R.; Egea, L.G.; Vergara, J.J.; Bouma, T.J.; Brun, F.G. The role of flow velocity combined with habitat complexity as a top–down regulator in seagrass meadows. Oikos 2019, 128, 64–76. [Google Scholar] [CrossRef] [Green Version]
  26. Rodil, I.F.; Lohrer, A.M.; Attard, K.M.; Hewitt, J.E.; Thrush, S.F.; Norkko, A. Macrofauna communities across a seascape of seagrass meadows: Environmental drivers, biodiversity patterns and conservation implications. Biodivers. Conserv. 2021, 30, 3023–3043. [Google Scholar] [CrossRef]
  27. Attrill, M.J.; Strong, J.A.; Rowden, A.A. Are macroinvertebrate communities influenced by seagrass structural complexity? Ecography 2000, 23, 114–121. [Google Scholar] [CrossRef]
  28. Hovel, K.A.; Fonseca, M.S. Influence of seagrass landscape structure on the juvenile blue crab habitat-survival function. Mar. Ecol. Prog. Ser. 2005, 300, 170–191. [Google Scholar] [CrossRef]
  29. Sirota, L.; Hovel, K.A. Simulated eelgrass Zostera marina structural complexity: Effects of shoot length, shoot density, and surface area on the epifaunal community of San Diego Bay, California, USA. Mar. Ecol. Prog. Ser. 2006, 326, 115–131. [Google Scholar] [CrossRef]
  30. Gagnon, K.; Rinde, E.; Bengil, E.G.T.; Carugati, L.; Christianen, M.J.A.; Danovaro, R.; Gambi, C.; Govers, L.L.; Kipston, S.; Meysick, L.; et al. Facilitating foundation species: The potential for plant–bivalve interactions to improve habitat restoration success. J. Appl. Ecol. 2020, 57, 1161–1179. [Google Scholar] [CrossRef]
  31. Barbier, P.; Meziane, T.; Forêt, M.; Tremblay, R.; Robert, R.; Olivier, F. Nursery function of coastal temperate benthic habitats: New insight from the bivalve recruitment perspective. J. Sea Res. 2017, 121, 11–23. [Google Scholar] [CrossRef] [Green Version]
  32. Peralta, G.; Morris, E.P.; van Duren, L.A.; Bouma, T.J. Consequences of shoot density and stiffness for ecosystem engineering by benthic macrophytes in flow dominated areas: A hydrodynamic flume study. Mar. Ecol. Prog. Ser. 2008, 368, 103–115. [Google Scholar] [CrossRef] [Green Version]
  33. González-Ortiz, V.; Alcazar, P.; Vergara, J.J.; Pérez-Lloréns, J.L.; Brun, F.G. Effects of two antagonistic ecosystem engineers on infaunal diversity. Estuar. Coast. Shelf Sci. 2014, 139, 20–26. [Google Scholar] [CrossRef]
  34. Reusch, T.B.H.; Williams, S.L. Macrophyte canopy structure and the success of an invasive marine bivalve. Oikos 1999, 84, 398–416. [Google Scholar] [CrossRef]
  35. Allen, B.J.; Williams, S.L. Native eelgrass Zostera marina controls growth and reproduction of an invasive mussel through food limitation. Mar. Ecol. Prog. Ser. 2003, 254, 57–67. [Google Scholar] [CrossRef]
  36. Tsai, C.; Yang, S.; Trimble, A.C.; Ruesink, J.L. Interactions between two introduced species: Zostera japonica (dwarf eelgrass) facilitates itself and reduces condition of Ruditapes philippinarum (Manila clam) on intertidal flats. Mar. Biol. 2010, 157, 1929–1936. [Google Scholar] [CrossRef]
  37. Carroll, J.M.; Peterson, B.J. Ecological trade-offs in seascape ecology: Bay scallop survival and growth across a seagrass seascape. Landsc. Ecol. 2013, 28, 1401–1413. [Google Scholar] [CrossRef]
  38. Brun, F.G.; Cummaudo, F.; Olivé, I.; Vergara, J.J.; Pérez-Lloréns, J.L. Clonal extent, apical dominance and networking features in the phalanx angiosperm Zostera noltii Hornem. Mar. Biol. 2007, 151, 1917–1927. [Google Scholar] [CrossRef] [Green Version]
  39. Brun, F.G.; Olivé, I.; Malta, E.-J.; Vergara, J.J.; Hernández, I.; Pérez-Lloréns, J.L. Increased vulnerability of Zostera noltii to stress caused by low light and elevated ammonium levels under phosphate deficiency. Mar. Ecol. Prog. Ser. 2008, 365, 67–75. [Google Scholar] [CrossRef] [Green Version]
  40. Goshima, S.; Peterson, C. Both below- and aboveground shoalgrass structure influence whelk predation on hard clams. Mar. Ecol. Prog. Ser. 2012, 451, 75–92. [Google Scholar] [CrossRef] [Green Version]
  41. Barrón, C.; Middelburg, J.J.; Duarte, C.M. Phytoplankton trapped within seagrass (Posidonia oceanica) sediments are a nitrogen source: An in situ isotope labelling experiment. Limnol. Oceanogr. 2006, 51, 1648–1653. [Google Scholar] [CrossRef] [Green Version]
  42. Barcelona, A.; Oldham, C.; Colomer, J.; Garcia-Orellana, J.; Serra, T. Particle capture by seagrass canopies under an oscillatory flow. Coast. Eng. 2021, 169, 103972. [Google Scholar] [CrossRef]
  43. Reusch, T.B.H.; Williams, S.L. Variable responses of native eelgrass Zostera marina to a non-indigenous bivalve Musculista senhousia. Oecologia 1998, 113, 428–441. [Google Scholar] [CrossRef] [PubMed]
  44. Bouma, T.J.; Ortells, V.; Ysebaert, T. Comparing biodiversity effects among ecosystem engineers of contrasting strength: Macrofauna diversity in Zostera noltii and Spartina anglica vegetations. Helgol. Mar. Res. 2009, 63, 3–18. [Google Scholar] [CrossRef] [Green Version]
  45. Giraldo-Ospina, A.; Ladah, L.B.; Hovel, K.A. Changes in within-canopy environmental conditions and the population structure of the speckled scallop associated to localized loss of above-ground seagrass cover. J. Exp. Mar. Biol. Ecol. 2021, 534, 151486. [Google Scholar] [CrossRef]
  46. Self, R.F.L.; Jumars, P.A. Cross-phyletic patterns of particle selection by deposit feeders. J. Mar. Res. 1988, 46, 119–143. [Google Scholar] [CrossRef]
  47. Defossez, J.-M.; Hawkins, A.J.S. Selective feeding in shellfish: Size-dependent rejection of large particles within pseudofaeces from Mytilus edulis, Ruditapes philippinarum and Tapes decussatus. Mar. Biol. 1997, 129, 139–147. [Google Scholar] [CrossRef]
  48. Sobral, P.; Widdows, J. Effects of increasing current velocity, turbidity and particle-size selection on the feeding activity and scope for growth of Ruditapes decussatus from Ria Formosa, southern Portugal. J. Exp. Mar. Biol. Ecol. 2000, 245, 111–125. [Google Scholar] [CrossRef]
  49. Brun, F.G.; Pérez-Lloréns, J.L.; Hernández, I.; Vergara, J.J. Patch distribution and within-patch dynamics of the seagrass Zostera noltii Hornem. in Los Toruños Salt-Marsh, Cádiz Bay Natural park, Spain. Bot. Mar. 2003, 46, 513–524. [Google Scholar] [CrossRef]
  50. González-Gordillo, J.I.; Arias, A.M.; Rodríguez, A.; Drake, P. Recruitment patterns of decapod crustacean megalopae in a shallow inlet (SW Spain) related to life history strategies. Estuar. Coast. Shelf Sci. 2003, 56, 593–607. [Google Scholar] [CrossRef]
  51. Ferrón, S.; Ortega, T.; Forja, J.M. Benthic fluxes in a tidal salt marsh creek affected by fish farm activities: Río San Pedro (Bay of Cádiz, SW Spain). Mar. Chem. 2009, 113, 50–62. [Google Scholar] [CrossRef]
  52. Brun, F.G.; González-Ortiz, V.; Vergara, J.J.; Pérez-Lloréns, J.L. Unidad artificial flexible individual de angiosperma marina. Flexible artificial single seagrass unit. National Patent 201200489, 7 May 2012. [Google Scholar]
  53. Brun, F.G.; Vergara, J.J.; Peralta, G.; García-Sánchez, M.P.; Hernández, I.; Pérez- Lloréns, J.L. Clonal building, simple growth rules and phylloclimate as key steps to develop functional-structural seagrass models. Mar. Ecol. Prog. Ser. 2006, 323, 133–148. [Google Scholar] [CrossRef] [Green Version]
  54. Duarte, C.M.; Merino, M.; Agawin, N.S.; Uri, J.; Fortes, M.D.; Gallegos, M.E.; Marbá, N.; Hemminga, M.A. Root production and belowground seagrass biomass. Mar. Ecol. Prog. Ser. 1998, 171, 97–108. [Google Scholar] [CrossRef]
  55. Hughes, R.N. Population Dynamics of the Bivalve Scrobicularia plana (Da Costa) on an Intertidal Mud-Flat in North Wales. J. Anim. Ecol. 1970, 39, 333–356. [Google Scholar] [CrossRef]
  56. Jacobs, R.P.W.M.; Hegger, H.H.; Ras-Willems, A. Seasonal variations in the structure of a Zostera community on tidal flats in the SW Netherlands, with special reference to the benthic fauna. Proc. Kon. Ned. Akad. Wet. Ser. C 1983, 86, 347–375. [Google Scholar]
  57. Boström, C.; Bonsdorff, E. Community structure and spatial variation of benthic invertebrates associated with Zostera marina (L.) beds in the northern Baltic Sea. J. Sea Res. 1997, 37, 153–166. [Google Scholar] [CrossRef]
  58. Carabel, S.; Godínez-Domínguez, E.; Verísimo, P.; Fernández, L.; Freire, J. An assessment of sample processing methods for stable isotope analyses of marine food webs. J. Exp. Mar. Biol. Ecol. 2006, 336, 254–261. [Google Scholar] [CrossRef]
  59. Skilleter, G.A.; Pryor, A.; Miller, S.; Cameron, B. Detecting the effects of physical disturbance on benthic assemblages in a subtropical estuary: A Beyond BACI approach. J. Exp. Mar. Biol. Ecol. 2006, 338, 271–287. [Google Scholar] [CrossRef]
  60. Kanaya, G.; Takagi, S.; Nobata, E.; Kikuchi, E. Spatial dietary shift of macrozoobenthos in a brackish lagoon revealed by carbon and nitrogen stable isotope ratios. Mar. Ecol. Prog. Ser. 2007, 345, 117–127. [Google Scholar] [CrossRef]
  61. Kanaya, G.; Takagi, S.; Kikuchi, E. Dietary contribution of the microphytobenthos to infaunal deposit feeders in an estuarine mudflat in Japan. Mar. Biol. 2008, 155, 543–553. [Google Scholar] [CrossRef]
  62. Stock, B.C.; Semmens, B.X. MixSIAR GUI User Manual. Version 3.1. 2016. Available online: https://github.com/brianstock/MixSIAR (accessed on 7 September 2021).
  63. Davoult, D.; Surget, G.; Stiger-Pouvreau, V.; Noisette, F.; Riera, P.; Stagnol, D.; Androuin, T.; Poupart, N. Multiple effects of a Gracilaria vermiculophylla invasion on estuarine mudflat functioning and diversity. Mar. Environ. Res. 2017, 131, 227–235. [Google Scholar] [CrossRef] [Green Version]
  64. Jackson, A.L.; Inger, R.; Parnell, A.C.; Bearhop, S. Comparing isotopic niche widths among and within communities: SIBER—Stable Isotope Bayesian Ellipses in R. J. Anim. Ecol. 2011, 80, 595–602. [Google Scholar] [CrossRef]
  65. Varela, J.L.; Spares, A.D.; Stokesbury, M.J. Feeding ecology of Atlantic bluefin tuna (Thunnus thynnus) in the Gulf of Saint Lawrence, Canada. Mar. Environ. Res. 2020, 161, 105087. [Google Scholar] [CrossRef]
  66. Kruskal, J.B. Nonmetric multidimensional scaling: A numerical method. Psychometrika 1964, 29, 115–129. [Google Scholar] [CrossRef]
  67. Shepard, R.N. The analysis of proximities: Multidimensional scaling with an unknown distance function, I. Psychometrika 1962, 27, 125–140. [Google Scholar] [CrossRef]
  68. Clarke, K.R.; Green, R.H. Statistical design and analysis for a ‘biological effects’ study. Mar. Ecol. Prog. Ser. 1988, 46, 213–226. [Google Scholar] [CrossRef]
  69. Anderson, M.J. A new method for non-parametric multivariate analysis of variance. Aust. Ecol. 2001, 26, 32–46. [Google Scholar] [CrossRef]
  70. McArdle, B.H.; Anderson, M.J. Fitting multivariate models to community data: A comment on distance-based redundancy analysis. Ecology 2001, 82, 290–297. [Google Scholar] [CrossRef]
  71. Clarke, K.R. Non-parametric multivariate analyses of changes in community structure. Aust. J. Ecol. 1993, 18, 117–143. [Google Scholar] [CrossRef]
  72. Clarke, K.R.; Warwick, R.M. Change in Marine Communities: An Approach to Statistical Analysis and Interpretation, 2nd ed.; PRIMER-E Ltd: Plymouth, UK, 2001; 176p. [Google Scholar]
  73. Crooks, J.A. Characterizing ecosystem-level consequences of biological invasions: The role of ecosystem engineers. Oikos 2002, 97, 153–166. [Google Scholar] [CrossRef] [Green Version]
  74. Wright, J.P.; Jones, C.G. The concept of organisms as ecosystem engineers ten years on: Progress, limitations, and challenges. Bioscience 2006, 56, 203–209. [Google Scholar] [CrossRef] [Green Version]
  75. Bouma, T.J.; Olenin, S.; Reise, K.; Ysebaert, T. Ecosystem engineering and biodiversity in coastal sediments: Posing hypotheses. Helgol. Mar. Res. 2009, 63, 95–106. [Google Scholar] [CrossRef] [Green Version]
  76. Bertness, M.D.; Callaway, R. Positive interactions in communities. Trends Ecol. Evol. 1994, 9, 191–193. [Google Scholar] [CrossRef]
  77. Bruno, J.F.; Stachowicz, J.J.; Bertness, M.D. Inclusion of facilitation into ecological theory. Trends Ecol. Evol. 2003, 18, 119–125. [Google Scholar] [CrossRef]
  78. Heck, K.L.; Orth, R.J., Jr. Predation in seagrass beds. In Seagrasses: Biology, Ecology and Conservation; Larkum, A.W.D., Orth, R.J., Duarte, C.M., Eds.; Springer: Dordrecht, The Netherlands, 2006; pp. 537–550. [Google Scholar] [CrossRef]
  79. Bowden, D.A.; Rowden, A.A.; Attrill, M.J. Effect of patch size and in-patch location on the infaunal macroinvertebrate assemblages of Zostera marina seagrass beds. J. Exp. Mar. Biol. Ecol. 2001, 259, 133–154. [Google Scholar] [CrossRef]
  80. Pérez-Hurtado, A. Ecología Alimentaria de aves Limícolas Invernantes en la Bahía de Cádiz. Distribución y uso del Hábitat. Ph.D. Thesis, University of Seville, Seville, Spain, 1992. Available online: https://idus.us.es/handle/11441/79650 (accessed on 7 September 2021).
  81. Meysick, L.; Ysebaert, T.; Jansson, A.; Montserrat, F.; Valanko, S.; Villnäs, A.; Boström, C.; Norkko, J.; Norkko, A. Context-dependent community facilitation in seagrass meadows along a hydrodynamic stress gradient. J. Sea Res. 2019, 150, 8–23. [Google Scholar] [CrossRef]
  82. Macreadie, P.I.; Hindell, J.S.; Keough, M.J.; Jenkins, G.P.; Connolly, R.M. Resource distribution influences positive edge effects in a seagrass fish. Ecology 2010, 91, 2013–2021. [Google Scholar] [CrossRef]
  83. Agawin, N.S.R.; Duarte, C.M. Evidence of direct particle trapping by a tropical seagrass meadow. Estuaries 2002, 25, 1205–1209. [Google Scholar] [CrossRef]
  84. Hendriks, I.E.; Sintes, T.; Bouma, T.J.; Duarte, C.M. Experimental assessment and modeling evaluation of the effects of the seagrass Posidonia oceanica on flow and particle trapping. Mar. Ecol. Prog. Ser. 2008, 356, 163–173. [Google Scholar] [CrossRef]
  85. Hendriks, I.E.; Bouma, T.J.; Morris, E.P.; Duarte, C.M. Effects of seagrasses and algae of the Caulerpa family on hydrodynamics and particle-trapping rates. Mar. Biol. 2010, 157, 473–481. [Google Scholar] [CrossRef]
  86. Rossi, F.; Baeta, A.; Marques, J.C. Stable isotopes reveal habitat-related diet shifts in facultative deposit-feeders. J. Sea Res. 2015, 95, 172–179. [Google Scholar] [CrossRef]
  87. Jones, A.G.; Dubois, S.F.; Desroy, N.; Fournier, J. Intertidal ecosystem engineer species promote benthic-pelagic coupling and diversify trophic pathways. Mar. Ecol. Prog. Ser. 2021, 660, 119–139. [Google Scholar] [CrossRef]
  88. Arias, A.M.; Drake, P. Distribution and production of the polychaete Nereis diversicolor in a shallow coastal lagoon in the Bay of Cadiz (SW Spain). Cah. Biol. Mar. 1995, 36, 201–210. [Google Scholar] [CrossRef]
  89. Rosa, S.; Granadeiro, J.P.; Vinagre, C.; França, S.; Cabral, H.N.; Palmeirim, J.M. Impact of predation on the polychaete Hediste diversicolor in estuarine intertidal flats. Estuar. Coast. Shelf Sci. 2008, 78, 655–664. [Google Scholar] [CrossRef]
  90. Mattila, J.; Heck, K.L., Jr.; Millstein, E.; Miller, E.; Gustafsson, C.; Williams, S.; Byron, D. Increased habitat structure does not always provide increased refuge from predation. Mar. Ecol. Prog. Ser. 2008, 361, 15–20. [Google Scholar] [CrossRef]
  91. Riisgård, H.U. Filter-feeding in the polychaete Nereis diversicolor: A review. Neth. J. Aquat. Ecol. 1994, 28, 453–458. [Google Scholar] [CrossRef]
  92. Pile, A.J.; Lipcius, R.N.; Van Montfrans, J.; Orth, R.J. Density dependent settler-recruit-juvenile relationships in blue crabs. Ecol. Monogr. 1996, 66, 277–300. [Google Scholar] [CrossRef]
  93. Martínez-Schönemann, A. Estimación de la Producción Primaria Neta de Epífitos en Praderas de Fanerógamas de la Bahía de Cádiz. Master’s Thesis, Univesity of Cádiz, Cádiz, Spain, 2014; 30p. [Google Scholar]
  94. Grignon-Dubois, M.; Rezzonico, B.; Alcoverro, T. Regional scale patterns in seagrass defences: Phenolic acid content in Zostera noltii. Estuar. Coast. Shelf Sci. 2012, 114, 18–22. [Google Scholar] [CrossRef]
  95. Manck, L.; Quintana, E.; Suarez, R.; Brun, F.G.; Hernández, I.; Ortega, M.J.; Zubia, E. Profiling of phenolic natural products in the seagrass Zostera noltei by UPLC-MS. Nat. Prod. Commun. 2017, 12, 687–690. [Google Scholar] [CrossRef] [PubMed] [Green Version]
Figure 1. Location of the in situ experiments. Main characteristics (vegetation and type of sediment) and the situation of an aquaculture plant are indicated in the map. Asterisk indicates study area.
Diversity 13 00572 g001
Figure 2. Scheme of the sampling procedure carried out. Fauna and sediment samples were collected following a spatial gradient parallel to the main flow direction. Mimics resembled the size and density of the two main species thriving in the area, Zostera noltei and Cymodocea nodosa. ZNAP, Zostera noltei artificial patches; CNAP, Cymodocea nodosa artificial patches.
Diversity 13 00572 g002
Figure 3. Organism density (indiv. m−2) recorded in the different habitats: Bare sediment-BS; artificial patches of Zostera noltei-ZNAP, artificial patches of Cymodocea nodosa-CNAP, and natural patches of Zostera noltei-ZNNP. The inset letters indicate significant differences among treatments using the Tuckey test. Data are represented as mean ± SE.
Diversity 13 00572 g003
Figure 4. Multidimensional scaling plot of species composition associated with each habitat type. Bare sediment-BS; artificial patches of Zostera noltei-ZNAP, artificial patches of Cymodocea nodosa-CNAP, and natural patches of Zostera noltei-ZNNP.
Diversity 13 00572 g004
Figure 5. Density (A), organism individual weight (B), and total biomass (C) of the two main species recorded (>85%; Scrobicularia plana and Hediste diversicolor) in the collected samples from the different habitats: bare sediment-BS; artificial patches of Zostera noltei-ZNAP, artificial patches of Cymodocea nodosa-CNAP, and natural patches of Zostera noltei-ZNNP. The weight of S. plana included the shell and the soft tissues and is given in dry weight, while H. diversicolor is expressed as fresh weight. The inset letters indicate significant differences among treatments using the Tuckey test. Data are represented as mean ± SE.
Diversity 13 00572 g005
Figure 6. Recorded spatial gradients in (A,B) density, (C,D)organism individual weight, and (E,F) total biomass within the artificial seagrass patches for Scrobicularia plana (A,C,E) and Hediste diversicolor (B,D,F). The inset letters indicate significant differences between the different positions within each patch type (i.e., ZNAP or CNAP) using the Tuckey test. Inset asterisks indicate significant differences for the same position between the two patch types using the Tuckey test. The weight of S. plana included the shell and the soft tissues and is given in dry weight, while H. diversicolor is expressed as fresh weight. Data are represented as mean ± SE.
Diversity 13 00572 g006
Figure 7. Isotopic signature (δ15N and δ13C) of Scrobicularia plana and Hediste diversicolor and for the main likely food sources for these organisms collected in the different treatments (BS, ZNAP, CNAP, and ZNNP): Z. noltei, Zostera noltei leaves; Epiphytes, epiphytes attached to the mimics; SOM, sediment organic matter; and POM, fractionated particulate organic matter from the water column (i.e., higher or lower to 200 μm). Data are represented as mean ± SE.
Diversity 13 00572 g007
Figure 8. δ13C and δ15N bi-plots and standard ellipse corrected areas (SEAc, an ellipse that contains 40% of the data regardless of sample size). (A) Hediste diversicolor and (B) Scrobicularia plana. BS, bare sediment (black); ZNNP, Zostera noltei natural populations (red); ZNAP, Z. noltei artificial patches (green); and CNAP, Cymodocea nodosa artificial patches (blue).
Diversity 13 00572 g008
Table 1. Canopy and morphometric properties of Zostera noltei natural populations (ZNNP), and artificial patches of Z. noltei (ZNAP) and Cymodocea nodosa (CNAP). Values are mean ± SE. The percentage of volume occupied by the belowground biomass of Z. noltei was calculated through the biometric data collected on the rhizome-root system and considering that these structures are situated within the first 7.5 cm of the sediment [54].
VariableZNNPZNAPCNAP
Density (shoots m−2)8594 ± 1.19835001700
Above-ground biomass (g DW m−2)110.7 ± 35.6--
Leaf length (cm)19.1 ± 0.922035
Leaf width (cm)0.12 ± 0.020.50.6
LAI (m2×m−2)3.27 ± 0.3411.011.2
Belowground biomass (g×DW×m−2)140.9 ± 22.8--
Belowground length (cm)-3030
Belowground width (cm)-0.320.44
Volume occupied by belowground structures (%)15.7 ± 3.32.72.6
Meadow area (m2)-≈ 0.30≈ 0.30
Table 2. Effect of artificial patches on species feeding behavior and richness, percentage of Scrobicularia plana and Hediste diversicolor, epiphyte production, and sediment organic matter (SOM). BS, bare sediment; ZNAP, artificial patches of Zostera noltei; CNAP, artificial patches of Cymodocea nodosa; ZNNP, natural patches of Z. noltei. SF, suspension feeder; DF, deposit feeder; O, omnivore; C, carnivore. X, indicates species presence in the treatment. *, feeding behavior depends on species level. #, not determined. Data are expressed as mean ± SE.
BSZNAPCNAPZNNP
Number of species4887
Scrobicularia plana (%)82.6 ± 3.363.0 ± 2.461.7 ± 1.886.9 ± 2.6
Hediste diversicolor (%)6.5 ± 0.833.0 ± 1.631.7 ± 2.17.1 ± 0.7
Epiphyte (g DW×m−2)-505 ± 291563 ± 111-
SOM (%)9.2 ± 0.58.3 ± 0.38.4 ± 0.39.2 ± 0.4
Species and feeding behaviour
Scrobicularia plana (SF/DF)XXXX
Cerastoderma edule (SF)XXXX
Venerupis rhomboides (SF)X
Hediste diversicolor (O)XXXX
Marphysa sanguinea (DF) XXX
Bulla striata (C) X
Venerupis sp. (SF) X
Venerupis philippinarum (SF) X
Solen marginatus (SF) X
Diopatra neapolitana (C) XXX
Xantho pilipes (C) X
Nephtys sp. (C/O) * X
Crustacean (SF) # XX
Table 3. Feasible contribution of the different food sources to the diet of Scrobicularia plana and Hediste diversicolor using the MixSIAR model in the different treatments. Five food sources were used: SOM, POM (<200 μm), POM (>200 μm), epiphytes (EPI), and Zostera noltei leaves (ZNL). SP, S. plana; HD, H. diversicolor; BS, bare sediment; ZNAP, artificial patches of Zostera noltei; CNAP, artificial patches of Cymodocea nodosa; and ZNNP, natural patches of Z. noltei. Values are presented as mean with their credible intervals at 5% and 97.5% (between parentheses).
Species-SiteZNLPOM (<200 μm)POM (>200 μm)SOMEPI
SP-BS0.37
(0.24–0.47)
0.27
(0.07–0.46)
0.13
(0.03–0.30)
0.23
(0.05–0.47)
-
SP-ZNAP0.25
(0.07–0.38)
0.53
(0.37–0.67)
0.08
(0.002–0.20)
0.07
(0.002–0.21)
0.07
(0.007–0.16)
SP-CNAP0.20
(0.07–0.32)
0.61
(0.49–0.73)
0.05
(0.003–0.13)
0.11
(0.02–0.23)
0.05
(0.005–0.10)
SP-ZNNP0.35
(0.18–0.50)
0.30
(0.04–0.55)
0.11
(0.01–0.34)
0.24
(0.03–0.46)
-
HD-BS0.64
(0.46–0.82)
0.10
(0.004–0.31)
0.13
(0.01–0.31)
0.13
(0.01–0.37)
-
HD-ZNAP0.42
(0.23–0.59)
0.15
(0.03–0.33)
0.09
(0.02–0.24)
0.08
(0.0–0.23)
0.26
(0.11–0.41)
HD-CNAP0.44
(0.30–0.59)
0.13
(0.02–0.30)
0.08
(0.007–0.22)
0.12
(0.02–0.24)
0.22
(0.11–0.35)
HD-ZNNP0.73
(0.60–0.84)
0.06
(0.001–0.23)
0.09
(0.01–0.23)
0.12
(0.01–0.26)
-
Table 4. Trophic niche width (SEAc) and overlap (SEAc overlap in %) estimated by SIBER analysis (Stable Isotope Bayesian Ellipses in R) for Scrobicularia plana and Hediste diversicolor in the different experimental treatments. SEAc, corrected standard ellipse area. BS, bare sediment; ZNAP, artificial patches of Zostera noltei; CNAP, artificial patches of Cymodocea nodosa; and ZNNP, natural patches of Z. noltei.
GroupSEAcSEAc Overlap (%)
H. diversicolor
BS (1)0.761 vs. 2 (0.00)
1 vs. 3 (0.00)
1 vs. 4 (0.00)
ZNNP (2)0.192 vs. 3 (0.18)
2 vs. 4 (1.76)
ZNAP (3)1.383 vs. 4 (62.4)
CNAP (4)0.99
S. plana
BS (1)0.021 vs. 2 (0.38)
1 vs. 3 (0.25)
1 vs. 4 (0.00)
ZNNP (2)0.962 vs. 3 (13.0)
2 vs. 4 (9.37)
ZNAP (3)2.333 vs. 4 (17.3)
CNAP (4)0.54
Publisher’s Note: MDPI stays neutral with regard to jurisdictional claims in published maps and institutional affiliations.

