Article

HPV16-Genotyper: A Computational Tool for Risk-Assessment, Lineage Genotyping and Recombination Detection in HPV16 Sequences, Based on a Large-Scale Evolutionary Analysis

by
Marios Nikolaidis
1,
Dimitris Tsakogiannis
2,
Garyfalia Bletsa
2,
Dimitris Mossialos
3,
Christine Kottaridi
4,
Ioannis Iliopoulos
5,
Panayotis Markoulatos
3 and
Grigoris D. Amoutzias
1,*
1
Bioinformatics Laboratory, Department of Biochemistry and Biotechnology, University of Thessaly, 41500 Larissa, Greece
2
Research Center, Hellenic Anticancer Institute, 10680 Athens, Greece
3
Microbial Biotechnology-Molecular Bacteriology-Virology Laboratory, Department of Biochemistry and Biotechnology, University of Thessaly, 41500 Larissa, Greece
4
Microbiology Laboratory, Department of Biology, Aristotle University of Thessaloniki, 54124 Thessaloniki, Greece
5
School of Medicine, University of Crete, 71003 Heraklion, Greece
*
Author to whom correspondence should be addressed.
Diversity 2021, 13(10), 497; https://doi.org/10.3390/d13100497
Submission received: 24 September 2021 / Revised: 11 October 2021 / Accepted: 12 October 2021 / Published: 14 October 2021

Abstract

:
Previous analyses have identified certain but limited evidence of recombination among HPV16 genomes, in accordance with a general perception that DNA viruses do not frequently recombine. In this evolutionary/bioinformatics study we have analyzed more than 3600 publicly available complete and partial HPV16 genomes. By studying the phylogenetic incongruence, similarity plots and the distribution patterns of lineage-specific SNPs, we identify several potential recombination events between the two major HPV16 evolutionary clades. These two clades comprise the (widely considered) phenotypically more benign (lower risk) lineage A and the (widely considered) phenotypically more aggressive (higher risk) non-European lineages B, C and D. We observe a frequency of potential recombinant sequences ranging between 0.3 and 1.2% which is low, but nevertheless considerable. Our findings have clinical implications and highlight that HPV16 genotyping and risk assessment based only on certain genomic regions and not the entire genome may provide a false genotype and, therefore, its associated risk estimate. Finally, based on this analysis, we have developed a bioinformatics tool that automates the entire process of HPV16 lineage genotyping, recombination detection and further identifies, within the submitted sequences, SNPs that have been reported in the literature to increase the risk of cancer.

Graphical Abstract

1. Introduction

Human Papillomaviruses (HPVs) are members of the Papillomaviridae family that consist of a diversified group of small, non-enveloped, dsDNA viruses [1,2]. Currently, over 200 HPV genotypes have been completely characterized, while phylogenetically they are classified into five genera, including Alphapapillomaviruses (alpha), Betapapillomaviruses (beta), Gammapapillomaviruses (gamma), Mupapillomaviruses (mu), and Nupapillomaviruses (nu) [3,4]. According to the Papillomavirus Nomenclature Committee, HPV genomes are further grouped into intratypic variants that have more than 98% sequence similarity with the reference sequence of the L1 gene [5]. Another method of classification, depending on the whole genome sequence, defines variant lineages and sub-lineages by a difference of 1% to 10%, and 0.5% to 1%, respectively [6,7]. The alpha-HPVs infect the mucosal epithelium and they are subdivided into high-risk (HR-HPV) and low-risk (LR-HPV) genotypes, considering their tumorigenic disposition [1,5,8,9]. HR-HPV infection is regarded as a major public health concern, since it is responsible for more than 99% of cervical cancer incidences while HPV16 DNA has been identified in more than 50% of cervical cancer cases worldwide [10,11].
Throughout the past few years, the large-scale sequence analysis of HPV16 DNA revealed a significant phylogenetic diversity that enabled the classification of these genomes into four major lineages (A–D) and sixteen sub-lineages (A1–4, B1–4, C1–4 and D1–4), the distribution of which varies geographically. In particular, the HPV16 sub-lineages comprise A1–A3 (European variant), A4 (Asian variant), B1–B4 (African type I variant), C1–C4 (African type II variant), D1 (North American variant), D2 (Asian American type I), D3 (Asian American type II) and D4 [7,12,13]. Intriguingly, the various HPV16 lineages and sub-lineages display different oncogenic capacity, where infection with non-European lineages augments a patient’s risk towards the development of more severe precancerous lesions and cervical cancer [14,15,16,17,18].
The high tumorigenic capacity of alpha-PVs and particularly that of HPV16 promoted the evolutionary analysis of HPVs in order to shed light on the evolutionary mechanisms involved in the emergence and variance of viral carcinogenicity among the different HPV genotypes [19]. PVs have evolved closely with their hosts, but their diversity cannot be explained only by virus–host co-divergence, as papillomaviruses and their hosts did not follow a common evolutionary line [20].
Various evolutionary mechanisms seem to affect viral diversity, including cross-species infection, gene duplication and recombination events [21,22,23]. Although DNA viruses are considered to recombine with significantly lower frequency than RNA viruses [24], nevertheless, there have been reports of homologous [25,26] and even non-homologous [27] recombination among distant lineages of animal papillomaviruses. Recombination has also been reported among members of alpha-HPVs [28,29,30] and even among HPV16 lineages [31,32]. These reports indicated that HPV16 inter-lineage recombination may occur during infection, however the prevalence of recombinant HPV16 strains or the impact of these recombination events on viral pathogenicity remains unclear.
The first focus of this study is to apply well-established bioinformatics methods and analyze for the first time all the publicly available HPV16 genomes and large genome fragments in order to (i) estimate the frequency of inter-lineage recombination events, (ii) observe where the recombination crossover sites are localized and (iii) understand whether these recombination events lead to circulating variants or they are evolutionary dead-ends. Understanding all the above points has clinical implications as well, because if inter-lineage recombination does happen at a considerable frequency, then lineage genotyping based on certain genomic regions may actually provide a false estimate of risk. The second focus of this study is the development of a bioinformatics tool, called HPV16-genotyper, that automates the aforementioned analyses in order to determine the genotype and identify any potential recombinants. In addition, HPV16-genotyper identifies within the submitted sequences any of the nine well known SNPs that have been reported in the literature to increase the risk of cancer.

2. Materials and Methods

For the first part of our analyses, in order to retrieve HPV16 genomic sequences, the reference HPV16 genome with accession NC_001526 was used as query in the NCBI BlastN algorithm [33] against the NCBI nt database in February 2021. We applied an e-value cut-off of 1e-5, a nucleotide identity greater than 97%, and also retained sequences of at least 7500 nucleotides, where less than 1% of nucleotides were unknown. This search resulted in 1534 sequences. The gene boundaries of these 1534 sequences were determined with BlastN against the annotated CDS of the reference HPV16 genome NC_001526.
In order to remove redundant genomic sequences of high nucleotide identity, the 1534 genomes were clustered with the Uclust algorithm of Usearch [34] by applying a threshold of 99.6% identity over 99.6% query coverage. This analysis resulted in 193 clusters. A reference/representative sequence was chosen for each cluster, while we also retained each of the 16 sub-lineage reference genomes (A1–A4, B1–B4, C1–C4, D1–D4) described in [7]. Based on this non-redundant set of 193 genomes, each of the HPV-16 genes (E6, E7, E1, E2, E4, E5, L2, L1) were extracted and aligned as codons using MUSCLE [35] which is embedded in the Seaview programme [36]. We also performed phylogenetic analysis of the LCR region. Manual inspection of the alignments revealed 13 sequences with many un-sequenced nucleotides localized in the E5 gene and consequently they were removed from the entire analysis, thus resulting in 180 total representative genome sequences/clusters. Complete genome alignments of the 180 representative genomes were performed with mafft v7.471 (parameters: G-INSI) [37].
PhyML trees were calculated for the multiple alignments of the complete genome and for each genomic region separately, with the GTR + I + G model, 4 gamma categories, aLRT and SPR tree search operation using SeaView. Model selection for the PhyML trees was performed with Jmodeltest 2 [38,39] based on AIC. The phylogenetic trees were visualized and annotated in Treedyn [40] and manually inspected for sequences that displayed clear incongruence at the lineage level.
The resulting 5 incongruent sequences were scanned for recombinations using T-RECs [41] with 1% nt difference cut-off and e-value cut-off 1e–10. Each recombination event was manually inspected with similarity plots of window size 300 and step 20. To further validate the five detected recombination events, each of them was also tested with RDP4 [42] and the GARD algorithm within the Datamonkey webserver (breakpoints with support over 0.75) [43]. Genome graph visualization was performed in Biopython [44] with the GenomeDiagramm module [45].
Sixty-seven lineage-specific nucleotide mutations/SNPs were identified from the 175 representative genomic sequences (after removing the 5 inter-lineage recombinant sequences) using Jalview [46] and custom python scripts. In order to classify a SNP as lineage-specific (A-specific, B-specific, C-specific, D-specific, BCD-specific), it should be present in more than 95% of the sequences of that given lineage and in less than 5% in each of the other lineages. Once the lineage-specific SNPs were identified, each of the five recombinant genome sequences were analyzed for their presence, in order to validate that these SNPs could be used as a quick and reliable method to identify potential inter-lineage recombination events.
The above-mentioned 67 lineage-specific SNPs were used to develop their corresponding 31nt probes, based on the HPV16 reference genome and by placing the lineage-specific SNP in the middle of the probe. Next, Python scripts were developed that used these 67 probes as subject sequences in a BlastN search, where the query sequences were obtained from NCBI nucleotide. By developing these SNP probes, it was feasible to rapidly scan a nucleotide sequence for the presence of any of the lineage-specific SNPs and thus identify any sequences (either entire genomes, genome fragments or even gene fragments) that had mixtures of different lineage-specific SNPs. This allowed us to rapidly analyze thousands of nucleotide sequences for any signs of potential inter-lineage recombination without the need to resolve to complex phylogenetic analyses. Based on the presence of lineage-specific SNPs, a sequence was assigned to a certain lineage and was considered as a potential recombinant if it included at least 3 SNPs that were from a different lineage. If three or more of these other-lineage SNPs were next to each other, that region was considered a higher-confidence potential recombination event. Each of the potential recombinants were also manually checked with similarity plots within T-RECs for the locations of the recombination crossover sites.
In the second part of our study, we developed a Bioinformatics tool in BioPython that automates all of the above analyses (see Figure 1). First, it scans the submitted sequences (in FASTA format) whether they belong to the HPV16 group or not. The submitted sequences have to have more than 90% nucleotide identity against the reference HPV16 sequence. Next, a blast search against the reference genes of each of the 16 HPV16 sub-lineages (A1–4, B1–4, C1–4, D1–4) identifies the gene boundaries of each submitted HPV16 sequence. Each of these genes undergoes a Neighbor Joining phylogenetic analysis (Kimura distance, 100 bootstraps) against the homologous reference genes of each of the 16 sub-lineages, using Seaview v4. The multiple alignments are generated by MUSCLE. The phylogenetic trees of each region separately can be viewed within the software via the ETE3 package [47]. Next, the software identifies and visualizes any of the 67 lineage-specific SNPs in the submitted sequence. Based on the gene-based blast results and the lineage-specific SNPs, the software determines whether a submitted sequence is a potential recombinant or not. Furthermore, the software scans the submitted sequence for each of the 9 SNPs that have reported in the literature to increase the risk of cancer. For each of these cancer-related SNPs, the software also provides a short description and the relevant citations. Finally, a help video guides the user (with example data) on how to use the software and interpret the results. The software and help video are available in http://bioinf.bio.uth.gr/hpv16-genotyper.html (accessed on 11 October 2021) for installation and use in both Windows 10 and Ubuntu Linux (version 20).

3. Results

3.1. Phylogenetic Analyses

In the complete genome phylogenomic analysis of the 180 representative genomes (Figure 2) we identified two major clades as reported previously in [7]. The first major clade is comprised of the A lineage (light green), while the second major clade encompasses the B (light blue), C (orange) and D (red) lineages and is referred to as BCD. The separation of the two major clades is strongly supported by an approximate likelihood ratio test value (aLRT) of 1.
With the exception of five identified inter-lineage recombinant sequences, in all phylogenetic trees of the individual genes (see Figure 2 and Supplementary Materials File S1) we see an overall clustering, similar to the complete genome tree, where lineage A forms a major group with high aLRT values (0.835–0.999) and the other three lineages (B, C, D) form a second major group. The B, C and D lineages appear as monophyletic only in certain genomic regions. More specifically, each of the B, C and D lineages is monophyletic in E2, L2 and LCR. The B lineage is also monophyletic in E5 and L1, while D is monophyletic in E1. In addition, the C and D lineages form one larger cluster in E1, E2 and L2 and are sister groups in E2 and L2. Interestingly, the C and D lineages are intermingled in E5, which indicates either the presence of many recombination events between these two lineages, or more probably that the phylogenetic signal is not strong enough to show them as monophyletic clades. Of note, these are very short regions of very high sequence identity.

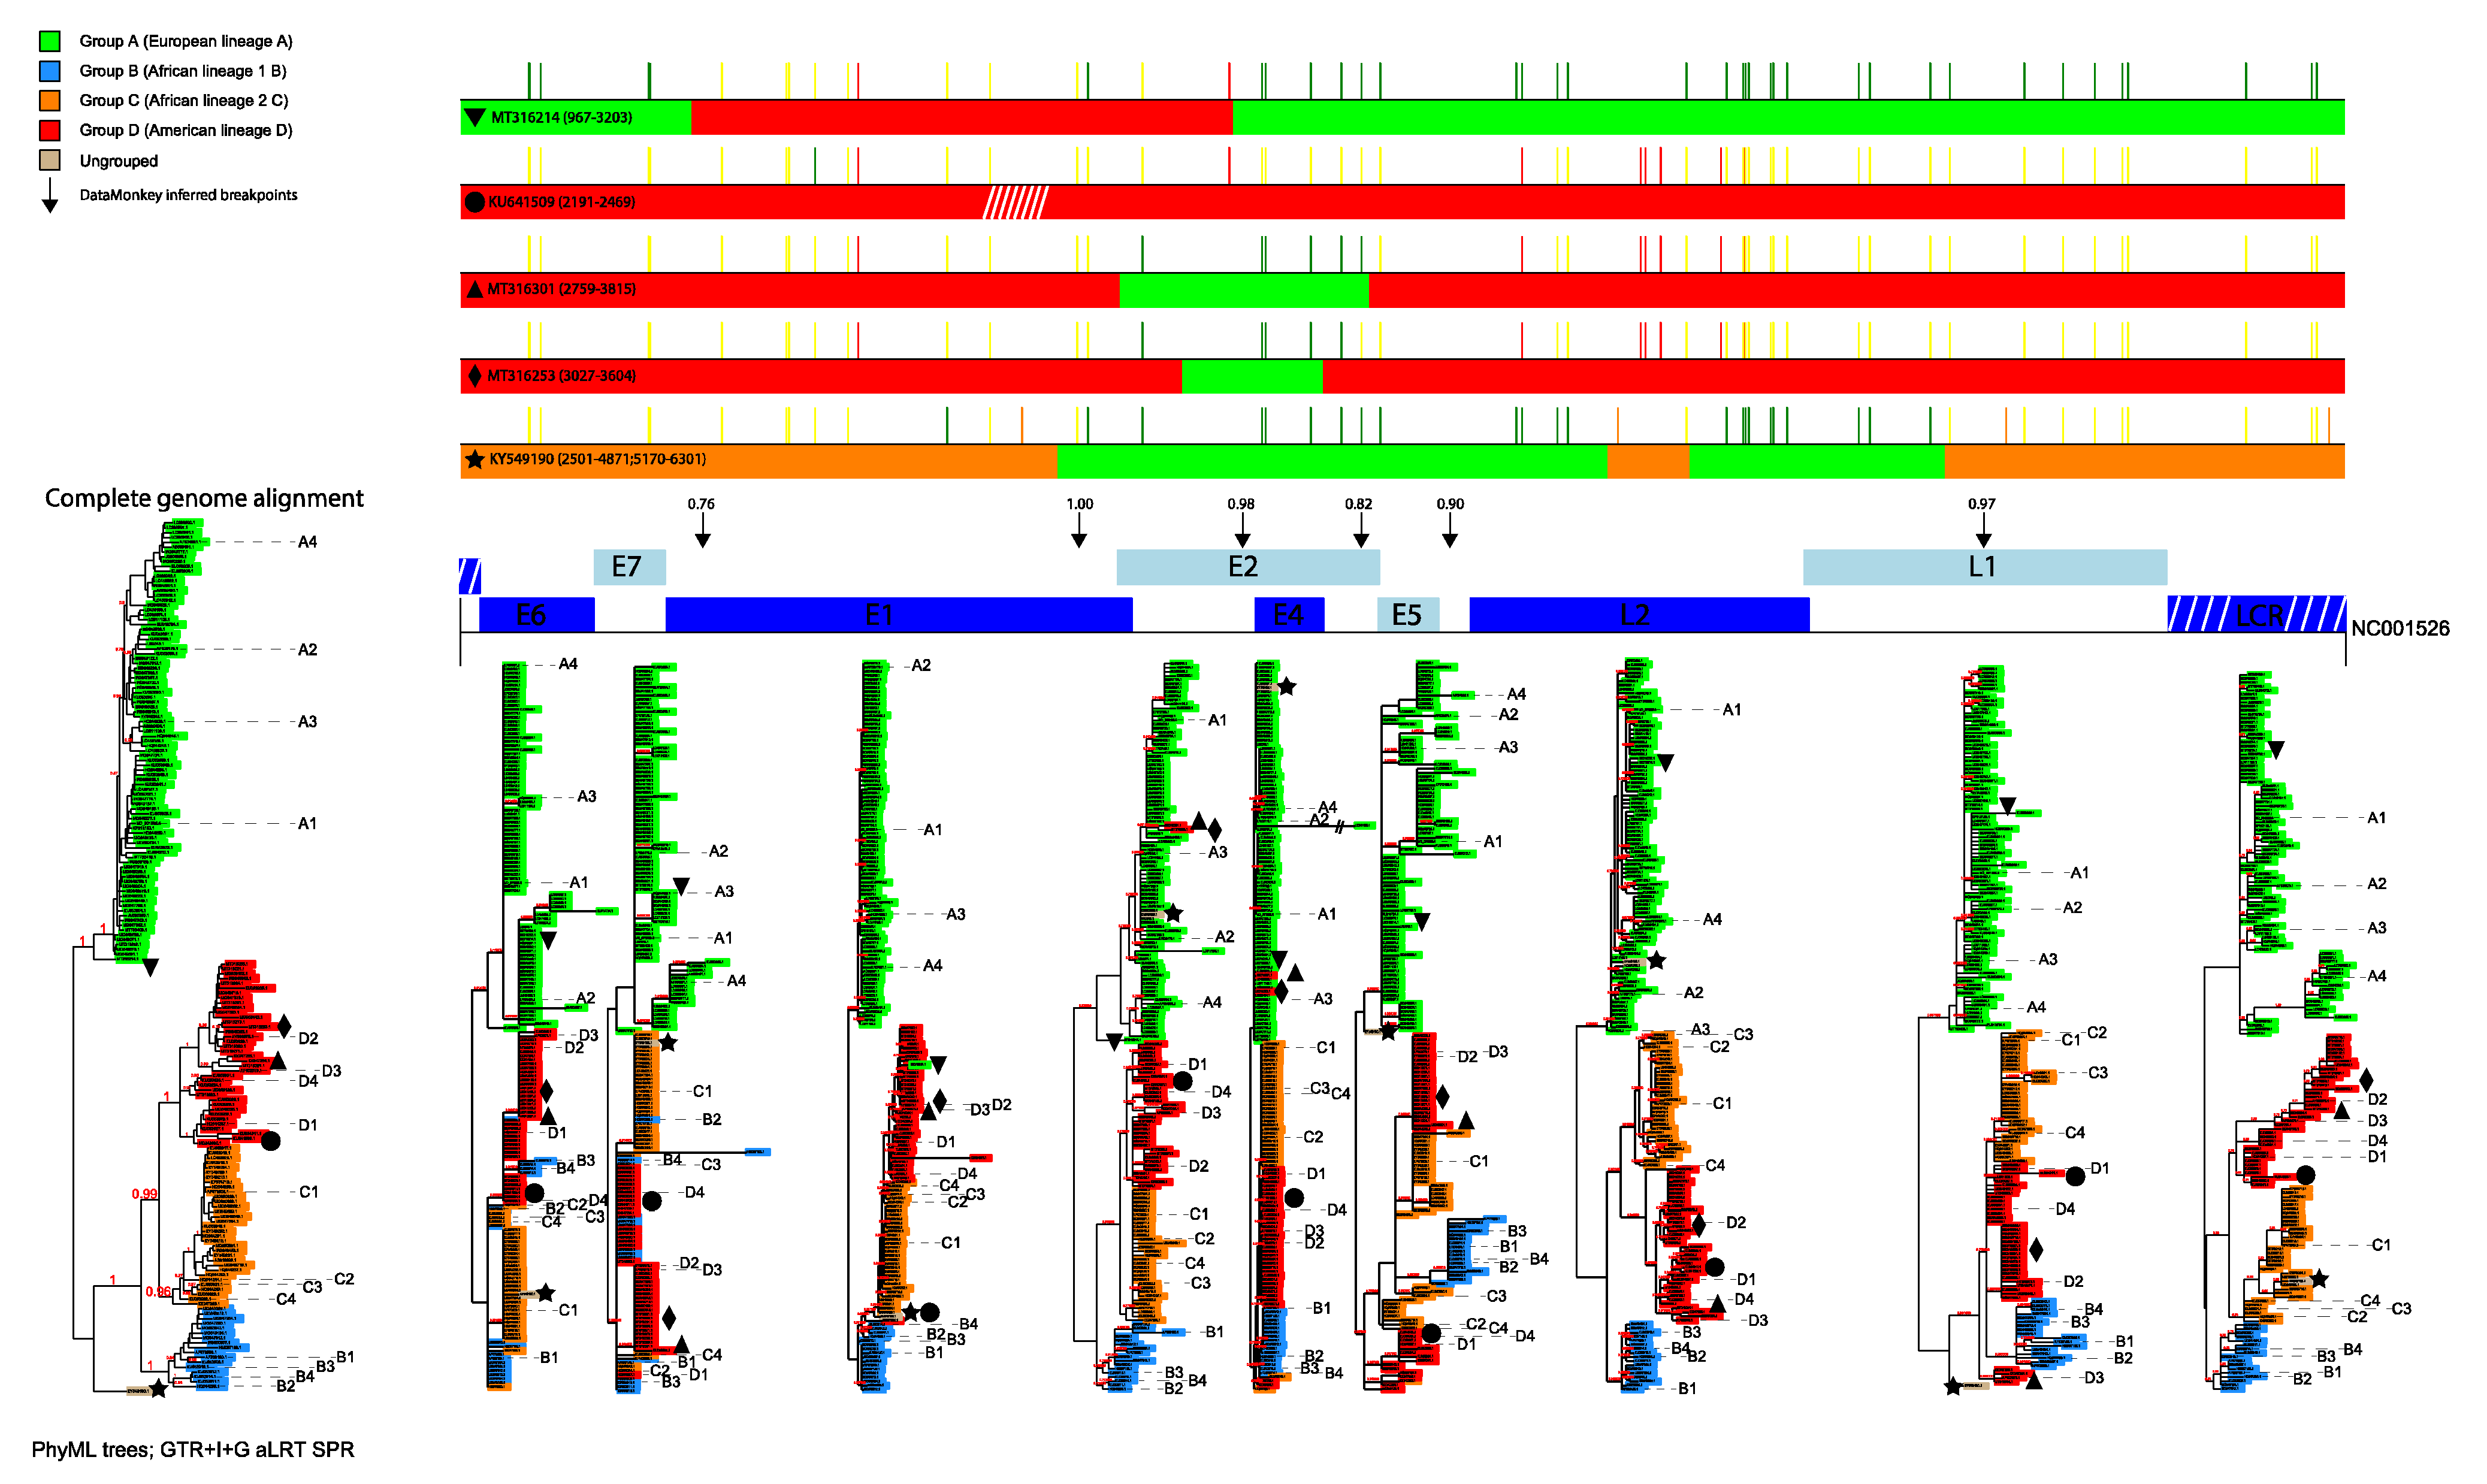
3.2. Identification of Inter-Lineage Recombinant Sequences Based on Phylogenetic Incongruence

The phylogenetic analyses of the individual genes of the 180 representative genomes identified five phylogenetically incongruent sequences that have signs of recombination at the lineage level. These sequences were further analysed with T-RECs, RDP4 and GARD.
The first inter-lineage recombination event concerns the sequence with accession number MT316214, retrieved from cervical cancer samples from Guatemala as described in [48]. Sequencing in this study was performed with Ion Torrent. This recombinant sequence is symbolized with a reverse triangle in the phylogenetic trees of Figure 2.
The second potential recombinant sequence is KU641509 that was isolated from a cervical carcinoma biopsy in India [49]. It is symbolized with a circle in the phylogenetic trees of Figure 2. It is a member of the D1 sub-lineage that has obtained a small part of the E1 region from another unknown member of the wider BCD clade.
The third potential recombinant sequence is MT316301, obtained from cervical cancer samples [48]. It is a member of the D3 sub-lineage, that has obtained part of its E2 gene from the A lineage. The recombinant sequence is symbolized with a triangle in the phylogenetic trees of Figure 2.
Similarly, MT316253 is the fourth potential recombinant sequence, obtained by [48]. It is a member of the D lineage (D2 sub-lineage) that has obtained part of its E2 gene from the A lineage. The recombinant sequence is symbolized with a diamond in the phylogenetic trees of Figure 2.
The fifth potential recombinant sequence is KY549190, which was isolated in the Netherlands and sequenced with Sanger whole genome sequencing method [50]. The various analyses revealed that almost half of this sequence (from the second half of E1 until the first half of L1) belongs to the A lineage, whereas the other part belongs to the BCD major clade and more specifically to the C lineage. The potential recombinant sequence is symbolized with a star in the phylogenetic trees of Figure 2.
Overall, from the above analysis of five recombinant genomes, we identified at least four potential recombination crossover sites in E1, five in E2 and one in L1. It is conceivable that some of the intermingled sequences in the phylogenies of E6, E7 and E5 genes could be additional recombination events. However, these genomic regions have small sizes and the overall sequence identity among members of different HPV16 lineages is high. Thus, it is difficult to conclude whether these regions are also involved in recombination events or, more probably, their phylogenetic incongruence is due to the weak phylogenetic signal.
Next, we checked whether each of the five inter-lineage recombinant sequences had more highly similar genomes within their respective UCLUST clusters. Nevertheless, the five identified recombinant sequences are singleton clusters, thus they represent five potential inter-lineage recombination events in over 1500 analyzed complete genomes. Accordingly, they do not appear to be broadly circulating in the general population and it is conceivable that these potential recombinants are low-frequency dead-end by-products of the infection cycle of HPV16.

3.3. Identification of Lineage-Specific SNPs

After removing the five identified recombinant sequences, we analyzed the remaining 175 complete representative genomes for lineage-specific SNPs that characterize each of the four lineages (A–D). Such lineage-specific SNPs could be valuable for easily and rapidly identifying potential inter-lineage recombination events in the future, where thousands of new HPV16 genomes or even genome fragments are bound to be sequenced. In total, we identified 67 lineage-specific SNPs, that are frequently present (>95%) in a specific lineage and have very low presence (<5%) in each of the other three lineages. Four of them are positioned inside the E2–E4 shared/overlapping genomic region, thus the total number of lineage-specific SNPs shown in Table 1 is 71. Furthermore, 61 of the 67 are found inside a gene and about 40% (25/61) of them are non-synonymous. Forty three (43) lineage-specific SNPs can categorize a sequence as either belonging to the A-lineage/clade or the wider BCD-clade, whereas the B, C and D lineages have eight, eight and eight lineage-specific SNPs, respectively. Therefore, this significant imbalance strongly suggests that our approach is better tailored towards identifying recombinants between the major A and BDC clades, whereas identifying recombinants among the more closely related B, C and D lineages is more difficult, due to the low number of available lineage-specific SNPs.
Reassuringly, many of these lineage-specific SNPs have already been reported in the literature [17,51,52,53,54,55]. However, five novel synonymous nucleotide changes that facilitate the specific characterization of HPV16 variant lineages were (to the best of our knowledge) found for the first time in the present study. In particular, one nucleotide variation was detected at position 3431 of the E2 gene, while one variation was found at position 3858, which is located in the overlapping fragment of the E2 and E5 ORFs. Moreover, two new lineage-specific SNPs were identified at positions 4145 and 4149, respectively, which are positioned in the region between E5 and L2 ORFs, whereas a novel sequence change was detected at position 5659 which is located in the overlapping fragment of L1 and L2 genes.
Next, each genomic region was tested for enrichment in group-specific SNPs. Only L2 was found to be significantly enriched, with an enrichment fold of 1.83 (Fisher’s exact test p < 0.03).

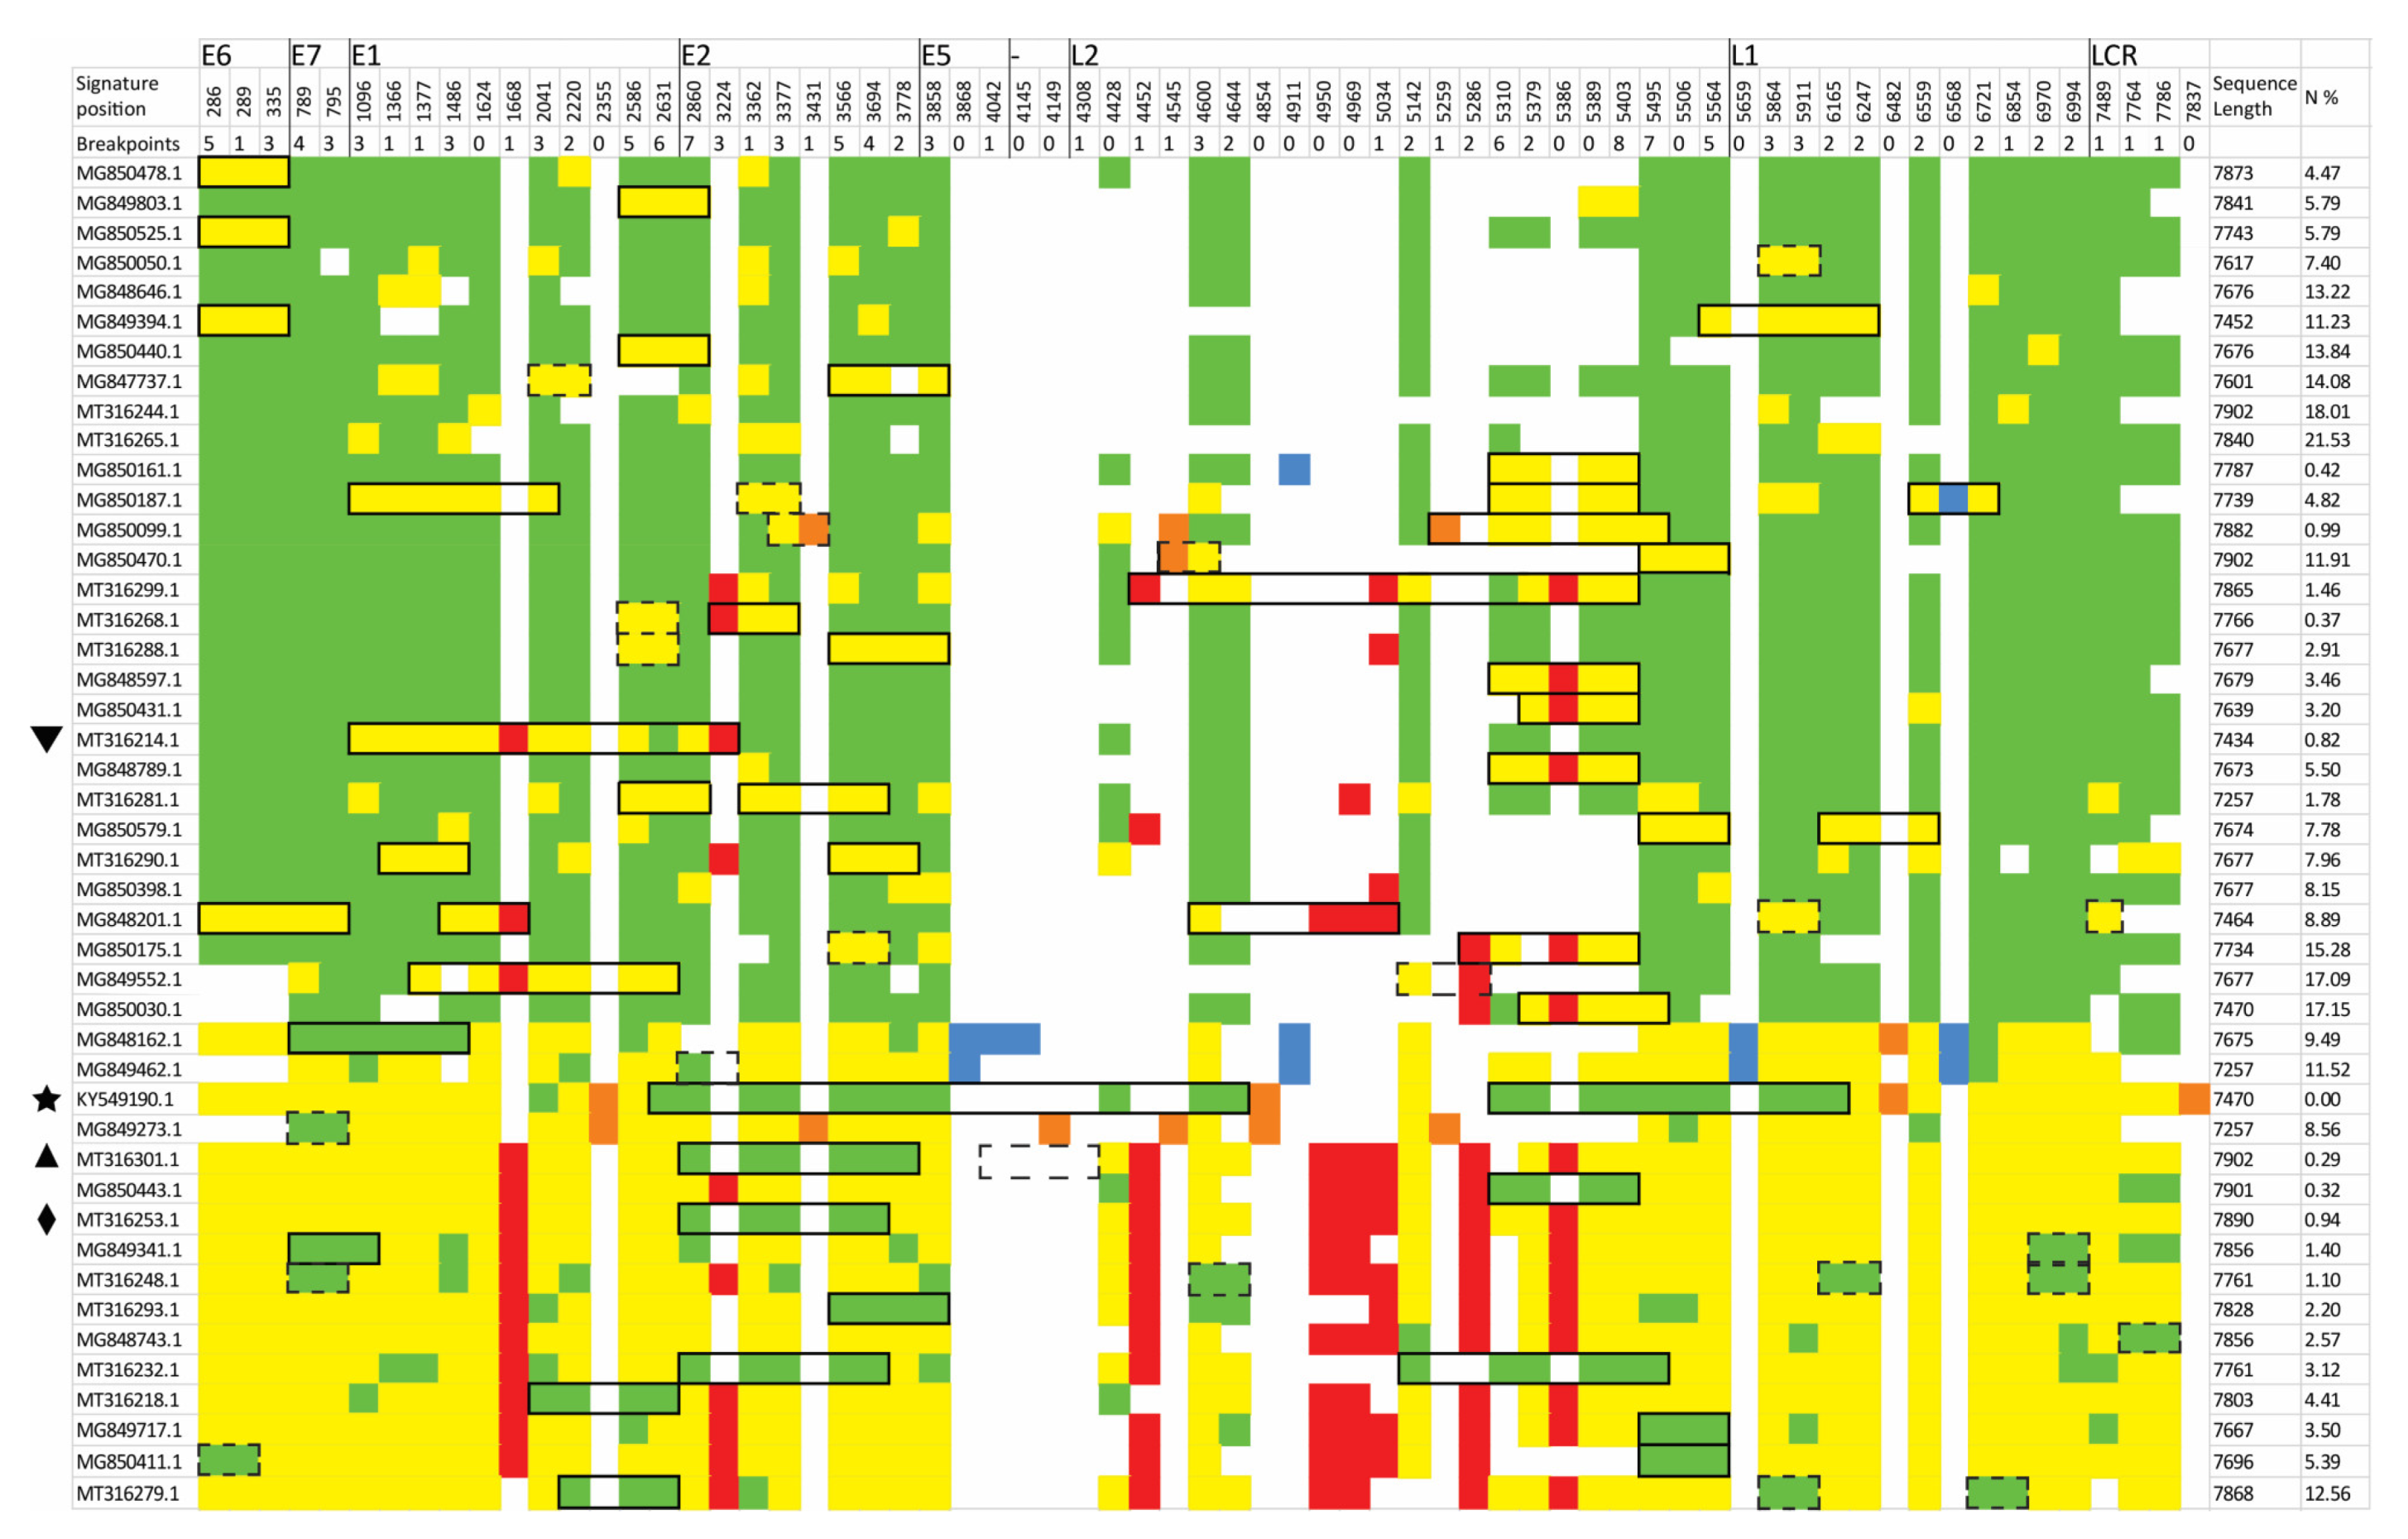
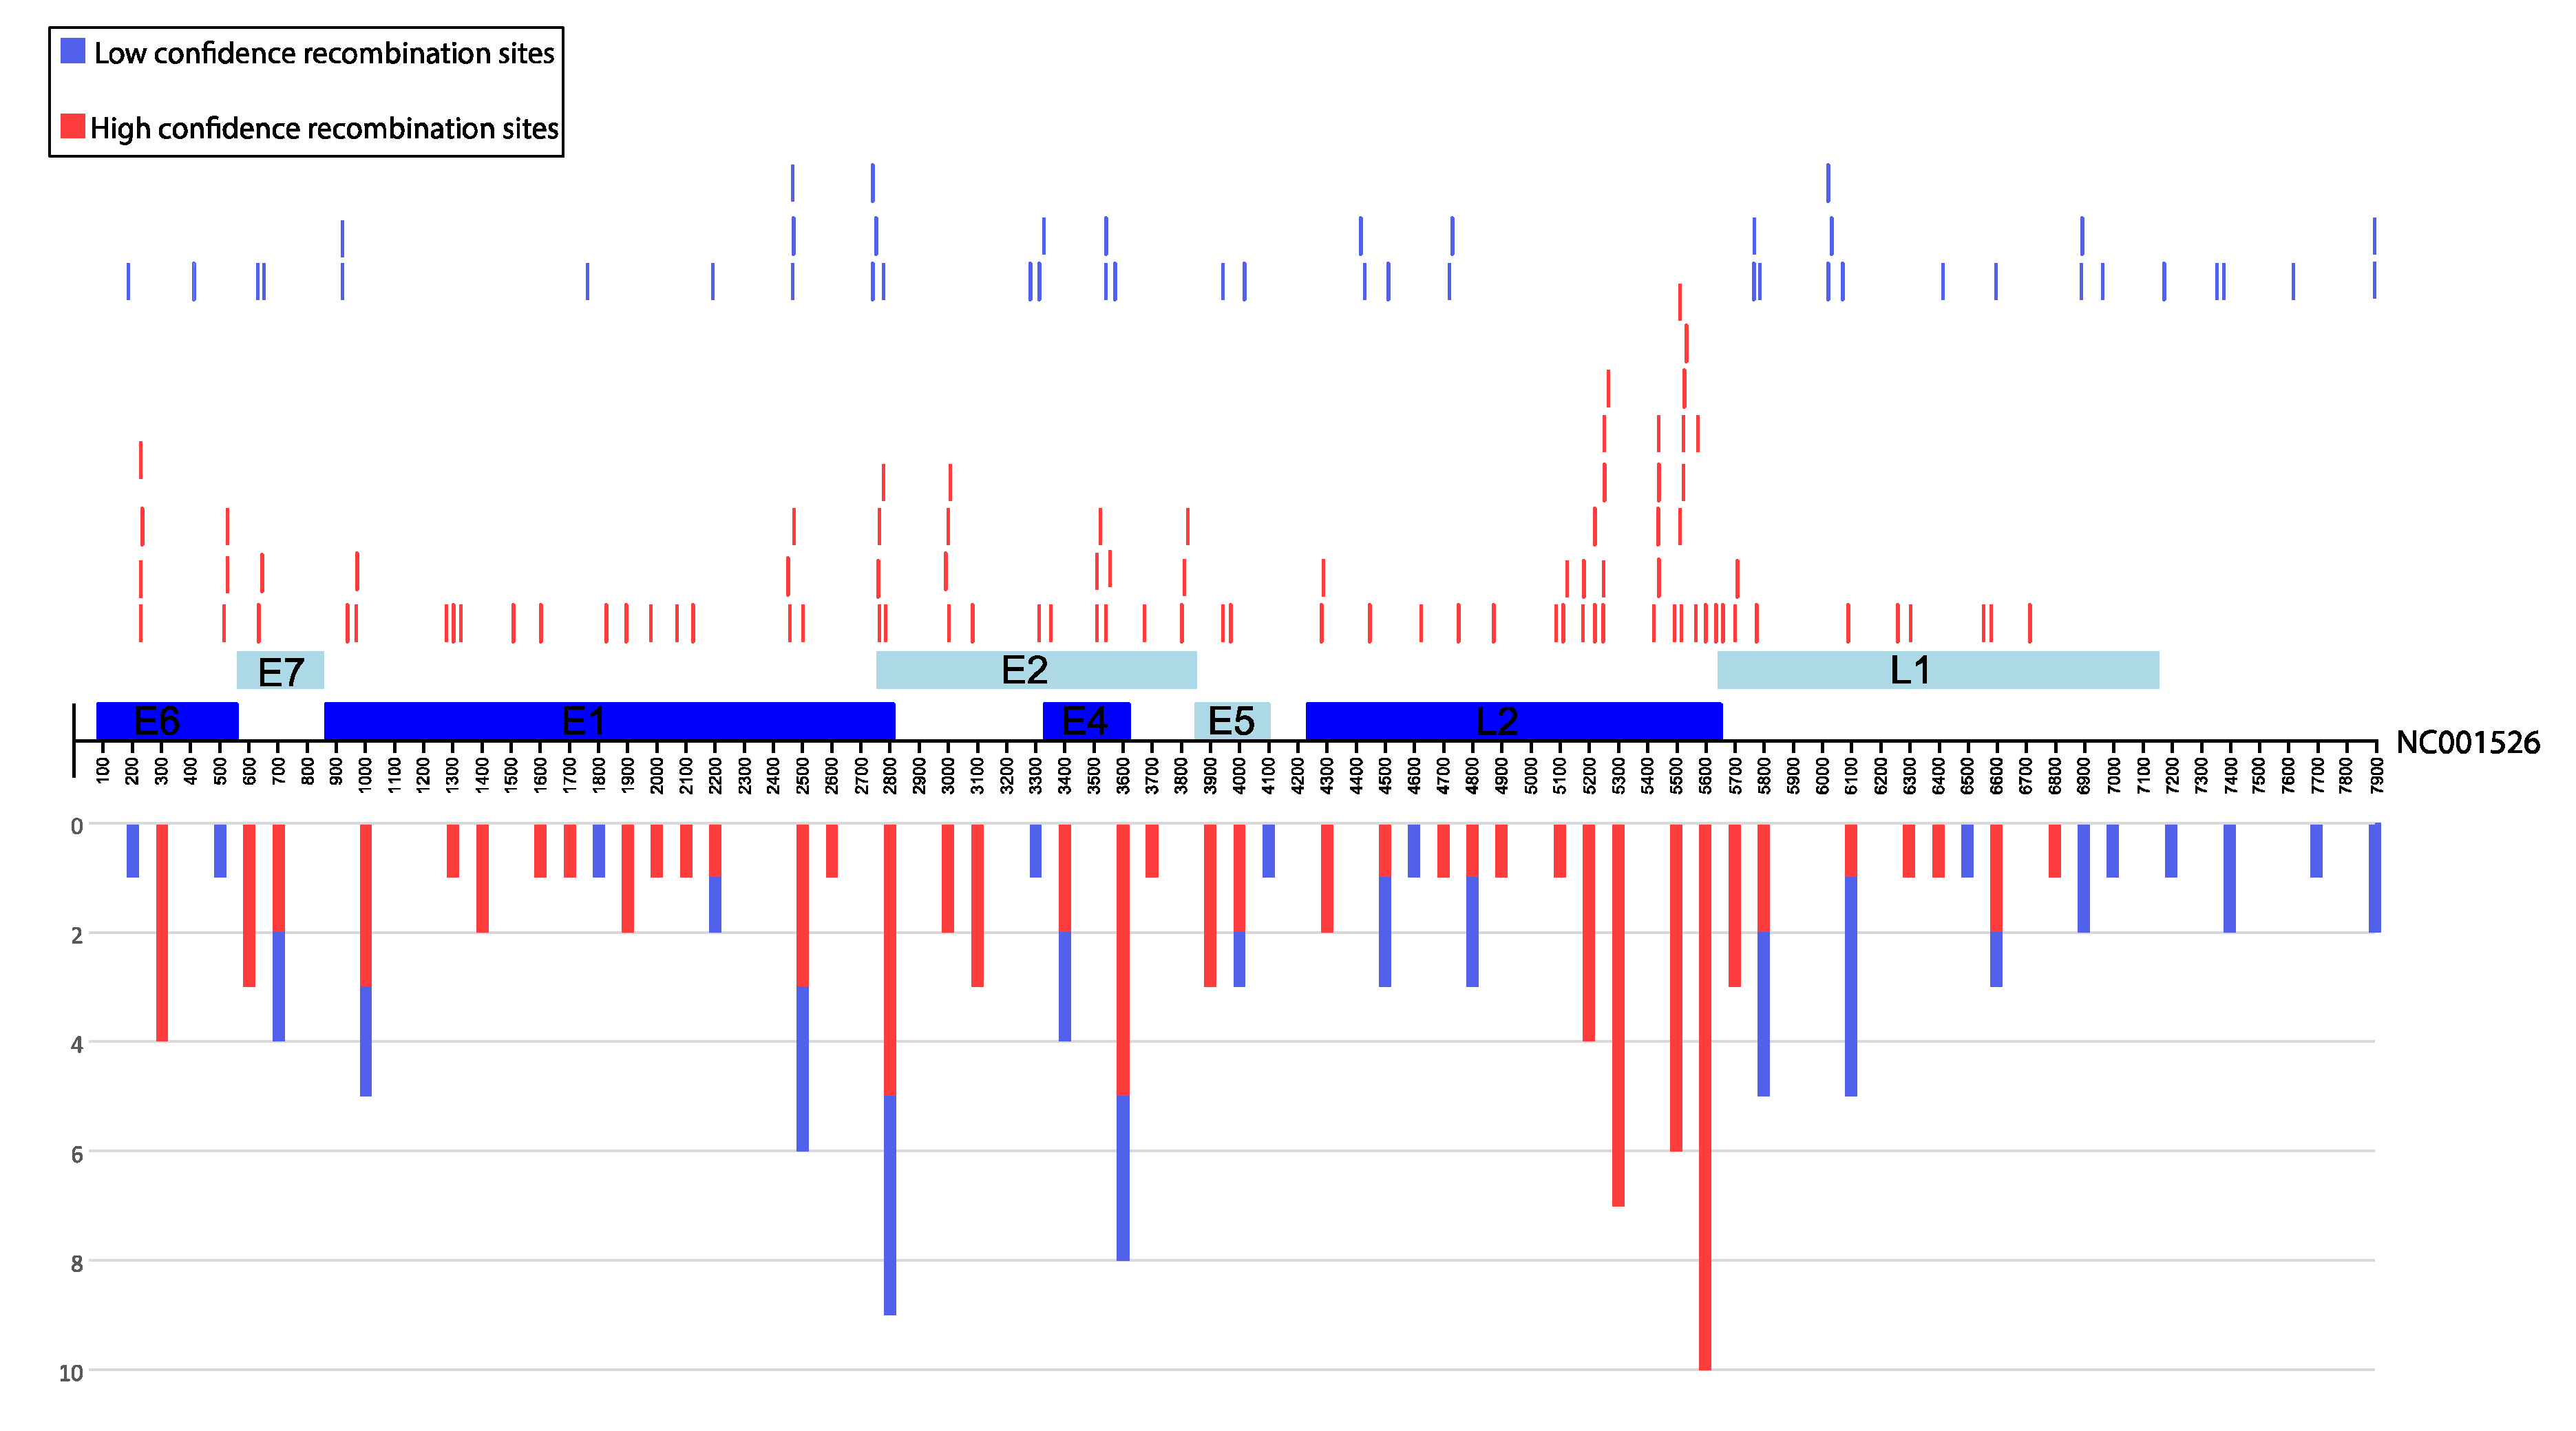
3.4. Rapid Detection of Inter-Lineage Recombination Events, Based on the Presence of Lineage-Specific SNPs

Based on the 67 lineage-specific SNPs, we developed a virtual SNP array (with Python scripts) of 31nt probes (using the HPV16 reference genome), where we placed the lineage-specific SNP in the middle of the probe (position 16). Next, we downloaded 9993 HPV16 sequences from NCBI nucleotide (May 2021), that were either entire genomes, or large genome fragments or even gene fragments. Many of the large genome fragments contained un-sequenced nucleotides, designated with N. The python scripts that used the 67 probes checked each of the nucleotide sequences for the presence of any lineage-specific SNP. Thus, this approach allowed us to rapidly scan thousands of sequences and identify in each of them any mixture of lineage-specific SNPs, that was considered as a sign of inter-lineage recombination.
In order to identify putative inter-lineage recombination events, all sequences were assigned to a certain lineage (A, B, C, D) or clade (A, BCD). Next, the putative recombinant would need to have more than 3 signature SNPs (%5; 3/67) of another lineage or clade. The putative recombinants were further inspected manually with similarity plots, within T-RECs (see Supplementary Materials File S2). Recombinant regions with 3 or more consecutive SNPs belonging to another lineage/clade were considered as higher confidence, whereas if the recombination event was visible in similarity plot, but was only supported by two or less consecutive SNPs, it was considered as lower confidence.
Of the 9993 sequences downloaded, only 3657 had more than 6000 sequenced nucleotides each (accounting for more than 75% of the HPV16 genome). We focused on these 3657 sequences and identified 45 putative recombinants (Figure 3), which account for 1.2% of the analyzed sequences. Of note, these 3657 sequences also include the 1534 complete genomes of our first analysis. Based on these lineage-specific SNPs, it was possible to roughly estimate the region that underwent recombination. Next, these putative inter-lineage recombinants were further manually inspected with similarity plots within T-RECs, for validating them and for identifying more precisely their recombination crossover sites (Figure 4 and Supplementary Materials File S2). In the original higher quality genomic dataset (1534 sequences), we discovered only five recombinant sequences (recombination frequency of 0.3%), based on phylogenetic analyses. Thus, our second approach based on lineage-specific SNPs is more powerful and sensitive.
Based on this second analysis, we identified 95 higher confidence and 45 lower confidence recombination crossover sites across the entire genome (140 in total), which accounted to an average of 12–18 recombination sites per 1000 nt. However, the recombination sites were not evenly distributed across the HPV16 genome. We observed a statistically significant enrichment (using the hypergeometric test, p-value < 0.05,) for L2 (41 sites, 29 sites per 1000 nts, p-value = 7.6 × 10⁻⁴, enrichment fold 1.62) and a statistically significant depletion for LCR (six sites, seven sites per 1000 nts, p-value = 5.5 × 10⁻³, under-enrichment fold 2.48).

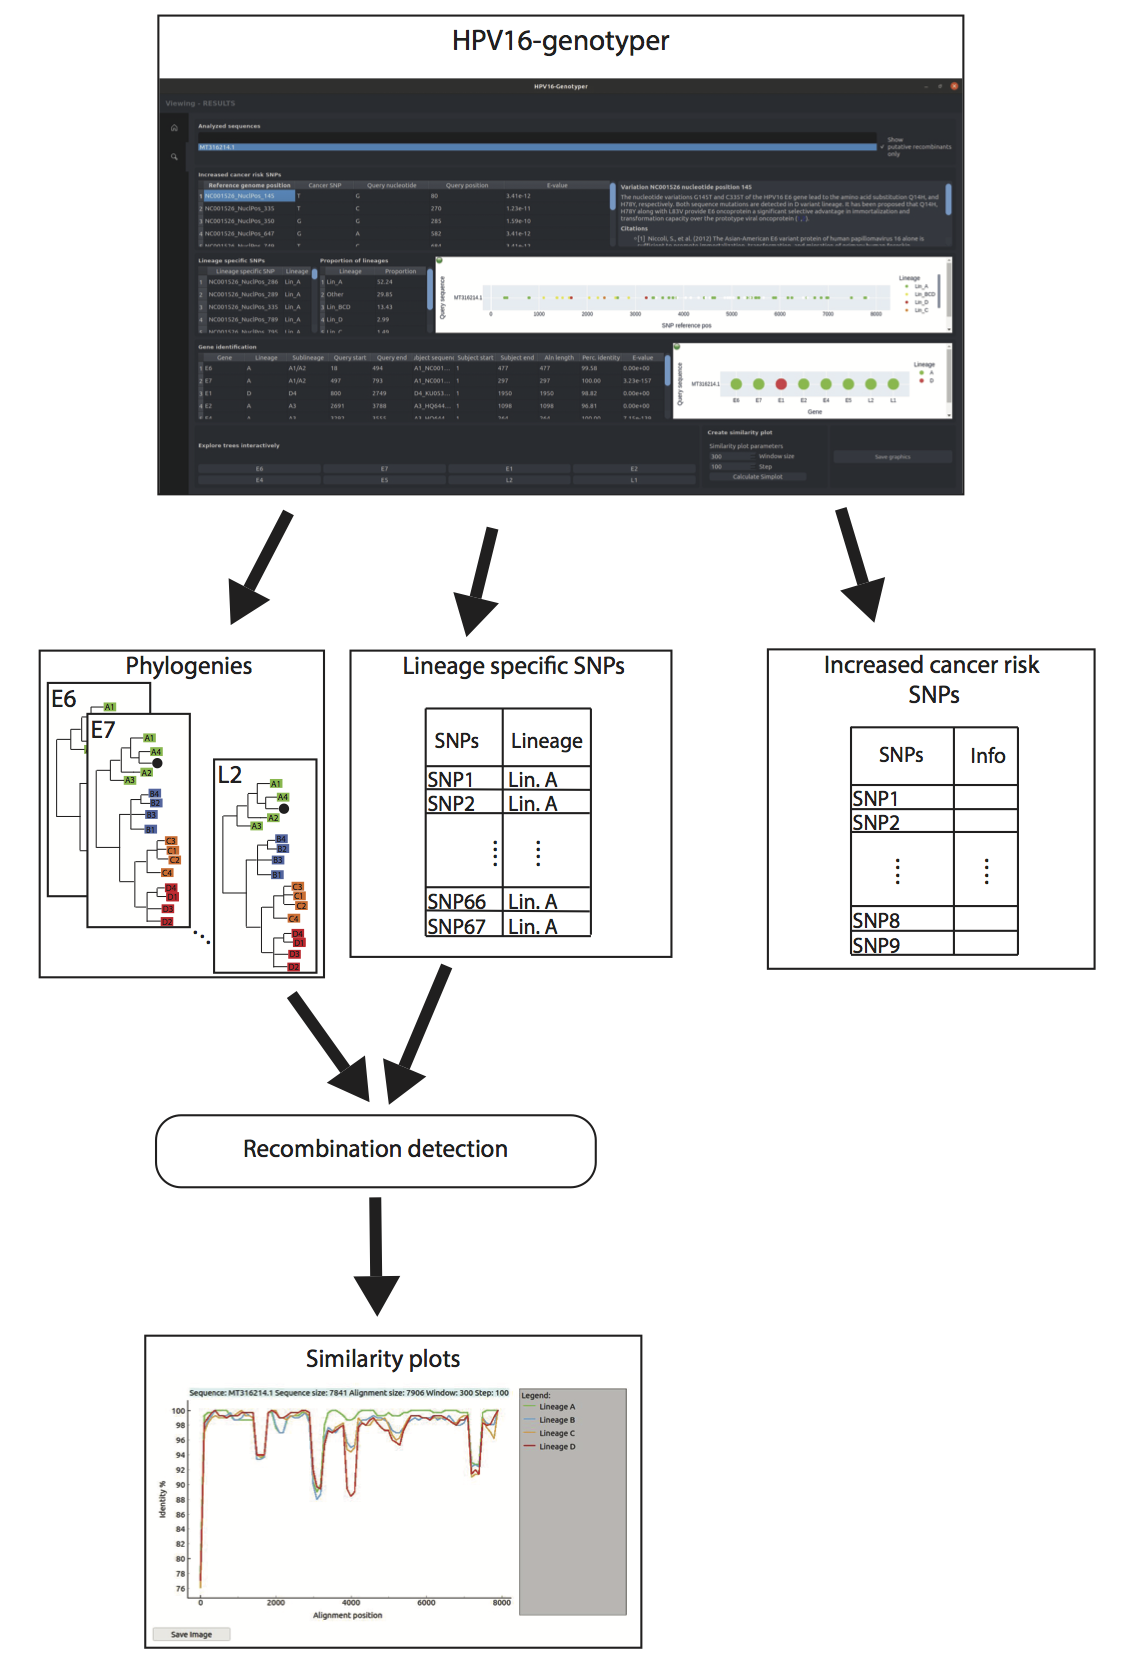
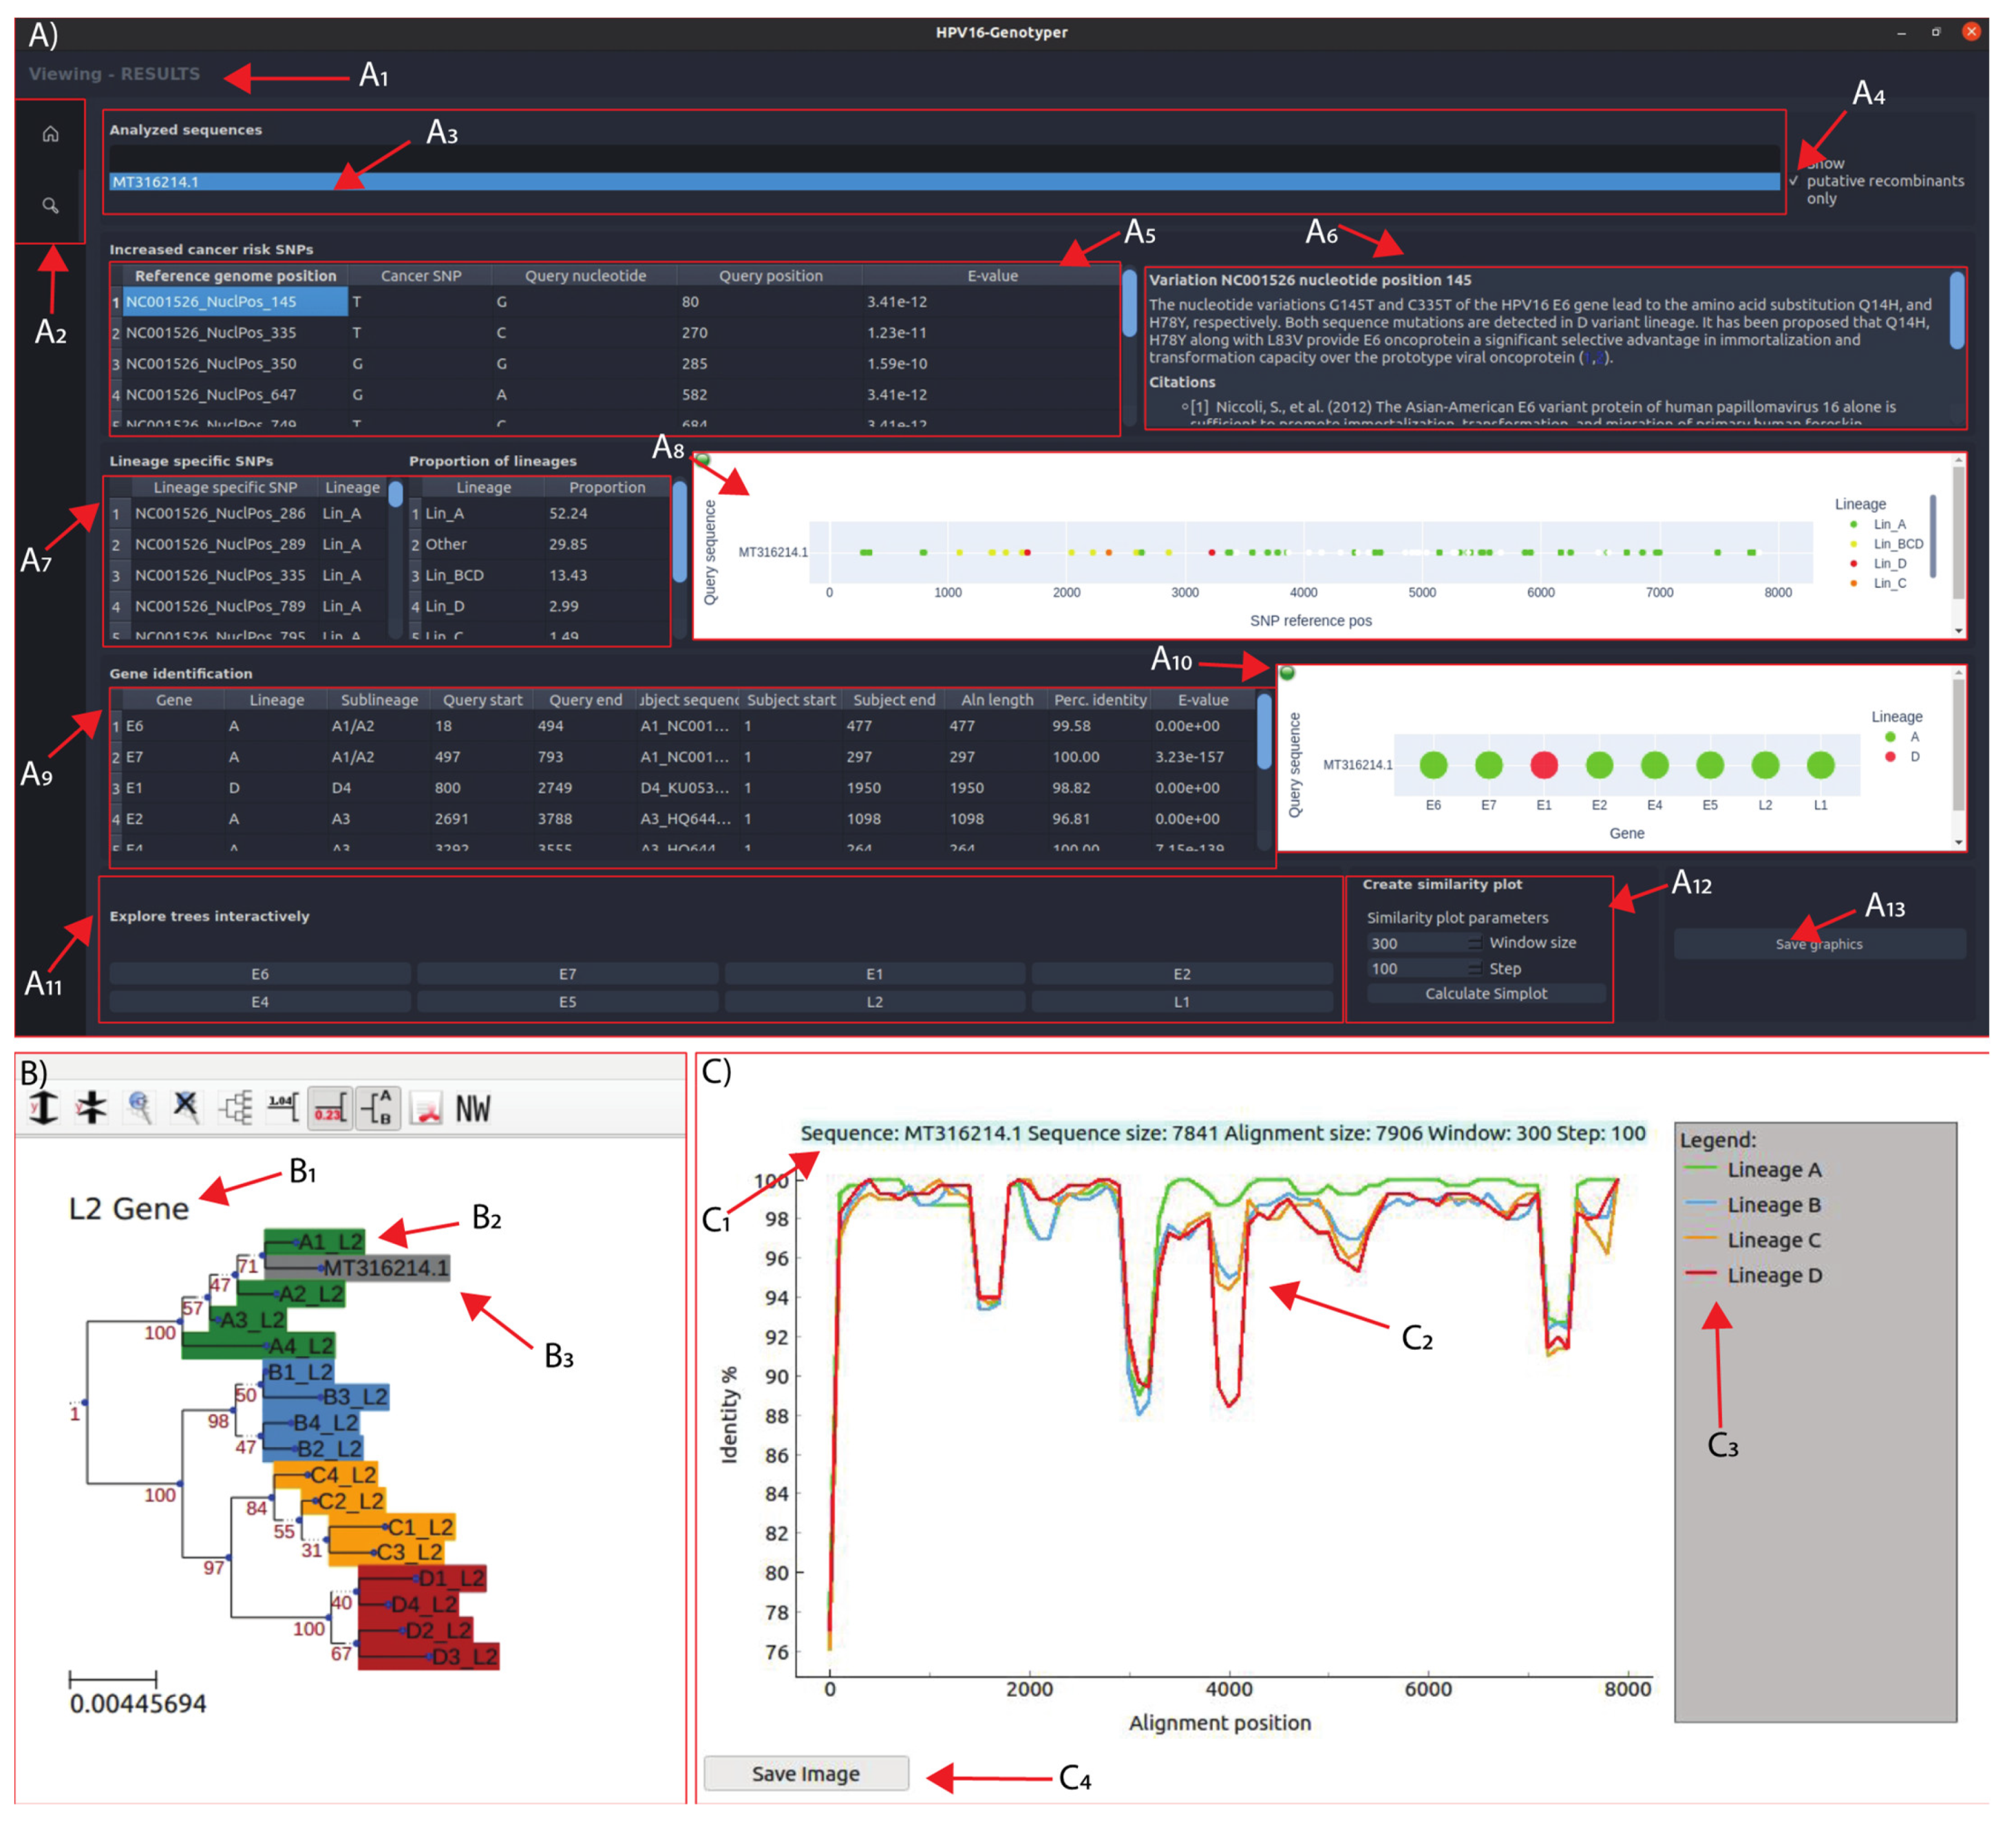
3.5. Development of the HPV16-Genotyper Computational Tool

Based on the previously mentioned analyses, we developed a computational tool in Biopython that automates the entire process and performs genotyping, quality control of genome assembly, detection of recombination events and detection of cancer-related SNPs. The software was tested on the 180 above-mentioned representative genomes and was validated for proper performance. The entire analysis took 16 min on a personal Linux laptop with eight cores (2.4 GHz). In Figure 5, an example of phylogenetic and recombination analysis of the HPV16 strain with accession number MT316214.1 is described in detail using the newly designed HPV16-genotyper tool. The HPV16-genotyper confirmed the initial analysis that is summarized in Figure 2.
More specifically, the software accepts sequences in FASTA format and first tries to determine which of them are HPV16 sequences or not (based on the 90% nucleotide identity criterion). Next, the software scans each HPV16 sequence for the presence of any of the 67 lineage-specific SNPs (of Table 1). The results are depicted in sections A7 and A8 of Figure 5. From this analysis, the user can determine which clade/lineage the sequence belongs to. In addition, if the majority of SNPs belong to a certain clade/lineage, but there also exist a number of SNPs from another clade/lineage that also tend to cluster together; this is a strong indication of interlineage recombination. However, if the sequence shows a randomly mixed pattern of SNPs from different lineages, this may be a sign of genome mis-assembly, due to infection from more than one lineages. Thus, this analysis also functions as a quality control of the assembled sequence.
Afterwards, HPV16 sequences are analyzed with BlastN in order to determine the boundaries of each gene. Furthermore, BlastN determines in which of the 16 sub-lineages each gene belongs to. This result is depicted in section A10 of Figure 5 and can be used as a good indication in which lineage and sub-lineage the sequence belongs to and whether the sequence could be an interlineage recombinant or not.
Next, the genes of the analyzed HPV16 sequences undergo Neighbor Joining phylogenetic analysis together with the homologous genes from each of the 16 reference sub-lineages. The results of the phylogenetic analyses are visualized with the ETE3 package (see section B of Figure 5) by pressing the corresponding button (in section A11 in Figure 5). ETE3 allows the user to perform many editing functions upon the phylogenetic tree, such as rerooting, ladderizing, clade swapping, etc. Therefore, this phylogenetic analysis of each gene separately is probably the best method to determine the lineage and sub-lineage of a sequence and whether it’s a recombinant (or even assembly artifact), based on any observed phylogenetic incongruence.
The software also decides whether a sequence is a recombinant or not based on both the BlastN and lineage-specific SNPs. More specifically, a sequence identified as a potential recombinant needs to have genes from a different lineage. Simultaneously, the sequence needs to have three or more consecutive SNPs from another clade/lineage. The potential recombinants can be displayed by pressing the corresponding button (in section A4 of Figure 5). In addition, a potential recombinant may undergo Similarity Plot analysis (see section C of Figure 5) by pressing the corresponding button (see section A12 of Figure 5).
Finally, the software scans each HPV16 sequence for the presence of any of the nine SNPs that are known to be associated with an increased risk of cancer. These results are depicted in the corresponding table (see section A5 of Figure 5) whereas a description/annotation of each cancer-related SNP together with its associated literature citation/s is depicted in the corresponding box (see section A6 of Figure 5). The nine SNPs are: (i) G145T [56,57], (ii) C335T [56,57], (iii) T350G [15,18,56,57,58,59,60,61,62], (iv) A647G [63,64,65,66], (v) C749T [64,66,67,68,69], (vi) C2860A [70], (vii) C3410T [51,71,72,73], (viii) C3684A [70,73], (ix) A4042G/C/T [51,52].

4. Discussion

DNA viruses recombine with significantly lower frequency than RNA viruses [24]; nevertheless, there have been reports of homologous [25] and even non-homologous [27] recombination among distant lineages of animal papillomaviruses. In addition, there have also been reports of recombination events within alpha-HPVs, where recombination crossover sites were localized at the E6, E7, L2 and L1 genes, hence advocating that novel recombinant types could be formed upon a natural viral co-infection [29,30]. The first report of HPV16 recombination in clinical samples was provided by [31]. Inter-lineage recombination events were observed between the HPV16 A and HPV16 C (African type II) lineages. In addition, another study reported recombination events in clinical samples between European and African type II lineages and between D (Asian American) and B (African type I) lineages, respectively [32].
Our initial phylogenetic incongruence analyses on all the genomic regions of 180 complete HPV16 genomes revealed at least five potential recombinant sequences where the exchange occurred between the two major evolutionary clades; the clade that encompasses lineage A and the clade that encompasses lineages B, C, and D. Lineage A is considered to contain mostly low-risk viruses whereas lineages B, C, and D usually contain HPV16 viruses with more aggressive phenotypes [14,15,16,17,18]. More specifically, the largest HPV16 genome-scale study to date analyzed more than 7000 sequences of various sub-lineages from all areas of the world [74]. Their findings showed that the A lineage was the most prevalent worldwide as it accounted for more than 78% of the analyzed sequences, while the next most abundant lineage was D with a frequency of 9%. The A lineage is dominant in America, Europe, Asia and Oceania, the B and C lineages are mostly found in Africa, and the D lineage can be found in America, Asia and some parts of Africa. That analysis also revealed that A1 and A2 are the most globally widespread sub-lineages, constituting ~63% (4474/7116, 707/7116) of the total examined cases. The A3 and A4 sub-lineages are more specific to Asia. The B1–3 and C2–3 sub-lineages are reported almost exclusively in sub-Saharan Africa and B–D4 are found mostly in North Africa. The D1 sub-lineage can be found in America, Europe and East Asia, while D2 is found almost exclusively in America. Lastly, D3 can be found in many regions around the world and is the most abundant D sub-lineage. These geographical dispersion patterns suggest that the old nomenclature (e.g., European for A1-3 variants) is now outdated.
The study of [14] based on 3200 women associated the A1/2 sub-lineages with greater CIN3+ risk in “white women” population. Additionally, [74] reported that the A3 sub-lineage demonstrates an increased cancer risk for the East Asian population, where it is most commonly found. The A4 sub-lineage is associated with greater cancer risk than the other A lineage members [14], which was further confirmed for the Asian population by [74]. The D lineage is associated with increased cancer risk compared to the rest of the variant lineages [12,13,14,74] and increased incidents of adenocarcinoma and adenocarcinoma in situ. One study found that the D sub-lineages had an increased LCR P97 oncogenic promoter activity compared to the A lineages, which might partially explain the difference in the oncogenic potential [75].
The 180 genomes of our first analysis constitute representative genomes of more than 1500 complete genomes. The five potential recombinant sequences were singleton clusters in the 1500 sequences, thus, a rough estimate of recombination frequency is 1 in 300 (0.3%).
The second recombination analysis utilized 3657 complete and partial genomes where more than 75% of their nucleotides had been sequenced. This analysis was based on 67 lineage-specific SNPs that are found in very high frequency (>95%) in a certain lineage and in very low frequency (<5%) in each of the other three lineages. In accordance with our phylogenetic analyses, 43 of the 67 lineage-specific SNPs can categorize a sequence as either belonging to the A-lineage or the wider BCD-clade. These SNPs are distributed across the entire genome, nevertheless, we observed a statistically significant enrichment for L2. Based on the distribution of lineage-specific SNPs, we identified 45 recombinant sequences whose recombination crossover sites were manually determined with similarity plots. The HPV16 genome is circular, thus every recombination event consists of double recombination crossover sites. In addition, we observed several sequences with more than one recombination events. Overall, recombination sites were observed in all genomic regions, however, we also observed a significantly higher frequency for the L2 region and a significantly lower frequency for LCR. Nevertheless, these hotspot/coldspot results should be treated with caution because they are strongly biased by the un-even distribution of lineage/clade specific SNPs that were used in the first place to identify recombination events. Therefore, future validation of these recombination hotspots and coldspots is needed, which will be based on more and fully sequenced genomes and preferably by phylogenetic incongruence and similarity plot methods. Our approach constitutes a crucial first step, because it needed to utilize a large number of incompletely sequenced genomes.
Based on the second recombination analysis, the recombination frequency among the two distinct clades is now elevated from 0.3% to at least 1.2%, which is not trivial. This finding also may have important clinical implications in the near future, because HPV16 genotyping and risk assessment is usually based on certain genomic regions and not the entire genome. Thus, it is conceivable that a recombinant sequence may give a false risk estimate because one part of it originates from a clade/lineage that is usually associated with more aggressive phenotypes and another part of it originates from a clade/lineage that is usually associated with more benign phenotypes. Furthermore, our study clearly demonstrates that phylogenomic analyses based on the entire genomes of inter-lineage recombinant sequences instead of phylogenetic analyses of each gene separately may also give a mistaken impression of the emergence of a new and distinct evolutionary lineage as is the case of the recombinant KY549190.
As a note of caution, it is conceivable that some of the above-mentioned recombination events are actually artifacts of the genome assembly process of next-generation sequencing data from tissues that have infections from more than one HPV16 lineages. However, if that is the case, then lineage-specific SNPs from another clade should be distributed across the genome in a mixed fashion and not appearing to cluster. Thus, we believe that our criterion of at least three consecutive other-lineage-specific SNPs should filter out many such false recombinants.
Finally, based on the above mentioned analyses and results, we developed a computational tool named HPV16 genotyper that performs automatically as a pipeline a series of complicated analyses and helps the wet-lab user to rapidly assess the genotype, to identify any potential recombinants and to assess the cancer risk of a certain set of sequences. This computational tool will streamline many complicated bioinformatics analyses for the wet-lab users in this new, exciting and challenging era of next-generation sequencing of thousands of HPV16 genomes.

Supplementary Materials

The following are available online at https://www.mdpi.com/article/10.3390/d13100497/s1, File S1: Figures of PhyML trees of HPV16 genomic regions. File S2: Figures of Similarity Plots of potential recombinant HPV16 sequences.

Author Contributions

Conceptualization, G.D.A., P.M.; methodology, G.D.A., D.T., G.B., D.M., C.K., I.I., P.M.; software, M.N., G.D.A., I.I.; formal analysis, M.N., G.B., D.T., D.M., C.K., I.I., P.M., G.D.A.; writing—original draft preparation, M.N., D.T., G.B., D.M., C.K., I.I., P.M., G.D.A.; supervision, G.D.A. All authors have read and agreed to the published version of the manuscript.

Funding

This research received no external funding.

Institutional Review Board Statement

Not applicable.

Informed Consent Statement

Not applicable.

Data Availability Statement

All analyzed sequences are publicly available at the NCBI Nucleotide database (https://www.ncbi.nlm.nih.gov/nucleotide/).

Acknowledgments

M.N. would like to thank the Bodossakis foundation (MSc studentship: BDA-394) and the University of Thessaly Research committee (DEKA PhD studentship: DEKA-UTH-259) for financial support.

Conflicts of Interest

The authors declare no conflict of interest.

References

  1. zur Hausen, H. Papillomavirus Infections—A Major Cause of Human Cancers. Biochim. Biophys. Acta (BBA)—Rev. Cancer 1996, 1288, F55–F78. [Google Scholar] [CrossRef]
  2. Tsakogiannis, D.; Gartzonika, C.; Levidiotou-Stefanou, S.; Markoulatos, P. Molecular Approaches for HPV Genotyping and HPV-DNA Physical Status. Expert Rev. Mol. Med. 2017, 19, e1. [Google Scholar] [CrossRef]
  3. Bernard, H.-U.; Burk, R.D.; Chen, Z.; van Doorslaer, K.; zur Hausen, H.; de Villiers, E.-M. Classification of Papillomaviruses (PVs) Based on 189 PV Types and Proposal of Taxonomic Amendments. Virology 2010, 401, 70–79. [Google Scholar] [CrossRef] [PubMed] [Green Version]
  4. Gheit, T. Mucosal and Cutaneous Human Papillomavirus Infections and Cancer Biology. Front. Oncol. 2019, 9, 355. [Google Scholar] [CrossRef] [Green Version]
  5. Van Doorslaer, K.; Chen, Z.; Bernard, H.-U.; Chan, P.K.S.; DeSalle, R.; Dillner, J.; Forslund, O.; Haga, T.; McBride, A.A.; Villa, L.L.; et al. ICTV Virus Taxonomy Profile: Papillomaviridae. J. Gen. Virol. 2018, 99, 989–990. [Google Scholar] [CrossRef] [PubMed]
  6. Chen, Z.; Schiffman, M.; Herrero, R.; DeSalle, R.; Anastos, K.; Segondy, M.; Sahasrabuddhe, V.V.; Gravitt, P.E.; Hsing, A.W.; Burk, R.D. Evolution and Taxonomic Classification of Human Papillomavirus 16 (HPV16)-Related Variant Genomes: HPV31, HPV33, HPV35, HPV52, HPV58 and HPV67. PLoS ONE 2011, 6, e20183. [Google Scholar] [CrossRef] [PubMed]
  7. Mirabello, L.; Clarke, M.; Nelson, C.; Dean, M.; Wentzensen, N.; Yeager, M.; Cullen, M.; Boland, J.; NCI HPV Workshop; Schiffman, M.; et al. The Intersection of HPV Epidemiology, Genomics and Mechanistic Studies of HPV-Mediated Carcinogenesis. Viruses 2018, 10, 80. [Google Scholar] [CrossRef] [PubMed] [Green Version]
  8. McBride, A.A.; Warburton, A. The Role of Integration in Oncogenic Progression of HPV-Associated Cancers. PLoS Pathog. 2017, 13, e1006211. [Google Scholar] [CrossRef] [Green Version]
  9. Tsakogiannis, D.; Gortsilas, P.; Kyriakopoulou, Z.; Ruether, I.G.A.; Dimitriou, T.G.; Orfanoudakis, G.; Markoulatos, P. Sites of Disruption within E1 and E2 Genes of HPV16 and Association with Cervical Dysplasia: Sites of Disruption within E1 and E2 Genes of HPV16. J. Med. Virol. 2015, 87, 1973–1980. [Google Scholar] [CrossRef]
  10. Ferlay, J.; Colombet, M.; Soerjomataram, I.; Mathers, C.; Parkin, D.M.; Piñeros, M.; Znaor, A.; Bray, F. Estimating the Global Cancer Incidence and Mortality in 2018: GLOBOCAN Sources and Methods. Int. J. Cancer 2019, 144, 1941–1953. [Google Scholar] [CrossRef] [Green Version]
  11. Li, Y.; Xu, C. Human Papillomavirus-Related Cancers. In Infectious Agents Associated Cancers: Epidemiology and Molecular Biology; Cai, Q., Yuan, Z., Lan, K., Eds.; Advances in Experimental Medicine and Biology; Springer: Singapore, 2017; pp. 23–34. ISBN 978-981-10-5765-6. [Google Scholar]
  12. Burk, R.D.; Harari, A.; Chen, Z. Human Papillomavirus Genome Variants. Virology 2013, 445, 232–243. [Google Scholar] [CrossRef] [Green Version]
  13. Schiffman, M.; Rodriguez, A.C.; Chen, Z.; Wacholder, S.; Herrero, R.; Hildesheim, A.; Desalle, R.; Befano, B.; Yu, K.; Safaeian, M.; et al. A Population-Based Prospective Study of Carcinogenic Human Papillomavirus Variant Lineages, Viral Persistence, and Cervical Neoplasia. Cancer Res. 2010, 70, 3159–3169. [Google Scholar] [CrossRef] [PubMed] [Green Version]
  14. Mirabello, L.; Yeager, M.; Cullen, M.; Boland, J.F.; Chen, Z.; Wentzensen, N.; Zhang, X.; Yu, K.; Yang, Q.; Mitchell, J.; et al. HPV16 Sublineage Associations With Histology-Specific Cancer Risk Using HPV Whole-Genome Sequences in 3200 Women. JNCI J. Natl. Cancer Inst. 2016, 108, djw100. [Google Scholar] [CrossRef] [Green Version]
  15. Moschonas, G.D.; Tsakogiannis, D.; Lamprou, K.A.; Mastora, E.; Dimitriou, T.G.; Kyriakopoulou, Z.; Kottaridi, C.; Karakitsos, P.; Markoulatos, P. Association of Codon 72 Polymorphism of P53 with the Severity of Cervical Dysplasia, E6-T350G and HPV16 Variant Lineages in HPV16-Infected Women. J. Med. Microbiol. 2017, 66, 1358–1365. [Google Scholar] [CrossRef]
  16. Tornesello, M.L.; Losito, S.; Benincasa, G.; Fulciniti, F.; Botti, G.; Greggi, S.; Buonaguro, L.; Buonaguro, F.M. Human Papillomavirus (HPV) Genotypes and HPV16 Variants and Risk of Adenocarcinoma and Squamous Cell Carcinoma of the Cervix. Gynecol. Oncol. 2011, 121, 32–42. [Google Scholar] [CrossRef] [PubMed]
  17. Tsakogiannis, D.; Ruether, I.G.A.; Kyriakopoulou, Z.; Pliaka, V.; Skordas, V.; Gartzonika, C.; Levidiotou-Stefanou, S.; Markoulatos, P. Molecular and Phylogenetic Analysis of the HPV 16 E4 Gene in Cervical Lesions from Women in Greece. Arch. Virol. 2012, 157, 1729–1739. [Google Scholar] [CrossRef]
  18. Zacapala-Gómez, A.E.; Del Moral-Hernández, O.; Villegas-Sepúlveda, N.; Hidalgo-Miranda, A.; Romero-Córdoba, S.L.; Beltrán-Anaya, F.O.; Leyva-Vázquez, M.A.; Alarcón-Romero, L.D.C.; Illades-Aguiar, B. Changes in Global Gene Expression Profiles Induced by HPV 16 E6 Oncoprotein Variants in Cervical Carcinoma C33-A Cells. Virology 2016, 488, 187–195. [Google Scholar] [CrossRef] [Green Version]
  19. Chen, Z.; DeSalle, R.; Schiffman, M.; Herrero, R.; Wood, C.E.; Ruiz, J.C.; Clifford, G.M.; Chan, P.K.S.; Burk, R.D. Niche Adaptation and Viral Transmission of Human Papillomaviruses from Archaic Hominins to Modern Humans. PLoS Pathog. 2018, 14, e1007352. [Google Scholar] [CrossRef] [PubMed]
  20. Willemsen, A.; Bravo, I.G. Origin and Evolution of Papillomavirus (Onco)Genes and Genomes. Phil. Trans. R. Soc. B 2019, 374, 20180303. [Google Scholar] [CrossRef] [Green Version]
  21. Shah, S.D.; Doorbar, J.; Goldstein, R.A. Analysis of Host–Parasite Incongruence in Papillomavirus Evolution Using Importance Sampling. Mol. Biol. Evol. 2010, 27, 1301–1314. [Google Scholar] [CrossRef] [Green Version]
  22. Van Doorslaer, K. Evolution of the Papillomaviridae. Virology 2013, 445, 11–20. [Google Scholar] [CrossRef] [Green Version]
  23. Varsani, A.; van der Walt, E.; Heath, L.; Rybicki, E.P.; Williamson, A.L.; Martin, D.P. Evidence of Ancient Papillomavirus Recombination. J. Gen. Virol. 2006, 87, 2527–2531. [Google Scholar] [CrossRef]
  24. Simon-Loriere, E.; Holmes, E.C. Why Do RNA Viruses Recombine? Nat. Rev. Microbiol. 2011, 9, 617–626. [Google Scholar] [CrossRef]
  25. Borvető, F.; Bravo, I.G.; Willemsen, A. Papillomaviruses Infecting Cetaceans Exhibit Signs of Genome Adaptation Following a Recombination Event. Virus Evol. 2020, 6, veaa038. [Google Scholar] [CrossRef]
  26. Robles-Sikisaka, R.; Rivera, R.; Nollens, H.H.; St Leger, J.; Durden, W.N.; Stolen, M.; Burchell, J.; Wellehan, J.F.X. Evidence of Recombination and Positive Selection in Cetacean Papillomaviruses. Virology 2012, 427, 189–197. [Google Scholar] [CrossRef] [PubMed] [Green Version]
  27. Woolford, L.; Rector, A.; Van Ranst, M.; Ducki, A.; Bennett, M.D.; Nicholls, P.K.; Warren, K.S.; Swan, R.A.; Wilcox, G.E.; O’Hara, A.J. A Novel Virus Detected in Papillomas and Carcinomas of the Endangered Western Barred Bandicoot (Perameles bougainville) Exhibits Genomic Features of Both the Papillomaviridae and Polyomaviridae. J. Virol. 2007, 81, 13280–13290. [Google Scholar] [CrossRef] [Green Version]
  28. Murahwa, A.T.; Tshabalala, M.; Williamson, A.-L. Recombination Between High-Risk Human Papillomaviruses and Non-Human Primate Papillomaviruses: Evidence of Ancient Host Switching Among Alphapapillomaviruses. J. Mol. Evol. 2020, 88, 453–462. [Google Scholar] [CrossRef] [PubMed]
  29. Angulo, M.; Carvajal-Rodríguez, A. Evidence of Recombination within Human Alpha-Papillomavirus. Virol. J. 2007, 4, 33. [Google Scholar] [CrossRef] [PubMed] [Green Version]
  30. Carvajal-Rodríguez, A. Detecting Recombination and Diversifying Selection in Human Alpha-Papillomavirus. Infect. Genet. Evol. 2008, 8, 689–692. [Google Scholar] [CrossRef]
  31. Jiang, M.; Xi, L.F.; Edelstein, Z.R.; Galloway, D.A.; Olsem, G.J.; Lin, W.C.-C.; Kiviat, N.B. Identification of Recombinant Human Papillomavirus Type 16 Variants. Virology 2009, 394, 8–11. [Google Scholar] [CrossRef] [Green Version]
  32. Tsakogiannis, D.; Kyriakopoulou, Z.; Amoutzias, G.; Ruether, I.G.A.; Dimitriou, T.G.; Panotopoulou, E.; Markoulatos, P. Identification of Novel E6-E7 Sequence Variants of Human Papillomavirus 16. Arch. Virol. 2013, 158, 821–828. [Google Scholar] [CrossRef] [PubMed]
  33. Camacho, C.; Coulouris, G.; Avagyan, V.; Ma, N.; Papadopoulos, J.; Bealer, K.; Madden, T.L. BLAST+: Architecture and Applications. BMC Bioinform. 2009, 10, 421. [Google Scholar] [CrossRef] [Green Version]
  34. Edgar, R.C. Search and Clustering Orders of Magnitude Faster than BLAST. Bioinformatics 2010, 26, 2460–2461. [Google Scholar] [CrossRef] [Green Version]
  35. Edgar, R.C. MUSCLE: Multiple Sequence Alignment with High Accuracy and High Throughput. Nucleic Acids Res. 2004, 32, 1792–1797. [Google Scholar] [CrossRef] [Green Version]
  36. Gouy, M.; Guindon, S.; Gascuel, O. SeaView Version 4: A Multiplatform Graphical User Interface for Sequence Alignment and Phylogenetic Tree Building. Mol. Biol. Evol. 2010, 27, 221–224. [Google Scholar] [CrossRef] [PubMed] [Green Version]
  37. Katoh, K. MAFFT: A Novel Method for Rapid Multiple Sequence Alignment Based on Fast Fourier Transform. Nucleic Acids Res. 2002, 30, 3059–3066. [Google Scholar] [CrossRef] [PubMed] [Green Version]
  38. Darriba, D.; Taboada, G.L.; Doallo, R.; Posada, D. JModelTest 2: More Models, New Heuristics and Parallel Computing. Nat. Methods 2012, 9, 772. [Google Scholar] [CrossRef] [PubMed] [Green Version]
  39. Guindon, S.; Gascuel, O. A Simple, Fast, and Accurate Algorithm to Estimate Large Phylogenies by Maximum Likelihood. Syst. Biol. 2003, 52, 696–704. [Google Scholar] [CrossRef] [Green Version]
  40. Chevenet, F.; Brun, C.; Bañuls, A.-L.; Jacq, B.; Christen, R. TreeDyn: Towards Dynamic Graphics and Annotations for Analyses of Trees. BMC Bioinform. 2006, 7, 439. [Google Scholar] [CrossRef] [Green Version]
  41. Tsimpidis, M.; Bachoumis, G.; Mimouli, K.; Kyriakopoulou, Z.; Robertson, D.L.; Markoulatos, P.; Amoutzias, G.D. T-RECs: Rapid and Large-Scale Detection of Recombination Events among Different Evolutionary Lineages of Viral Genomes. BMC Bioinform. 2017, 18, 13. [Google Scholar] [CrossRef] [PubMed]
  42. Martin, D.P.; Murrell, B.; Golden, M.; Khoosal, A.; Muhire, B. RDP4: Detection and Analysis of Recombination Patterns in Virus Genomes. Virus Evol. 2015, 1, vev003. [Google Scholar] [CrossRef] [Green Version]
  43. Kosakovsky Pond, S.L.; Posada, D.; Gravenor, M.B.; Woelk, C.H.; Frost, S.D.W. Automated Phylogenetic Detection of Recombination Using a Genetic Algorithm. Mol. Biol. Evol. 2006, 23, 1891–1901. [Google Scholar] [CrossRef]
  44. Cock, P.J.A.; Antao, T.; Chang, J.T.; Chapman, B.A.; Cox, C.J.; Dalke, A.; Friedberg, I.; Hamelryck, T.; Kauff, F.; Wilczynski, B.; et al. Biopython: Freely Available Python Tools for Computational Molecular Biology and Bioinformatics. Bioinformatics 2009, 25, 1422–1423. [Google Scholar] [CrossRef] [PubMed]
  45. Pritchard, L.; White, J.A.; Birch, P.R.J.; Toth, I.K. GenomeDiagram: A Python Package for the Visualization of Large-Scale Genomic Data. Bioinformatics 2006, 22, 616–617. [Google Scholar] [CrossRef] [Green Version]
  46. Waterhouse, A.M.; Procter, J.B.; Martin, D.M.A.; Clamp, M.; Barton, G.J. Jalview Version 2—A Multiple Sequence Alignment Editor and Analysis Workbench. Bioinformatics 2009, 25, 1189–1191. [Google Scholar] [CrossRef] [Green Version]
  47. Huerta-Cepas, J.; Serra, F.; Bork, P. ETE 3: Reconstruction, Analysis, and Visualization of Phylogenomic Data. Mol. Biol. Evol. 2016, 33, 1635–1638. [Google Scholar] [CrossRef] [PubMed] [Green Version]
  48. Lou, H.; Boland, J.F.; Torres-Gonzalez, E.; Albanez, A.; Zhou, W.; Steinberg, M.K.; Diaw, L.; Mitchell, J.; Roberson, D.; Cullen, M.; et al. The D2 and D3 Sublineages of Human Papilloma Virus 16-Positive Cervical Cancer in Guatemala Differ in Integration Rate and Age of Diagnosis. Cancer Res. 2020, 80, 3803–3809. [Google Scholar] [CrossRef] [PubMed]
  49. Mandal, P.; Bhattacharjee, B.; Sen, S.; Bhattacharya, A.; Roy Chowdhury, R.; Mondal, N.R.; Sengupta, S. Complete Genome Sequences of Eight Human Papillomavirus Type 16 Asian American and European Variant Isolates from Cervical Biopsies and Lesions in Indian Women. Genome Announc. 2016, 4, e00243-16. [Google Scholar] [CrossRef] [PubMed] [Green Version]
  50. Van der Weele, P.; Meijer, C.J.L.M.; King, A.J. Whole-Genome Sequencing and Variant Analysis of Human Papillomavirus 16 Infections. J. Virol. 2017, 91, e00844-17. [Google Scholar] [CrossRef] [PubMed] [Green Version]
  51. Eriksson, A.; Herron, J.R.; Yamada, T.; Wheeler, C.M. Human Papillomavirus Type 16 Variant Lineages Characterized by Nucleotide Sequence Analysis of the E5 Coding Segment and the E2 Hinge Region. J. Gen. Virol. 1999, 80, 595–600. [Google Scholar] [CrossRef] [Green Version]
  52. Plesa, A.; Anton, G.; Iancu, I.V.; Diaconu, C.C.; Huica, I.; Stanescu, A.D.; Socolov, D.; Nistor, E.; Popa, E.; Stoian, M.; et al. Molecular Variants of Human Papilloma Virus 16 E2, E4, E5, E6 and E7 Genes Associated with Cervical Neoplasia in Romanian Patients. Arch. Virol. 2014, 159, 3305–3320. [Google Scholar] [CrossRef]
  53. Swan, D.C.; Rajeevan, M.; Tortolero-Luna, G.; Follen, M.; Tucker, R.A.; Unger, E.R. Human Papillomavirus Type 16 E2 and E6/E7 Variants. Gynecol. Oncol. 2005, 96, 695–700. [Google Scholar] [CrossRef]
  54. Tsakogiannis, D.; Darmis, F.; Gortsilas, P.; Ruether, I.G.A.; Kyriakopoulou, Z.; Dimitriou, T.G.; Amoutzias, G.; Markoulatos, P. Nucleotide Polymorphisms of the Human Papillomavirus 16 E1 Gene. Arch. Virol. 2014, 159, 51–63. [Google Scholar] [CrossRef] [PubMed]
  55. Yamada, T.; Wheeler, C.M.; Halpern, A.L.; Stewart, A.C.; Hildesheim, A.; Jenison, S.A. Human Papillomavirus Type 16 Variant Lineages in United States Populations Characterized by Nucleotide Sequence Analysis of the E6, L2, and L1 Coding Segments. J. Virol. 1995, 69, 7743–7753. [Google Scholar] [CrossRef] [Green Version]
  56. Cuninghame, S.; Jackson, R.; Lees, S.J.; Zehbe, I. Two Common Variants of Human Papillomavirus Type 16 E6 Differentially Deregulate Sugar Metabolism and Hypoxia Signalling in Permissive Human Keratinocytes. J. Gen. Virol. 2017, 98, 2310–2319. [Google Scholar] [CrossRef] [PubMed]
  57. Niccoli, S.; Abraham, S.; Richard, C.; Zehbe, I. The Asian-American E6 Variant Protein of Human Papillomavirus 16 Alone Is Sufficient to Promote Immortalization, Transformation, and Migration of Primary Human Foreskin Keratinocytes. J. Virol. 2012, 86, 12384–12396. [Google Scholar] [CrossRef] [PubMed] [Green Version]
  58. Tsakogiannis, D.; Papadopoulou, A.; Kontostathi, G.; Ruether, I.G.A.; Kyriakopoulou, Z.; Dimitriou, T.G.; Orfanoudakis, G.; Markoulatos, P. Molecular and Evolutionary Analysis of HPV16 E6 and E7 Genes in Greek Women. J. Med. Microbiol. 2013, 62, 1688–1696. [Google Scholar] [CrossRef] [PubMed]
  59. Cornet, I.; Gheit, T.; Iannacone, M.R.; Vignat, J.; Sylla, B.S.; Del Mistro, A.; Franceschi, S.; Tommasino, M.; Clifford, G.M. HPV16 Genetic Variation and the Development of Cervical Cancer Worldwide. Br. J. Cancer 2013, 108, 240–244. [Google Scholar] [CrossRef] [Green Version]
  60. Zehbe, I.; Tachezy, R.; Mytilineos, J.; Voglino, G.; Mikyskova, I.; Delius, H.; Marongiu, A.; Gissmann, L.; Wilander, E.; Tommasino, M. Human Papillomavirus 16 E6 Polymorphisms in Cervical Lesions from Different European Populations and Their Correlation with Human Leukocyte Antigen Class II Haplotypes. Int. J. Cancer 2001, 94, 711–716. [Google Scholar] [CrossRef]
  61. Sichero, L.; Villa, L.L. Epidemiological and Functional Implications of Molecular Variants of Human Papillomavirus. Braz. J. Med. Biol. Res. 2006, 39, 707–717. [Google Scholar] [CrossRef]
  62. Grodzki, M.; Besson, G.; Clavel, C.; Arslan, A.; Franceschi, S.; Birembaut, P.; Tommasino, M.; Zehbe, I. Increased Risk for Cervical Disease Progression of French Women Infected with the Human Papillomavirus Type 16 E6-350G Variant. Cancer Epidemiol. Biomark. Prev. 2006, 15, 820–822. [Google Scholar] [CrossRef] [Green Version]
  63. Fujinaga, Y.; Okazawa, K.; Nishikawa, A.; Yamakawa, Y.; Fukushima, M.; Kato, I.; Fujinaga, K. Sequence Variation of Human Papillomavirus Type 16 E7 in Preinvasive and Invasive Cervical Neoplasias. Virus Genes 1994, 9, 85–92. [Google Scholar] [CrossRef] [PubMed]
  64. Song, Y.S.; Kee, S.H.; Kim, J.W.; Park, N.H.; Kang, S.B.; Chang, W.H.; Lee, H.P. Major Sequence Variants in E7 Gene of Human Papillomavirus Type 16 from Cervical Cancerous and Noncancerous Lesions of Korean Women. Gynecol. Oncol. 1997, 66, 275–281. [Google Scholar] [CrossRef] [PubMed]
  65. Zhao, J.; Zhan, Q.; Guo, J.; Liu, M.; Ruan, Y.; Zhu, T.; Han, L.; Li, F. Phylogeny and Polymorphism in the E6 and E7 of Human Papillomavirus: Alpha-9 (HPV16, 31, 33, 52, 58), Alpha-5 (HPV51), Alpha-6 (HPV53, 66), Alpha-7 (HPV18, 39, 59, 68) and Alpha-10 (HPV6, 44) in Women from Shanghai. Infect. Agents Cancer 2019, 14, 38. [Google Scholar] [CrossRef]
  66. Zhou, Z.; Yang, H.; Yang, L.; Yao, Y.; Dai, S.; Shi, L.; Li, C.; Yang, L.; Yan, Z.; Yao, Y. Human Papillomavirus Type 16 E6 and E7 Gene Variations Associated with Cervical Cancer in a Han Chinese Population. Infect. Genet. Evol. 2019, 73, 13–20. [Google Scholar] [CrossRef]
  67. Eschle, D.; Dürst, M.; ter Meulen, J.; Luande, J.; Eberhardt, H.C.; Pawlita, M.; Gissmann, L. Geographical Dependence of Sequence Variation in the E7 Gene of Human Papillomavirus Type 16. J. Gen. Virol. 1992, 73 Pt 7, 1829–1832. [Google Scholar] [CrossRef] [PubMed]
  68. Nindl, I.; Rindfleisch, K.; Lotz, B.; Schneider, A.; Dürst, M. Uniform Distribution of HPV 16 E6 and E7 Variants in Patients with Normal Histology, Cervical Intra-Epithelial Neoplasia and Cervical Cancer. Int. J. Cancer 1999, 82, 203–207. [Google Scholar] [CrossRef]
  69. Stephen, A.L.; Thompson, C.H.; Tattersall, M.H.; Cossart, Y.E.; Rose, B.R. Analysis of Mutations in the URR and E6/E7 Oncogenes of HPV 16 Cervical Cancer Isolates from Central China. Int. J. Cancer 2000, 86, 695–701. [Google Scholar] [CrossRef]
  70. Dai, S.; Yao, Y.; Yan, Z.; Zhou, Z.; Shi, L.; Wang, X.; Sun, L.; Zhang, R.; Yao, Y. The Association of Human Papillomavirus Type 16 E2 Variations with Cervical Cancer in a Han Chinese Population. Infect. Genet. Evol. 2018, 64, 241–248. [Google Scholar] [CrossRef]
  71. Graham, D.A.; Herrington, C.S. HPV-16 E2 Gene Disruption and Sequence Variation in CIN 3 Lesions and Invasive Squamous Cell Carcinomas of the Cervix: Relation to Numerical Chromosome Abnormalities. Mol. Pathol. 2000, 53, 201–206. [Google Scholar] [CrossRef] [Green Version]
  72. Tsakogiannis, D.; Ruether, I.G.A.; Kyriakopoulou, Z.; Pliaka, V.; Theoharopoulou, A.; Skordas, V.; Panotopoulou, E.; Nepka, C.; Markoulatos, P. Sequence Variation Analysis of the E2 Gene of Human Papilloma Virus Type 16 in Cervical Lesions from Women in Greece. Arch. Virol. 2012, 157, 825–832. [Google Scholar] [CrossRef] [PubMed]
  73. Kahla, S.; Kochbati, L.; Hammami, S.; Chanoufi, M.B.; Maalej, M.; Oueslati, R. Sequence Variation in the E2-Binding Domain of HPV16 and Biological Function Evaluation in Tunisian Cervical Cancers. Biomed. Res. Int. 2014, 2014, 639321. [Google Scholar] [CrossRef] [Green Version]
  74. Clifford, G.M.; Tenet, V.; Georges, D.; Alemany, L.; Pavón, M.A.; Chen, Z.; Yeager, M.; Cullen, M.; Boland, J.F.; Bass, S.; et al. Human Papillomavirus 16 Sub-Lineage Dispersal and Cervical Cancer Risk Worldwide: Whole Viral Genome Sequences from 7116 HPV16-Positive Women. Papillomavirus Res. 2019, 7, 67–74. [Google Scholar] [CrossRef] [PubMed]
  75. Kämmer, C.; Warthorst, U.; Torrez-Martinez, N.; Wheeler, C.M.; Pfister, H. Sequence Analysis of the Long Control Region of Human Papillomavirus Type 16 Variants and Functional Consequences for P97 Promoter Activity. J. Gen. Virol. 2000, 81, 1975–1981. [Google Scholar] [CrossRef] [PubMed] [Green Version]
Figure 1. A workflow of the HPV16-genotyper tool.
Diversity 13 00497 g001
Figure 2. Phylogenetic analyses and identification of potential recombinant sequences. Complete genome alignment was performed with mafft, whereas individual gene alignments were performed with MUSCLE. PhyML trees were generated with GTR + I + G model. Lineage A is coloured light green, lineage B (Af–1) is coloured blue, lineage C (Af–2) is coloured orange, and lineage D is coloured red. The sequence KY549190 appears to be between the two lineages and is assumed “Ungrouped” in the phylogenomic tree. Above the phylogenetic trees, each recombinant sequence is depicted with coloured blocks corresponding to the major and minor parent lineages. Vertical lines above each recombinant sequence represent lineage-specific SNPs. Green lines correspond to A-lineage SNPs, yellow to BCD-clade SNPs, orange to C-lineage SNPs and red to D-lineage SNPs. Recombination crossover sites as detected by GARD are displayed with downward arrows above the genome architecture diagram.
Diversity 13 00497 g002
Figure 3. Lineage/clade-specific SNP distribution of the 45 putative recombinant sequences. Green squares correspond to A lineage SNPs, yellow to the BCD clade SNPs, orange to the C lineage SNPs and red to the D lineage SNPs. Thick blocks denote recombined regions of 3 or more consecutive SNPs of another lineage/clade, also referred as higher confidence recombination events. Dotted blocks denote lower confidence recombination events, that are supported by 2 or less lineage/clade specific SNPs. The SNP positions (on NC_001526) are shown in the second row. The number of times a SNP is found at the boundaries of a recombinant region is shown on the third row. This number provides a rough estimate of recombination frequency within a wider genomic region. The last column shows the percentage of unsequenced nucleotides in each genome. The triangles, star and diamond symbols denote the recombinant sequences identified also in the previous phylogenetic analysis of 180 complete representative genomes.
Diversity 13 00497 g003
Figure 4. Recombination sites οn the HPV16 genome. Higher confidence and lower confidence recombination sites are shown as red and blue vertical lines, respectively, above the genome diagram. The stacked histogram below the genome diagram shows the relative abundance of higher and lower confidence recombination sites per 100 nucleotides. L2 seems to be the most frequently recombined genomic region, followed by E1 and E2. The graphical representation was made using the reference sequence NC_001526 that is depicted as a linear chromosome (although it is actually circular) for visualization purposes.
Diversity 13 00497 g004
Figure 5. The HPV16 genotyper tool has three GUI components (AC). The first component is the main results page. A1 is the status bar, where the user obtains information about the currently displayed page. A2 are the total pages available (Home and Results). The first frame of the results page contains A3, a list of all the analyzed sequences. By double clicking the name of a sequence, the page updates with the corresponding information. By checking the button A4, the list displays only the putative recombinants identified in the analysis. The next frame contains information about 9 SNPs associated with increased risk of cancer (A5) and clicking on any of the identified SNPs displays information (A6) about that specific SNP. A7 shows the lineage-specific SNPs identified in the selected sequence and this information is summarized in graph A8. BLAST results for each gene are shown in table A9 and summarized in graph A10. In the frame A11, the user has the option to view the phylogenetic tree for each gene. In case the selected sequence does not contain the selected gene, an error message will be displayed. The A12 frame gives the option to create the similarity plot of the selected sequence. A13 saves A8 and A10 on the output directory. Panel B shows an example interactive tree visualization, where B1 is the gene label, B2 shows the different reference sequences which are colored based on their lineage and B3 shows the selected sequence which will always be colored gray. Panel C shows an example similarity plot window. C1 is the plot description, C2 is the similarity plot, C3 is the plot legend and C4 is a button that can save the page in JPG format.
Diversity 13 00497 g005
Table 1. Lineage-specific SNPs. The first column shows the genomic position of the specific SNP mapped to the A1 Reference genome NC_001526 and the corresponding reference nucleotide. The second column shows the genomic region which corresponds to this position. The third and fourth columns show the SNP position in the corresponding NC_001526 gene and protein sequences, respectively. The fifth to twelfth columns show the nucleotide of each group and the percentage it is found in the sequences. The last column shows the amino acid change effect of each mutation, with the first letter being the variant amino acid. Cell colour indicates the non-synonymous mutations and mutations that are not placed inside an ORF. Lineages A, B, C and D non-synonymous SNPs are denoted with green, blue, orange and red, respectively. Novel lineage-specific synonymous mutations identified in this study are shown in bold/underlined.
NC 001526 Genomic PositionGenomic RegionGene PositionProtein PositionA Group ntA Group nt%B Group ntB Group nt%C Group ntC Group nt%D Group ntD Group nt%AA
286 (T)E620468T100A100A100A100A
289 (A)E620769A100G100G100G100V
335 (C)E625385C98T100T100T100H/Y
789 (T)E722876T100C100C100C100I
795 (T)E723478T99G100G100G100T
1096 (C)E123278C100G100G100G100Q/E
1366 (T)E1501168T99A100A100A97C/S
1377 (C)E1512171C99T100T100T97Y
1486 (T)E1621208T100C100C100C100L
1624 (C)E1759254C99T100T100T100L
1668 (A)E1803268A100A100A100G100A
2041 (C)E11176393C100T100T100T100L
2220 (G)E11355452G100C100C97C100E/D
2355 (T)E11490497T100T100C100T100S
2586 (T)E11721574T100C100C100C97S
2631 (T)E11766589T100A100A100A100P
2860 (C)E210535C100A100A100A100H/Q
3224 (T)E2469157T99T100T100A100I/L
3362 (A)E2607203A100G100G97G100N/D
3362 (A)E462A100G100G97G100A
3377 (C)E2622208C99G100G100G100P/A
3377 (C)E4217C99G100G100G100L
3431 (G)E2676226G99G100A97G97T/A
3431 (G)E47525G99G100A97G97K
3566 (T)E2811271T98G100G100G100F/V
3566 (T)E421070T98G100G100G100H/Q
3694 (T)E2939313T99A100A100A100T
3778 (G)E21023341G100T100T100T100W/C
3858 (T)E593T100C100C97C97N
3868 (G)E5197G100A100G97G100T/A
4042 (A)E519365G77T100G97G100L/V
4145 (C)-00C99T100C100C100-
4149 (A)-00A99A100C100A100-
4308 (G)L27224G99A100G100G100Q
4428 (G)L219264G100A100T100T97S
4452 (T)L221672T100T100T100C100Y
4545 (T)L2309103T100T100G100T100P
4600 (T)L2364122T100C100C100C100S/P
4644 (T)L2408136T99A53A73A69T
4854 (C)L2618206C100C100T100C100N
4911 (A)L2675225A100T100A100A100L
4950 (A)L2714238A100A100A100G100V
4969 (A)L2733245A100A100A100G100A/T
5034 (A)L2798266A100A100A100T100F/L
5142 (G)L2906302G100A100A100A97R
5259 (A)L21023341A100A100G100A100L
5286 (T)L21050350T100T100T100A97T
5310 (T)L21074358T100C100C100C89P
5379 (G)L21143381G99A100A100A97P
5386 (T)L21150384T99T100T100G97A/S
5389 (G)L21153385G100A100A100A97V/I
5403 (T)L21167389T99C100C100C97S
5495 (T)L21259420T100C100C100C100I/T
5506 (G)L21270424G100A100A100A100A/T
5564 (C)L21328443C100G100G100G100A/G
5659 (T)L1217T100C100T100T100S
5864 (C)L122676C100T100T100T100H/Y
5911 (T)L127391T100C100C100C100Y
6165 (C)L1527176C100A100A100A100T/N
6247 (T)L1609203T100C100C100C97T
6482 (T)L1844282T100T100C100T100P/S
6559 (C)L1921307C97T100T100T100F
6568 (T)L1930310T100A100T100T97P
6721 (G)L11083361G99A100A100A100K
6854 (C)L11216406C98T100T100T100L
6970 (C)L11335445C100T100T100T100T
6994 (G)L11359453G99A100A100A100E
7489 (G)LCR00G100A100A100A97-
7764 (C)LCR00C100T100T100T97-
7786 (C)LCR00C100T100T100T97-
7837 (A)LCR00A100A100C100A100-
Publisher’s Note: MDPI stays neutral with regard to jurisdictional claims in published maps and institutional affiliations.

