Eukaryotic Communities in Bromeliad Phytotelmata: How Do They Respond to Altitudinal Differences?


Abstract
1. Introduction
2. Materials and Methods
3. Results
4. Discussion
5. Conclusions
Supplementary Materials
Author Contributions
Funding
Acknowledgments
Conflicts of Interest
References
- Jocque, M.; Field, R. Aquatic invertebrate communities in tank bromeliads: How well do classic ecological patterns apply? Hydrobiologia 2014, 730, 153–166. [Google Scholar] [CrossRef]
- Martinelli, G.; Vieira, C.M.; Gonzalez, M.; Leitman, P.; Piratininga, A.; Da Costa, A.F.; Forzza, R.C. Bromeliaceae da mata atlântica brasileira: Lista de espécies, distribuição e conservação. Rodriguésia 2008, 59, 209–258. [Google Scholar] [CrossRef]
- Kitching, R.L. Food Webs and Container. In The Natural History and Ecology of Phytotelmata; Cambridge University Press: Cambridge, UK, 2000; 448p. [Google Scholar]
- Goffredi, S.K.; Jang, G.E.; Haroon, M.F. Transcriptomics in the tropics: Total RNA-based profiling of Costa Rican bromeliad-associated communities. Comput. Struct. Biotechnol. J. 2014, 13, 18–23. [Google Scholar] [CrossRef] [PubMed]
- Tews, J.; Brose, U.; Grimm, V.; Tielborger, K.; Wichmann, M.C.; Schwager, M.; Jeltsch, F. Animal species diversity driven by habitat heterogeneity/diversity: The importance of key stone structures. J. Biogeogr. 2004, 31, 79–92. [Google Scholar] [CrossRef]
- Nadkarni, N.M. An ecological overview and checklist of vascular epiphytes in the Monteverde cloud forest reserve, Costa Rica. Brenesia 1986, 24, 55–632. [Google Scholar]
- Nadkarni, N.M.; Matelson, T.J. Bird use of epiphyte resources in neotropical trees. Condor 1989, 91, 891. [Google Scholar] [CrossRef]
- Foissner, W.; Struder-Kypke, M.; Van Der Staay, G.W.M.; Moon-Van Der Staay, S.Y.; Hackstein, J.H.P. Endemic ciliates (Protozoa, Ciliophora) from brazilian tank bromeliads (Bromeliaceae): A combined morphological, molecular and ecological study. Eur. J. Protistol. 2003, 39, 365–372. [Google Scholar] [CrossRef]
- Bacigalupo, A.; A Segura, J.; García, A.; Hidalgo, J.; Galuppo, S.; Cattan, P.E. First finding of Chagas disease vectors associated with wild bushes in the Metropolitan Region of Chile. Rev. Médica Chile 2006, 134, 1230–1236. [Google Scholar]
- Martinson, G.O.; Werner, F.A.; Scherber, C.; Conrad, R.; Corre, M.D.; Flessa, H.; Wolf, K.; Klose, M.; Gradstein, S.R.; Veldkamp, E. Methane emissions from tank bromeliads in neotropical forests. Nat. Geosci. 2010, 3, 766–769. [Google Scholar] [CrossRef]
- Whittaker, R.H.; Niering, W.A. Vegetation of the Santa Catarina Mountains, Arizona. V. biomass, production, and diversity along the elevation gradient. Ecology 2015, 56, 771–790. [Google Scholar] [CrossRef]
- Maguire, B. Phytotelmata: Biota and community structure determination in plant-held waters. Annu. Rev. Ecol. Syst. 1971, 2, 439–464. [Google Scholar] [CrossRef]
- Frank, J.H.; Lounibos, L.P. Phytotelmata: Swamps or islands? Fla. Èntomol. 1987, 70, 14. [Google Scholar] [CrossRef]
- Richardson, B.A. The bromeliad microcosm and the assess-ment of faunal diversity in a neotropical forest. Biotropica 1999, 31, 321–336. [Google Scholar] [CrossRef]
- Benzing, D.H. Bromeliaceae: Profile of an Adaptative Radiation; Cambridge University Press: Cambridge, UK, 2000; 675p. [Google Scholar]
- Armbruster, P.; Hutchinson, R.A.; Cotgreave, P. Factors influencing community structure in a South American tank bromeliad fauna. Oikos 2002, 96, 225–234. [Google Scholar] [CrossRef]
- Jabiol, J.; Corbara, B.; Dejean, A.; Céréghino, R. Structure of aquatic insect communities in tank-bromeliads in an East-Amazonian rainforest in French Guiana. For. Ecol. Manag. 2009, 257, 351–360. [Google Scholar] [CrossRef]
- Brouard, C.; D’Alche-Buc, F.; Szafranski, M. Semi-supervised penalized output kernel regression for link prediction. In Proceedings of the 28th International Conference on Machine Learning (ICML), Bellevue, WA, USA, 28 June–2 July 2011; pp. 593–600. [Google Scholar]
- Kageyama, P.Y.; Gandara, F.B. Restauração e conservação de ecossistemas tropicais. In Métodos de Estudos em Biologia da Conservação e Manejo de Vida Silvestre, 2nd ed.; Cullen Júnior, L., Rudan, R., Valladares-Padua, C., Eds.; UFPR: Paraná, Brazil, 2000; pp. 383–394. [Google Scholar]
- Brown, J.H. Species diversity. Analytical biogeography. In An Integrated Approach to the Study of Animal and Plant Distribution; Myers, A.A., Giller, P.S., Eds.; Springer: Dordrecht, Germany, 1988; pp. 57–89. [Google Scholar]
- Stevens, G.C. The elevational gradient in altitudinal range: An extension of rapoport’s latitudinal rule to altitude. Am. Nat. 1992, 140, 893–911. [Google Scholar] [CrossRef]
- Körner, C. The use of ‘altitude’ in ecological research. Trends Ecol. Evol. 2007, 22, 569–574. [Google Scholar] [CrossRef]
- McCain, C.M. Global analysis of bird elevational diversity. Glob. Ecol. Biogeogr. 2009, 18, 346–360. [Google Scholar] [CrossRef]
- McCain, C.M. Global analysis of reptile elevational diversity. Glob. Ecol. Biogeogr. 2010, 541–553. [Google Scholar] [CrossRef]
- Rahbek, C. The elevational gradient of species richness: A uniform pattern? Ecography 1995, 18, 200–205. [Google Scholar] [CrossRef]
- Richardson, M.J.; Richardson, B.A.; Srivastava, D.S. The Stability of invertebrate communities in bromeliad phytotelmata in a rain forest subject to hurricanes. Biotropica 2015, 47, 201–207. [Google Scholar] [CrossRef]
- Busse, A.; Antiqueira, P.A.P.; Neutzling, A.S.; Wolf, A.M.; Romero, G.Q.; Petermann, J. Different in the dark: The effect of habitat characteristics on community composition and beta diversity in bromeliad microfauna. PLoS ONE 2018, 13, e0191426. [Google Scholar] [CrossRef] [PubMed]
- Gerhardt, C.H.; Troian, L.C.; Guterrez, L.M.; Magalhães, R.G. Diagnóstico Socioeconômico e Ambiental do Município de Maquiné—RS: Perspectivas para um Desenvolvimento Rural Sustentável; Relatório de Pesquisa, ANAMA—PGDR/UFRGS—Prefeitura Municipal de Maquiné: Porto Alegre, Brazil, 2000; 56p. [Google Scholar]
- Cabrera, A.L.; Willink, A. Biogeografia de América Latina. Monografia 13, Série de Biología; Organización de los Estados Americanos (OEA): Washington, DC, USA, 1973; p. 120. [Google Scholar]
- Olson, D.M.; Dinerstein, E.; Wikramanayake, E.D.; Burgess, N.D.; Powell, G.V.N.; Umderwood, E.C. Terrestrial ecoregions of the world: A new map of life on Earth. Bioscience 2001, 51, 933–939. [Google Scholar] [CrossRef]
- Patterson, D.J.; Hedley, S. Free-living Freshwater Protozoa—A Colour Guide; ASM Press: Boca Ratón, FL, USA, 2003; p. 223. [Google Scholar]
- Pinho, L.C. Diptera. In Guia on-line: Identificação de larvas de Insetos Aquáticos do Estado de São Paulo; Froehlich, C.G., Ed.; USP: São Paulo, Brazil, 2008; Available online: http://sites.ffclrp.usp.br/aguadoce/guiaonline (accessed on 5 April 2017).
- Brinkhurst, R.O.; Wetzel, M.J. Aquatic Oligochaeta of the world: Supplement. A catalogue of new freshwater species, descriptions, and revisions. Can. Tech. Report Hydrogr. Ocean Sci. 1984, 44, 1–101. [Google Scholar]
- Bretz, F.; Hothorn, T.; Westfall, P. Multiple Comparisons Using R; CRC Press: Boca Raton, FL, USA, 2010; 193p. [Google Scholar]
- Anderson, M.J. A new method for non-parametric multivariate analysis of variance. Austral. Ecol. 2001, 26, 32–46. [Google Scholar]
- Oksanen, J.; Kindt, R.; Legendre, P.; O’Hara, B.; Simpson, G.L.; Solymos, P.; Stevens, M.H.H.; Wagner, H. Vegan: Community Ecology Package, R package version: 1.15-4; R Project Institute for Statistics and Mathematics, WU Wirtschaftsuniversität Wien: Wien, Austria; Available online: http://CRAN.R-project.org/package=vegan (accessed on 15 August 2011).
- Hervé, M. RVAideMemoire: Testing and Plotting Procedures for Biostatistics. R package version 0.9-75. 2020. Available online: https://CRAN.R-project.org/package=RVAideMemoire (accessed on 25 July 2020).
- Legendre, P.; Legendre, L. Numerical Ecology, 3rd ed.; Elsevier: Amsterdam, The Netherlands, 2012; 618p. [Google Scholar]
- Beck, M.W. Ggord: Ordination Plots with Ggplot2. R Package Version 1.1.4. 2019. Available online: https://rdrr.io/github/fawda123/ggord/ (accessed on 26 July 2020).
- De Cáceres, M.; Legendre, P. Associations between species and groups of sites: Indices and statistical inference. Ecology 2009, 90, 3566–3574. [Google Scholar] [CrossRef]
- Dufrêne, M.; Legendre, P. Species assemblages and indicator species: The need for a flexible asymetrical approach. Ecol. Monogr. 1997, 67, 345–366. [Google Scholar] [CrossRef]
- Baselga, A. Partitioning the turnover and nestedness components of beta diversity. Glob. Ecol. Biogeogr. 2009, 19, 134–143. [Google Scholar] [CrossRef]
- Baselga, A. Partitioning abundance-based multiple-site dissimilarity into components: Balanced variation in abundance and abundance gradients. Methods Ecol. Evol. 2016, 8, 799–808. [Google Scholar] [CrossRef]
- Hill, M.O. Diversity and evenness: A unifying notation and its consequences. Ecology 1973, 54, 427–432. [Google Scholar] [CrossRef]
- Chao, A.; Chiu, C.-H.; Jost, L. Unifying species diversity, phylogenetic diversity, functional diversity, and related similarity and differentiation measures through hill numbers. Annu. Rev. Ecol. Evol. Syst. 2014, 45, 297–324. [Google Scholar] [CrossRef]
- Rahbek, C. The relationship among area, elevation, and regional species richness in neotropical birds. Am. Nat. 1997, 149, 875–902. [Google Scholar] [CrossRef] [PubMed]
- Richardson, B.A.; Richardson, M.J.; Scatena, F.N.; McDowell, W.H. Effects of nutrient availability and other elevational changes on bromeliad populations and their invertebrate communities in a humid tropical forest in Puerto Rico. J. Trop. Ecol. 2000, 16, 167–188. [Google Scholar] [CrossRef]
- Emsley, J. Nature’s Building Blocks: An A-Z Guide to the Elements; Oxford University Press: Oxford, UK, 2001; p. 538. [Google Scholar]
- Kitching, R.L. Foodwebs Inphytotelmata: “Bottom-up” and “top-down” explanations for community structure. Annu. Rev. Èntomol. 2001, 46, 729–760. [Google Scholar] [CrossRef] [PubMed]
- Lounibos, L.P.; Frank, J.H. Insects and allies associated with bromeliads: A review. Terr. Arthropod Rev. 2009, 1, 125–153. [Google Scholar] [CrossRef]
- Cotgreave, P.; Hill, M.J.; Middleton, D.A.J. The relationship between body size and population size in bromeliad tank faunas. Biol. J. Linn. Soc. 1993, 49, 367–380. [Google Scholar] [CrossRef]
- Liria, J. Fauna fitotelmata en las bromelias Aechmea fendleri André y Hohenbergia stellata Schult del Parque Nacional San Esteban, Venezuela. Rev. Per. Biol. 2007, 14, 33–38. [Google Scholar]
- Pereira, D.L.V.; Neiss, U.G.; Ferreira-Keppler, R. Distribuição de Paravelia recens (Drake & Harris, 1935) (Hemíptera, Heteroptera, Veliidae) em Guzmania brasiliensis Ule, 1907 (Bromeliaceae) na Reserva Florestal Adolpho Ducke, Amazonas, Brasil. Acta Amaz. 2007, 37, 147–150. [Google Scholar] [CrossRef]
- Lopez, L.C.S.; Iglesias Rios, R. Phytotelmata community distribution in tanks of shaded and sun-exposed terrestrial bromeliads from restinga vegetation. Selbyana 2001, 22, 219–224. [Google Scholar]
- Montero, G.; Feruglio, C.; Barberis, I.M. The Phytotelmata and foliage macrofauna assemblages of a bromeliad species in different habitats and seasons. Insect Conserv. Divers. 2010, 3, 92–102. [Google Scholar] [CrossRef]
- Becker, V.O.; Camargo, A.J.A. Frogs and snakes as phoretic dispersal agents of bromeliad ostracods (Limnocytheridae: Hpjdum) and annelids (Naididae: Dero). Biotropica 1999, 31, 705–708. [Google Scholar]
- Cabral, A.F.; Dias, R.J.P.; Utz, L.R.P.; Alves, R.G.; Agosto, M.D. Spatial and temporal occurrence of Rhabdostyla cf. chironomi Kahl, 1933 (Ciliophora, Peritrichia) as an epibiont on chironomid larvae in a lotic system in the neotropics. Hydrobiologia 2010, 644, 351–359. [Google Scholar] [CrossRef]
- Clegg, J.S. Cryptobiosis—A peculiar state of biological organization. Comp. Biochem. Physiol. Part. B Biochem. Mol. Boil. 2001, 128, 613–624. [Google Scholar] [CrossRef]
- Green, A.J.; Figuerola, J.; Green, A. Recent advances in the study of long-distance dispersal of aquatic invertebrates via birds. Divers. Distrib. 2005, 11, 149–156. [Google Scholar] [CrossRef]
- Watts, C.H.S. Revision of the Genus Macrohelodes (Scirtidae: Coleoptera; Insecta). Trans. R. Soc. South. Aust. 2010, 134, 19–52. [Google Scholar] [CrossRef]
- Ruta, R. Anticyphon gen. nov., a new genus of Scirtidae (Coleoptera: Scirtoidea) inhabiting high altitude Andean cloud forests and páramo formation. Zootaxa 2016, 4175, 301–318. [Google Scholar] [CrossRef]
- Kwon, T.-S.; Kim, S.-S.; Chun, J.H. Pattern of ant diversity in Korea: An empirical test of Rapoport’s altitudinal rule. J. Asia-Pacific Èntomol. 2014, 17, 161–167. [Google Scholar] [CrossRef]
- Herzog, S.K.; Hamel-Leigue, A.C.; Larsen, T.H.; Mann, D.J.; Soria-Auza, R.W.; Gill, B.D.; Edmonds, W.D.; Spector, S. Elevational distribution and conservation biogeography of phanaeine dung beetles (Coleoptera: Scarabaeinae) in Bolivia. PLoS ONE 2013, 8, e64963. [Google Scholar] [CrossRef]
- Begon, M.; Harper, J.L.; Townsend, C.R. Ecology: Individuals, Populations, and Communities, 3rd ed.; Blackwell Science: Cambridge, MA, USA, 1996; p. 1068. [Google Scholar]
- McCain, C.M. The mid-domain effect applied to elevational gradients: Species richness of small mammals in Costa Rica. J. Biogeogr. 2003, 31, 19–31. [Google Scholar] [CrossRef]
- Chaladze, G.; Otto, S.; Tramp, S. A spider diversity model for the Caucasus Ecoregio. J. Insect Cons 2014, 18, 407–416. [Google Scholar] [CrossRef]
- Chaladze, G. Climate-based model of spatial pattern of the species richness of ants in Georgia. J. Insect Conserv. 2012, 16, 791–800. [Google Scholar] [CrossRef]
- Grytnes, J.-A. Species-richness patterns of vascular plants along seven altitudinal transects in Norway. Ecography 2003, 26, 291–300. [Google Scholar] [CrossRef]
- Bryant, J.A.; Lamanna, C.; Morlon, H.; Kerkhoff, A.J.; Enquist, B.J.; Green, J.L. Microbes on mountainsides: Contrasting elevational patterns of bacterial and plant diversity. Proc. Natl. Acad. Sci. USA 2008, 105, 11505–11511. [Google Scholar] [CrossRef] [PubMed]
- Wang, X.; Li, H.; Bezemer, T.M.; Hao, Z. Drivers of bacterial beta diversity in two temperate forests. Ecol. Res. 2015, 31, 57–64. [Google Scholar] [CrossRef]
- Colwell, R.; Lees, D.C. The mid-domain effect: Geometric constraints on the geography of species richness. Trends Ecol. Evol. 2000, 15, 70–76. [Google Scholar] [CrossRef]


| Maquiné and Garapiá (20 and 400 m) | RPPN Pró-Mata (910 and 915 m) | |||||
|---|---|---|---|---|---|---|
| Month | T °C (min) | T °C (max) | Precipitation (mm) | T °C (min) | T °C (max) | Precipitation (mm) |
| January | 19.2 | 27.6 | 142.4 | 17.0 | 27.9 | 154.2 |
| February | 19.1 | 27.6 | 158.1 | 17.0 | 27.6 | 159.7 |
| March | 18.7 | 27.3 | 139.6 | 16.3 | 26.8 | 127.0 |
| April | 15.8 | 24.7 | 109.8 | 13.4 | 23.9 | 119.7 |
| May | 12.4 | 21.3 | 115.1 | 10.1 | 20.0 | 123.6 |
| June | 10.7 | 19.5 | 116.7 | 8.8 | 18.7 | 132.9 |
| July | 9.3 | 18.6 | 122.7 | 7.6 | 18.2 | 160.4 |
| August | 10.4 | 19.7 | 139.5 | 8.7 | 20.2 | 140.5 |
| September | 12.0 | 20.3 | 159 | 9.9 | 20.7 | 170.1 |
| October | 14.6 | 22.8 | 134.3 | 12.4 | 23.3 | 155.3 |
| November | 16.0 | 24.7 | 118.5 | 14.0 | 25.4 | 131.4 |
| December | 17.7 | 26.7 | 92.4 | 15.6 | 27.2 | 124.2 |
| Richness Descriptor | R2 | F-Statistic | p-Value | Pairwise Differences (p < 0.05) |
|---|---|---|---|---|
| Community total richness | ||||
| Complete model | 0.4702 | 5.5860 | 0.0008 | |
| Season | 5.6376 | 0.0043 | spr-aut/sum-aut/win-spr | |
| Altitude | 5.5347 | 0.0047 | 20-400–/400-910–/400-915 | |
| Rotifer richness | ||||
| Complete model | 0.3718 | 4.0590 | 0.0056 | |
| Season | 3.1125 | 0.0443 | spr-win | |
| Altitude | 5.0045 | 0.0074 | 20-910 | |
| Arthropod richness | ||||
| Complete model | 0.2683 | 2.8950 | 0.0277 | |
| Season | 2.5923 | 0.0751 | - | |
| Altitude | 3.1977 | 0.0407 | 400-910/400-915 | |
| Ciliate richness | ||||
| Complete model | 0.2046 | 2.3290 | 0.0634 | |
| Season | - | - | - | |
| Altitude | - | - | - |
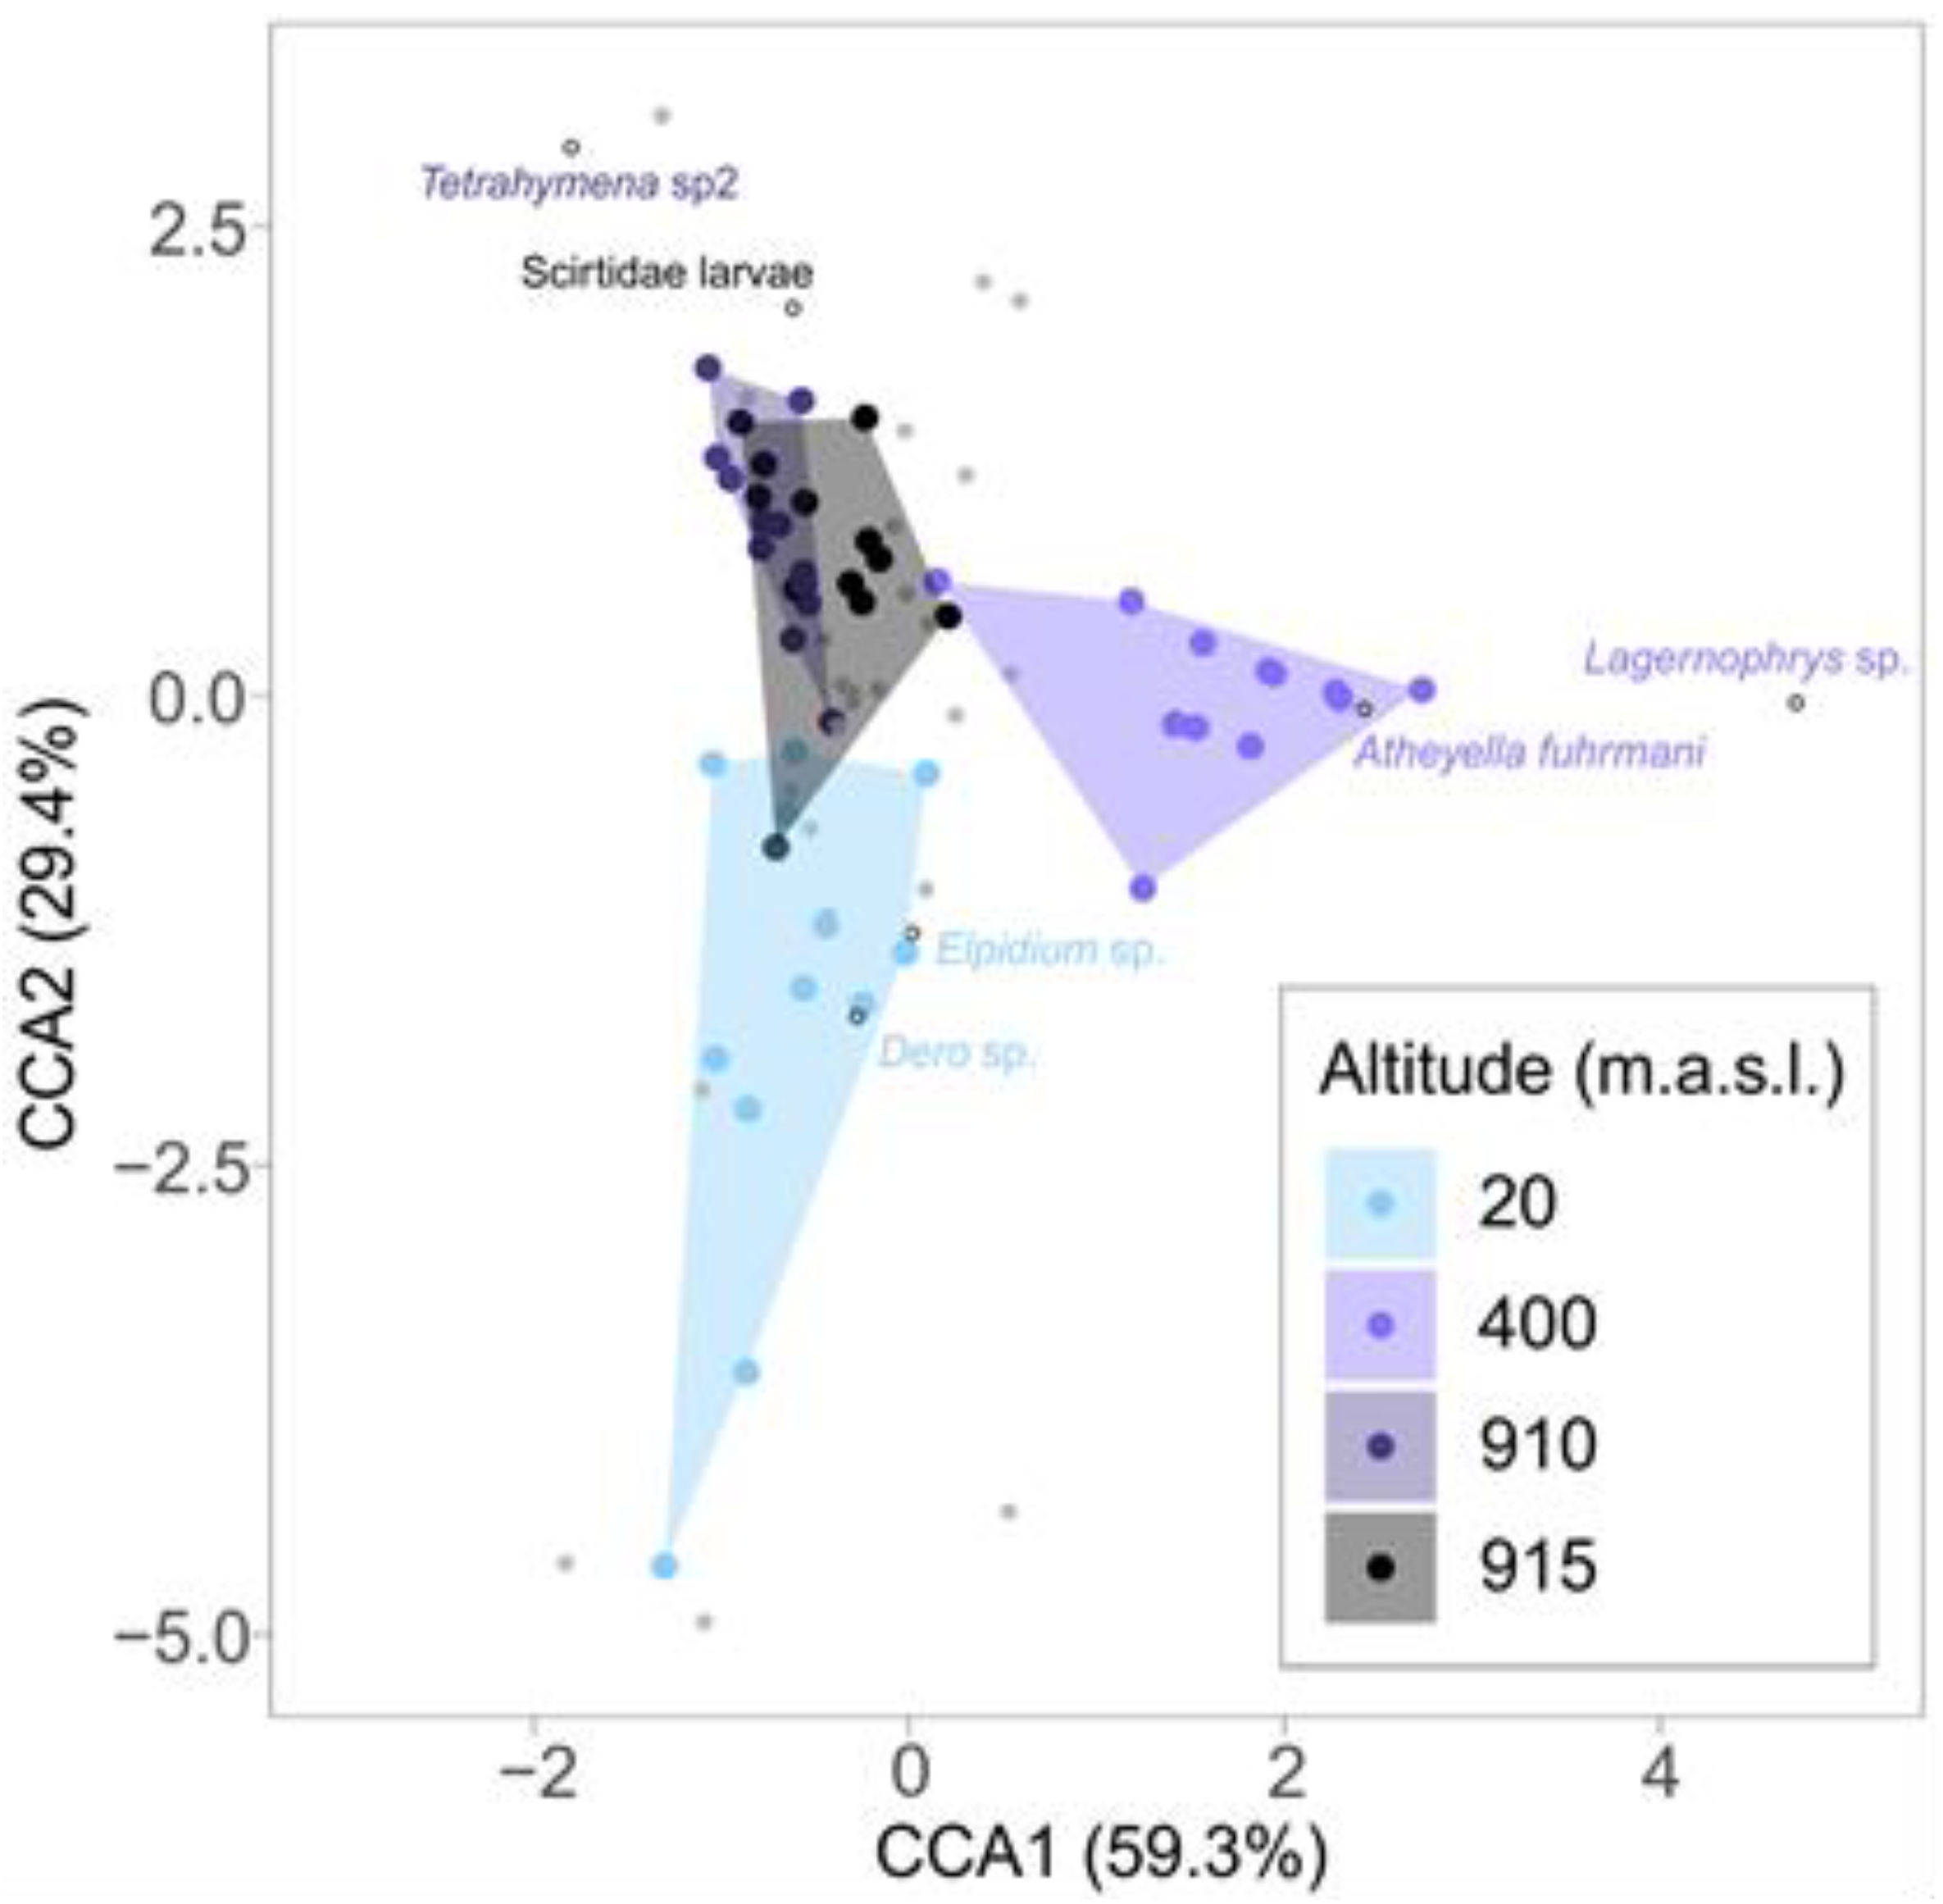
| Species | Altitude | IndVal | p-Value |
|---|---|---|---|
| Dero sp. (Oligochaeta) | 20 m | 0.596 | 0.039 |
| Elphidium sp. (Ostracod, Crustacea) | 20 m | 0.607 | 0.020 |
| Atheyella fuhrmani (Copepod, Crustacea) | 400 m | 0.787 | 0.020 |
| Lagernophrys sp. (Peritrichia, Ciliophora) | 400 m | 0.957 | 0.020 |
| Tetrahymenidae (Unidentified ciliate) | 910 m | 0.706 | 0.020 |
| Scirtidae larvae (Coleoptera) | 915 m | 0.571 | 0.020 |
| Altitude (m.a.s.l.) | |||||
|---|---|---|---|---|---|
| 20 | 400 | 910 | 915 | ||
| Species diversity | Mean alpha | 3.81 ± 0.76 | 4.56 ± 1.65 | 3.33 ± 1.17 | 3.64 ± 1.67 |
| Beta | 0.24 | 0.17 | 0.15 | 0.13 | |
| Gamma | 7.67 | 5.48 | 4.00 | 4.29 | |
| Beta-diversity components | Turnover | 0.208 | 0.137 | 0.068 | 0.082 |
| Turnover (%) | 86.8 | 80.8 | 46.8 | 60.6 | |
| Nestedness | 0.032 | 0.033 | 0.078 | 0.053 | |
| Nestedness (%) | 13.2 | 19.2 | 53.2 | 39.4 | |
© 2020 by the authors. Licensee MDPI, Basel, Switzerland. This article is an open access article distributed under the terms and conditions of the Creative Commons Attribution (CC BY) license (http://creativecommons.org/licenses/by/4.0/).
Share and Cite
Malfatti, E.; Ferreira, P.M.A.; Utz, L.R.P. Eukaryotic Communities in Bromeliad Phytotelmata: How Do They Respond to Altitudinal Differences? Diversity 2020, 12, 326. https://doi.org/10.3390/d12090326
Malfatti E, Ferreira PMA, Utz LRP. Eukaryotic Communities in Bromeliad Phytotelmata: How Do They Respond to Altitudinal Differences? Diversity. 2020; 12(9):326. https://doi.org/10.3390/d12090326
Chicago/Turabian StyleMalfatti, Eduardo, Pedro M.A. Ferreira, and Laura R. P. Utz. 2020. "Eukaryotic Communities in Bromeliad Phytotelmata: How Do They Respond to Altitudinal Differences?" Diversity 12, no. 9: 326. https://doi.org/10.3390/d12090326
APA StyleMalfatti, E., Ferreira, P. M. A., & Utz, L. R. P. (2020). Eukaryotic Communities in Bromeliad Phytotelmata: How Do They Respond to Altitudinal Differences? Diversity, 12(9), 326. https://doi.org/10.3390/d12090326