Article

Planktonic Microcrustacean Community Structure Varies with Trophic Status and Environmental Variables in Tropical Shallow Lakes in Malaysia

by
Wahidah Ahmad Dini Umi
1,
Fatimah Md Yusoff
2,3,*,
Ahmad Zaharin Aris
3,4,
Zati Sharip
5 and
Artem Y. Sinev
6,7
1
Laboratory of Marine Biotechnology, Institute of Bioscience, Universiti Putra Malaysia, UPM, Serdang, Selangor 43400, Malaysia
2
Department of Aquaculture, Faculty of Agriculture, Universiti Putra Malaysia, UPM, Serdang, Selangor 43400, Malaysia
3
International Institute of Aquaculture and Aquatic Sciences (I-AQUAS), Universiti Putra Malaysia, Port Dickson, Negeri Sembilan 71050, Malaysia
4
Department of Environment, Faculty of Forestry and Environment, Universiti Putra Malaysia, UPM, Serdang, Selangor 43400, Malaysia
5
Lake Research Unit, Water Quality and Environment Research Centre, National Hydraulic Research Institute of Malaysia (NAHRIM), Seri Kembangan, Selangor 43300, Malaysia
6
Department of Invertebrate Zoology, Biological Faculty, Lomonosov Moscow State University, Leninskie Gory, 119991 Moscow, Russia
7
Kazan Federal University, Kremlevskaya 18, 420008 Kazan, Russia
*
Author to whom correspondence should be addressed.
Diversity 2020, 12(9), 322; https://doi.org/10.3390/d12090322
Submission received: 5 July 2020 / Revised: 5 August 2020 / Accepted: 21 August 2020 / Published: 24 August 2020

Abstract

:
A study was conducted to evaluate planktonic microcrustacean species composition, abundance, and diversity in lakes with different trophic status and to determine the relationship between microcrustacean community structure and lake environmental conditions. This study hypothesized that there are correlations between eutrophication levels and microcrustacean community structures in a lake. Three shallow lakes of different trophic status (Sembrong, Putrajaya and Subang lakes) were selected for this study. Two-Way Analysis of similarities (ANOSIM) revealed differences in microcrustacean diversity and density amongst lakes, where the hypereutrophic condition in Sembrong lake resulted in the lowest diversity but the highest density of microcrustaceans. Similarity percentage (SIMPER) analysis identified the discriminator species among lakes where the domination of small-sized microcrustaceans was observed in lakes with high levels of eutrophication; the hypereutrophic Sembrong lake (Ceriodaphnia cornuta, 74.0%); the meso-eutrophic Putrajaya lake (Bosmina longirostris, 46.9%; C. cornuta, 19.4%). Chlorophyll a, total phosphorus and water transparency showed significant roles in the distribution of microcrustaceans. The canonical correspondence analysis (CCA) scores indicated that small-sized C. cornuta and B. longirostris were related to the eutrophic conditions of lakes. This study elucidated that the lake trophic status could be one of the main factors contributing to the community restructuring of microcrustaceans in tropical lakes.

Graphical Abstract

1. Introduction

Freshwater microcrustacean communities, consisting mainly of cladocerans and copepods, play significant roles in nutrient recycling and energy transfer to higher trophic levels in aquatic food webs [1,2]. They also form a major food source for many invertebrates and planktivorous fish [3]. Microcrustacean species in lakes adapt to various environmental changes to maintain their population growth, and form a unique community characterized by their preferences for biotic and abiotic factors, which enable them to be a potential bioindicator species [4,5]. Environmental parameters are important elements that influence the occurrence and distribution of microcrustaceans in aquatic ecosystem as optimum conditions are required by microcrustaceans for their survival [6]. Water temperature, pH, dissolved oxygen (DO), turbidity, water transparency and nutrient concentrations are responsible for microcrustacean biological processes such as metabolic rate, developmental time and healthy growth [7,8,9,10,11,12]. In addition, the adequate light availability enhances phytoplankton growth and production of phytoplankton, which, in turn, serves as microcrustacean food sources [13]. Low water transparency resulted from limited light penetration caused by high turbidity decreases the photosynthesis rate by phytoplankton [14]. Consequently, less DO is released into the water, which can directly influence microcrustacean mortality. Therefore, unfavorable environmental conditions would reduce microcrustacean abundance, decreased biodiversity as well as disappearance of some species.
Microcrustacean species composition, abundance and diversity differ at different levels of eutrophication [15,16]. The continuous accumulation of nutrients, mainly phosphorus and nitrogen, accelerates lake eutrophication by promoting algal blooms that have deteriorating effects on water quality and biodiversity [17,18]. To some extent, eutrophication produces harmful algal blooms (HABs) that lead to the production of noxious toxins, which affect developmental, immunological, neurological and reproductive capacities of microcrustaceans [19]. Adibah et al. [20] showed that the reproductive capacity and growth rates of a cladoceran, Moina micrura, significantly decreased when fed with toxic cyanobacteria Microcystis aeruginosa and M. viridis compared to those fed with a green alga, Chlorella vulgaris. A decline in microcrustacean species richness and diversity is generally observed in eutrophic environments due to the deterioration of water quality and poor-quality food sources [21]. Thus, it is likely that microcrustacean species composition and abundance can be altered by eutrophication, resulting in changes to the microcrustacean community structure.
Microcrustacean occurrence in lakes with different trophic status is also influenced by their ability to tolerate changes in environmental parameters and food availability. For example, small-sized cladocerans such as Ceriodaphnia spp., Bosmina spp. and Moina spp. are normally dominant in eutrophic lakes as they can feed on bacteria and detrital materials, which are highly abundant in eutrophic waters mainly due to decomposed unconsumed phytoplankton biomass [22,23]. The feeding mode of microcrustaceans may also affect their distribution under different trophic conditions. Cladocerans are known as efficient filter feeders, as they filter various particles in water such as phytoplankton, bacterioplankton and heterotrophic flagellates as their food sources [24]. Most cladocerans are known as herbivorous microcrustaceans. Therefore, the presence of high quality phytoplankton is extremely important in microcrustacean growth. Perbiche-Neves et al. [25] reported that planktonic cladocerans respond positively to increases in certain classes of phytoplankton, particularly high quality species. However, copepods exhibit selective feeding behaviour due to chemical and mechanical sensors in their antennae, which permit them to discriminate food types based on quality by detecting the size, shape, and chemical composition of various food sources [26]. Therefore, cyanobacterial dominance in eutrophic waters would affect copepod survival due to poor food quality in eutrophic conditions.
This study focuses on the assessment of planktonic microcrustacean populations in shallow tropical lakes that are vulnerable to eutrophication. The microcrustacean response to eutrophication is complex due to the interplay of environmental processes and certain traits of other aquatic organisms. Therefore, the objective of this study is to evaluate the correlation between physical and chemical factors associated with eutrophication in shaping the planktonic microcrustacean community structure in three lakes of different trophic levels based on species composition and density. This information is essential in understanding the succession of the planktonic microcrustacean community that is linked to environmental changes due to eutrophication. Furthermore, this study would reveal the dominant species that could be the indicator for eutrophication. This study hypothesized that different levels of eutrophication would affect the planktonic microcrustacean community structure, where high density but low diversity of microcrustacean tends to occur in eutrophic lakes. In addition, eutrophic lakes tend to be dominated by small-sized microcrustacean species, which could probably successfully proliferate with the increased bacterial biomass associated with decomposed cyanobacteria.

2. Materials and Methods
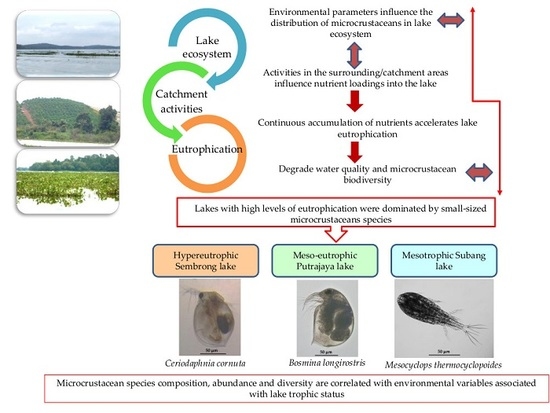
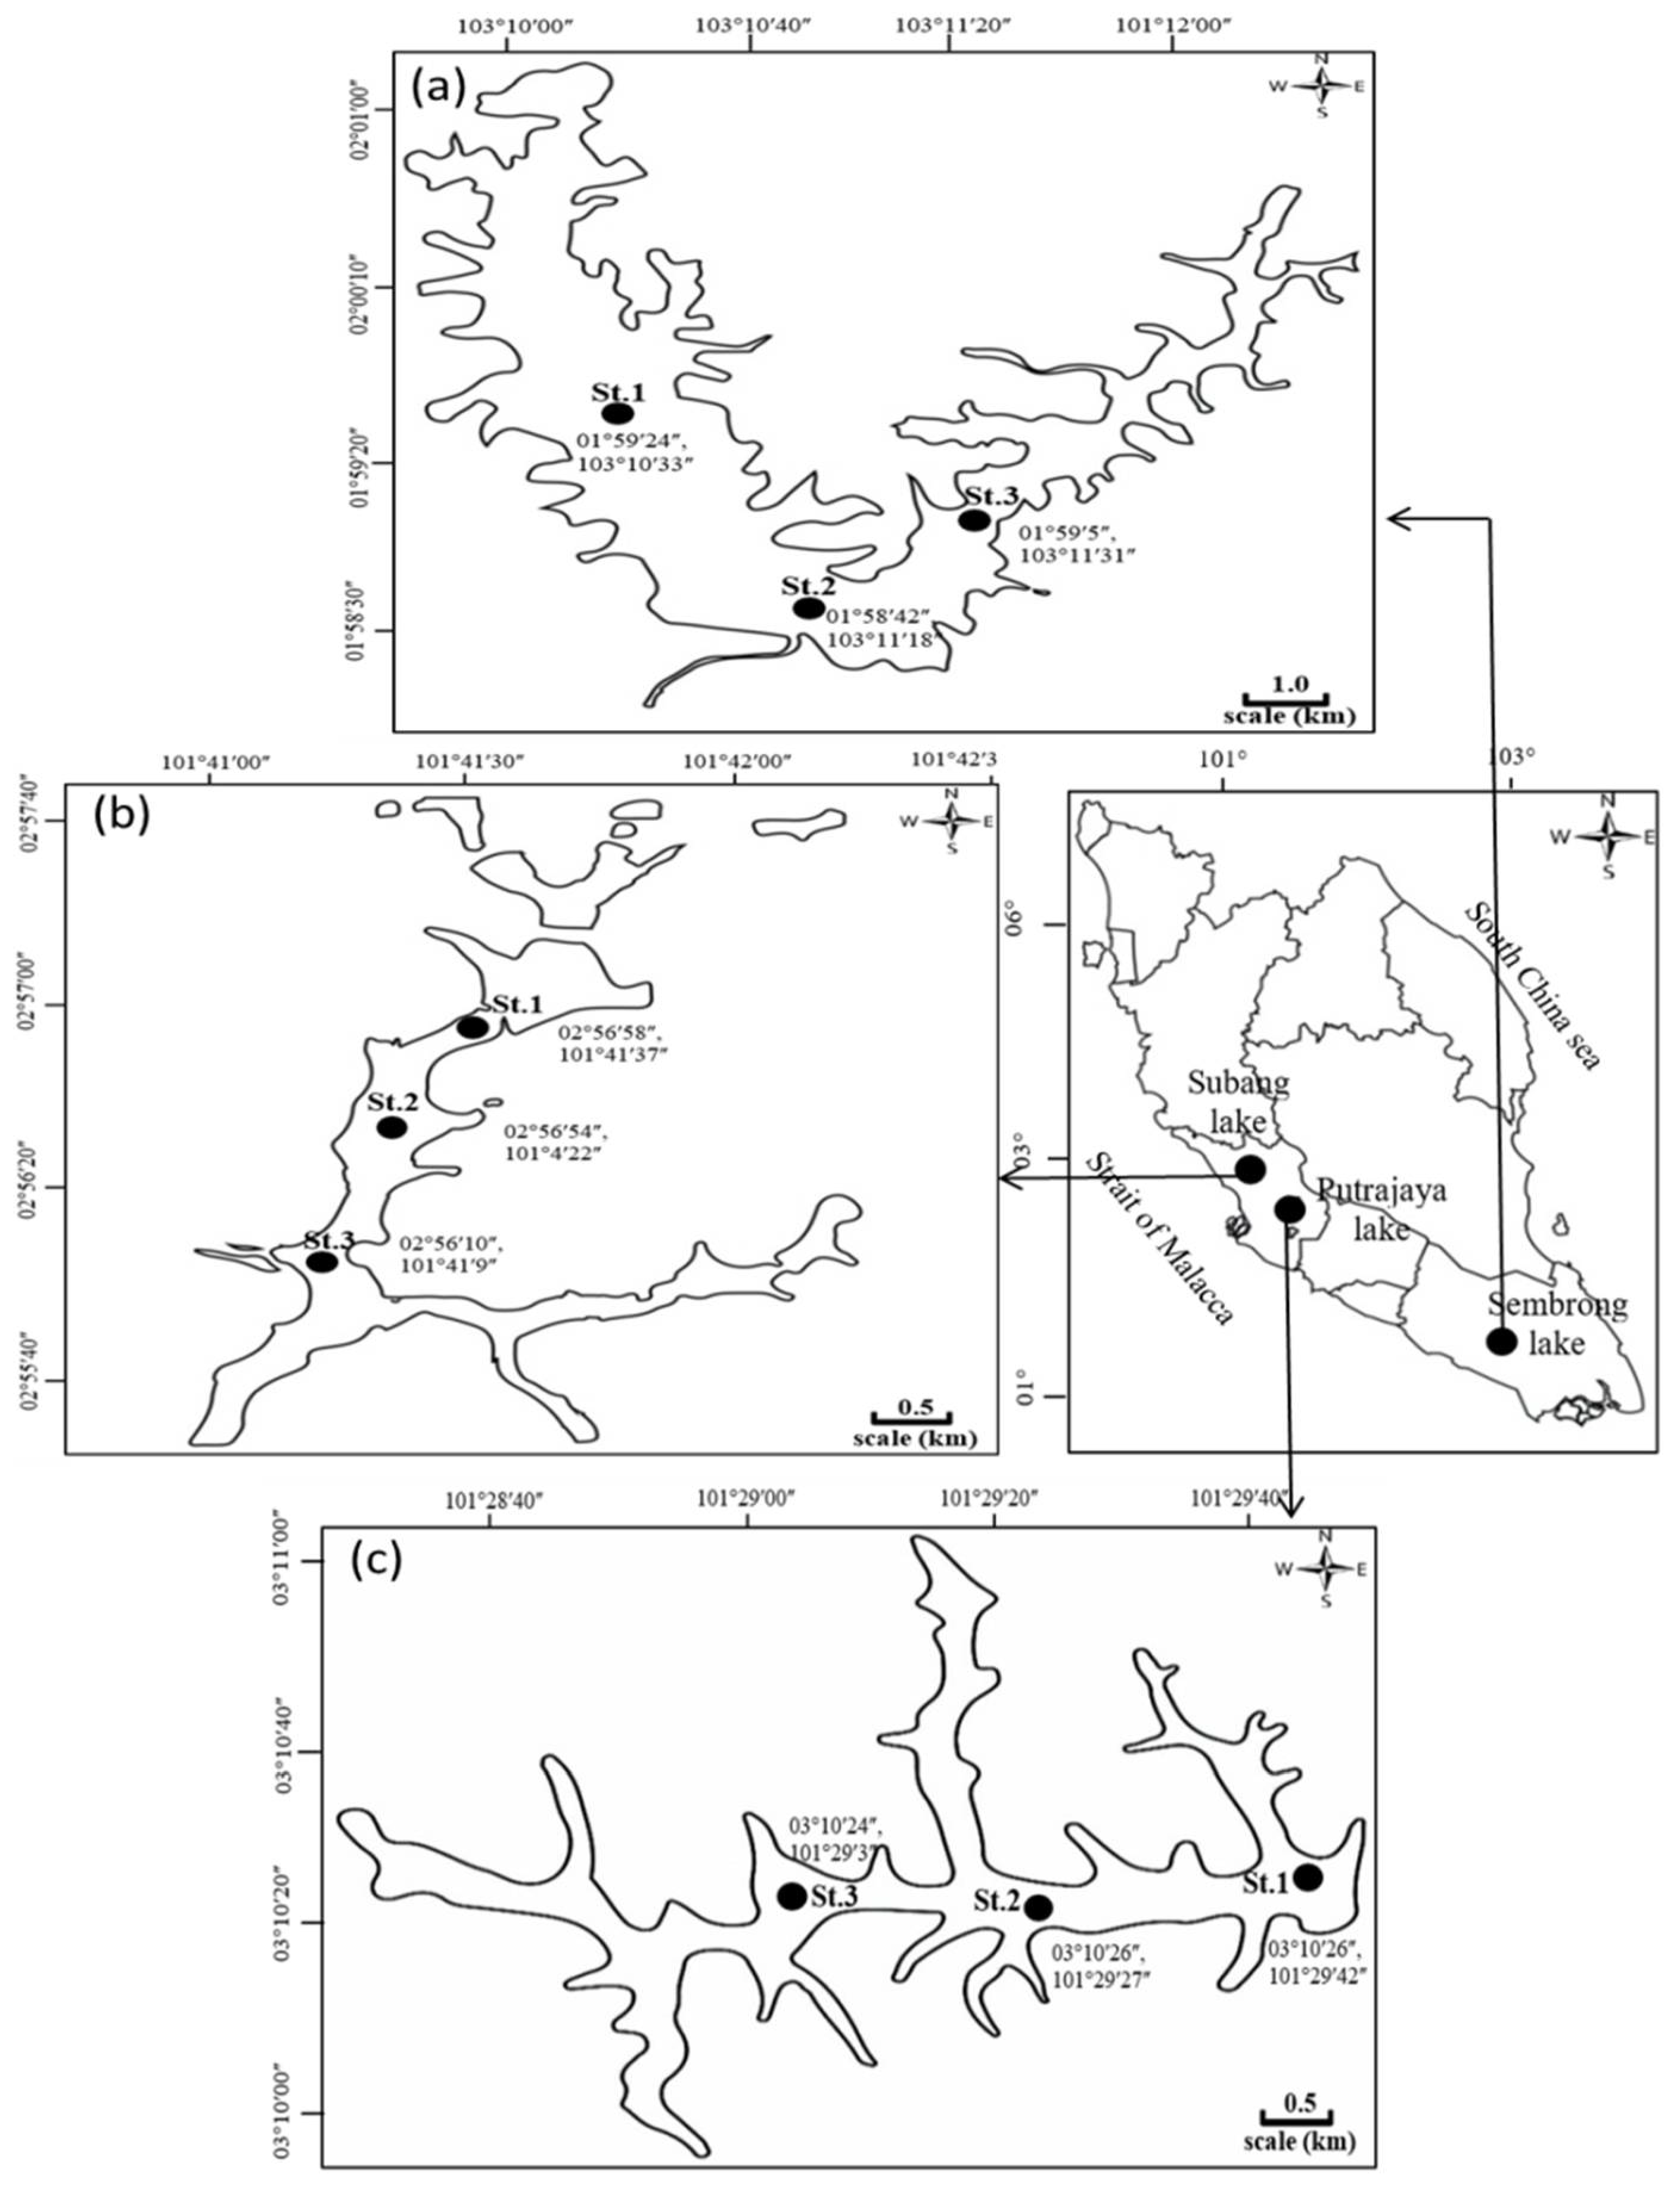
2.1. Study Sites

This study was carried out at three man-made lakes, Sembrong, Putrajaya and Subang lakes in Malaysia, and three stations were established in each lake (Figure 1). Detailed description and morphometric characteristics of the study areas can be found in Umi et al. [27] and Table S1.

2.2. Rainfall Data, Field Sampling and Laboratory Analyses

Rainfall data for a one-year period (January 2015 to February 2016) were obtained from the nearby National Climate Center, Malaysian Meteorological Department at Kluang station, Kuala Lumpur International Airport (KLIA) Sepang station and Subang station for Sembrong, Putrajaya and Subang lakes, respectively. Field sampling and data collection were carried out every other month from April 2015 to February 2016 to cover an annual cycle. In the tropics, seasonal changes are minimal, and thus bimonthly samplings should be sufficient and representative to detect changes associated with wet and dry seasons. At each sampling station, in-situ physical and chemical parameters, and water samples for nutrient (total nitrogen, TN; total phosphorus, TP; total ammonium nitrogen, TAN; soluble reactive phosphorus, SRP; nitrate-N and nitrite-N, NO3-N + NO2-N and chlorophyll a) analyses were collected and measured according to standard methods [28,29,30,31]. Carlson’s trophic status index was calculated according to Carlson [32]. Duplicate microcrustacean samples were collected from the same stations as physical and chemical parameters, preserved and processed as described by Umi et al. [27]. Overall, 36 samples (n) were collected (6 months × 3 stations × 2 replicates = 36 samples) from each lake. Zooplankton identification and enumeration were accomplished according to descriptions, taxonomic keys and illustrations from previous studies [33,34,35,36,37,38,39,40].

2.3. Data Analyses

Spatial and temporal environmental data were assessed for normality by the Shapiro–Wilk test and log (x + 1) transformed prior to one-way analysis of variance (ANOVA) using SPSS v. 25 (IBM SPSS Statistical, Chicago, IL, USA) and illustration using Surfer 10 (Golden Software LLC, Street Golden, CO, USA) as described by Umi et al. [27]. All environmental and microcrustacean data (fourth root transformed to balance the common and rare species) were ordinated by the correlation-based principle component analysis (PCA) using PRIMER software (Plymouth Routine in Multivariate Ecological Research v. 7 PRIMER E-Ltd, Plymouth, UK) to identify the key factors contributing to variations and patterns in datasets [27,41]. In addition, Shannon–Wiener diversity index (H’) calculation, dendrogram, analysis of similarities (ANOSIM), the similarity percentage analysis (SIMPER), biotic-environmental analysis (BIO-ENV) and canonical correspondence analysis (CCA) were performed to determine various aspects of the microcrustacean community structure [27,41,42]. The occurrence of microcrustacean species and the discriminant species in each lake was further illustrated by shade plot and bubble plot to show clear distributions of each species in lakes with different trophic status.

3. Results

3.1. Rainfall, Physical and Chemical Parameters and Lake Trophic Status

Dry and wet seasons in Peninsular Malaysia were delineated based on the rainfall amount where April 2015, June 2015, and February 2016 were categorized as dry months (Range: Sembrong lake = 102 mm to 148 mm, Putrajaya lake = 65 mm to 156 mm, Subang lake = 102 mm to 150 mm), while, August 2015, October 2015 and December 2015 were categorized as wet months (Range: Sembrong lake = 270 mm to 350 mm, Putrajaya lake = 260 mm to 320 mm, Subang lake = 380 mm to 430 mm) (Figure S1). For all lakes, rainfall amount reached the maximum level (p < 0.05) in December 2015 and decreased dramatically and reached the minimum level in February 2016, which was attributed to the El-Nino phenomenon in Malaysia, which started from early in the year [43]. Water temperature and dissolved oxygen profiles showed that these shallow lakes were relatively well mixed throughout the year, except Subang lake, which showed slight thermal stratification with relatively low dissolved oxygen levels in the hypolimnion, especially during the dry season (Table 1 and Figure 2). The significantly deeper Subang lake, compared to the other two lakes, was nestled in a hilly and forested area, and was not exposed to wind and turbulence that could help to mix water columns like in Sembrong and Putrajaya lakes.
Development of stratified layers in Subang lake resulted in different profiles of physical and chemical parameters that could influence the lake’s primary productivity and microcrustacean distribution. In addition, Subang lake had significantly (p < 0.05) lower pH, turbidity, dissolved solids and conductivity, but significantly higher total ammonium nitrogen (TAN) compared to Sembrong and Putrajaya lakes (Table 1). Agricultural activities, especially palm oil plantation, modern agriculture and livestock husbandry, in the surrounding area of Sembrong lake resulted in significantly higher (p < 0.05) nutrient concentrations, both total phosphorus (140.23 ± 8.51 µg L−1) and total nitrogen (226.08 ± 76.4 µg L−1), compared to Putrajaya and Subang lakes (Table 1 and Figure 2). Similarly, chlorophyll a concentrations were significantly higher (p < 0.05) in Sembrong lake (97.19 ± 4.70 µg L−1) compared to Putrajaya (5.53 ± 0.65 µg L−1) and Subang lakes (4.64 ± 1.12 µg L−1) (Table 1 and Figure 2). Based on the Carlson trophic status index (CTSI), Sembrong lake could be categorized as a hypereutrophic lake with a CTSI value of 71.11 (Table 2). With a CTSI value of 53.34, Putrajaya lake was categorized as a meso-eutrophic lake, whereas Subang lake was categorized as an acidic-mesotrophic lake with a CTSI value of 47.67.
A principle component analysis (PCA) showed that four principal components explained 85.10% of the total variance (Table 3 and Figure 3). In PC1 water transparency, total dissolved solids, pH, conductivity, total phosphorus (TP), chlorophyll a and turbidity were the main parameters contributing to 49.4% of the total variance (Table 3). High levels of total dissolved solid (TDS), conductivity, TP and chlorophyll a showed that Sembrong lake was eutrophic due to high nutrient loading from agriculture sites in the catchment area. Dissolved oxygen, water temperature and total ammonium nitrogen were the main parameters in PC2 contributing to 20.9% of the total variance. In addition, PC2 showed the relationship of ammonium nitrogen and dissolved oxygen (DO) with the lake trophic status, especially the Putrajaya lake (Figure 3). The inorganic nutrients, soluble reactive phosphorus (SRP) and nitrate-N+nitrite-N contributed to the rest of the cumulative variation in PC3 and PC4 (Table 3).

3.2. Microcrustacean Species Composition, Density and Biodiversity

All the three lakes with different trophic status showed distinct microcrustacaen densities, as shown by the dendrogram (Figure 4), where the dissimilarity between groups was 50.0%. The dendrogram showed that microcrustacean densities were clustered in three different groups corresponding to the three lakes. Two-Way ANOSIM of the overall combination of microcrustacean densities in all lakes revealed that microcrustacean densities in the hypereutrophic Sembrong, the meso-eutrophic Putrajaya and the acidic mesotrophic Subang lake were significantly different (p < 0.05) with a high range value of (R = 0.85) for the global test (Table 4). High range values of R for Sembrong lake v Putrajaya lake (R = 0.88), Putrajaya lake v Subang lake (R = 0.89) and Sembrong lake v Subang lake (R = 0.87) indicated that microcrustacean densities in lakes with different trophic status were significantly different (p < 0.05).
Among the lakes, the highest (p < 0.05) microcrustacean density (294.6 ± 6.1 ind. L−1) was observed in the hypereutrophic Sembrong lake and the lowest microcrustacean density (28.6 ± 7.8 ind. L−1) was found in the acidic mesotrophic Subang lake (Table S2A). A seasonal pattern for microcrustacean density was observed in all lakes where significantly higher (p < 0.05) microcrustacean density occurred during the dry season, especially February 2016, and significantly lower (p < 0.05) microcrustacean density was recorded in the wet season (Figure 5). Adult cladocerans were significantly higher (p < 0.05) in both Sembrong (76.8%) and Putrajaya (72.0%) lakes compared to adult copepods. However, in Subang lake, adult copepods were dominant in this lake with 89.2% of total adult microcrustaceans (Table S2B). In general, copepod nauplii contributed to more than 70% of the total copepods in all lakes (Table S2C).
A total of nine microcrustacean species consisting of six species of cladocerans and three species of copepods from seven different families were recorded throughout the sampling period (Table S3). In the hypereutrophic Sembrong lake, seven species of microcrustacean consisting of four species of cladocerans and three species of copepods were recorded. Putrajaya lake had a significantly (p < 0.05) higher number of microcrustacean species compared to the hypereutrophic Sembrong and acidic-stratified Subang lake (Table S3). In addition, Shannon–Wiener species diversity for microcrustcean communities in Putrajaya lake (H’ = 1.3 ± 0.0) was significantly higher than those in Sembrong lake (H’ = 0.9 ± 0.0) and Subang lake (H’ = 0.6 ± 0.1) (Table S3). In fact, different lakes showed different dominant microcrustacean species. Ceriodaphnia cornuta represented 74.0% of the total microcrustacean density in the hypereutrophic Sembrong lake and its density was the highest during the dry season (Table S3, Figure 6 and Figure S2). In the meso-eutrophic Putrajaya lake, Bosmina longirostris and C. cornuta contributed to 46.9% and 20.0%, respectively, of the total microcrustacean density throughout the sampling periods and two cladoceran species, Anthalona harti and Moina micrura were only found in this lake but with low density (Table S3, Figure 6 and Figure S2). Meanwhile, acidic mesotrophic Subang lake was dominated by copepods where the highest contribution was by Mesocyclops thermocyclopoides, at 55.6% of the total microcrustacean density in this lake. Results from SIMPER analysis suggested that in the hypereutrophic Sembrong lake (within-group similarities based on density), Ceriodaphnia cornuta was the most discriminating species. On the other hand, Bosmina longirostris was the discriminating species in the meso-eutrophic Putrajaya lake and the discriminant species in the acidic-mesotrophic Subang lake was Mesocyclops thermocyclopoides (Table 5, Figure 6 and Figure S2).

3.3. Relationship between Microcrustacean and Physical and Chemical Parameters

Further analysis was performed to find the correlation of microcrustacean and physical and chemical parameters using biotic-environmental (BIO-ENV) analysis. The global test from BIO-ENV showed that microcrustacean density was significantly (p < 0.05) correlated with physical and chemical parameters (Table S4). From the BIO-ENV analysis, chlorophyll a, transparency and total phosphorus were best correlated to microcrustaceans with ρ = 0.506. The correlation between microcrustacean species and physical and chemical parameters using canonical correspondence analysis (CCA) showed that environmental variables collectively explained 86.7% of the total variance in the weighted means of the species in relation to the 13 parameters (Figure 7).
Axis 1, which accounted for a total variance of 68.16%, was positively correlated with total phosphorus, chlorophyll a, total dissolved solid, turbidity and conductivity and negatively correlated with water transparency. From the biplot, Ceriodaphnia cornuta, which was found in high densities in the hypereutrophic Sembrong lake, was positively influenced by axis 1, marked by high nutrient and chlorophyll a concentrations (Figure 7). Meanwhile, Bosmina longirostris, which was abundantly found in the meso-eutrophic Putrajaya lake, had positive loading of temperature and dissolved oxygen on axis 2, which accounted for a total variance of 18.57%. Both BIO-ENV and CCA analyses revealed that the distribution of microcrustacean community, especially small-sized microcrustaceans such as C. cornuta and B. longirostris, was significantly influenced by environmental conditions associated with trophic conditions such as in the hypereutrophic Sembrong and the meso-eutrophic Putrajaya lake (Figure 7).

4. Discussion

Peninsular Malaysia experiences two pronounced seasons, namely the wet northeast monsoon (November to February) and a relatively drier southwest monsoon (May to August), separated by transitional monsoon seasons (March to April and September to October). However, nowadays, local climate seems to deviate from this normal pattern, probably due to climate change phenomenon, resulting in shifts of rainfall pattern from the conventional monsoonal months, as shown in this study. Precipitation amount can affect the physiochemical characteristics of all aquatic ecosystems. Productivity of aquatic ecosystems is mainly influenced by nutrient concentrations in water bodies. In this study, the hypereutrophic condition of Sembrong lake was due to high concentration of nutrients, mainly phosphorous and nitrogen, brought by surface runoff especially during the wet season from the surrounding agriculture farms, including oil palm plantations, fruit orchards and livestock husbandry [44]. A seasonal effect on chlorophyll a concentration was also observed where high chlorophyll a concentrations were recorded in the wet season due to the increase in nutrient inflow into the lake, which accelerated the phytoplankton growth [45]. Continuous nutrient loadings to this lake promoted the growth of phytoplankton, resulting in increased chlorophyll a (phytoplankton biomass) concentrations and reduced water transparency [46]. Therefore, a strong relationship among nutrient concentrations (total phosphorus), chlorophyll a and water transparency indicated the responses of this lake to the increased nutrients in the lake water, which could be related to activities in the surrounding lake area.
The number of microcrustacean species in this study was low but showed significant differences (p < 0.05) among the lakes. Generally, the number of planktonic microcrustaceans in lakes and reservoirs in Malaysia is usually low. A low proportion of planktonic cladoceran species (approximately 10%) was also reported in the northern part of Borneo Island [39]. This was consistent with previous findings on microcrustacean distribution in Malaysian lakes and reservoirs, where only 11 species of microcrustaceans consisting of nine species of cladocerans and two species of copepods were recorded in both Chenderoh Reservoir and Pedu Reservoir, respectively [47,48]. Besides, only four microcrustacean species consisting of two species of cladocerans and two species of copepods were recorded in Bakun Reservoir in the East Malaysia, Sarawak [49]. In addition, Idris [36] reported that lakes and reservoirs contain the lowest number of cladoceran taxa in Malaysia in comparison to rice fields and ponds as shallow and weedy areas provide more niches for plankton population growth and development. The common species reported by previous studies including cladocerans such as Ceriodaphnia cornuta, Bosminopsis dietersi, Diaphanosoma sp., calanoids and cyclopoids were also observed in this study [50].
Although the number of species found was low, microcrustacean densities significantly differed (p < 0.05) among lakes with varying trophic status. Pinto-Coelho et al. [51] also revealed that cladocerans and cyclopoids were more abundant in eutrophic lakes and reservoirs compared to nutrient-poor lakes. In addition, higher microcrustacean density in the dry season compared to the wet season as observed in this study might be due to reduction in water level and water stagnation, which help in concentrating nutrients to support more phytoplankton growth. However, the mechanical force of the water flow during the wet season modified the water chemical characteristics and reduced nutrient concentrations due to the dilution effect. This contention was supported by Dejen et al. [52] and Okogwu et al. [53], who noted that microcrustacean density was higher in the dry season compared to the wet period.
Basically, food availability could be one of the factors that determine the success of microcrustacean populations in aquatic ecosystems [54,55]. The high density of microcrustaceans in eutrophic conditions, as in the hypereutrophic Sembrong lake and the meso-eutrophic Putrajaya lake, was probably due to high nutrient concentrations that favour the growth of phytoplankton as a food source for them. This scenario is in accordance with Offem et al. [56], who reported that microcrustacean abundance increased in nutrient-enriched lakes due to food resource availability. In addition, a high microcrustacean density in Sembrong lake was probably influenced by their ability to exploit additional food resources such as bacterioplankton and heterotrophic flagellates. In the hypereutrophic Sembrong lake, high nutrient concentrations favoured the growth of the inedible filamentous blue green algae (cyanobacteria), Planktothrix agardhii, which formed more than 90% of the phytoplankton density in this lake. Even though this species is not a suitable food item for microcrustaceans, the decomposition of P. agardhii involved many bacteria, which could serve as food sources for microcrustaceans in that area [57]. Bacteria and detrital particles from decomposed cyanobacteria could represent important sources of food for cladocerans [58,59]. According to previous studies, cladocerans were found to be more dependent on the carbon resource of bacteria and these microbes were more easily digested compared to blue-green microalgae [60,61]. Therefore, the eutrophic condition that is usually associated with high abundance of bacteria could support high microcrustacean densities as long as these species could tolerate the adverse environmental conditions associated with poor water quality, as depicted by the high C. cornuta population in the hypereutrophic Sembrong lake.
Microcrustaceans in Sembrong lake showed a typical community structure of a eutrophic ecosystem with high abundance of a tolerant species, but low species diversity due to a low number of species and high dominance of a single species C. cornuta (74.0% of total microcrustaeans). This finding was consistent with that reported by Starling [62], who found high microcrustacean density but low diversity in eutrophic reservoirs. Previous studies also reported that with increasing eutrophication, the predominance of tolerant microcrustacean species resulted in community changes from one dominated by large herbivores such as calanoid copepods and large cladocerans to small-sized consumers such as small cladocerans (Ceriodaphnia, Bosmina, and Moina) and cyclopoid copepods [63,64,65]. The dominance of small-sized cladoceran, C. cornuta and Bosmina longirostris in both Sembrong and Putrajaya lakes could be explained by their inducible defenses and their tolerance to the toxic and filamentous cyanobacteria. Previous studies also reported that cladocerans are susceptible to the harmful effects of cyanobacteria [66,67,68,69,70,71]. In eutrophic lakes, the filter feeding apparatus of large cladocerans (Diaphanosoma sp.) could be damaged from clogging by cyanobacterial filaments or by the sticky mucilage of large cyanobacterial colonies [72]. In fact, the large carapace opening of large cladocerans enabled more colonies and filamentous forms of cyanobacteria to enter the filter chamber apparatus, resulting in mechanical or chemical inhibition of the thoracic appendage movements by toxins [73]. A decrease in filtration rates resulted in reduced energy for growth and reproduction in cladoceran species. In contrast, smaller species of cladocerans such as C. cornuta have small openings of their carapaces that could prevent large cyanobacterial colonies from being filtered and provide them competitive advantages in comparison to the large-bodied cladocerans [74].
Cyclopoids (Thermocyclops and Mesocyclops) and calanoids are considered as ubiquitous and thus were found in most lakes [75]. However, in this study, the high copepod density recorded was mainly due to the significantly higher (p < 0.05) contribution of the nauplius development stage, compared to the copepodite and adult stages. The domination of immature forms over adult copepods could be due to continuous reproduction as indicated by the constant presence of different copepod developmental stages [47]. Besides, the abundance of copepod nauplii indicated that copepods have high reproductive rates but low survival rates, resulting in low adult density, probably due to the higher predation rate on the larger adult forms [76]. Moreover, copepod nauplii and early copepodites stages were capable of surviving in eutrophic waters because their filter feeding mode is able to utilize bacteria and detrital particles in the nutrient-enriched waters [77].
Based on BIO-ENV and CCA analyses, physical and chemical parameters, especially those related to trophic status (nutrients and chlorophyll a concentrations), significantly influenced the microcrustacean community. Eutrophic conditions associated with high nutrients such as those found in Sembrong and Putrajaya lakes favoured the growth of small-bodied microcrustaceans by providing sufficient food sources for them. Even though the acidic-mesotrophic Subang lake had intermediate trophic conditions, the microcrustacean abundance and biodiversity values were low, probably due to adverse environmental conditions such as low pH, dissolved oxygen and chlorophyll a. Most microcrustaceans are pH-sensitive and may disappear due to acidification [9]. Waters with low pH cause the solubility of heavy metals such as aluminum, lead and copper, which are released into the water and limit the growth and reproduction of aquatic organisms [78]. Generally, extreme pH values below 5.5–6.0 or above 10.5 could negatively impact microcrustacean communities [79]. This observation was in line with previous studies, where microcrustacean species richness decreased when the lake water pH was below 7 and above 8.1–8.2, making the environment unsuitable for planktonic populations to proliferate [80,81,82]. The development of stratified layers in Subang lake caused low dissolved oxygen (DO), resulting in low microcrustacean occurrence in this lake. Low DO could be one of the major factors in the decrease in microcrustacean species composition and density in a habitat [83,84,85]. Low chlorophyll a concentrations in Subang lake indicated that this lake has low phytoplankton production. This condition indirectly affected microcrutacean population due to low food source availability. High microcrustacean density found in eutrophic waters was also correlated with turbidity as turbid water may favour the survival of microcrustaceans due to the lower predation pressure from visually-dependent predators [86,87].

5. Conclusions

Variables related to lake trophic status, especially nutrient concentrations, chlorophyll a and water transparency, were the main drivers influencing the distribution of microcrustacean species. The small-sized cladoceran, Ceriodaphnia cornuta (74.0% dominance) was the most discriminating species in productive lakes with high nutrient and chlorophyll a concentrations as well as low water transparency, as could be found in the hypereutrophic Sembrong lake. On the other hand, the less enriched Putrajaya lake was dominated by Bosmina longirostris (46.9%) and C. cornuta (20.0%). High dominance of the microcrustacean community by a single species (C. cornuta) resulted in a significantly lower biodiversity in Sembrong lake compared to Putrajaya lake. Thus, environmentally stressed conditions in the hypereutrophic Sembrong lake resulted in low species diversity with high abundance of stress-tolerant species, C. cornuta. Meanwhile, significantly lower density and diversity in Subang lake could be attributed to the adverse environmental characteristics of the lake water that hampered a healthy microcrustacean population growth. This study illustrated that microcrustacean species composition, abundance and diversity were significantly correlated with environmental variables associated with lake trophic status.

Supplementary Materials

The following are available online at https://www.mdpi.com/1424-2818/12/9/322/s1, Table S1: Morphometric characteristics of Sembrong, Putrajaya and Subang lakes, Table S2: Mean densities (ind. L−1) and percentages (%) of (A) total microcrustacean, (B) total adult microcrustaceans and (C) total developmental stages of microcrustaceans in different lakes, Table S3: Mean adult densities (ind. L−1) and percentages (%) of microcrustacean species in hypereutrophic Sembrong, meso-eutrophic Putrajaya and acidic-mesotrophic Subang lakes, Table S4: Summary of physical and chemical parameters that explain the microcrustacean community in the study area, showing spearman rank correlation (ρ) obtained by BIO-ENV analysis. Figure S1: Monthly total rainfall in Sembrong, Putrajaya and Subang lakes from January 2015 to February 2016. Rectangular box (with dashed lines) indicates the wet season which occurred between August to December 2015, Figure S2: Non-metric multidimensional scaling (nMDS) of major microcrustacean species distribution in different lakes. The size of the ball denotes the density in ind. L−1.

Author Contributions

Conceptualization, F.M.Y. and W.A.D.U.; formal analysis, W.A.D.U.; funding acquisition, F.M.Y.; investigation, W.A.D.U. and Z.S.; methodology, F.M.Y. and W.A.D.U.; project administration, F.M.Y.; resources, F.M.Y.; supervision, F.M.Y.; validation, F.M.Y. and A.Y.S.; visualization, W.A.D.U.; writing—original draft, W.A.D.U.; writing—review and editing, F.M.Y., A.Z.A., Z.S. and A.Y.S. All authors have read and agreed to the published version of the manuscript.

Funding

This research was funded by the Ministry of Higher Education Malaysia through the Fundamental Research Grant Scheme (FRGS-Project No. FRGS/2/2014/STWN01/UPM/01/1) and the SATREPS-COSMOS Project (No. JPMJSA 1509). Universiti Putra Malaysia also provided a Graduate Research Fellowship (GRF) to the first author.

Acknowledgments

The authors wish to express their gratitude to the management of Sembrong, Putrajaya and Subang lakes for facilitating the sampling in their lakes. Thank you to Maria Holynska for the confirmation of copepod species.

Conflicts of Interest

The authors declare no conflict of interest. The funders had no role in the design of the study; in the collection, analyses, or interpretation of data; in the writing of the manuscript, or in the decision to publish the results.

References

  1. Hulot, F.D.; Lacroix, G.; Loreau, M. Differential responses of size-based functional groups to bottom–up and top–down perturbations in pelagic food webs: A meta-analysis. Oikos 2014, 123, 1291–1300. [Google Scholar] [CrossRef]
  2. Maciej, K.; Piotr, Z.; Magdalena, G.; Jolanta, E.K.; Joanna, K.; Irina, F. Effect of eutrophication and humification on nutrient cycles and transfer efficiency of matter in freshwater food webs. Hydrobiologia 2020, 847, 2521–2540. [Google Scholar] [CrossRef]
  3. Šorf, M.; Brandl, Z.; Znachor, P.; Vašek, M. Different effects of planktonic invertebrate predators and fish on the plankton community in experimental mesocosms. Ann. Limnol. 2014, 50, 71–83. [Google Scholar] [CrossRef]
  4. Wang, C.; Wang, L.; Deng, D.; Zhou, Z. Temporal and spatial variations in rotifer correlations with environmental factors in Shengjin Lake, China. Environ. Sci. Pollut. Res. 2016, 23, 8076–8084. [Google Scholar] [CrossRef] [PubMed]
  5. Stamou, G.; Katsiapi, M.; Moustaka-Gouni, M.; Michaloudi, E. Trophic state assessment based on zooplankton communities in Mediterranean lakes. Hydrobiologia 2019, 844, 83–103. [Google Scholar] [CrossRef]
  6. Sodré, E.d.O.; Bozelli, R.L. How planktonic microcrustaceans respond to environment and affect ecosystem: A functional trait perspective. Int. Aquat. Res. 2019, 11, 207–223. [Google Scholar] [CrossRef] [Green Version]
  7. Gillooly, J.F.; Brown, J.H.; West, G.B.; Savage, V.M.; Charnov, E.L. Effects of size and temperature on metabolic rate. Science 2001, 293, 2248–2251. [Google Scholar] [CrossRef] [Green Version]
  8. Gillooly, J.F.; Charnov, E.L.; West, G.B.; Savage, V.M.; Brown, J.H. Effects of size and temperature on developmental time. Nature 2002, 417, 70–73. [Google Scholar] [CrossRef] [PubMed]
  9. Derry, A.M.; Arnott, S.E. Zooplankton community response to experimental acidification in boreal shield lakes with different ecological histories. Can. J. Fish. Aquat. 2007, 64, 887–898. [Google Scholar] [CrossRef] [Green Version]
  10. David, T.E.; James, J.P.; Michael, R.R. Relationship between environmental conditions and zooplankton community structure during summer hypoxia in the northern Gulf of Mexico. J. Plankton Res. 2012, 34, 602–613. [Google Scholar] [CrossRef] [Green Version]
  11. Elser, J.J.; Gudex, L.; Kyle, M.; Ishikawa, T.; Urabe, J. Effects of zooplankton on nutrient availability and seston C: N: P stoichiometry in inshore waters of Lake Biwa, Japan. Limnology 2001, 2, 91–100. [Google Scholar] [CrossRef]
  12. Špoljar, M.; Tomljanović, T.; Lalić, I. Eutrophication impact on zooplankton community: A shallow lake approach. Holist. Approach Environ. 2011, 1, 131–142. [Google Scholar]
  13. Domingues, R.B.; Anselmo, T.P.; Barbosa, A.B.; Sommer, U.; Galvão, H.M. Light as a driver of phytoplankton growth and production in the freshwater tidal zone of a turbid estuary. Estuar. Coast. Shelf Sci. 2011, 91, 526–535. [Google Scholar] [CrossRef]
  14. Davies-Colley, R.J.; Smith, D.G. Turbidity suspended sediment, and water clarity: A review. J. Am. Water Resour. Assoc. 2001, 37, 1085–1101. [Google Scholar] [CrossRef]
  15. Sendacz, S.; Caleffi, S.; Santos-Soares, J. Zooplankton biomass of reservoirs in different trophic conditions in the state of São Paulo, Brazil. Braz. J. Biol. 2006, 66, 337–350. [Google Scholar] [CrossRef] [Green Version]
  16. Paidere, J.; Dimante-Deimantovica, I.; Griņko, O.; Brakovska, A.; Brūvere, I. Applicability of zooplankton community study for ecological quality of salmonid water lakes in Latvia during summer. Acta Biol. 2012, 61 (Suppl. S3), 65–81. [Google Scholar]
  17. Peretyatko, A.; Teissier, S.; Symoens, J.J.; Triest, L. Phytoplankton biomass and environmental factors over a gradient of clear to turbid peri-urban ponds. Aquat. Conserv. 2007, 17, 584–601. [Google Scholar] [CrossRef]
  18. Paerl, H.W.; Xu, H.; Hall, N.S.; Rossignol, K.L.; Joyner, A.R.; Zhu, G.; Qin, B. Nutrient limitation dynamics examined on a multi-annual scale in Lake Taihu, China: Implications for controlling eutrophication and harmful algal blooms. J. Freshw. Ecol. 2015, 30, 5–24. [Google Scholar] [CrossRef]
  19. Chislock, M.F.; Doster, E.; Zitomer, R.A.; Wilson, A.E. Eutrophication: Causes, consequences, and controls in aquatic ecosystems. Nat. Educ. Knowl. 2013, 4, 10. [Google Scholar]
  20. Adibah, S.; Yusoff, F.M.; Ismail, I.S.; Toda, T. Reduced reproductive capacity in Moina micrura Kurz, 1875 exposed to toxic Microcystis spp. Asian Fish. Sci. 2020, 33, 42–49. [Google Scholar] [CrossRef]
  21. Di Genaro, A.C.; Sendacz, S.; Moraes, M.D.A.B.; Mercante, C.T.J. Dynamics of cladocera community in a tropical hypereutrophic environment (Garças Reservoir, São Paulo, Brazil). J. Water Resour. Prot. 2015, 7, 379–388. [Google Scholar] [CrossRef] [Green Version]
  22. Tõnno, I.; Agasild, H.; Kõiv, T.; Freiberg, R.; Nõges, P.; Nõges, T. Algal diet of small-bodied crustacean zooplankton in a cyanobacteria-dominated eutrophic lake. PLoS ONE 2016, 11, e0154526. [Google Scholar] [CrossRef] [PubMed] [Green Version]
  23. Hisatugo, K.F.; Mansano, A.S.; Hayashi, L.H.; Regali-Seleghim, M.H. Ingestion of bacteria in a eutrophic subtropical reservoir pond with food web mainly controlled by zooplankton grazing. Limnologica 2014, 44, 98–106. [Google Scholar] [CrossRef]
  24. Work, K.A.; Havens, K.E. Zooplankton grazing on bacteria and cyanobacteria in a eutrophic lake. J. Plankton Res. 2003, 25, 1301–1306. [Google Scholar] [CrossRef] [Green Version]
  25. Perbiche-Neves, G.; Portinho, J.L.; Ferreira, R.A.R. Increases in microcrustaceans (Cladocera and Copepoda) associated with phytoplankton peaks in tropical reservoirs. Trop Ecol. 2016, 57, 523–532. [Google Scholar]
  26. Ventelä, A.M.; Wiackowski, K.; Moilanen, M.; Saarikari, V.; Vuorio, K.; Sarvala, J. The effect of small zooplankton on the microbial loop and edible algae during a cyanobacterial bloom. Freshw. Biol. 2002, 47, 1807–1819. [Google Scholar] [CrossRef]
  27. Umi, W.A.D.; Yusoff, F.M.; Aris, A.Z.; Sharip, Z. Rotifer community structure in tropical lakes with different environmental characteristics related to ecosystem health. J. Environ. Biol. 2018, 39, 795–807. [Google Scholar] [CrossRef]
  28. Lorenzen, C.J. Determination of chlorophyll and pheo-pigments: Spectrophotometric equations. Limnol. Oceanogr. 1967, 12, 343–346. [Google Scholar] [CrossRef]
  29. Kitamura, H.; Ishitani, H.; Kuge, Y.; Nakamoto, M. Determination of nitrate in freshwater and seawater by a hydrazine reduction method. Jpn. J. Water Pollut. Res. 1982, 5, 35–42. [Google Scholar] [CrossRef]
  30. Jeffries, D.S.; Dieken, F.P.; Jones, D.E. Performance of the autoclave digestion method for total phosphorus analysis. Water Res. 1979, 13, 275–279. [Google Scholar] [CrossRef]
  31. American Public Health Association. Standard Methods for the Examination of Water and Wastewate, 21st ed.; American Public Health Association/American Water Works Association/Water Environment Federation: Washington, DC, USA, 2005. [Google Scholar]
  32. Carlson, R.E. A trophic state index for lakes. Limnol. Oceanogr. 1977, 22, 361–369. [Google Scholar] [CrossRef] [Green Version]
  33. Lee, W.Y.; McAlice, B.J. Sampling variability of marine zooplankton in a tidal estuary. Estuar. Coast. Mar. Sci. 1979, 8, 565–582. [Google Scholar] [CrossRef]
  34. Lai, H.C.; Fernando, C.H. The freshwater calanoida (crustacea: Copepoda) of Singapore and Peninsular Malaysia. Hydrobiologia 1978, 61, 113–127. [Google Scholar] [CrossRef]
  35. Fernando, C.H.; Ponyi, J.E. The freeliving freshwater cyclopoid Copepoda (Crustacea) of Malaysia and Singapore. Hydrobiologia 1981, 78, 113–123. [Google Scholar] [CrossRef]
  36. Idris, B.A.G. Freshwater Zooplankton of Malaysia (Crustacea: Cladocera); Universiti Pertanian Malaysia Press: Serdang, Malaysia, 1983. [Google Scholar]
  37. Shield, R.J. A Guide to Identification of Rotifers, Cladocerans and Copepods from Australian Inland Waters; Co-operative Research Centre for Freshwater Ecology: Albury, Australia, 1995. [Google Scholar]
  38. Alekseev, V.R.; Haffner, D.G.; Vaillant, J.J.; Yusoff, F.M. Cyclopoid and calanoid copepod biodiversity in Indonesia. J. Limnol. 2013, 72, 245–274. [Google Scholar] [CrossRef]
  39. Sinev, A.Y.; Yusoff, F.M. Cladocera (Crustacea: Branchiopoda) of Sabah state in Borneo Island, Malaysia. Zootaxa 2015, 4000, 581–591. [Google Scholar] [CrossRef]
  40. Sinev, A.Y.; Yusoff, F.M. New data on Cladocera (Crustacea: Branchiopoda) of Sabah State, Borneo Island, Malaysia. Zootaxa 2018, 4438, 362–372. [Google Scholar] [CrossRef]
  41. Clarke, K.R.; Warwick, R.M. A further biodiversity index applicable to species lists: Variation in taxonomic distinctness. Mar. Ecol. Prog. Ser. 2001, 216, 265–278. [Google Scholar] [CrossRef]
  42. Ter Braak, C.J.; Verdonschot, P.F. Canonical correspondence analysis and related multivariate methods in aquatic ecology. Aquat. Sci. 1995, 57, 255–289. [Google Scholar] [CrossRef]
  43. Tang, K.H.D. Climate change in Malaysia: Trends, contributors, impacts, mitigation and adaptations. Sci. Total Environ. 2019, 650, 1858–1871. [Google Scholar] [CrossRef]
  44. Baharim, N.B.; Yusop, Z.; Yusoff, I.; Tahir, W.Z.W.M.; Askari, M.; Othman, Z.; Abidin, M.R.Z. The relationship between heavy metals and trophic properties in Sembrong Lake, Johor. Sains Malays. 2016, 45, 43–53. [Google Scholar]
  45. Wu, Z.; Lai, X.; Zhang, L.; Cai, Y.; Chen, Y. Phytoplankton chlorophyll a in Lake Poyang and its tributaries during dry, mid-dry and wet seasons: A 4-year study. Knowl. Manag. Aquat. Ecosyst. 2014, 6, 13. [Google Scholar] [CrossRef]
  46. Sharip, Z.; Zaki, A.T.; Shapai, M.A.; Suratman, S.; Shaaban, A.J. Lakes of Malaysia: Water quality, eutrophication and management. Lakes Reserv. Res. Manag. 2014, 19, 130–141. [Google Scholar] [CrossRef]
  47. Meor Hussain, M.A.F.; Ahyaudin, A.; Amir Shah, R.; Shah, M. The structure and dynamics of net-zooplankton communities of the littoral versus limnetic zone of a typical embayment in a small flow through tropical reservoir. J. Biosci. 2002, 13, 23–34. [Google Scholar]
  48. Shah, A.S.R.M.; Ismail, J.; Latief, D.; Omar, W.M.W. The spatial structure of zooplankton communities of Pedu Reservoir, Malaysia. Wetland Sci. 2012, 10, 423–428. [Google Scholar]
  49. Shabdin, M.L.; Ismail, N.; ak Chukong, N.; Yusoff, N.K.; Ngau, H.T. Freshwater zooplankton of Bakun dam Sarawak, Malaysia. Asian J. Biol. Life Sci. 2014, 3, 120–124. [Google Scholar]
  50. Ismail, A.H.; Adnan, A.A.M. Zooplankton composition and abundance as indicators of eutrophication in two small man-made lakes. Trop. Life Sci. Res. 2016, 27, 31–38. [Google Scholar] [CrossRef]
  51. Pinto-Coelho, R.; Pinel-Alloul, B.; Méthot, G.; Havens, K.E. Crustacean zooplankton in lakes and reservoirs of temperate and tropical regions: Variation with trophic status. Can. J. Fish Aquat. Sci. 2005, 62, 348–361. [Google Scholar] [CrossRef] [Green Version]
  52. Dejen, E.; Vijverberg, J.; Nagelkerke, L.A.; Sibbing, F.A. Temporal and spatial distribution of microcrustacean zooplankton in relation to turbidity and other environmental factors in a large tropical lake (L. Tana, Ethiopia). Hydrobiologia 2004, 513, 39–49. [Google Scholar] [CrossRef] [Green Version]
  53. Okogwu, O.I.; Nwani, C.D.; Ugwumba, A.O. Seasonal variations in the abundance and biomass of microcrustaceans in relation to environmental variables in two shallow tropical lakes within the cross river floodplain, Nigeria. Acta Zool. Litu. 2009, 19, 205–215. [Google Scholar] [CrossRef]
  54. Chang, C.W.; Shiah, F.K.; Wu, J.T.; Miki, T.; Hsieh, C.H. The role of food availability and phytoplankton community dynamics in the seasonal succession of zooplankton community in a subtropical reservoir. Limnologica 2014, 46, 131–138. [Google Scholar] [CrossRef]
  55. Josué, I.I.; Cardoso, S.J.; Miranda, M.; Mucci, M.; Ger, K.A.; Roland, F.; Marinho, M.M. Cyanobacteria dominance drives zooplankton functional dispersion. Hydrobiologia 2019, 831, 149–161. [Google Scholar] [CrossRef]
  56. Offem, B.O.; Ayotunde, E.O.; Ikpi, G.U.; Ada, F.B.; Ochang, S.N. Plankton-based assessment of the trophic state of three tropical lakes. J. Environ. Prot. 2011, 2, 304–315. [Google Scholar] [CrossRef] [Green Version]
  57. Oberhaus, L.; Gélinas, M.; Pinel-Alloul, B.; Ghadouani, A.; Humbert, J.F. Grazing of two toxic Planktothrix species by Daphnia pulicaria: Potential for bloom control and transfer of microcystins. J. Plankton Res. 2007, 29, 827–838. [Google Scholar] [CrossRef] [Green Version]
  58. Agasild, H.; Nõges, T. Cladoceran and rotifer grazing on bacteria and phytoplankton in two shallow eutrophic lakes: In situ measurement with fluorescent microspheres. J. Plankton Res. 2005, 27, 1155–1174. [Google Scholar] [CrossRef] [Green Version]
  59. Chen, F.; Xie, P. The effects of fresh and decomposed Microcystis aeruginosa on cladocerans from a subtropic Chinese lake. J. Freshw. Ecol. 2003, 18, 97–104. [Google Scholar] [CrossRef] [Green Version]
  60. Wylie, J.L.; Currie, D.J. The relative importance of bacteria and algae as food sources for crustacean zooplankton. Limnol. Oceanogr. 1991, 36, 708–728. [Google Scholar] [CrossRef]
  61. Gophen, M.; Cavari, B.Z.; Berman, T. Zooplankton feeding on differentially labelled algae and bacteria. Nature 1974, 247, 393–394. [Google Scholar] [CrossRef]
  62. Starling, F.D.R. Comparative study of the zooplankton composition of six lacustrine ecosystems in Central Brazil during the dry season. Rev. Bras. Biol. 2000, 60, 101–111. [Google Scholar] [CrossRef] [Green Version]
  63. Duigan, C.A.; Reid, S.; Monteith, D.T.; Bennion, H.; Seda, J.M.; Hutchinson, J. The past, present and future of Llangorse Lake—A shallow nutrient-rich lake in the Brecon Beacons National Park, Wales, UK. Aquat. Conserv. 1999, 9, 329–341. [Google Scholar] [CrossRef]
  64. Wang, S.; Xie, P.; Wu, S.; Wu, A. Crustacean zooplankton distribution patterns and their biomass as related to trophic indicators of 29 shallow subtropical lakes. Limnologica 2007, 37, 242–249. [Google Scholar] [CrossRef] [Green Version]
  65. Guevara, G.; Lozano, P.; Reinoso, G.; Villa, F. Horizontal and seasonal patterns of tropical zooplankton from the eutrophic Prado Reservoir (Colombia). Limnologica 2009, 39, 128–139. [Google Scholar] [CrossRef] [Green Version]
  66. Diel, P.; Kiene, M.; Martin-Creuzburg, D.; Laforsch, C. Knowing the enemy: Inducible defences in freshwater zooplankton. Diversity 2020, 12, 147. [Google Scholar] [CrossRef] [Green Version]
  67. Sampaio, E.V.; Rocha, O.; Matsumura-Tundisi, T.; Tundisi, J.G. Composition and abundance of zooplankton in the limnetic zone of seven reservoirs of the Paranapanema River, Brazil. Braz. J. Biol. 2002, 62, 525–545. [Google Scholar] [CrossRef]
  68. Bini, L.M.; da Silva, L.C.F.; Velho, L.F.M.; Bonecker, C.C.; Lansac-Tôha, F.A. Zooplankton assemblage concordance patterns in Brazilian reservoirs. Hydrobiologia 2008, 598, 247–255. [Google Scholar] [CrossRef]
  69. Deng, D.; Xie, P.; Zhou, Q.; Yang, H.; Guo, L.; Geng, H. Field and experimental studies on the combined impacts of cyanobacterial blooms and small algae on crustacean zooplankton in a large, eutrophic, subtropical, Chinese lake. Limnology 2008, 9, 1–11. [Google Scholar] [CrossRef]
  70. Guo, N.; Xie, P. Development of tolerance against toxic Microcystis aeruginosa in three cladocerans and the ecological implications. Environ. Pollut. 2006, 143, 513–518. [Google Scholar] [CrossRef]
  71. Paes, T.A.S.V.; Costa, I.A.S.D.; Silva, A.P.C.; Eskinazi-Sant’Anna, E.M. Can microcystins affect zooplankton structure community in tropical eutrophic reservoirs? Braz. J. Biol. 2016, 76, 450–460. [Google Scholar] [CrossRef]
  72. Lampert, W. Laboratory studies on zooplankton-cyanobacteria interactions. N. Z. J. Mar. Freshw. Res. 1987, 21, 483–490. [Google Scholar] [CrossRef]
  73. Sun, X.; Tao, M.; Qin, B.; Qi, M.; Niu, Y.; Zhang, J.; Ma, Z.; Xie, P. Large-scale field evidence on the enhancement of small-sized cladocerans by Microcystis blooms in Lake Taihu, China. J. Plankton Res. 2012, 34, 853–863. [Google Scholar] [CrossRef]
  74. Degans, H.; De Meester, L. Top-down control of natural phyto-and bacterioplankton prey communities by Daphnia magna and by the natural zooplankton community of the hypertrophic Lake Blankaart. Hydrobiologia 2002, 479, 39–49. [Google Scholar] [CrossRef]
  75. Cerbin, S.; Balayla, D.J.; Van de Bund, W.J. Small-scale distribution and diel vertical migration of zooplankton in a shallow lake (Lake Naardermeer, The Netherlands). Hydrobiologia 2003, 491, 111–117. [Google Scholar] [CrossRef] [Green Version]
  76. Nogueira, M.G.; Reis Oliveira, P.C.; Tenorio de Britto, Y. Zooplankton assemblages (Copepoda and Cladocera) in a cascade of reservoirs of a large tropical river (SE Brazil). Limnetica 2008, 27, 151–170. [Google Scholar]
  77. Turner, J.T.; Tester, P.A. Zooplankton feeding ecology: Bacterivory by metazoan microzooplankton. J. Exp. Mar. Biol. Ecol. 1992, 160, 149–167. [Google Scholar] [CrossRef]
  78. Locke, A. Zooplankton responses to acidification: A review of laboratory bioassays. Water Air Soil Pollut. 1991, 60, 135–148. [Google Scholar] [CrossRef]
  79. Walseng, B.; Yan, N.D.; Schartau, A.K. Littoral microcrustacean (Cladocera and Copepoda) indicators of acidification in Canadian Shield lakes. AMBIO A J. Hum. Environ. 2003, 32, 208–213. [Google Scholar] [CrossRef]
  80. Caroni, R.; Irvine, K. The potential of zooplankton communities for ecological assessment of lakes: Redundant concept or political oversight? In Biology and Environment, Proceedings of the Royal Irish Academy; Royal Irish: Dublin, Ireland, 2010; pp. 35–53. [Google Scholar]
  81. Duigan, C.A.; Kovach, W.L. Relationships between littoral microcrustacea and aquatic macrophyte communities on the Isle of Skye (Scotland), with implications for the conservation of standing waters. Aquat. Conserv. 1994, 4, 307–331. [Google Scholar] [CrossRef]
  82. Berge, T.; Daugbjerg, N.; Andersen, B.B.; Hansen, P.J. Effect of lowered pH on marine phytoplankton growth rates. Mar. Ecol. Prog. Ser. 2010, 416, 79–91. [Google Scholar] [CrossRef]
  83. Richmond, C.; Marcus, N.H.; Sedlacek, C.; Miller, G.A.; Oppert, C. Hypoxia and seasonal temperature: Short-term effects and long-term implications for Acartia tonsa Dana. J. Exp. Mar. Biol. Ecol. 2006, 328, 177–196. [Google Scholar] [CrossRef]
  84. Karpowicz, M.; Ejsmont-Karabin, J.; Kozłowska, J.; Feniova, I.; Dzialowski, A.R. Zooplankton community responses to oxygen stress. Water 2020, 12, 706. [Google Scholar] [CrossRef] [Green Version]
  85. Doubek, J.P.; Campbell, K.L.; Doubek, K.M.; Hamre, K.; Lofton, M.; McClure, R.P.; Ward, N.K.; Carey, C.C. The effects of hypolimnetic anoxia on the diel vertical migration of freshwater crustacean zooplankton. Ecosphere 2018, 9, e02332. [Google Scholar] [CrossRef] [Green Version]
  86. Vanni, M.J. Freshwater zooplankton community structure: Introduction of large invertebrate predators and large herbivores to a small species community. Can. J. Fish Aquat. Sci. 1988, 45, 1758–1770. [Google Scholar] [CrossRef]
  87. Aka, M.; Pagano, M.; Saint-Jean, L.; Arfi, R.; Bouvy, M.; Cecchi, P.; Corbin, D.; Thomas, S. Zooplankton variability in 49 shallow tropical reservoirs of Ivory Coast (West Africa). Int. Rev. Hydrobiol. 2000, 85, 491–504. [Google Scholar] [CrossRef]
Figure 1. Map of Peninsular Malaysia and location of sampling stations in each lake (a) Sembrong, (b) Putrajaya and (c) Subang lakes.
Diversity 12 00322 g001
Figure 2. Vertical profiles of (a) water temperature, (b) dissolved oxygen, (c) pH, (d) turbidity, (e) total nitrogen, (f) total phosphorus and (g) chlorophyll a in different lakes. Arrows represent water depth (m) of lakes. Rectangular boxes indicate months with high rainfall (wet season).
Diversity 12 00322 g002
Figure 3. Two-dimensional principle component analysis (PCA) ordination of eigenvector scoring based on 13 physical and chemical parameters in different lakes. PC1 and PC2 explained 70.30% of the variance. TDS = total dissolved solid, TP = total phosphorus, DO = dissolved oxygen, TAN = total ammonium nitrogen, SRP = soluble reactive phosphorus, TN = total nitrogen, NO3-N + NO2-N = nitrate-N + nitrite-N.
Diversity 12 00322 g003
Figure 4. Dendrogram of microcrustacean densities (ind. L−1) illustrating that microcrustacean densities were clustered in three different groups corresponding to the three lakes.
Diversity 12 00322 g004
Figure 5. Monthly mean microcrustacean densities (ind. L−1) in Sembrong, Putrajaya and Subang lakes during the study period. Rectangular box (dashed line) indicates significantly low (p < 0.05) microcrustacean density during wet months. Vertical bars indicate standard error of the means (n = 18).
Diversity 12 00322 g005
Figure 6. Shade plot of monthly variations of microcrustacean species densities (ind. L−1) in Sembrong, Putrajaya and Subang lakes. White spaces denote absence of the species in that specific lake during the specific month/season; depth of colour scale is linearly proportional to a fourth-root transformation of density. Inserted rectangular box (dashed line) indicates the discriminator/dominant species in each lake.
Diversity 12 00322 g006
Figure 7. Bi-plots of the canonical correspondence analysis (CCA) for microcrustacean species and physical and chemical parameters showing the distribution of microcrustacean in relation to environmental conditions in different lakes. TP = total phosphorus, TDS = total dissolved solid, DO = dissolved oxygen, TAN = total ammonium nitrogen, SRP = soluble reactive phosphorus, TN = total nitrogen, NO3-N + NO2-N = nitrate-N + nitrite-N, Chl. a = chlorophyll a, Cond. = conductivity, Turb. = turbidity, Temp. = water temperature, Transp. = transparency, Cc = Ceriodaphnia cornuta, Bl = Bosmina longirostris, Bd = Bosminopsis dietersi, De = Diaphanosoma exsicum, Mmic = Moina micrura, Ah = Anthalona harti, Tc = Thermocyclops crassus, Mm = Mongolodiaptomus malaindosinensis, Mt = Mesocyclops thermocyclopoides.
Diversity 12 00322 g007
Table 1. Means and ranges of physical and chemical parameters in Sembrong, Putrajaya and Subang lakes. Mean values with different letters indicate significant difference at p < 0.05. Mean value = mean ± SE (n = 72).
ParametersSembrong LakePutrajaya LakeSubang Lake
Mean ± SERangeMean ± SERangeMean ± SERange
Water temperature (°C)29.70 ± 0.31 b28.42–30.4830.53 ± 0.22 a30.05–31.4428.78 ± 0.22 b28.10–29.32
Dissolved oxygen (mg L−1)5.27 ± 0.44 b3.19–6.277.50 ± 0.37 a6.87–9.224.08 ± 0.17 b3.16–4.63
pH7.52 ± 0.22 a6.81–8.336.81 ± 0.28 a5.53–7.315.10 ± 0.15 b4.57–5.55
Turbidity (NTU)28.42 ± 2.90 a18.36–36.6313.16 ± 0.75 b10.58–14.864.61 ± 0.45 c2.89–6.30
Total dissolved solid (mg L−1)116.10 ± 8.65 a95.42–151.2759.53 ± 1.97 b54.02–67.4425.40 ± 3.41 c19.65–41.98
Conductivity (µS cm−1)179.03 ± 13.35 a147.08–232.7398.97 ± 3.28 b89.23–109.2533.63 ± 1.73 c27.62–40.01
Water transparency (cm)30.8 ± 0.9 b24.3–36.8106.4 ± 1.2 a95.8–110.0116.6 ± 5.05 a95.2–152.7
Total phosphorus (µg L−1)140.23 ± 8.51 a90.18–180.8930.19 ± 15.9 b17.90–39.5024.16 ± 9.41 b14.90–40.65
Soluble reactive phosphorus (µg L−1)40.06 ± 10.7 a10.90–100.4520.83 ± 0.90 b10.88–20.6640.22 ± 5.18 a10.65–70.15
Total nitrogen (µg L−1)226.08 ± 76.4 a192.15–274.60117.80 ± 28.8 b40.66–218.90126.56 ± 45.20 b94.50–171.88
Nitrate-N + Nitrite-N (µg L−1)43.33 ± 10.91 a20.22–66.5432.12 ± 19.13 b28.08–44.1526.28 ± 18.56 b19.05–40.05
Total ammonium nitrogen (µg L−1)80.19 ± 31.42 b13.42–144.2035.64 ± 10.55 c25.10–56.22160.28 ± 33.40 a97.22–260.82
Chlorophyll a (µg L−1)97.19 ± 4.70 a64.94–142.615.53 ± 0.65 b1.10–9.964.64 ± 1.12 b1.15–7.57
Rainfall (mm)178.87 ± 20.12 b107.80–328.20139.90 ± 15.87 b48.60–261.80301.27 ± 32.09 a68.80–427.80
Depth (m)3.90 ± 0.14 b2.90–5.103.30 ± 0.20 b2.00–5.007.04 ± 0.29 a5.50–9.10
Different superscript letters (a–c) indicate significant difference (p < 0.05). Bold fonts indicate variables that were used to calculate the trophic status index.
Table 2. Carlson trophic status index (CTSI) (Range: <30–40 = Oligotrophic; 40–50 = Mesotrophic; 50–70 = Eutrophic; 70–100+ = Hypereutrophic) of lakes [24] based on water transparency, total phosphorus and chlorophyll a.
IndicesSembrong LakePutrajaya LakeSubang Lake
TSI Water transparency77.1059.1247.73
TSI Total phosphorus74.3551.7749.61
TSI Chlorophyll a75.5047.5745.65
CTSI71.1153.3447.67
ClassificationHypereutrophicMeso-eutrophicMesotrophic
Table 3. Eigenvector, eigenvalue and % variations derived from the principle component analysis (PCA) of 13 physical and chemical parameters in the hypereutrophic Sembrong, the meso-eutrophic Putrajaya and the acidic-mesotrophic Subang lakes that explained 85.10% of the total variance.
VariablesPC1PC2PC3PC4
Water temperature0.060.52−0.060.12
Dissolved oxygen (DO)−0.010.56−0.19−0.12
pH0.360.020.02−0.23
Turbidity0.320.22−0.01−0.16
Total dissolved solid (TDS)0.370.010.01−0.17
Conductivity0.350.010.320.01
Water transparency−0.380.030.06−0.16
Total phosphorus (TP)0.34−0.130.070.16
Soluble reactive phosphorus (SRP)0.03−0.21−0.84−0.32
Total nitrogen (TN)0.28−0.240.01−0.33
Nitrate-N + Nitrite-N (NO3-N + NO2-N)−0.22−0.020.38−0.76
Total ammonium nitrogen (TAN)−0.07−0.500.050.19
Chlorophyll a0.35−0.05−0.020.04
Eigenvalues6.432.721.080.84
% Variation49.4020.908.306.50
Cum. % Variation49.4070.3078.685.10
Bold fonts indicate major variables that contributed to principle components (PC).
Table 4. Pairwise R-statistical values and significant levels (p) for two-way analysis of similarities (ANOSIM) test on microcrustacean densities in different lakes with Global R = 0.85.
Group (Lakes)R Significance Level (%)p (%)
Sembrong lake, Putrajaya lake0.880.1
Putrajaya lake, Subang lake0.890.1
Sembrong lake, Subang lake0.870.1
Table 5. Percentage contribution (%) of major microcrustacean species (>70%) for each lake based on similarity percentage (SIMPER) analysis. Av. Sim = average similarities, Contrib % = contribution percentages.
SpeciesSembrong LakePutrajaya LakeSubang Lake
Av. SimContrib %Av. SimContrib %Av. SimContrib %
Bosmina longirostris 18.2022.03
Ceriodaphnia cornuta25.7430.6715.3918.63
Mesocyclops thermocyclopoides18.2021.6913.5716.4329.3940.22
Mongolodiaptomus malaindosinensis17.4220.7613.3516.16
Thermocyclops crassus 22.6631.02

