Article

Functional Diversity Changes after Selective Thinning in a Tropical Mountain Forest in Southern Ecuador

1
Department of Biological Sciences, Universidad Técnica Particular de Loja, San Cayetano Alto s/n, 1101608 Loja, Ecuador
2
Chair of Silviculture, Center of Life and Food Sciences Weihenstephan, Technical University of Munich, Hans-Carl-von-Carlowitz-Platz 2, 85354 Freising, Germany
3
Institut für Internationale Waldwirtschaft und Forstökonomie, Leuschnerstraße 91, 21031 Hamburg-Bergedorf, Germany
4
Department of Geology and Mine, and Civil Engineering (DGMIC), Universidad Técnica Particular de Loja, San Cayetano Alto s/n, 1101608 Loja, Ecuador
*
Author to whom correspondence should be addressed.
Diversity 2020, 12(6), 256; https://doi.org/10.3390/d12060256
Submission received: 27 March 2020 / Revised: 18 June 2020 / Accepted: 19 June 2020 / Published: 23 June 2020
(This article belongs to the Section Plant Diversity)

Abstract

:
Background: The impact of selective thinning on forest diversity has been extensively studied in temperate and boreal regions. However, in the tropics, knowledge is still poor regarding the impacts of this silvicultural treatment on functional diversity, especially in tropical mountain forests, which are considered to be highly biodiverse ecosystems and also endangered by human activities. By evaluating the changes on functional diversity by using different indicators, hypothesizing that selective thinning significantly affects (directly or indirectly) tropical mountain forests, this work promotes sustainable ecosystem use. Methods: A total of 52 permanent plots of 2500 m2 each were installed in a primary mountain forest in the San Francisco Biological Reserve to assess the impact of this silvicultural treatment. Selective thinning can be defined as a controlled process, in which trees that compete with ecologically and/or valuable timber species are progressively removed to stimulate the development of profitable ones, called potential crop trees (PCT). In doing so, the best specimens remain in the forest stand until their final harvest. After PCT selection, 30 plots were chosen for the intervention, while 22 plots served as control plots. The thinning intensity fluctuated between 4 and 56 trees ha−1 (average 18.8 ± 12.1 stems ha−1). Functional Diversity (FD) indices, including the community weighted mean (CWM), were determined based on six traits using the FD package implemented in R software. The difference between initial and final conditions of functional richness (FRic), functional divergence (FDiv), functional evenness (FEve), functional dispersion (FDis), and Rao quadratic entropy (RaoQ) was modeled using linear mixed models (LMM). As fixed factors, we used all the predictors inherent to structural and ecological forest conditions before and after the selective thinning and as a random variable, we used the membership to nested sampling units. Results: Functional Richness (FRic) showed significant changes after selective thinning, the other indexes (FEve, FDis, FDiv, RaoQ) were only influenced by predictors related to ecological conditions and characteristics of the community.

1. Introduction

Although natural tropical mountain forests (TMF) are highly valuable because of their biological richness and the provision of essential ecosystem services, they are disappearing at alarming rates [1], which is mainly due to anthropogenic land use changes [2,3,4,5]. This also holds true for southern Ecuador, where a large area of the natural TMF at the eastern foothills of the Cordillera Real have been converted into pasture land, agricultural land or secondary forests to meet the economic needs of the local population, producing food, fiber, wood and other goods [6,7]. According to Carreño-Rocabado et al. [8], land use change is one of the main drivers for biodiversity loss, which also seriously affects ecosystem functions and services. However, intensity, type and frequency of disturbance must also be considered as factors that influence the functionality of ecosystems [9,10].
In this context, forestry without proper planning causes loss of biodiversity and alters ecosystem functionality. To create a balance between exploitation and conservation of these ecosystems, sustainable forest management (SFM) must be implemented to make use of forest resources, while, at the same time, protecting the biodiversity [11,12]. One main aim of SFM is the development of sustainable management concepts, such as reduced impact logging (RIL), which establishes cutting cycles or defines a minimum cutting diameter (MCD) to counteract exploitative forest use [13,14,15].
In some tropical regions, e.g., Africa (Burkina Faso, Cameroon) and Asia (India, Indonesia), silvicultural treatments, such as selective thinning, have been applied for more than a century [16]. This practice, which aims at the minimizing of impacts on the integrity of natural forests and improving the productivity, was recently implemented in Ecuador. The treatment consists of eliminating species of low commercial value, which are competitors for valuable timber species. This practice is based on the theory that the growth rates of trees are directly related to the quantity of received sunlight and nutrient availability, and for this reason, all undesired or competitor trees around the valuable timber species are removed to obtain adequate lighting and to enhance nutrient availability [17,18]. Regarding the impact of selective thinning on functional diversity, we highlight the work carried out by de Avila et al. [19], and on the structure of the forest, the work of Yguel et al. [20]; both works conclude on the importance of assessing thinning and the impact it has on the forest’s richness. Existing forestry studies generally focus on documentation of timber species and their production [21], on the yield of agroforestry plantations [22], on reforestation methods with native or exotic species [23,24], as well as on payment schemes for forest ecosystem services [25,26,27,28]. Furthermore, information respective to the effects of tree removal in natural tropical forest stands, in terms of richness and diversity, is still scarce. Nonetheless, this knowledge is necessary to understand the natural processes and dynamics of these ecosystems in the follow-up of man-made disturbances.
Regulation concepts respective to the exploitation of natural tropical forests in Ecuador were developed some decades ago [29], which also included practices to cut undesired trees to enhance the growth of ecological and economical valuable species. However, no scientific assessments to evaluate the possible impacts of thinning on forest structure or diversity in these ecosystems have been made so far. The available literature focuses on forest types in the temperate and boreal zones [30,31], because in the tropics, the evaluation is more complex due to the large spatial extension of the different forest ecosystems and their extraordinary high biodiversity [5]. This also includes TMF, where the effects of silvicultural interventions and their impacts on taxonomic or functional diversity have not been evaluated yet.
In general, the Functional Diversity (FD) of an ecosystem is defined by multiple indicators, which include species characteristics, climatic gradients and water availability [32]. However, for a long time, species richness was the most widely used metric to assess ecosystem functionality, because it is assumed that a higher number of species within a forest community indicates a healthy and functional ecosystem [33]. This is not always true, because species richness also depends on forest type [34,35], which is why functional diversity can not only be analyzed in natural communities, but also in intervened communities. If measurable biological characteristics are directly related to ecological functions, the functional strategies of the species within a forest community can be described using functional features; that is, measurable biological characteristics related to ecological functions [20]. According to Violle et al. [33], functional traits can be monitored at different levels of organization (ecosystem, community, species or population), in which the number and type of traits vary according to the size of the species present, as well as in terms of forest taxonomic diversity.
However, the improvement of nutrients availability in forest soils also enhances growth but only for species with acquisitive traits (e.g., diametric growth, carbon storage), because species with functional conservative traits (e.g., number of stomata per cm2, dispersion syndrome) need adequate light [36]. These indicators must be adjusted with respect to the studied ecosystem and the specific silvicultural treatment applied [37].
Therefore, selective thinning should not only improve forest production of all desired tree species, but also obviate over fertilization, which might also have negative effects on the provided ecosystem services for the local and regional population [38,39,40]. Nonetheless, the impact that silvicultural treatments produce is a critical point of disagreement between conservationists and foresters because a reduction in diversity (e.g., timber extraction by thinning) might result in a loss of functionality [41]. This is shown by other studies [42,43], which indicate that ecosystem functionality is altered due to the loss of species, even if no significant changes in taxonomic diversity occurred. However, as Chaudhary et al. [44] clarified, these traditional approaches must be revised, because the impacts of silvicultural treatments can not only be limited to the relative loss of species. Unfortunately, only a few studies respective to impacts of selective thinning on diversity and forest structure, as well as on its effectiveness, have been published so far.
In this study, the response of TMF to selective thinning in southern Ecuador was investigated. The objective of the study was to evaluate the impact of selective thinning on the growth, diversity and functionality of the forest, and to answer the following question: Does species loss due to the implementation of selective thinning imply the loss of functional diversity of the natural stand?
The hypothesis tested was that selective thinning significantly affects functional diversity, due to the loss of species that naturally constitute the forest community. To this end, changes in the acquisitive and conservative traits of the species were analyzed and related to the intensity of thinning.

2. Materials and Methods
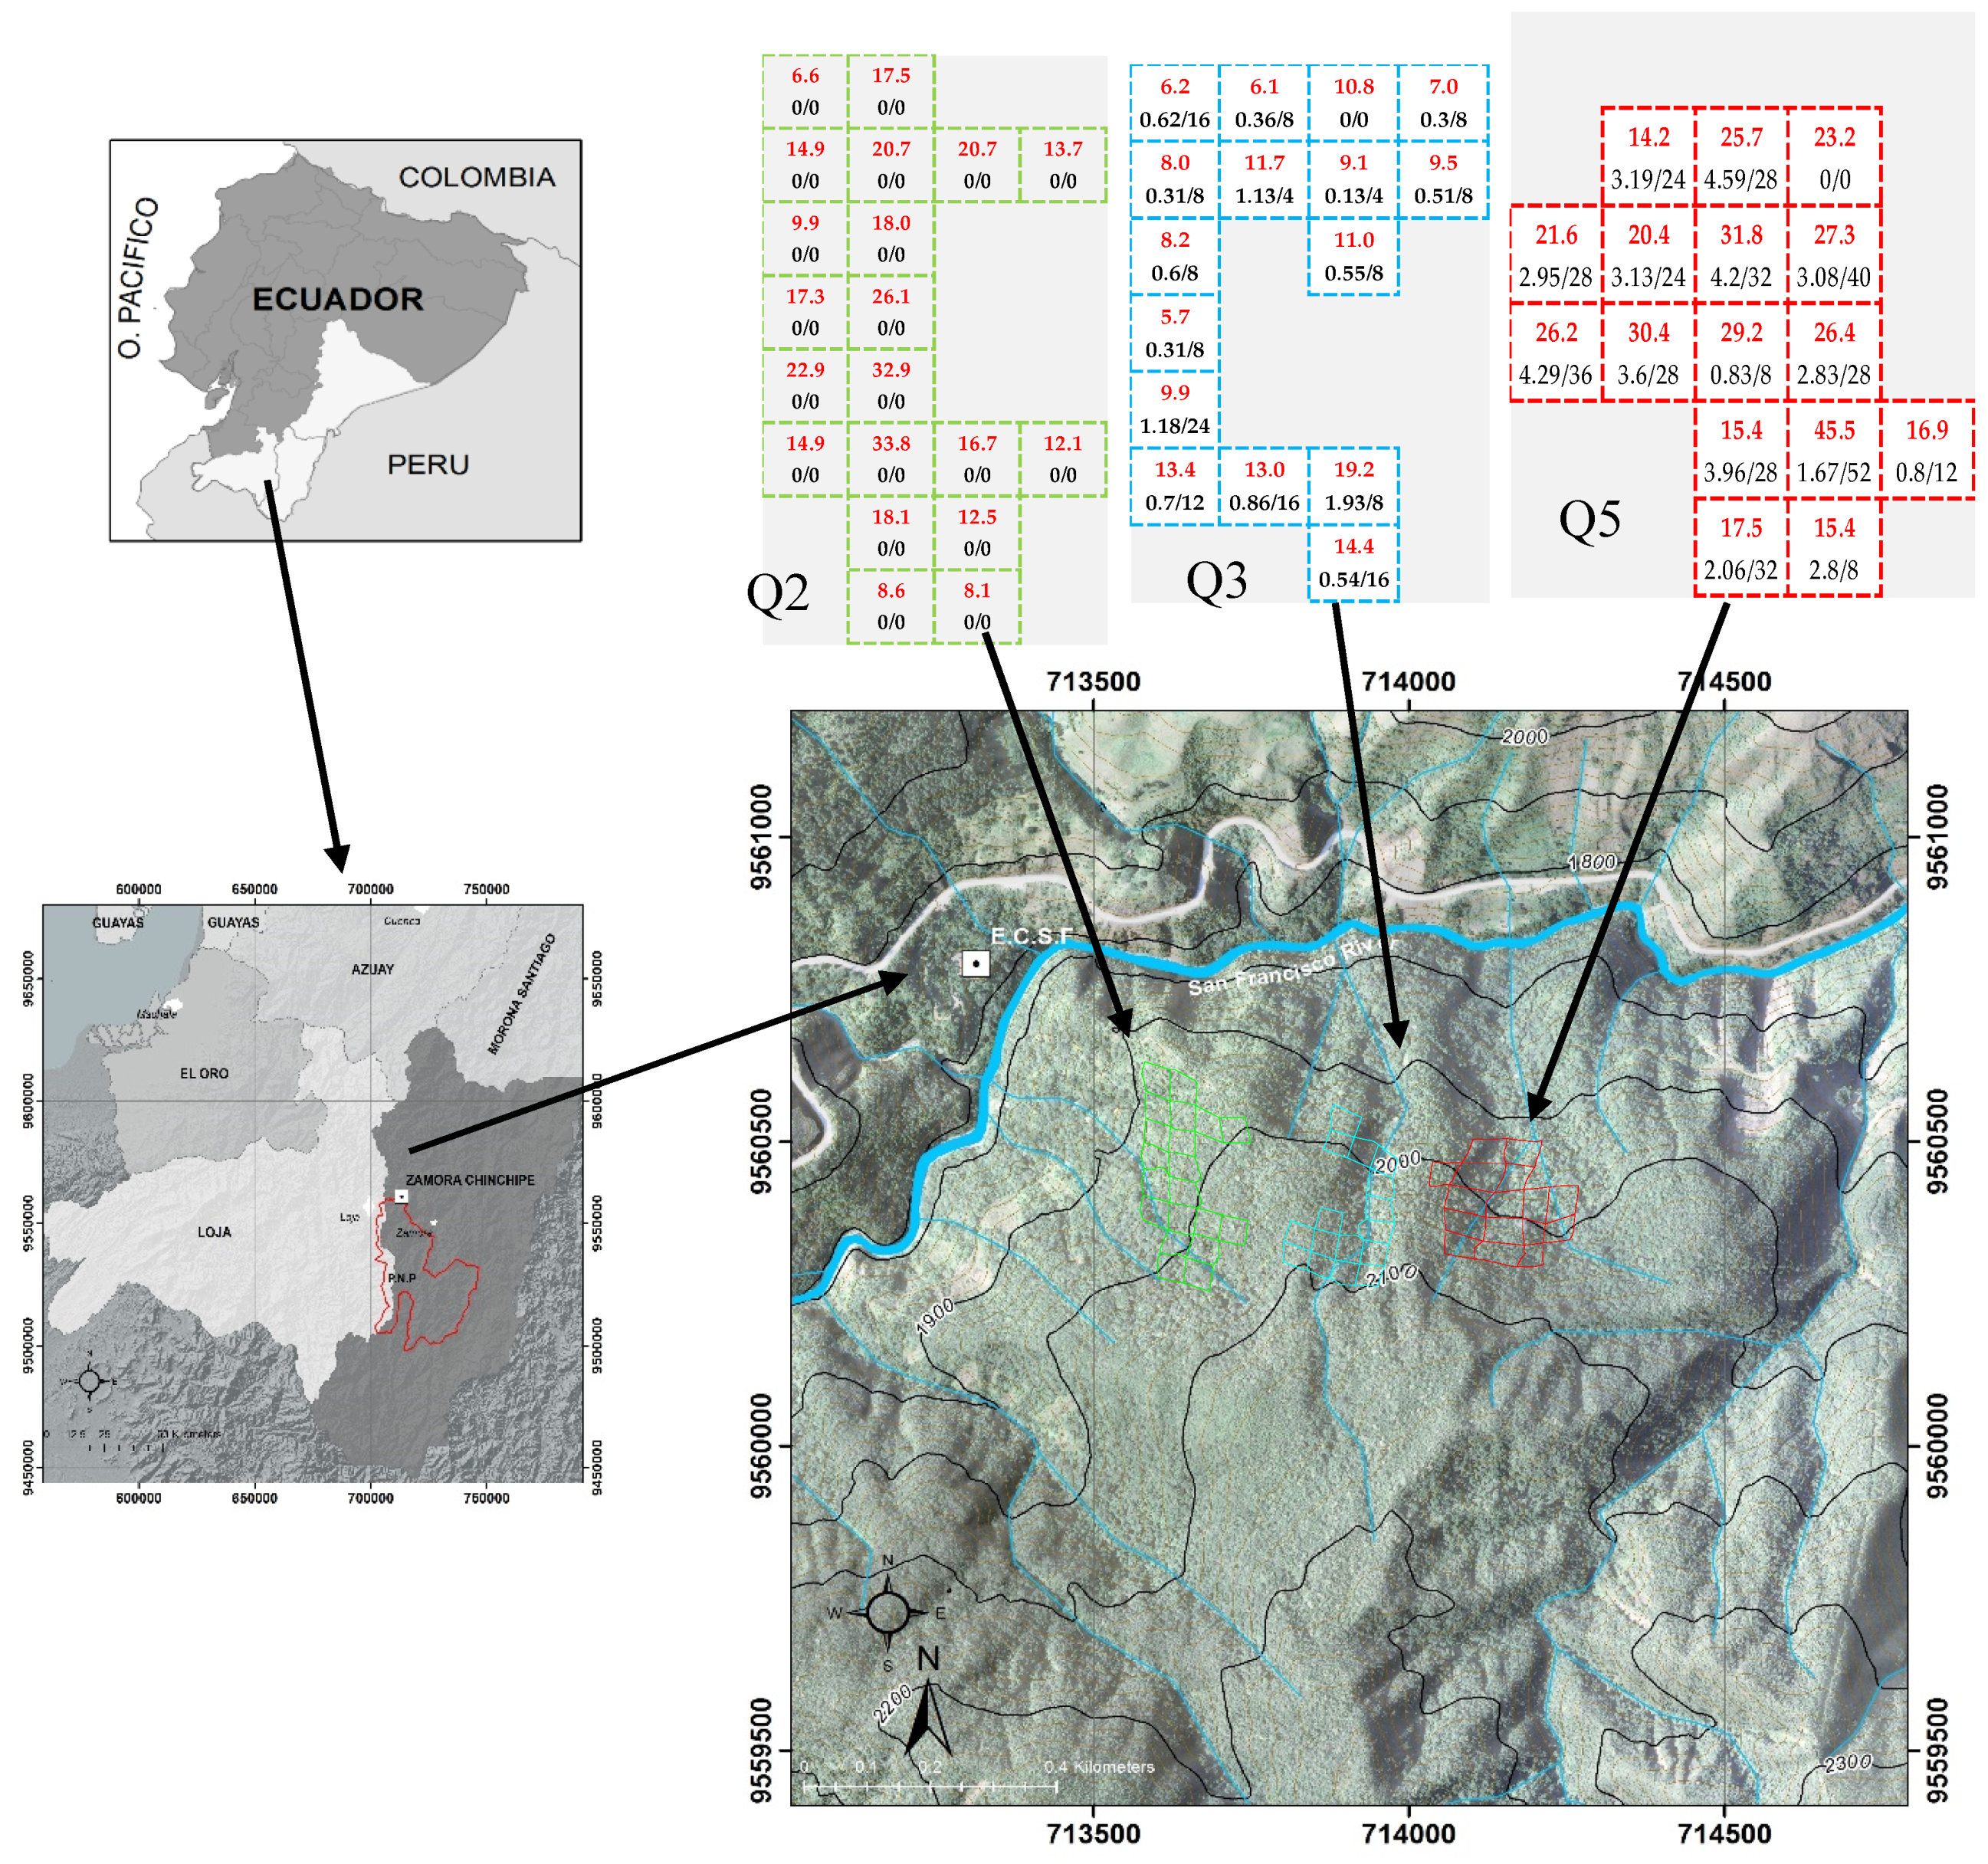
2.1. Study Area

The study was carried out in the primary TMF of the “Reserva Biológica San Francisco” (RBSF; 3°58′ S, 79°04′ W) [45], located on the eastern escarpment of the Ecuadorian Andes, within the San Francisco River watershed, which drains into the Amazon Basin [46]. Elevations range from ∼1700 m a.s.l. at the valley bottom to ∼3200 m a.s.l at the highest mountain peak, the Cerro del Consuelo.
The type of natural vegetation is evergreen TMF, which covers the slopes from the valley bottom up to the tree line at approximately 2700 m a.s.l [47]. The forest can be classified as lower montane forest (up to 2200 m a.s.l) and upper montane forest (from 2200 m a.s.l up to the tree line). These two forest types can be subdivided into ravine and ridge forest [48], in which ravine forest is characterized by bigger trees respective to basal areas and canopy heights, but by lower stem density, compared to ridge forests, where also less tree species are observed. Differences in forest structure are mainly due to climatic conditions, topography and prevailing soil types [49,50]. A more detailed description of the biophysical conditions and forest types in the study area can be found in Cabrera et al. [51], Paulsch [52] and Homeier et al. [53].

2.2. Plot Installation

Fifty-two permanent field plots of 2500 m2 each were installed in RBSF area within three gullies or micro-watersheds (Q = quebradas) in the lower montane forest at different altitudes (1860–2140 m a.s.l.). The plots were installed where the forest presented better conservation state and the presence of timber and ecologically important species was confirmed. Specifically, 16 plots were implemented in Q3 and in Q5, whereas 20 plots were created in Q2 (Figure 1). Respective to the forest type, all plots in Q5 belong to ravine forest, whereas all plots in Q3 are ridge forest. The plots in Q2 are mixed, which means that 6 plots belong to ridge forest, while the rest belongs to ravine forest. This results in a total of 30 plots belonging to ravine forest and 22 plots belonging to ridge forest (Supplementary Materials Figure S1). As reference or control plots, where no thinning activities were realized, one plot in Q3 and one in Q5 (K-plot; see Figure 1) and all plots in Q2 were chosen to obtain a balanced number of control plots for the ravine and ridge forest parts. For analysis, the two forest types were not separated because the full pool of valuable timber species were analyzed.
After plot installation, forest inventory was executed, in which a total of 2797 trees were found with a diameter at breast height (DBH) greater than 20.0 cm. These trees were labeled, and botanical samples were taken for their subsequent taxonomical identification at the LOJA Herbarium.

2.3. Selective Thinning and Intensity

Selective thinning consists of the elimination of competitors in order to improve light conditions and nutrient availability for desired timber species or other species which fulfill an important ecological role in the ecosystem (potential crop trees, PCT) [54,55]. To implement this silvicultural treatment, first, the PCTs inside each plot were identified (Supplementary Materials Table S2). As de Graaf et al. [55] defined, a commercial PCT species should have a DBH greater than 30 cm, with a healthy stem and good wood quality. In this study, ecologically important species were considered for which the DBH threshold was reduced to ≥20 cm to receive a better representation of PCT distribution and species frequency for this TMF.
After PCT selection, the strongest competitors for each PCT were identified. As an indication for competition degree, stem or crown overlap of the competitive specimens were determined, since they can limit the growth of the PCTs (light and nutrient availability). The subsequent removal of competitors by thinning included all tree species with DBH greater than 20.0 cm (total number: n = 138), with the exception of trees which belonged to rare species. All competitor trees were cut using the method of directional felling to minimize damages for the remaining forest stand [56]. The selective thinning was executed 18 months after the initial forest inventory, and during this period, the natural diametric growth of the PCTs was monitored using metal dendrometers [51]. Functional diversity analyses of the thinned and control plots were carried out one year and two years after the silvicultural treatment.

2.4. Assessing Impact of Selective Thinning on Functional Diversity

For the present research, the following traits were selected to determine the functional changes in this tropical mountain ecosystem after applying selective thinning: (1) Wood density (WD) [57,58,59,60]; (2) Average diameter (DBH); (3) Growth (annual diametric increase); (4) Type of leaf; (5) Ecological Guild [58,60]; (6) Dispersion syndrome (Table 1). Functional traits allow the analysis of the diversity and structure of the community [58], in contrast to conservative features, which are related to reproduction and succession.
WD was selected because this trait is connected to several aspects of plant ecology, including growth rate, carbon allocation strategy, structural stability, resistance to diseases or pests, and primary production [53,57,61], while the average DBH and growth are directly related to the silvicultural treatment applied. Leaf type is a functional trait which has been used to predict the growth of tropical trees [62] and which reflect adaptations that allow plants to live under various environmental conditions [63]. Here, we include the type of leaf in the FD analysis, as a way to indicate the plant’s strategy to acquire and redistribute nutrients for growth [61]. According to Xu et al. [64], there are differences between the species that have compound leaf and simple leaf species, so these categories can be assumed to have slow and fast metabolic rates, respectively. The simple leaves are easier to manufacture than the compound leaves, but this is compensated by the duration being the same, that is, a longer useful life of the compound leaves for the benefit of the plant. As a conservative trait (reproduction and succession, which are intrinsic to each individual species), the ecological guild or type of succession was used. The last trait, “Dispersal syndrome”, is closely related to the relative abundance of species [65]. In wet tropical forests that exhibit a large aggregation of specific trees at scales ranging from a few meters to a few hundred meters, the dominant syndrome is zoochory [66], while in the tropical dry forests, the dominant syndrome is the anemochory, which also leads to certain specific distribution patterns [65], although barochory is also a more frequent syndrome in dry forests than in wet tropical forests [67]. The implementation of selective thinning could cause changes in the forest structure by changing the dominant dispersal syndrome, reducing the individuals that belong to each species.

2.5. Data Acquisition

WD data for all tree species involved in the study were provided by the local RBSF database (TMF Database). In the event that a species was not listed, the data were acquired from the Global Wood Density Database (https://datadryad.org/), particularly as a subset for the Latin American region [57,65], or in ICRAF’s free and accessible database (functional attributes and the ecological database, http://db.worldagroforestry.org/wd). The monthly diametric growth was controlled by dendrometers fixed on each PCT tree [68]. For all tree species, the growth was determined by three general forest inventories carried out at 18 and 36 months after implementing the permanent plots. The stem density was determined by counting all individuals of a species before and after selective thinning. The leaf type was identified directly after botanical collections and observations in the field, while the ecological guild and the dispersion syndrome of each species were determined using attributes and ecological characteristics as described by Palacios et al. [60] and Jara et al. [65].

2.6. Statistical Analysis

To determine the functional diversity (FD) multi-trait indices and CWM for this TMF after selective thinning, the FD package was used [69] and the following indices were included:
-
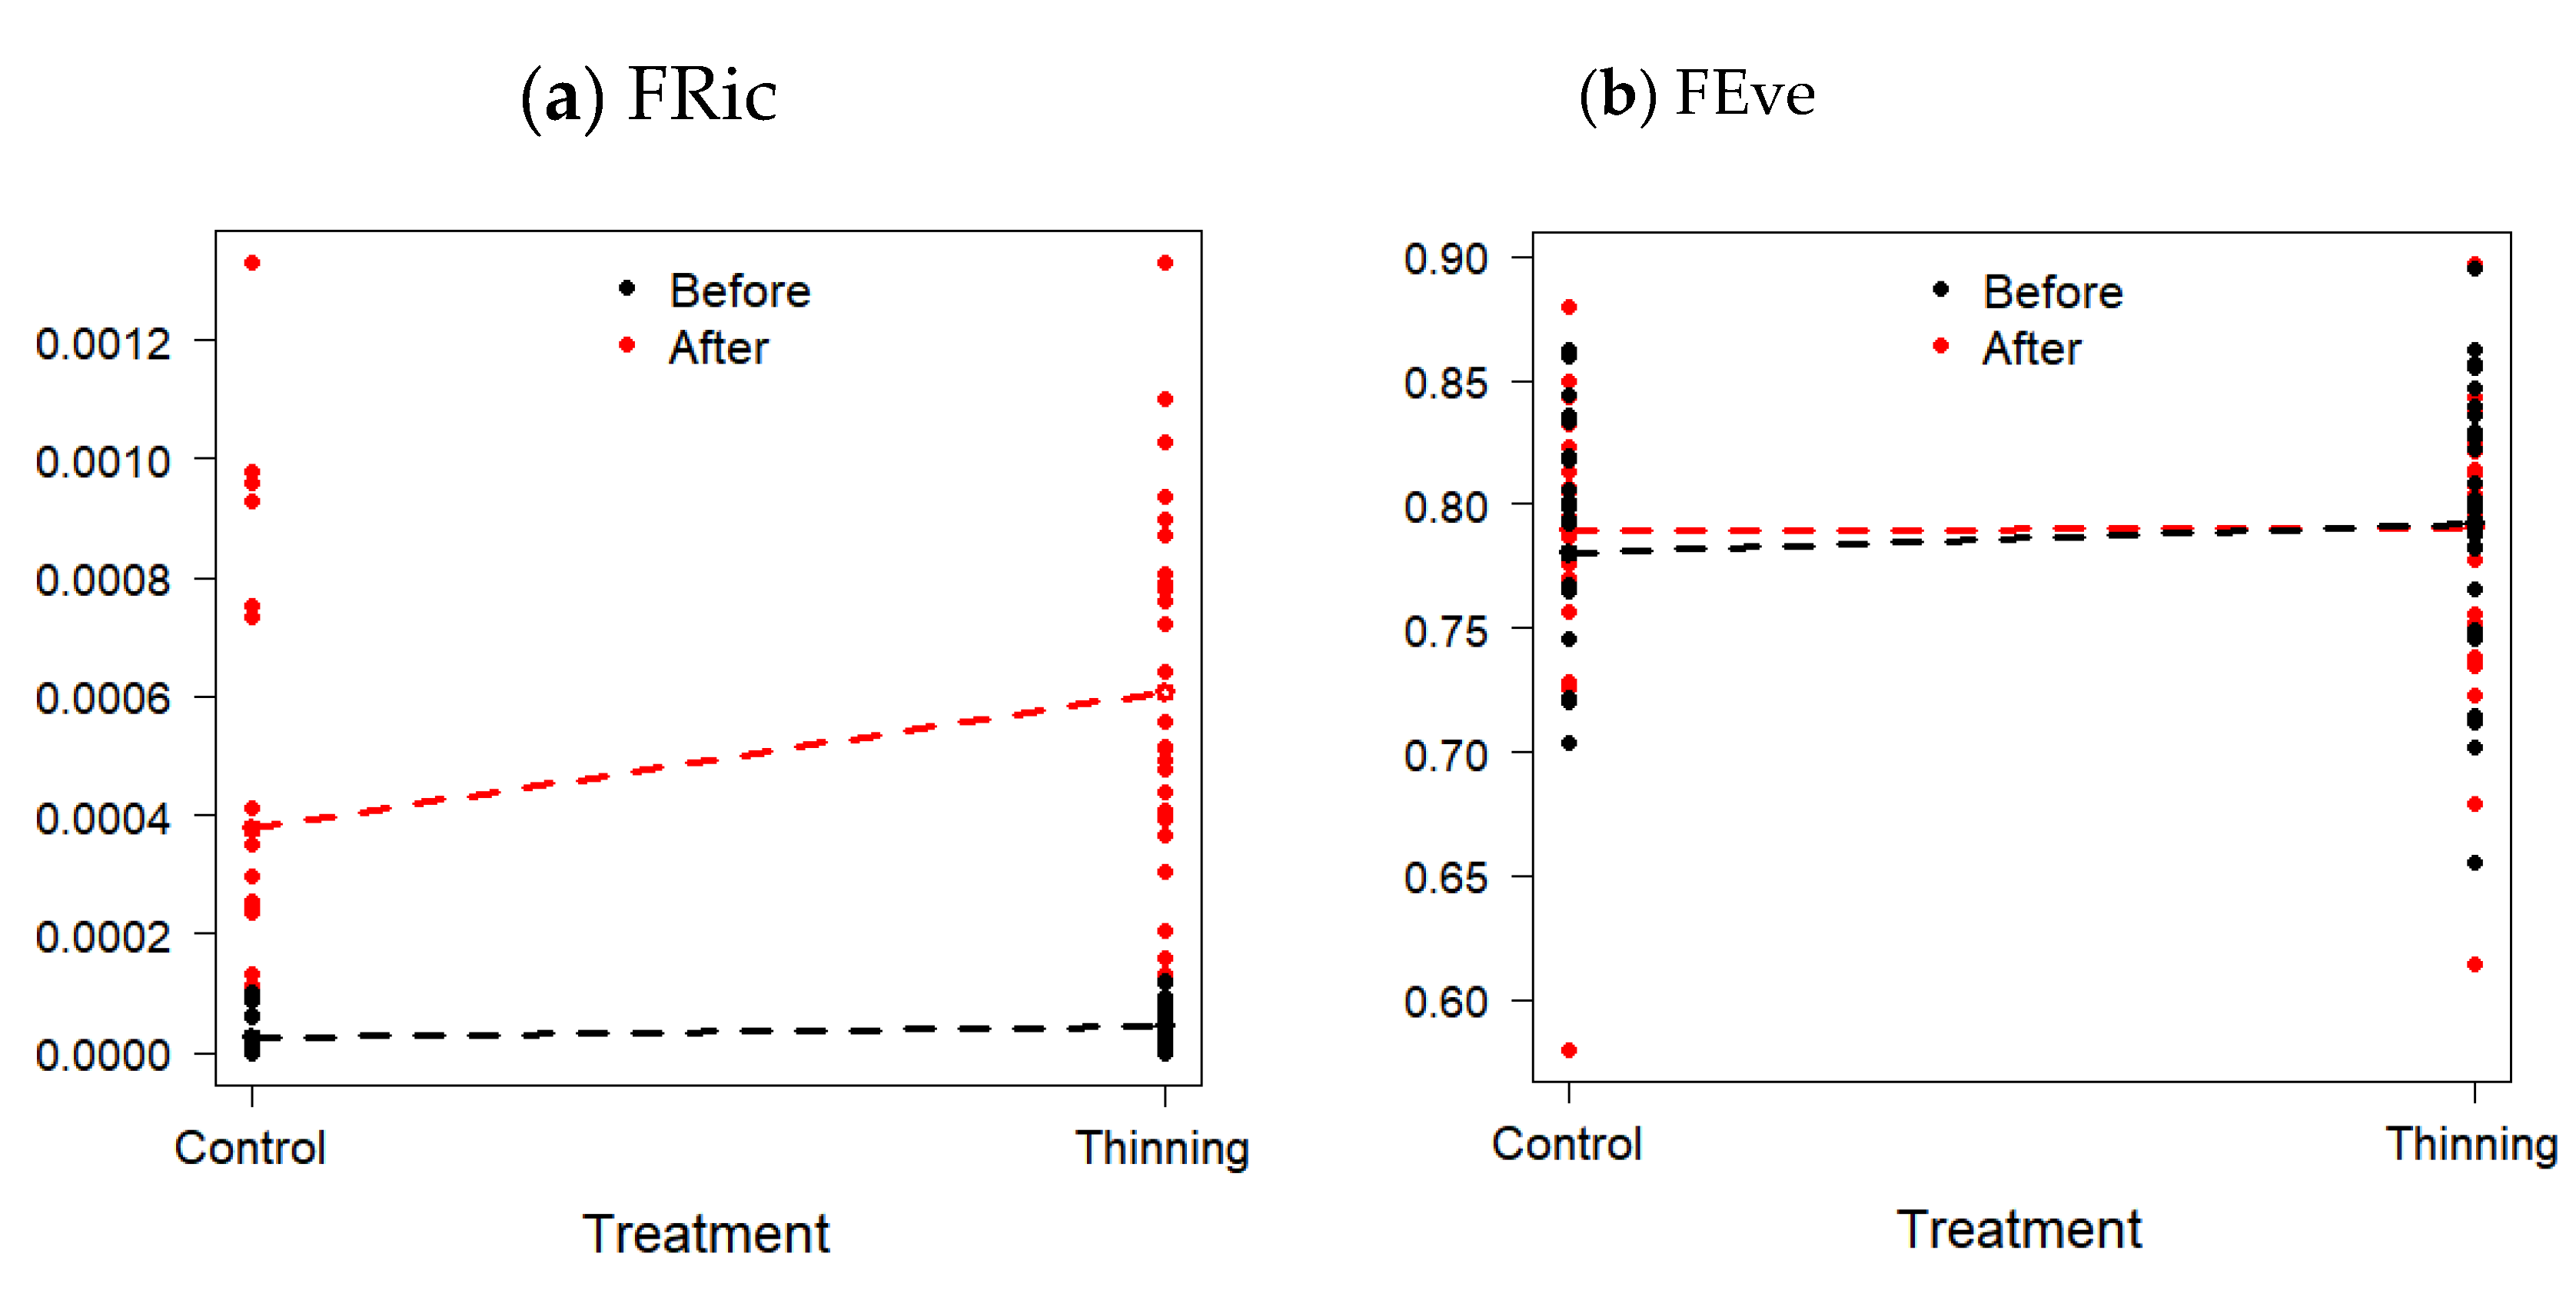
Functional Richness (FRic), which represents the amount of space occupied by a community, independent from the relative abundances of the species [70].
-
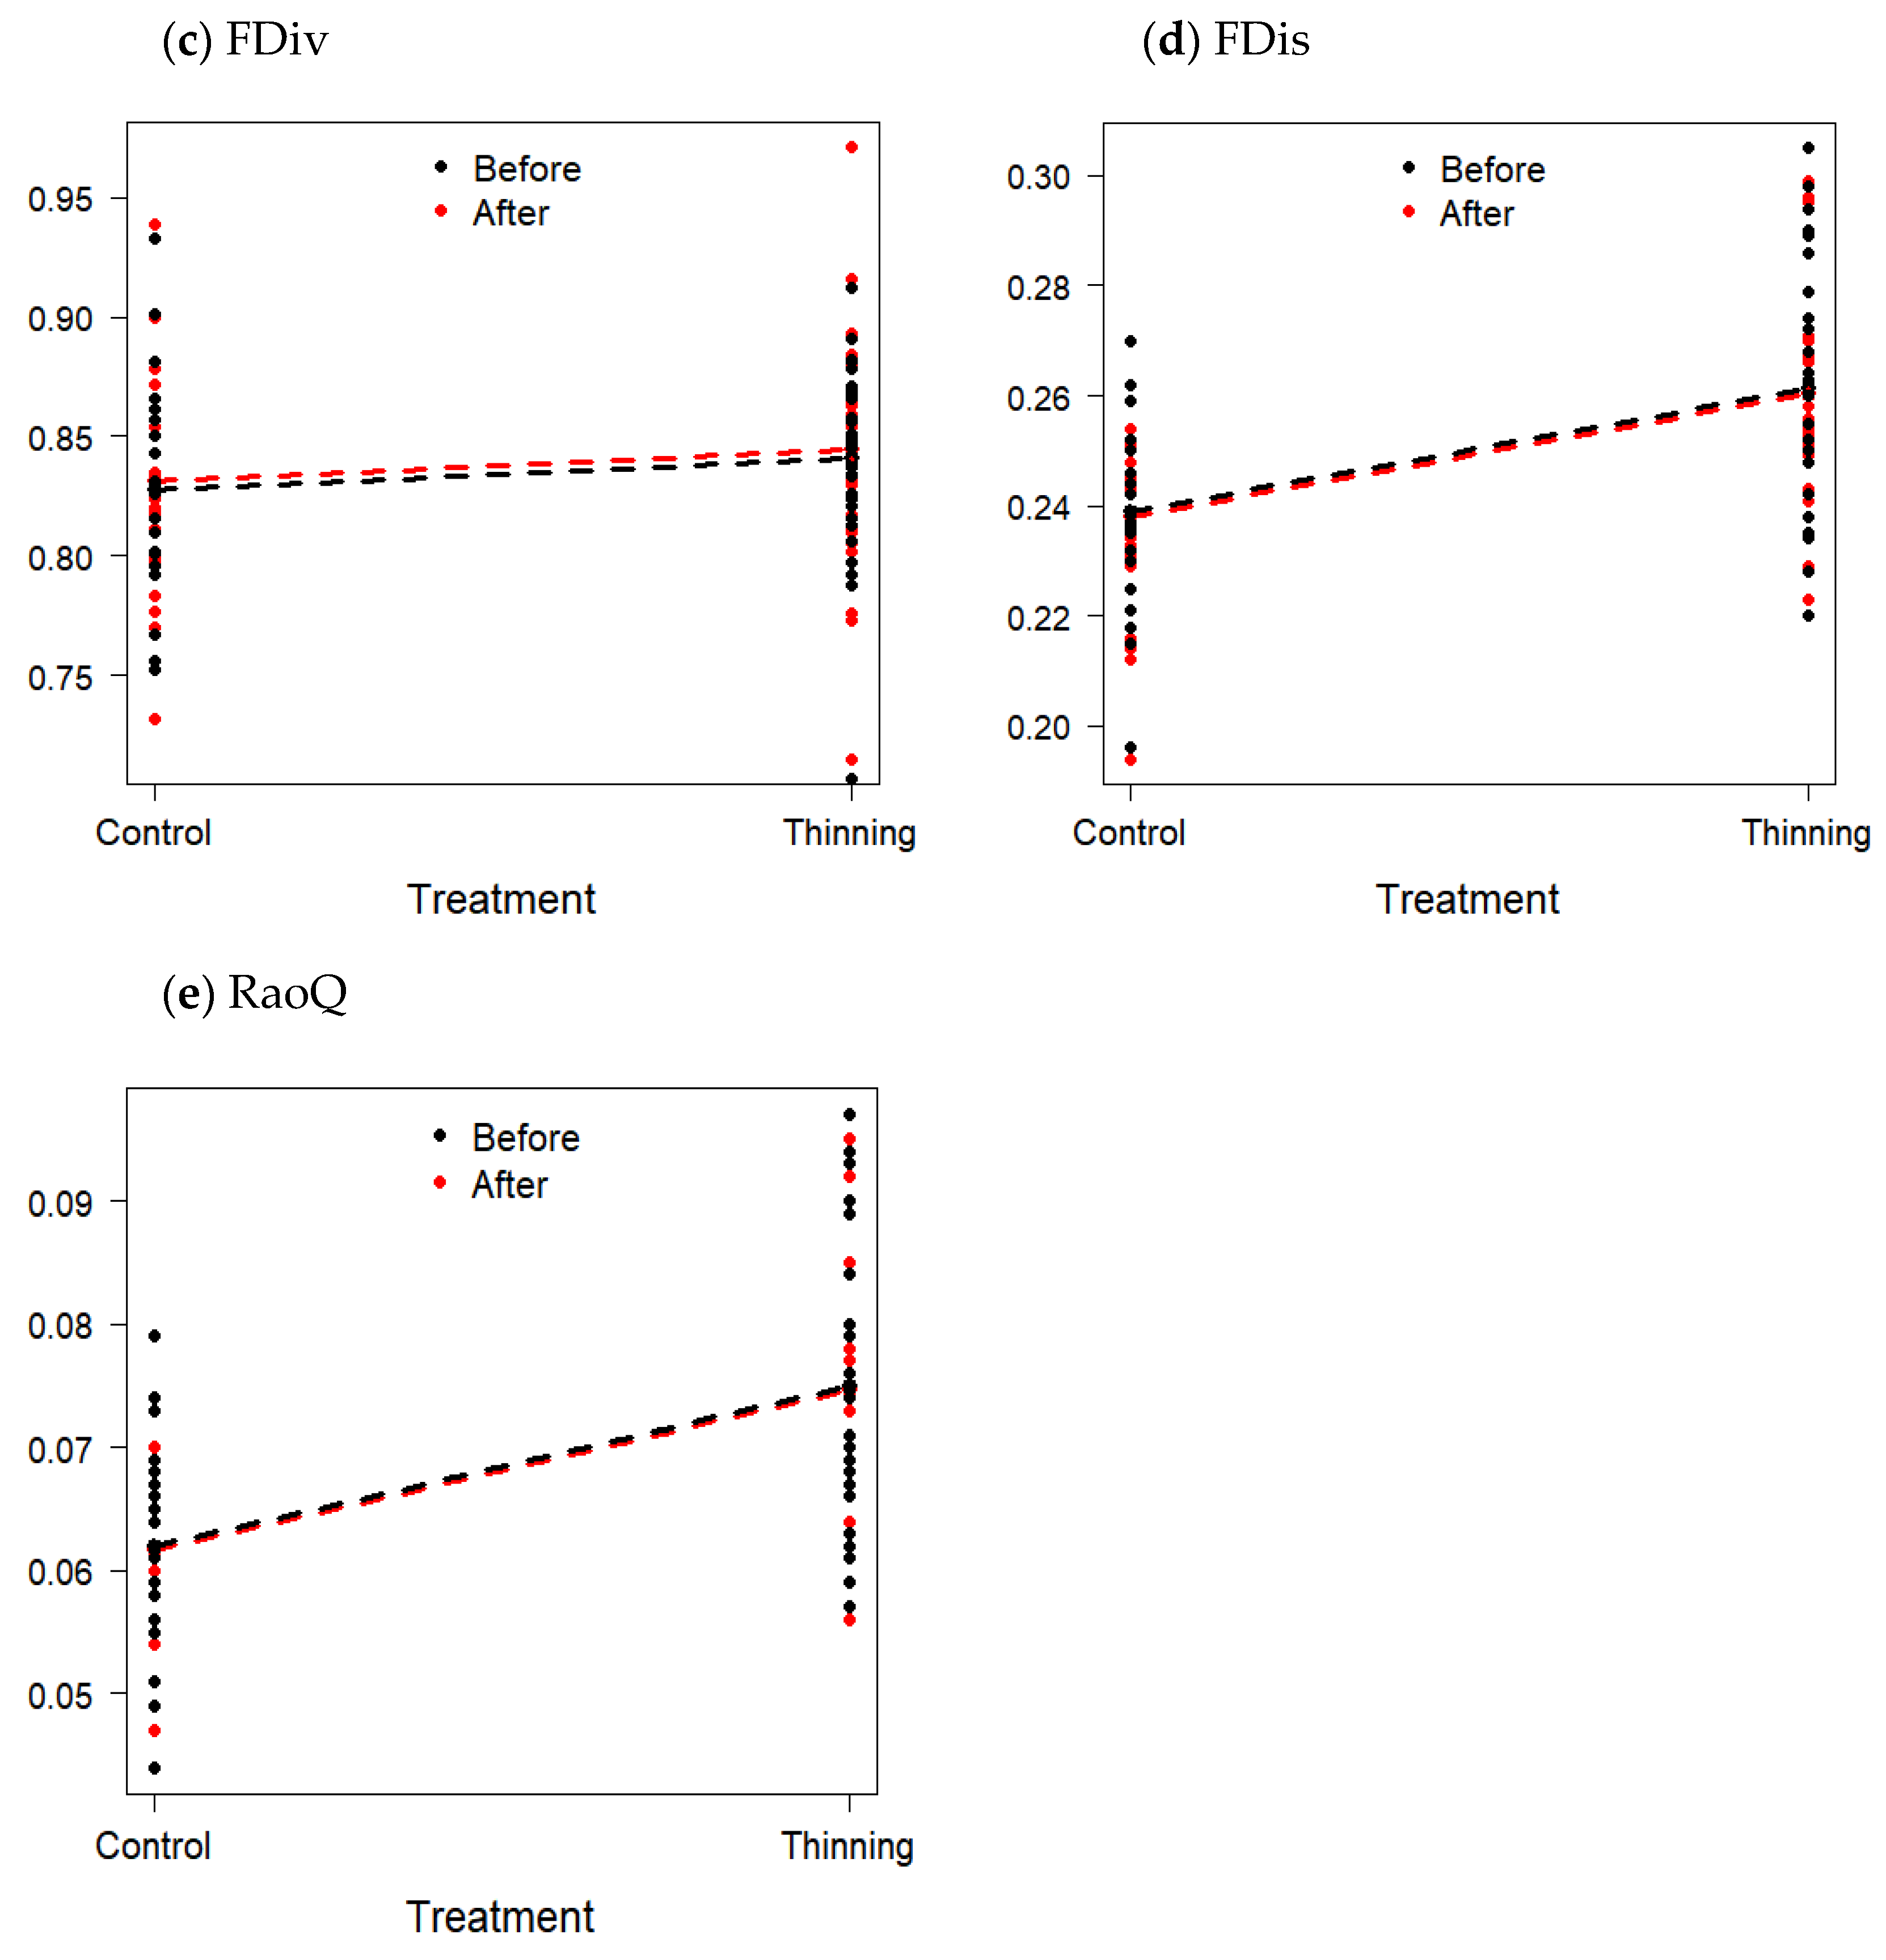
Functional Divergence (FDiv) measures how species of a community diverge in their distance from the center of gravity in the functional space, and determines the relative abundance of a species within its functional range, [70,71]. FDiv provides additional information for FRic, because this index indicates which species has the most extreme feature combinations (i.e., specialized species), and which ones are generalist [72].
-
Functional Evenness (FEve) quantifies the regularity of how species abundances are distributed within their functional range, by correlating abundance with average distance between different species [57]. FEve can be related to the uniformity of species (Pielou’s J) and the FDiv because it determines if the extent of functional distances between the species is regular [41].
-
Functional Dispersion (FDis) gives the mean distance of an individual species relative to the centroid of the community, which depicts its mean distance relative to all species in the community, and therefore, accounts for relative abundances of a species.
-
Rao Quadratic Entropy (RaoQ) correlates the abundances of different species [73] to improve the FD index. An adverse property of RaoQ is that its value may decrease if species richness increases, because abundances and dissimilarity between the species are considered. Therefore, the introduction or loss of species in a community increases or decreases the species abundance, but, at the same time, may reduce the dissimilarity between the species.
-
Community weighted mean (CWM) represents the sum of each species trait value weighted by its relative abundance in the community [74]. To characterize the community structure from a functional point of view, we used the community weighted mean, which is calculated combining the species abundance with the trait values of the given species [75]. This describes the trait averages over a community [76] and reflects the dominant trait in a given community [33,77,78].
To relate the FD indices and the CWM to the predictors, we used multivariate linear mixed modelling (LMM) with random nested intercepts. For each index or CWM, the fixed effects were the altitude, the relative removed basal area, the number of trees ha−1, the initial basal area, and the initial species number, whereas the random effects were the plot membership nested in the “quebrada”. All the previously mentioned predictors are directly related to the selective thinning, except altitude, which is a natural distribution gradient but often considered by other authors [52,53] because of its importance for analyzing forest composition and structure.
To perform the LMM analysis, the NLME package of R was used [79], in which the explanatory categorical factors were combined to calculate random values for the repeated measurements throughout time (before–after). As fixed factors, we used all the predictors inherent to structural and ecological forest conditions before and after the selective thinning (period and treatment) and as a random variable, we used the membership to nested sampling. To validate the models of each analyzed index, we compare each resulting model, applying a goodness test (likelihood ratio test), discarding non-significant predictors and establishing the importance of the remaining factors to prove that the models were not over fitted. For this, we used the lmtest package of R software [80].

3. Results

3.1. Selective Thinning and Structure

In the 30 thinned plots (Q3 and Q5), the percentage of tree extraction with respect to the total number of individuals per species ranged from 1.5–100%, with an average value of 23.2%. Species with high extraction intensity were: Prunus huantensis Pilg (75%), Symplocos coriaceae A. DC. (50%), Vismia tomentosa (Ruiz and Pav.) (50%), Cinnamomum sp. (50%), Persea subcordata (50%); (Supplementary Materials Table S3). This resulted in an average stem extraction of 18.8 ± 12.1 (SD) ha−1, with a minimum of 4 trees ha−1 and a maximum of 56 trees ha−1. The basal area extracted was on average 1.8 ± 1.4 m2 ha−1 (SD), and the most intensive extraction was 4.8 m2 ha−1.
During the thinning campaign, several species were registered (Supplementary Table S2), particularly Virola sp. (Myristicaceae), Chrysophyllum lanatum T.D. Penn (Sapotaceae), Alchornea triplinervia (Spreng.) Mull. Arg. (Euphorbiaceae) and Persea subcordata (Ruiz and Pav.) Nees (Lauraceae) that were affected, eliminating the only representative individual in the floristic inventory (100%), which may influence the calculation of the FD.
Overall, the extracted species belonged to 30 families, in which nine species of Lauraceae; six species of Euphorbiaceae; five species of Meliaceae; three species of Clusiaceae, Melastomataceae, Moraceae and Rubiaceae; and two species of Cecropiaceae and Mimosaceae were removed.

3.2. Floristic Composition

The plant diversity in the studied TMF is represented by 174 species, which belong to 53 botany families. The families with the most species richness are Lauraceae with 27 species, representing 15.5% of the relative diversity of the forest; this is followed by Moraceae with 16 species (9.2%), Rubiaceae with 12 species (6.9%), Euphorbiaceae with 11 species (6.3%), Melastomataceae with 10 species (5.7%), Meliaceae with 9 species (5.2%), Cecropiaceae with 7 species (4%), Clusiaceae and Myrtaceae with 5 species (2.9%), Asteraceae, Cunnoniaceae as well as Mimosaceae were represented with 4 species (2.3%), and Anacardiaceae, Aquifoliaceae, Myrsinaceae, Rosaceae, Sapindaceae as well as Sapotaceae with 3 species (1.7%). The remaining families (35) had only 1–2 species, representing 0.6–1.1% of relative diversity.

3.3. Changes in Functional Diversity

Applying the linear mixed model (LMM), we found that the variations of the different indices that compose the FD of studied TMF is not produced exclusively by the implementation of selective thinning, but also by the distribution of the TMF along the altitudinal gradient, which implies different structural and diversity conditions.
The FRic variability was significantly influenced by the implementation of selective thinning, while the predictors related to habitat characteristics and altitudinal gradient did not show significant effect. Functional uniformity (FEve) was not significantly affected by any predictor. FDis was significantly influenced by predictors related to selective thinning and natural conditions of the forest. FDis and RaoQ were influenced by predictors related to natural conditions of the forest, while the predictors related to the implementation of treatment did not significantly influence this indices (Table 2).
The ANOVA results comparing the values of the FD indices before and after the implementation of selective thinning indicate that significant differences were evident only for FRic (Table 3, Figure 2a), whereas the other indices (FDis, FEve, FDiv and RaoQ) were less sensitive to the implementation of selective thinning and more susceptible to changes in the natural conditions of the TMF (Table 3, Figure 2b–e).
The CWM values of the dominant trait in each of the sampled plots had different responses to the intervention. The frequency (trees after thinning of more important species in each plot) of certain species was affected by the extracted basal area and changed significantly after thinning was implemented; however, the initial number of species is also a predictor that significantly influences PCT frequency variability. Regarding growth, the implementation of selective thinning significantly affects the variability of the trait, although some predictors such as the number of species, the number of trees per hectare and the altitude gradient are also significant in the variability of the trait. Regarding the initial DBH, only the number of trees/ha−1 exerts significant influence on the trait (Table 4).

4. Discussion

An important step before applying selective thinning, as shown in this study, is the analysis of the floristic composition of the original forest in an attempt to conserve the extraordinary biodiversity. However, a carefully planned silvicultural method can allow, at the same time, to increase the growth rates of the desired species and, subsequently, the extraction of resources for the economic development of the local population [81,82].
Therefore, individual tree species must be carefully analyzed to determine their economic or ecological value. If tree species with a limited number of individuals are cut, the diversity, and consequently, the functionality of the ecosystem may be affected, although during this investigation, not only individuals of abundant species were eliminated but also species with few representatives.
As shown in this study, if these preconditions are respected, selective thinning intensity does not cause significant changes in the forest ecosystem. Furthermore, the results suggest that the applied strategy makes the studied TMF more productive, especially in terms of growth, because the loss of taxonomic and functional diversity is minimal. The forest still serves as a conservation area, providing all of its ecosystem services; therefore, selective logging could also be a useful tool for biodiversity conservation and sustainable forest management [83,84].
Selective thinning also causes greater gaps within the forest stand, which changes the ecosystem conditions as a result of canopy openness. However, natural tree fall has the same effects, although gaps are generally less frequent. As Gunter et al. [68] found in the same TMF, Arctiidae moth communities were affected by both, selective thinning and natural tree fall, during the first year, whereas monocotyledonous and dicotyledonous vascular epiphytes did not show significant changes in structure or composition. Nevertheless, these impacts might be different in ravine forest or ridge forest parts [85,86], due to the different forest structure [68].
Plant traits are indicators of diversity, functionality and community composition [72], which are generally used to determine environmental changes over time or to understand natural successional processes. However, the selective thinning applied in this study adds another gradient of use, because the removed individuals belong to certain undesired species, which might affect the functional composition of the forest community. Therefore, to analyze changes of FD indices in this TMF regarding selective thinning, the used traits are mainly related to resource acquirement, because these allow one to evaluate if species exploit the available resources quickly, which generally occurs during periods of abundance at sites with sufficient water availability [87].
To assess the impacts of silvicultural interventions into an ecosystem and its functioning, all interactive components must be combined to obtain serial robust numerical indices [16], which can be provided by the FD. FD implies more than number of species and diversity, because multiple traits are considered, such as species dispersion syndromes, leaf functional characteristics, etc. Therefore, FD is an important attribute to analyze the response of a forest community to environmental changes. However, if only richness and diversity of species is evaluated to analyze the impact of forestry interventions, the generated information is still insufficient to understand the natural process of forest ecosystems [2,88].
In agreement with Baroloto et al. [42], some FD indices showed significant changes after thinning (Table 3), especially those related to the predictors that include thinning, but not those related to the altitude gradient, since this does not imply a pronounced effect on the communities or alteration in ecosystem processes. In general, functional diversity varies significantly as a result of changes in the forest community, as well as with the level of intervention; however, the total richness of the tree species may not change significantly due to the applied treatment [89]. As Putz et al. [90] indicated, the impact of forestry, especially logging, is more destructive with respect to carbon storage, but if growth rates increase forest productivity, carbon storage can be compensated.
Curzon et al. [91] concluded that in the temperate forests, functional diversity remains stable over the years after major disturbances like thinning or logging. By comparing the results in the temperate forests with our results in tropical montane forests, they both agree that neither produce significant changes in functional or taxonomic diversity shortly after the disturbance.
The Functional Divergence (FDiv) was influenced by the extracted basal area (slimming intensity) and altitude, which means that no clear influence of the intervention respective to the variability of this index could be demonstrated. The FDis and RaoQ indices were only influenced by the number of trees, which is a natural condition of the forest ecosystems and depends on various environmental factors [49,50,51,52,53].
The abundance and the initial DBH were less affected by intensity of the selective thinning applied, while the growth was improved due to changes in the initial conditions, mainly concerning availability of light and nutrients [49]. However, the community shows significant changes when comparing thinned plots and control plots and the specific role of each species could not be determined—such effects include succession changes, reproduction and interactions with other species. However, the experiment was executed within a natural reserve and no long-term treatment was applied to analyze larger scale logging regimes, such as a forest concession. Furthermore, the evaluation period was relatively short, and for this reason, changes in growth rates of remaining trees and modifications in species composition, such as reduction in shade-tolerant species, could not be analyzed. This also includes the effects on other important organism groups, such as epiphytes, orchids, mosses, ferns or insects, which should be the objective for further investigations.
In summary, selective thinning did not significantly alter the functionality of this TMF compared to the natural ecosystem (control plots). The DF was almost unchanged, which is the most critical point when applying a sustainable forest treatment. Future studies should focus on the links between biodiversity and ecosystem services [92], and long-term field monitoring is necessary [68].

5. Conclusions

In a neotropical TMF in southern Ecuador, selective thinning was performed at different intensities, which only slightly affected the FD of the forest. The calculated FD indices were based on different species traits, which improved the knowledge for designing sustainable management practices in ecologically sensitive ecosystem.
However, significant FD changes for all traits and predictors are not expectable, because to determine the ecosystem composition, the homogeneity of a forest stand, and the climatic conditions, especially in a TMF, is especially challenging. As the findings of this study showed, intensity of the treatment had no significant effect on FD changes in the community, whether the time span between the measurements, nor the eliminated individuals.
In the context of logging, the conservation of rare or less abundant species should be a priority before starting any forestry activity. Endangered species should be excluded from harvesting processes, logging and other forestry activities. Nonetheless, a sustainable forest management in combination with ecosystem conservation should remain a main objective for future development, because this not only guarantees the economic income for the local population, but also ensures the functionality of the forest stand to provide essential ecosystem services.

Supplementary Materials

The following are available online at https://www.mdpi.com/1424-2818/12/6/256/s1, Figure S1: Plots distribution in two forests types, the location of plot K that served as a control is shown in addition to the Q2 plots, Table S2: PCT´s list and individuals released and control, Table S3: Individuals by species removed and percentage with respect to the total of individuals inventoried in primary montane forest of RBSF.

Author Contributions

Conceptualization, R.M.; S.G.; B.S., methodology, O.C.; writing—original draft preparation, O.C., R.M.; S.G., B.S., A.F. and P.H.; writing—review and editing, O.C.; A.F., R.M.; S.G., B.S. and P.H. All authors have read and agreed to the published version of the manuscript.

Funding

This work was funded by the German Research Foundation (DFG) in the framework of Research Unit FOR 402, FOR816.

Acknowledgments

Universidad Técnica Particular de Loja for support in the completion of the manuscript. Diana Szekely for the revision of the English language and Galo Guamán for helping in GIS processing.

Conflicts of Interest

The authors declare no conflict of interest.

References

  1. Mosandl, R.; Günter, S.; Stimm, B.; Weber, M. Ecuador suffers the highest deforestation rate in South America. In Gradients in a Tropical Mountain Ecosystem of Ecuador; Beck, E., Bendix, J., Kottke, I., Makeschin, F., Mosandl, R., Eds.; Springer: Berlin, Germany, 2008; pp. 347–359. ISBN 978-3-540-73526-7. [Google Scholar]
  2. Benítez, A.; Aragón, G.; González, Y.; Prieto, M. Functional traits of epiphytic lichens in response to forest disturbance and as predictors of total richness and diversity. Ecol. Indic. 2018, 86, 18–26. [Google Scholar] [CrossRef]
  3. Myers, N.; Mittermeier, R.A.; Mittermeier, C.G.; da Fonseca, G.A.B.; Kent, J. Biodiversity hotspots for conservation priorities. Nature 2000, 403, 853–858. [Google Scholar] [CrossRef]
  4. Gardner, T.A.; Barlow, J.; Chazdon, R.; Ewers, R.M.; Harvey, C.A.; Peres, C.A.; Sodhi, N.S. Prospects for tropical forest biodiversity in a human-modified world. Ecol. Lett. 2009, 12, 561–582. [Google Scholar] [CrossRef] [Green Version]
  5. Gibson, L.; Lee, T.M.; Koh, L.P.; Brook, B.W.; Gardner, T.A.; Barlow, J.; Peres, C.A.; Bradshaw, C.J.A.; Laurance, W.F.; Lovejoy, T.E.; et al. Primary forests are irreplaceable for sustaining tropical biodiversity. Nature 2011, 478, 378–381. [Google Scholar] [CrossRef]
  6. Dirzo, R.; Raven, P.H. Global state of biodiversity and loss. Annu. Rev. Environ. Resour. 2003, 28, 137–167. [Google Scholar] [CrossRef] [Green Version]
  7. Chazdon, R.L. Beyond deforestation: Restoring forests and ecosystem services on degraded lands. Science 2008, 320, 1458–1460. [Google Scholar] [CrossRef] [Green Version]
  8. Carreño-Rocabado, G.; Peña-Claros, M.; Bongers, F.; Alarcón, A.; Licona, J.C.; Poorter, L. Effects of disturbance intensity on species and functional diversity in a tropical forest. J. Ecol. 2012, 100, 1453–1463. [Google Scholar] [CrossRef]
  9. Pessoa, M.S.; Hambuckers, A.; Benchimol, M.; Rocha-Santos, L.; Bomfim, J.A.; Faria, D.; Cazetta, E. Deforestation drives functional diversity and fruit quality changes in a tropical tree assemblage. Perspect. Plant Ecol. Evol. Syst. 2017, 28, 78–86. [Google Scholar] [CrossRef]
  10. Foley, J.A.; DeFries, R.; Asner, G.P.; Barford, C.; Bonan, G.; Carpenter, S.R.; Chapin, F.S.; Coe, M.T.; Daily, G.C.; Gibbs, H.K.; et al. Global Consequences of Land Use. Science 2005, 309, 570–574. [Google Scholar] [CrossRef] [Green Version]
  11. Putz, F.E.; Blate, G.M.; Redford, K.H.; Fimbel, R.; Robinson, J. Tropical forest management and conservation of biodiversity: An overview. Conserv. Biol. 2001, 15, 7–20. [Google Scholar] [CrossRef] [Green Version]
  12. Kusumoto, B.; Shiono, T.; Miyoshi, M.; Maeshiro, R.; Fujii, S.; Kuuluvainen, T.; Kubota, Y. Functional response of plant communities to clearcutting: Management impacts differ between forest vegetation zones. J. Appl. Ecol. 2014, 52, 171–180. [Google Scholar] [CrossRef]
  13. Günter, S.; Weber, M.; Erreis, R.; Aguirre, N. Influence of distance to forest edges on natural regeneration of abandoned pastures—A case study in the tropical mountain rain forest of Southern Ecuador. Eur. J. For. Res. 2006, 126, 67–75. [Google Scholar] [CrossRef] [Green Version]
  14. Edwards, D.P.; Tobias, J.A.; Sheil, D.; Meijaard, E.; Laurance, W.F. Maintaining ecosystem function and services in logged tropical forests. Trends Ecol. Evol. 2014, 29, 511–520. [Google Scholar] [CrossRef] [Green Version]
  15. Darrigo, M.R.; Venticinque, E.M.; dos Santos, F.A.M. Effects of reduced impact logging on the forest regeneration in the central Amazonia. Forest Ecol. Manag. 2016, 360, 52–59. [Google Scholar] [CrossRef]
  16. Wadsworth, F.H. Forest Production for Tropical America (No. 710); US Department of Agriculture, Forest Service: Washington, WA, USA, 1997.
  17. Dawkins, H.C. The refining of mixed forest: A new objective for tropical silviculture. Emp. For. Rev. 1955, 34, 188–191. [Google Scholar]
  18. Louman, B.; Valerio, J.; Jiménez, W. Bases ecológicas. Silvicultura de bosques latifoliados húmedos con énfasis en América Central. Silvicultura de Bosques Latifoliados Húmedos con Énfasis en América Central. Serie Técnica. Manual Técnico. 2001, 46, 19–78. [Google Scholar]
  19. De Avila, A.L.; Van Der Sande, M.T.; Dormann, C.F.; Peña-Claros, M.; Poorter, L.; Mazzei, L.; Ruschel, A.R.; Silva, J.N.M.; De Carvalho, J.O.P.; Bauhus, J. Disturbance intensity is a stronger driver of biomass recovery than remaining tree-community attributes in a managed Amazonian forest. J. Appl. Ecol. 2018, 55, 1647–1657. [Google Scholar] [CrossRef] [Green Version]
  20. Yguel, B.; Piponiot, C.; Mirabel, A.; Dourdain, A.; Hérault, B.; Gourlet-Fleury, S.; Forget, P.-M.; Fontaine, C. Beyond species richness and biomass: Impact of selective logging and silvicultural treatments on the functional composition of a neotropical forest. For. Ecol. Manag. 2019, 433, 528–534. [Google Scholar] [CrossRef]
  21. Bonilla-Bedoya, S.; Estrella-Bastidas, A.; Ordoñez, M.; Sánchez, A.; Herrera, M.A. Patterns of timber harvesting and its relationship with sustainable forest management in the Western Amazon, Ecuador case. J. Sustain. For. 2017, 36, 433–453. [Google Scholar] [CrossRef]
  22. Jadán, O.; Cifuentes Jara, M.; Torres, B.; Selesi, D.; Veintimilla Ramos, D.A.; Günter, S. Influence of tree cover on diversity, carbon sequestration and productivity of cocoa systems in the Ecuadorian Amazon. Bois. For. Trop. 2015, 325, 35–47. [Google Scholar] [CrossRef] [Green Version]
  23. Middendorp, R.S.; Pérez, A.J.; Molina, A.; Lambin, E.F. The potential to restore native woody plant richness and composition in a reforesting landscape: A modeling approach in the Ecuadorian Andes. Landsc. Ecol. 2016, 31, 1581–1599. [Google Scholar] [CrossRef]
  24. Chirino, E.; Ruiz-Yanetti, S.; Vilagrosa, A.; Mera, X.; Espinoza, M.; Lozano, P. Morpho-functional traits and plant response to drought conditions in seedlings of six native species of Ecuadorian Ecosystems. Flora 2017, 233, 58–67. [Google Scholar] [CrossRef] [Green Version]
  25. Delgado-Aguilar, M.J.; Konold, W.; Schmitt, C.B. Community mapping of ecosystem services in tropical rainforest of Ecuador. Ecol. Indic. 2017, 73, 460–471. [Google Scholar] [CrossRef]
  26. Raes, L.; D’Haese, M.; Aguirre, N.; Knoke, T. A portfolio analysis of incentive programmes for conservation, restoration and timber plantations in Southern Ecuador. Land Use Policy 2016, 51, 244–259. [Google Scholar] [CrossRef]
  27. Hayes, T.; Murtinho, F.; Camacho, L.M.C.; Crespo, P.; McHugh, S.; Salmerón, D. Can conservation contracts co-exist with change? Payment for ecosystem services in the context of adaptive decision-making and sustainability. Environ. Manag. 2015, 55, 69–85. [Google Scholar] [CrossRef] [Green Version]
  28. Wunder, S. Are Direct Payments for Environmental Services Spelling Doom for Sustainable Forest Management in the Tropics? Ecol. Soc. 2006, 11, 11. [Google Scholar] [CrossRef] [Green Version]
  29. MAE 2000. Estrategia Para el Desarrollo Forestal Sustentable del Ecuador; MAE 2000: Quito, Ecuador, 2000. [Google Scholar]
  30. Bricca, A.; Chelli, S.; Canullo, R.; Cutini, M. The Legacy of the Past Logging: How Forest Structure Affects Different Facets of Understory Plant Diversity in Abandoned Coppice Forests. Diversity 2020, 12, 109. [Google Scholar] [CrossRef] [Green Version]
  31. Tonteri, T.; Salemaa, M.; Rautio, P.; Hallikainen, V.; Korpela, L.; Merilä, P. Forest management regulates temporal change in the cover of boreal plant species. For. Ecol. Manag. 2016, 381, 115–124. [Google Scholar] [CrossRef]
  32. Schleuter, D.; Daufresne, M.; Massol, F.; Argillier, C. A user’s guide to functional diversity indices. Ecol. Monogr. 2010, 80, 469–484. [Google Scholar] [CrossRef] [Green Version]
  33. Violle, C.; Navas, M.L.; Vile, D.; Kazakou, E.; Fortunel, C.; Hummel, I.; Garnier, E. Let the concept of trait be functional. Oikos 2007, 116, 882–892. [Google Scholar] [CrossRef]
  34. Díaz, S.; Cabido, M. Vive la différence: Plant functional diversity matters to ecosystem processes. Trends Ecol. Evol. 2001, 16, 646–655. [Google Scholar] [CrossRef]
  35. Petchey, O.L.; Gaston, K.J. Functional diversity: Back to basics and looking forward. Ecol. Lett. 2006, 9, 741–758. [Google Scholar] [CrossRef] [PubMed]
  36. Báez, S.; Homeier, J. Functional traits determine tree growth and ecosystem productivity of a tropical montane forest: Insights from a long-term nutrient manipulation experiment. Glob. Chang. Biol. 2018, 24, 399–409. [Google Scholar] [CrossRef]
  37. Maire, E.; Grenouillet, G.; Brosse, S.; Villéger, S. How many dimensions are needed to accurately assess functional diversity? A pragmatic approach for assessing the quality of functional spaces. Glob. Ecol. Biogeogr. 2015, 24, 728–740. [Google Scholar] [CrossRef]
  38. Bendix, J.; Trachte, K.; Cermak, J.; Rollenbeck, R.; Nauß, T. Formation of convective clouds at the foothills of the tropical eastern Andes (South Ecuador). J. Appl. Meteorol. Clim. 2009, 48, 1682–1695. [Google Scholar] [CrossRef]
  39. Gonzalez-Jaramillo, V.; Fries, A.; Rollenbeck, R.; Paladines, J.; Oñate-Valdivieso, F.; Bendix, J. Assessment of deforestation during the last decades in Ecuador using NOAA-AVHRR satellite data. Erdkunde 2016, 217–235. [Google Scholar] [CrossRef]
  40. Berry, N.J.; Phillips, O.L.; Ong, R.C.; Hamer, K.C. Impacts of selective logging on tree diversity across a rainforest landscape: The importance of spatial scale. Landsc. Ecol. 2008, 23, 915–929. [Google Scholar] [CrossRef]
  41. Biswas, S.R.; Mallik, A.U. Disturbance effects on species diversity and functional diversity in riparian and upland plant communities. Ecology 2010, 91, 28–35. [Google Scholar] [CrossRef]
  42. Baraloto, C.; Herault, B.; Paine, C.E.; Massot, H.; Blanc, L.; Bonal, D.; Sabatier, D. Contrasting taxonomic and functional responses of a tropical tree community to selective logging. J. Appl. Ecol. 2012, 49, 861–870. [Google Scholar] [CrossRef]
  43. Clark, J.A.; Covey, K.R. Tree species richness and the logging of natural forests: A meta-analysis. For. Ecol. Manag. 2012, 276, 146–153. [Google Scholar] [CrossRef]
  44. Chaudhary, A.; Burivalova, Z.; Koh, L.P.; Hellweg, S. Impact of forest management on species richness: Global meta-analysis and economic trade-offs. Sci. Rep. 2016, 6, 23954. [Google Scholar] [CrossRef] [PubMed] [Green Version]
  45. Ohl, C.; Bussmann, R. Recolonisation of natural landslides in tropical mountain forests of Southern Ecuador. Feddes Repert. 2004, 115, 248–264. [Google Scholar] [CrossRef]
  46. Brehm, G.; Homeier, J.; Fiedler, K. Beta diversity of geometrid moths (Lepidoptera: Geometridae) in an Andean montane rainforest. Divers. Distrib. 2003, 9, 351–366. [Google Scholar] [CrossRef]
  47. Fernández, G.F.C.; Obermeier, W.; Gerique, A.; López-Sandoval, M.; Lehnert, L.W.; Thies, B.; Bendix, J. Land Cover Change in the Andes of Southern Ecuador—Patterns and Drivers. Remote Sens. 2015, 7, 2509–2542. [Google Scholar] [CrossRef] [Green Version]
  48. González-Jaramillo, V.; Fries, A.; Zeilinger, J.; Homeier, J.; Paladines-Benitez, J.; Bendix, J. Estimation of above ground biomass in a tropical mountain forest in southern Ecuador using airborne LIDAR data. Rem. Sens. 2018, 10, 660. [Google Scholar] [CrossRef] [Green Version]
  49. Moser, G.; Leuschner, C.; Hertel, D.; Graefe, S.; Soethe, N.; Iost, S. Elevation effects on the carbon budget of tropical mountain forests (S Ecuador): The role of the belowground compartment. Glob. Chang. Biol. 2011, 17, 2211–2226. [Google Scholar] [CrossRef] [Green Version]
  50. Dislich, C.; Huth, A. Modelling the impact of shallow landslides on forest structure in tropical montane forests. Ecol. Model. 2012, 239, 40–53. [Google Scholar] [CrossRef]
  51. Cabrera, O.; Fries, A.; Hildebrandt, P.; Günter, S.; Mosandl, R. Early Growth Response of Nine Timber Species to Release in a Tropical Mountain Forest of Southern Ecuador. Forests 2019, 10, 254. [Google Scholar] [CrossRef] [Green Version]
  52. Paulsch, A. Development and Application of a Classification System for Undisturbed and Disturbed Tropical Montane Forests Based on Vegetation Structure. Ph.D. Thesis, University of Bayreuth, Bayreuth, Germany, 2002. [Google Scholar]
  53. Homeier, J.; Breckle, S.W.; Günter, S.; Rollenbeck, R.T.; Leuschner, C. Tree Diversity, Forest Structure and Productivity along Altitudinal and Topographical Gradients in a Species-Rich Ecuadorian Montane Rain Forest. Biotropica 2010, 42, 140–148. [Google Scholar] [CrossRef]
  54. Andresen, E.; Pedroza-Espino, L.; Allen, E.B.; Pérez-Salicrup, D.R. Effects of Selective Vegetation Thinning on Seed Removal in Secondary Forest Succession. Biotropica 2005, 37, 145–148. [Google Scholar] [CrossRef]
  55. De Graaf, N.R.; Poels, R.L.H.; Van Rompaey, R.S.A.R. Effect of silvicultural treatment on growth and mortality of rainforest in Surinam over long periods. For. Ecol. Manag. 1999, 124, 123–135. [Google Scholar] [CrossRef]
  56. Peña-Claros, M.; Peters, E.M.; Justiniano, M.J.; Bongers, F.; Blate, G.M.; Fredericksen, T.S.; Putz, F.E. Regeneration of commercial tree species following silvicultural treatments in a moist tropical forest. For. Ecol. Manag. 2008, 255, 1283–1293. [Google Scholar] [CrossRef]
  57. Zanne, A.E.; Lopez-Gonzalez, G.; Coomes, D.A.; Ilic, J.; Jansen, S.; Lewis, S.L.; Chave, J. Global Wood Density Database. 2009. Available online: https://dryad.figshare.com/articles/Global_Wood_Density_Database/4172847 (accessed on 2 April 2009).
  58. Chave, J.; Coomes, D.A.; Jansen, S.; Lewis, S.L.; Swenson, N.G.; Zanne, A.E. Towards a worldwide wood economics spectrum. Ecol. Lett. 2009, 12, 351–366. [Google Scholar] [CrossRef]
  59. MAE (Ministerio del Ambiente del Ecuador); FAO (Organización de las Naciones Unidas para la Alimentación y la Agricultura, IT). Propiedades Anatómicas, Físicas y Mecánicas de 93 Especies Forestales; MAE: Quito, Ecuador, 2014; p. 105. [Google Scholar]
  60. Palacios, W.; Jaramillo, N. Gremios ecológicos forestales del noroccidente del Ecuador: Implicaciones en el manejo del bosque nativo. Lyonia 2004, 6, 55–75. [Google Scholar]
  61. Osazuwa-Peters, O.L.; Jiménez, I.; Oberle, B.; Chapman, C.A.; Zanne, A.E. Selective logging: Do rates of forest turnover in stems, species composition and functional traits decrease with time since disturbance?–A 45 year perspective. For. Ecol. Manag. 2015, 357, 10–21. [Google Scholar] [CrossRef] [PubMed] [Green Version]
  62. Dos Santos, V.A.H.F.; Ferreira, M.J. Are photosynthetic leaf traits related to the first-year growth of tropical tree seedlings? A light-induced plasticity test in a secondary forest enrichment planting. For. Ecol. Manag. 2020, 460, 117900. [Google Scholar] [CrossRef]
  63. Wang, C.; Zhou, J.; Xiao, H.; Liu, J.; Wang, L. Variations in leaf functional traits among plant species grouped by growth and leaf types in Zhenjiang, China. J. For. Res. 2017, 28, 241–248. [Google Scholar] [CrossRef]
  64. Xu, F.; Guo, W.; Xu, W.; Wei, Y.; Wang, R. Leaf morphology correlates with water and light availability: What consequences for simple and compound leaves? Prog. Nat. Sci. 2009, 19, 1789–1798. [Google Scholar] [CrossRef]
  65. Jara-Guerrero, A.; De la Cruz, M.; Méndez, M. Seed dispersal spectrum of woody species in south Ecuadorian dry forests: Environmental correlates and the effect of considering species abundance. Biotropica 2011, 43, 722–730. [Google Scholar] [CrossRef] [Green Version]
  66. Seidler, T.G.; Plotkin, J.B. Seed dispersal and spatial pattern in tropical trees. PLoS Biol. 2006, 4, e344. [Google Scholar] [CrossRef]
  67. Cortés-Flores, J.; Cornejo-Tenorio, G.; Urrea-Galeano, L.A.; Andresen, E.; González-Rodríguez, A.; Ibarra-Manríquez, G. Phylogeny, fruit traits, and ecological correlates of fruiting phenology in a Neotropical dry forest. Oecologia 2019, 189, 159–169. [Google Scholar] [CrossRef] [PubMed]
  68. Günter, S.; Cabrera, O.; Weber, M.; Stimm, B.; Zimmermann, M.; Fiedler, K.; Knuth, J.; Boy, J.; Wilcke, W.; Iost, S.; et al. Natural Forest Management in Neotropical Mountain Rain Forests—An Ecological Experiment. In Gradients in a Tropical Mountain Ecosystem of Ecuador; Beck, E., Bendix, J., Kottke, I., Makeschin, F., Mosandl, R., Eds.; Springer: Berlin, Germany, 2008; pp. 347–359. ISBN 978-3-540-73526-7. [Google Scholar]
  69. Laliberte, A.E.; Legendre, P.; Shipley, B.; Laliberté, M.E. FD: Measuring Functional Diversity from Multiple Traits, and Other Tools for Functional Ecology. R Package Version 1.0-12. 2010. Available online: https://www.semanticscholar.org/paper/Package-%27fd%27-Title-Measuring-Functional-Diversity-Lalibert%C3%A9-Shipley/99009d911cb83b2bd2bc1ea6e7399b0d05e5cb63 (accessed on 16 April 2010).
  70. Mason, N.W.; Bello, F.; Mouillot, D.; Pavoine, S.; Dray, S. A guide for using functional diversity indices to reveal changes in assembly processes along ecological gradients. J. Veget. Sci. 2013, 24, 794–806. [Google Scholar] [CrossRef]
  71. Villéger, S.; Mason, N.W.; Mouillot, D. New multidimensional functional diversity indices for a multifaceted framework in functional ecology. Ecology 2008, 89, 2290–2301. [Google Scholar] [CrossRef] [Green Version]
  72. Mouchet, M.A.; Villeger, S.; Mason, N.W.H.; Mouillot, D. Functional diversity measures: An overview of their redundancy and their ability to discriminate community assembly rules. Funct. Ecol. 2010, 24, 867–876. [Google Scholar] [CrossRef]
  73. Botta-Dukat, Z. Rao’s quadratic entropy as a measure of functional diversity based on multiple traits. J. Veg. Sci. 2005, 16, 533–540. [Google Scholar] [CrossRef]
  74. Lavorel, S.; Grigulis, K.; McIntyre, S.; Williams, N.S.; Garden, D.; Dorrough, J.; Bonis, A. Assessing functional diversity in the field–methodology matters! Funct. Ecol. 2008, 22, 134–147. [Google Scholar] [CrossRef]
  75. Ricotta, C.; Moretti, M. CWM and Rao’s quadratic diversity: A unified framework for functional ecology. Oecologia 2011, 167, 181–188. [Google Scholar] [CrossRef]
  76. Bello, F.D.; Lepš, J.; Lavorel, S.; Moretti, M. Importance of species abundance for assessment of trait composition: An example based on pollinator communities. Community Ecol. 2007, 8, 163–170. [Google Scholar] [CrossRef]
  77. Garnier, E.; Cortez, J.; Billes, G.; Navas, M.L.; Roumet, C.; Debussche, M.; Laurent, G.; Blanchard, A.; Aubry, D.; Bellmann, A.; et al. Plant functional markers capture ecosystem properties during secondary succession. Ecology 2004, 85, 2630–2637. [Google Scholar] [CrossRef]
  78. Lepsˇ, J.; de Bello, F.; Lavorel, S.; Berman, S. Quantifying and interpreting functional diversity of natural communities: Practical considerations matter. Preslia 2006, 78, 481–501. [Google Scholar]
  79. Bates, D.; Sarkar, D.; Bates, M.D.; Matrix, L. The lme4 package. R Package Version 2007, 2, 74. [Google Scholar]
  80. Hothorn, T.; Zeileis, A.; Farebrother, R.W.; Cummins, C.; Millo, G.; Mitchell, D.; Zeileis, M.A. Package ‘Lmtest’; Project for Statistical Computing: Vienna, Austria, 2019. [Google Scholar]
  81. Costa, F.R.; Magnusson, W.E. Effects of Selective Logging on the Diversity and Abundance of Flowering and Fruiting Understory Plants in a Central Amazonian Forest. Biotropica 2003, 35, 103–114. [Google Scholar] [CrossRef]
  82. Bawa, K.S.; Seidler, R. Natural forest management and conservation of biodiversity in tropical forests. Conserv. Biol. 1998, 12, 46–55. [Google Scholar] [CrossRef]
  83. Lohbeck, M.; Poorter, L.; Lebrija-Trejos, E.; Martínez-Ramos, M.; Meave, J.A.; Paz, H.; Bongers, F. Successional changes in functional composition contrast for dry and wet tropical forest. Ecology 2013, 94, 1211–1216. [Google Scholar] [CrossRef] [PubMed]
  84. De Avila, A.L.; Ruschel, A.R.; de Carvalho, J.O.P.; Mazzei, L.; Silva, J.N.M.; do Carmo Lopes, J.; Bauhus, J. Medium-term dynamics of tree species composition in response to silvicultural intervention intensities in a tropical rain forest. Biol. Conserv. 2015, 191, 577–586. [Google Scholar] [CrossRef]
  85. Nöske, N.M.; Hilt, N.; Werner, F.A.; Brehm, G.; Fiedler, K.; Sipman, H.J.; Gradstein, S.R. Disturbance effects on diversity of epiphytes and moths in a montane forest in Ecuador. Basic Appl. Ecol. 2008, 9, 4–12. [Google Scholar] [CrossRef]
  86. Werner, F.A. Reduced growth and survival of vascular epiphytes on isolated remnant trees in a recent tropical montane forest clear-cut. Basic. Appl. Ecol. 2011, 12, 172–181. [Google Scholar] [CrossRef]
  87. Lopez-Iglesias, B.; Villar, R.; Poorter, L. Functional traits predict drought performance and distribution of Mediterranean woody species. Acta Oecologica 2014, 56, 10–18. [Google Scholar] [CrossRef]
  88. Lawton, J.H.; Bignell, D.E.; Bolton, B.; Bloemers, G.F.; Eggleton, P.; Hammond, P.M.; Stork, N.E. Biodiversity inventories, indicator taxa and effects of habitat modification in tropical forest. Nature 1998, 391, 72. [Google Scholar] [CrossRef]
  89. Huang, W.; Pohjonen, V.; Johansson, S.; Nashanda, M.; Katigula, M.I.L.; Luukkanen, O. Species diversity, forest structure and species composition in Tanzanian tropical forests. For. Ecol. Manag. 2003, 173, 11–24. [Google Scholar] [CrossRef]
  90. Putz, F.E.; Zuidema, P.A.; Synnott, T.; Peña-Claros, M.; Pinard, M.A.; Sheil, D.; Vanclay, J.; Sist, P.; Gourlet-Fleury, S.; Griscom, B.; et al. Sustaining conservation values in selectively logged tropical forests: The attained and the attainable. Conserv. Lett. 2012, 5, 296–303. [Google Scholar] [CrossRef] [Green Version]
  91. Curzon, M.T.; D’Amato, A.W.; Fraver, S.; Palik, B.J.; Bottero, A.; Foster, J.R.; Gleason, K.E. Harvesting influences functional identity and diversity over time in forests of the northeastern USA. For. Ecol. Manag. 2017, 400, 93–99. [Google Scholar] [CrossRef]
  92. Mori, A.S.; Lertzman, K.P.; Gustafsson, L. Biodiversity and ecosystem services in forest ecosystems: A research agenda for applied forest ecology. J. App. Ecol. 2017, 54, 12–27. [Google Scholar] [CrossRef]
Figure 1. Location of the study area and plot distribution in the RBSF. The red numbers indicate total basal area ha−1, other numbers in the squared plots indicate mean values of extracted basal area and the number of extracted trees (basal Area extracted/extracted trees ha−1). All plots in Q2 (green block), as well as the K-plots in Q3 (blue block) and Q5 (red block), are control plots without intervention (i.e., no selective thinning).
Diversity 12 00256 g001
Figure 2. Effects of thinning on functional diversity indices (n = 52) before and after implementation of selective thinning. (a) Functional Richness (FRic), (b) Functional evenness (FEve), (c) Functional divergence (FDiv), (d) Functional dispersion (FDis) and (e) Rao Quadratic entropy (RaoQ). Details of analyses of variance among control and thinned plots are given in Table 3.
Diversity 12 00256 g002aDiversity 12 00256 g002b
Table 1. Functional (conservatives and acquisitive) traits, including categories, units and codes used to calculate FD and CWM.
Functional TraitTypeCategoriesUnitCode
Wood densityAcquisitive-g cm3WD
Stem DensityAcquisitive-cmDBH
Diametric growthAcquisitive-cm year−1G
Leaf typeAcquisitiveSimple LT
Compound
Ecological guildConservativeShade tolerant ST
Light Tolerant LT
Partial light Tolerant PLT
Partial Shade Tolerant PST
Dispersion syndromeConservativeAnemochory AN
Zoochory ZOC
Barochory BAR
Table 2. Linear mixed models (LMM) of Functional Diversity indices as a function of stem density (stem ha−1), total species, thinning intensity, altitude, treatment, period, treatment:period (fixed effects) and of plot membership nested in sample site (intercept random effects), and likelihood ratio tests (LRT). FEve was not affected by any predictor.
PredictorsFunctional Richness: FRicFunctional Diversity: FDivFunctional Dispersion: FDisRao Quadratic Entropy: RaoQ
LTR p Value <0.001LTR p Value <0.001LTR p Value <0.001LRT p Value 0.01
Coeffp-ValueCoeffp-ValueCoeffp-ValueCoeffp-Value
(Intercept)−1.08<00018.6<00014.3<00012.06<0001
Stem density 5.20.02
Total Species
Thinning Intensity2.470.01824.040.004
Altitude −7.310.00112.90.00514.40.0002
Treatment
Period−7.3<0001
Treatment: Period−1.890.0270
Table 3. Functional diversity indices (mean ± SD), including the F-statistic values respective to the effect of thinning. Functional indices were calculated based on the six traits described in Table 1.
INDEXBeforeAfterCoeffF p-Value
Functional Richness (FRic)0.000025 ± 0.0000030.0005 ± 0.00003−9.03<0001
Functional Evenness (FEve)0.786 ± 0.0610.791 ± 0.058−0.260.7902
Functional Divergence (FDiv)0.835 ± 0.0410.838 ± 0.047−0.410.6793
Functional Dispersion (FDis)0.251 ± 0.0220.263 ± 0.0230.230.3246
Quadratic Entropy (RaoQ)0.0696 ± 0.0110.0691 ± 0.0120.110.8919
Table 4. Linear mixed models (LMM) of Community weighted mean CWM of potential crop trees frequency (FREQUENCY), diametric growth (GROWTH) and initial diameter at breast height (DBH) as a function of stem density (trees ha−1), total species, thinning intensity, altitude, treatment, and plot membership nested in sample site (intercept random effects), and likelihood ratio tests (LRT).
PredictorsFREQUENCYGROWTHDBH
LRT p Value 0.01LRT p Value <0.0001LRT p Value 0.01
Coeffp-ValueCoeffp-ValueCoeffp-Value
Stem density 1.890.0021.040.004
Total Species1.8<0001
Thinning Intensity3.47<0001
Altitude −0.980.003−2.430.002
Treatment1.5<0001

