Article

Plant Community Assembly in Invaded Recipient Californian Grasslands and Putative Donor Grasslands in Spain

by
Javier Galán Díaz
1,*,
Enrique G. de la Riva
2,
Ingrid M. Parker
3,
María José Leiva
4,
Rubén Bernardo-Madrid
1 and
Montserrat Vilà
1,4
1
Doñana Biological Station (EBD-CSIC), Avda. Américo Vespucio 26, Isla de la Cartuja, 41092 Seville, Spain
2
Department of Ecology, Brandenburg University of Technology, 03046 Cottbus, Germany
3
Department of Ecology and Evolutionary Biology, University of California, Santa Cruz, CA 95060, USA
4
Department of Plant Biology and Ecology, University of Seville, C/Profesor García González S/N, 41012 Seville, Spain
*
Author to whom correspondence should be addressed.
Diversity 2020, 12(5), 193; https://doi.org/10.3390/d12050193
Submission received: 17 April 2020 / Revised: 9 May 2020 / Accepted: 12 May 2020 / Published: 14 May 2020

Abstract

:
The introduction of exotic species to new regions offers opportunities to test fundamental questions in ecology, such as the context-dependency of community structure and assembly. Annual grasslands provide a model system of a major unidirectional introduction of plant species from Europe to North America. We compared the community structure of grasslands in two Mediterranean regions by surveying plots in Spain and in California with similar environmental and management conditions. All species found in Spanish grasslands were native to Spain, and over half of them (74 of 139 species) are known to have colonized California. In contrast, in California, over half of the species (52 of 95 species) were exotic species, all of them native to Spain. Nineteen species were found in multiple plots in both regions (i.e., shared species). The abundance of shared species in California was either similar to (13 species) or greater than (6 species) in Spain. In California, plants considered pests were more likely than non-pest species to have higher abundance. Co-occurring shared species tended to maintain their relative abundance in native and introduced communities, which indicates that pools of exotic species might assemble similarly at home and away. These findings provide interesting insights into community assembly in novel ecosystems. They also highlight an example of startling global and local floristic homogenization.

1. Introduction

The introduction and invasion of exotic species across new regions is causing biotic homogenization of species assemblages at different spatial scales [1,2,3,4]. As a result, many exotic species co-occur in habitats outside their native regions [5,6]. However, to date only a few studies have assessed whether exotic species are equally abundant, and if pools of exotic species assemble similarly, in their recipient communities as in putative donor communities of their native range (see [7,8]). Because patterns may arise from local differences in species richness and diversity, these comparisons need to consider the entire plant community, not just one focal species [9].
Biogeographical comparisons of exotic plant species in their native and recipient communities are important and gaining interest [8,9,10,11]. A general assumption is that exotic species are more abundant in the introduced region than in the native range [9,12]. However, this assumption is probably biased towards the worst invasive species that are known to cause great impacts [13]. For instance, many exotic species do not consistently show greater population density, abundance, and/or biomass per area in the introduced range [14]. Instead, this variation in abundance across exotic species may be predictable from abundance in the native range. In two previous studies, the abundance of exotic species in the native region was positively correlated with abundance in the recipient communities [7,8]. Such results imply that species attributes might determine the success of exotic species, rather than ecological differences between the native and introduced ranges [7,15]. However, some species may benefit from ecological differences between the native and introduced regions (e.g., loss of natural enemies) and become invasive pests [8,16]. A gap in previous studies is the lack of consideration of the entire native and recipient communities. This is necessary because changes in abundance of native and invasive species within a community are not independent of each other.
Exotic species frequently co-occur in sites with high propagule pressure such as in ruderal or riparian habitats [17], and frequently aggregate forming patches of exotic species [5,18]. This, in addition to individual exotic species maintaining their abundances at home and away, might suggest that pools of exotic species might assemble similarly in the native and introduced communities. A previous global analysis showed that community similarity among invaded sites increased with the number of shared exotic species [7]. However, the similarity between two plots can merely increase because of the inclusion of new shared elements. Thus, it is still unclear whether the similarity between the recipient and native communities also increased because exotic species abundances in introduced communities tend to match the abundances of their native communities as the number of shared species increase. The potential underlying hypothesis for this similarity between ranges could reflect a common evolutionary and ecological history of species interactions [19]. In other words, synergism in the interactions among species from the same origin might cause the abundance of exotic species to be more similar to those of their native communities as their richness in the recipient communities increase. We argue that it is necessary to consider the number of shared species to fully understand the similarity between native and recipient communities.
The Mediterranean Biome constitutes an excellent study system to explore community structure and floristic homogenization across regions, and compare assembly patterns of exotic plant species in donor and introduced communities. There has been an extensive and asymmetric introduction of species from the Mediterranean Basin to all other Mediterranean-climate regions of the world [17], especially of herbaceous species in grasslands [20]. This pattern is a result of sustained propagule pressure accompanying human migration patterns together with the intensification of agrarian activities with European settlement [19,21]. Currently, up to the 70–80% of the exotic herbaceous flora across regions with Mediterranean-type climates is native to the Mediterranean Basin [20]. It has been suggested that preadaptation to intense disturbance regimes might explain why many Eurasian colonizer species thrive when introduced to disturbed or managed habitat in new regions [19]. In California, more than two-thirds out of the 975 exotic plant species currently registered in the region are originally from Europe [22,23]. In only two and a half centuries, Eurasian species have become so widespread and dominant in grasslands across the state that there is much debate about the original composition of these grasslands [24,25], most probably previously covered by perennial grasslands, oak woodlands, and coastal scrub [26].
To compare plant community structure and species assembly between donor and recipient communities, we surveyed 120 grassland plots across analogous climate and land use gradients in Spain and California, respectively, to (1) compare local plant species richness, composition, and cover of native and exotic species pools between ranges; (2) test if the abundance of single exotic species in California match that of putative donor communities in Spain; and (3) determine if species within exotic assemblages maintain their abundances across Californian and Spanish communities, and whether it depends on the number of shared species.
We expect introduced species to have a dominant role in both native and recipient communities and a subsequent large community taxonomic similarity between regions. We expect most exotic species to show similar abundances in Californian and Spanish grasslands. However, based on the extensive evidence of the impact of exotic plant species on native species in California [27,28,29,30], we hypothesize pest species might achieve greater abundances in the introduced than in putative donor communities. Finally, interactions among species from the same origin may cause the relative abundance of exotic species to be more similar to those of their native communities as their number in the recipient community increase. Thus, we expect community similarity to increase with the number of shared exotic species, and the relative abundance of the exotic species in the Californian plots become more similar to those of the Spanish plots as their number increases.

2. Materials and Methods

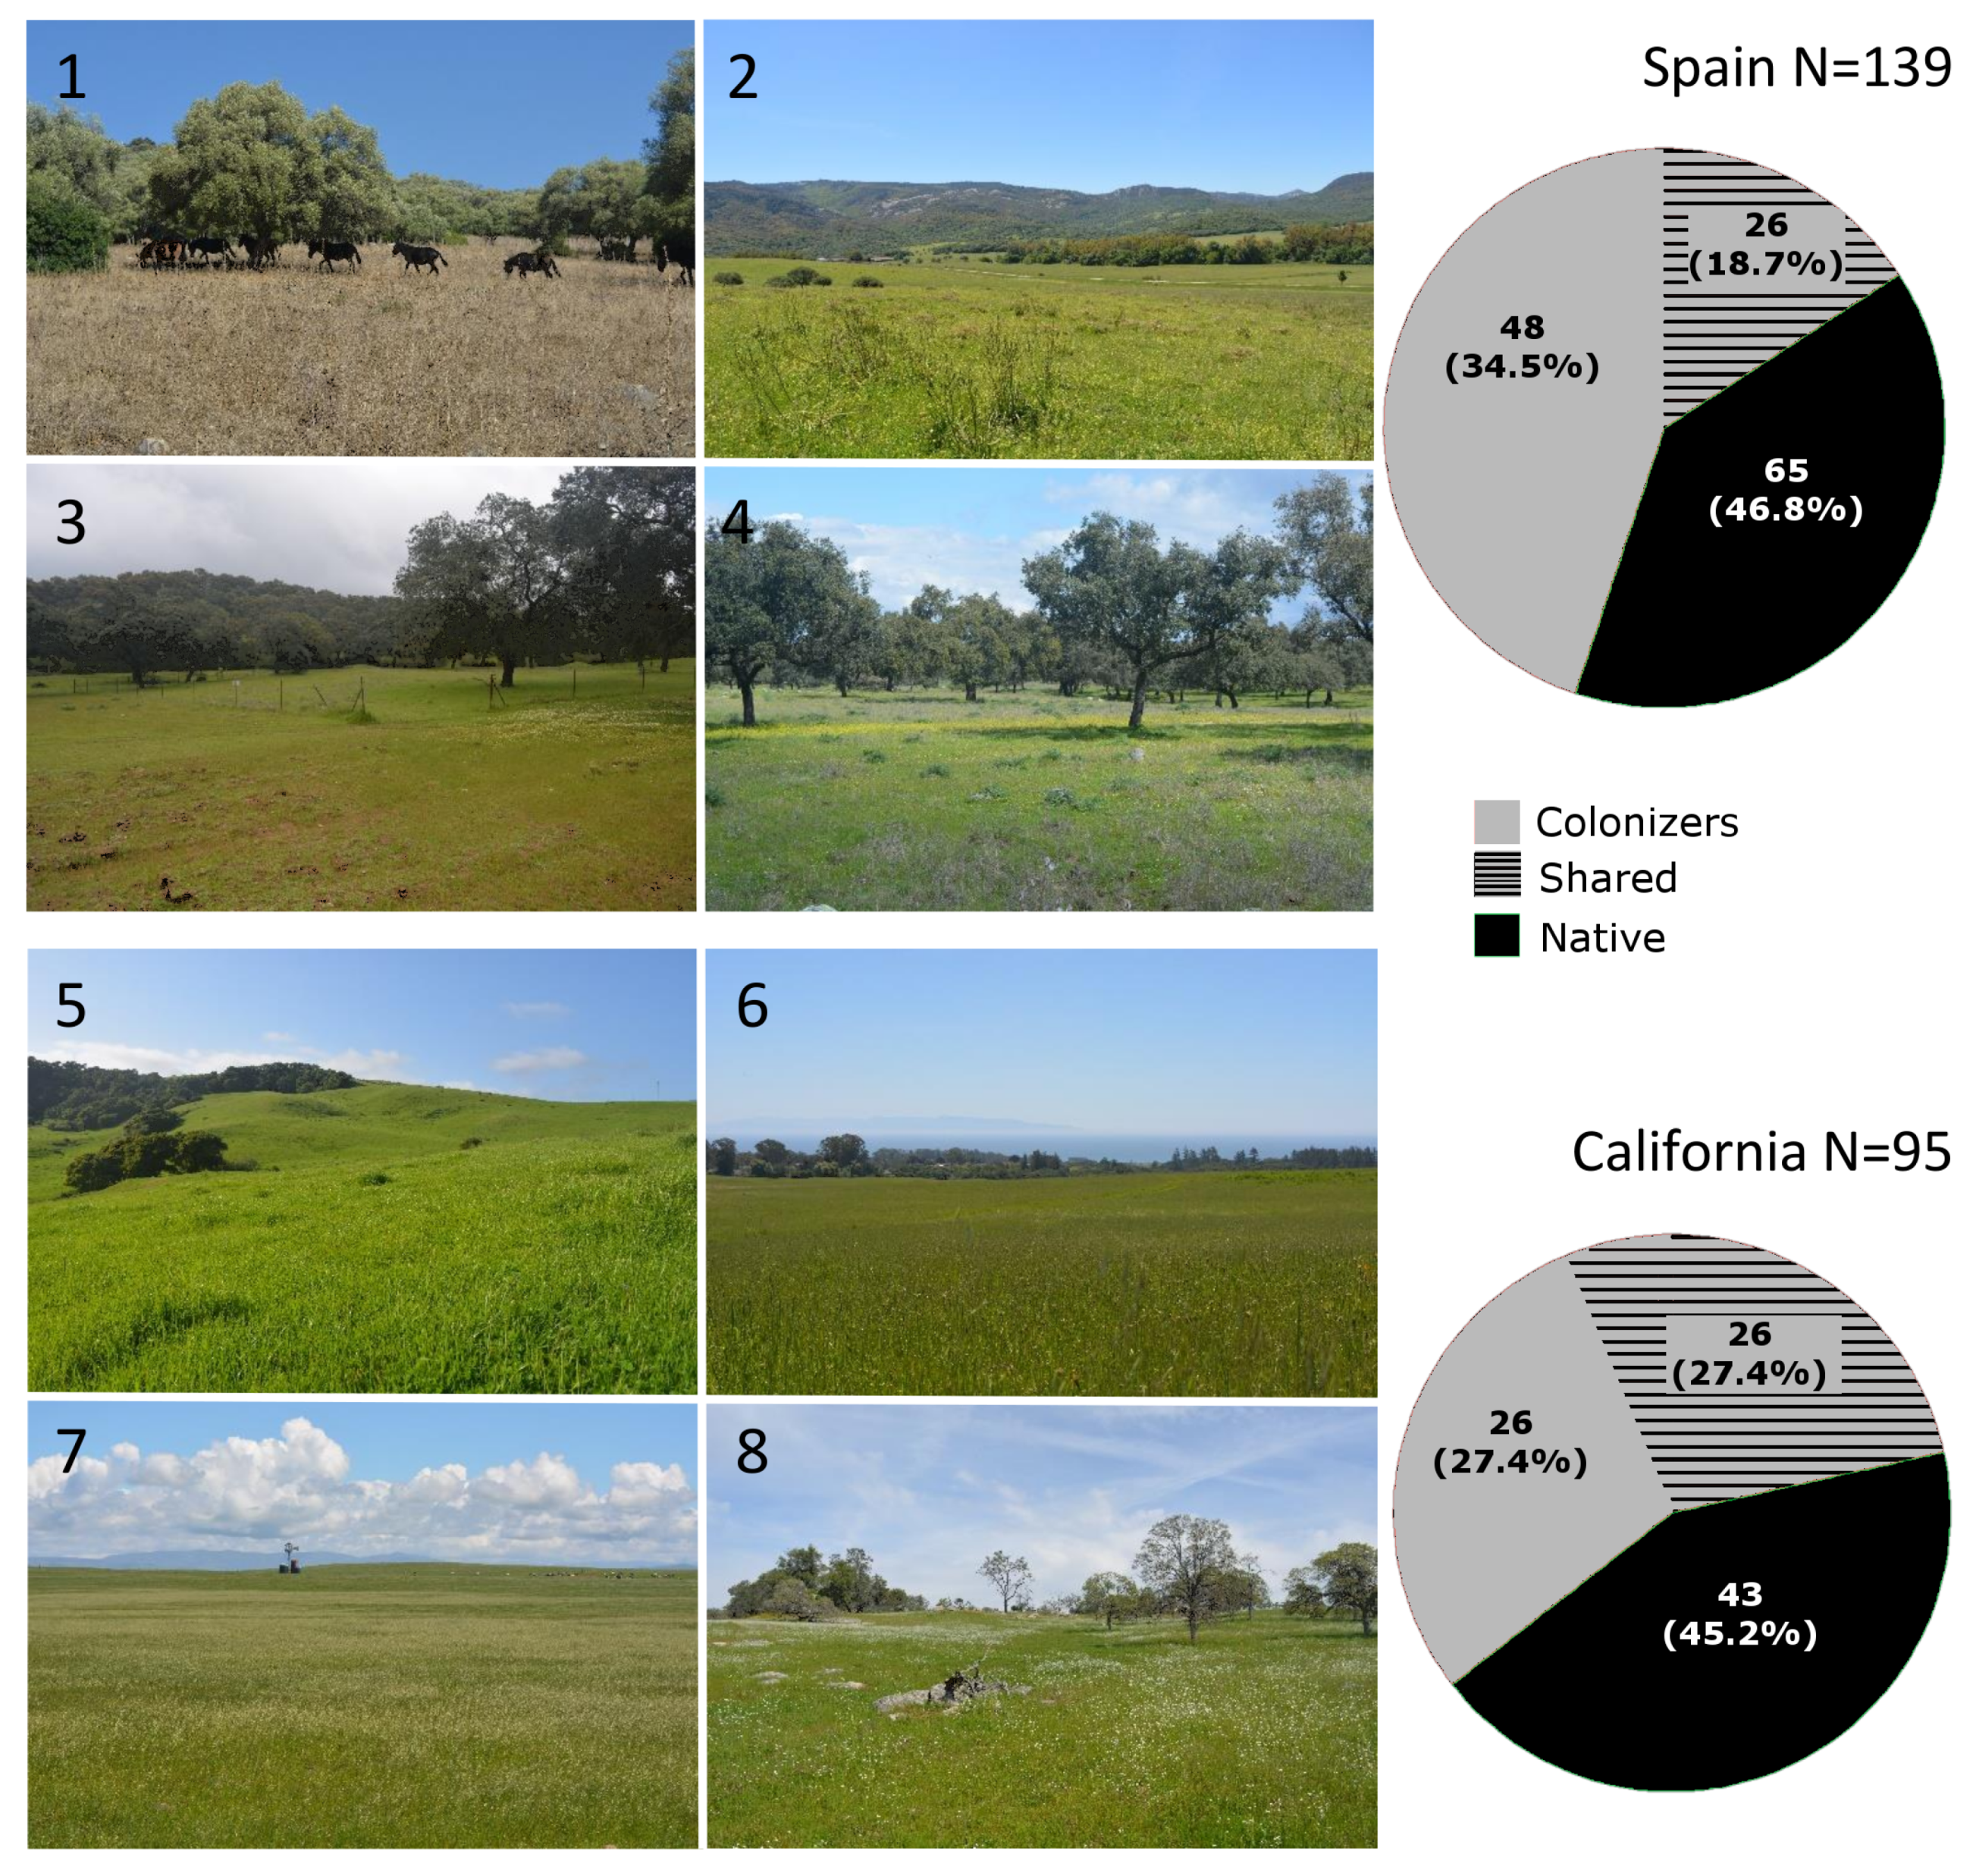
2.1. Grassland Surveys

From March 2018 to May 2018, we surveyed 60 plots across four grasslands in Spain, and from March 2019 to May 2019, we surveyed 60 plots across four grasslands in California (Figure 1). The four grasslands within a region were at least 6 km apart, and all eight grasslands were located in sites with similar climatic characteristics along a coastal–inland gradient (Table 1, Figure S1). Because soil disturbance influences the establishment of invasive species [24,27,28,29,30,31], we sampled sites with similar land-use histories for the last 30 years. Specifically, grasslands that had been continuously grazed by wild and domestic ungulates, and avoiding sites with any recent history of burning, ploughing or planting.
In each grassland, we recorded species composition and cover in fifteen (50 by 50 cm) plots situated along a 1 km transect. Plots within a grassland were at least 50 m apart and located avoiding ecotones with adjacent habitats such as woodlands or vernal pools. Cover was visually estimated according to an adapted Braun–Blanquet scale [32]: 1 = one or few individuals with cover less than 5%; 2 = one or few individuals with cover less than 25%; 3 = several individuals with cover between 25% and 50%; 4 = several individuals with cover between 50% and 75%; and 5 = several individuals with cover over 75%. Then, we calculated species relative cover abundances at the plot level by dividing the cover of each species by the total sum cover of all species present in the plot.
All species we found in Spanish grasslands, and all exotic species we found in California, were native to Spain [33,34]. We classified species as “colonizers” if they were species native to Spain and known to be introduced in California. Many colonizer species were not found in plots we surveyed in both regions. Thus, we referred as colonizer “shared” species as those common species we surveyed in both regions. (Figure 1). For statistical analyses, we only considered shared species that appeared in at least three plots per region (19 out of 26 species). Shared species were further separated according to their level of invasion in California into pests and non-pests [23]. Pest refers to non-native invasive species which once introduced, they quickly establish, reproduce, and spread, and cause economic or environmental harm [23]. The remaining species are referred to as “native,” which includes all native species in California grasslands, but only the subset of non-colonizer native species in Spain.

2.2. Statistical Analyses
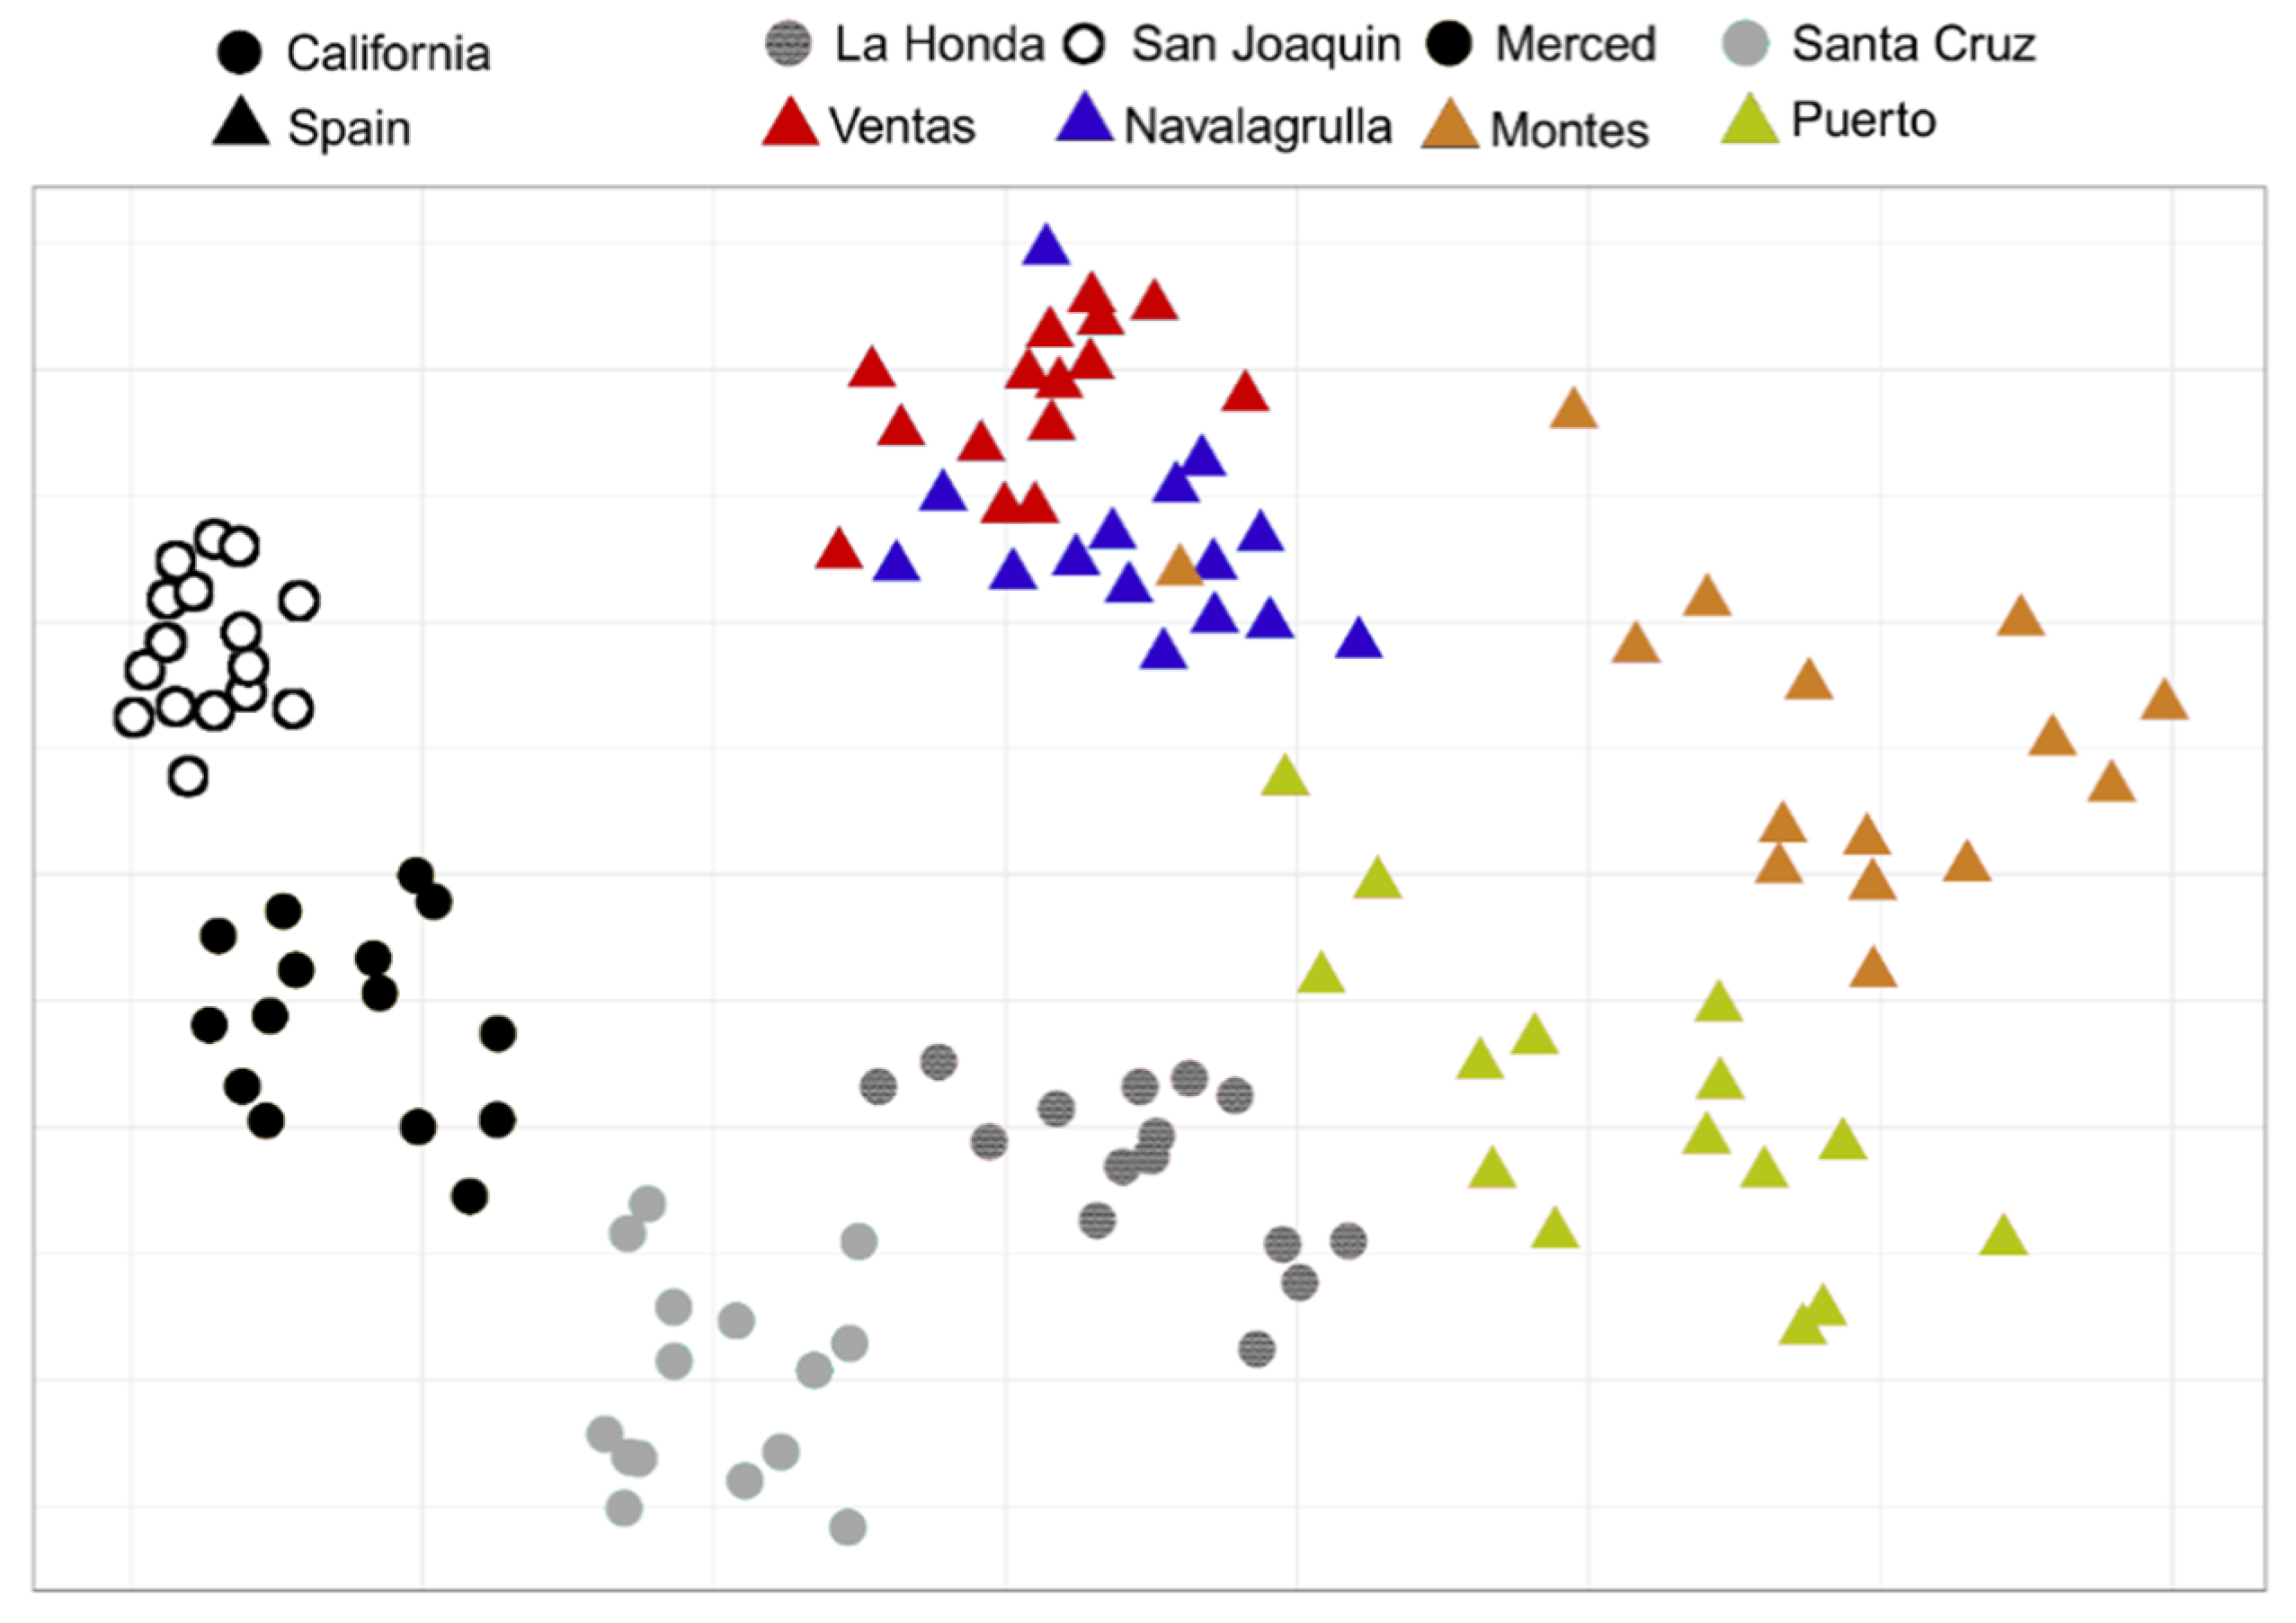
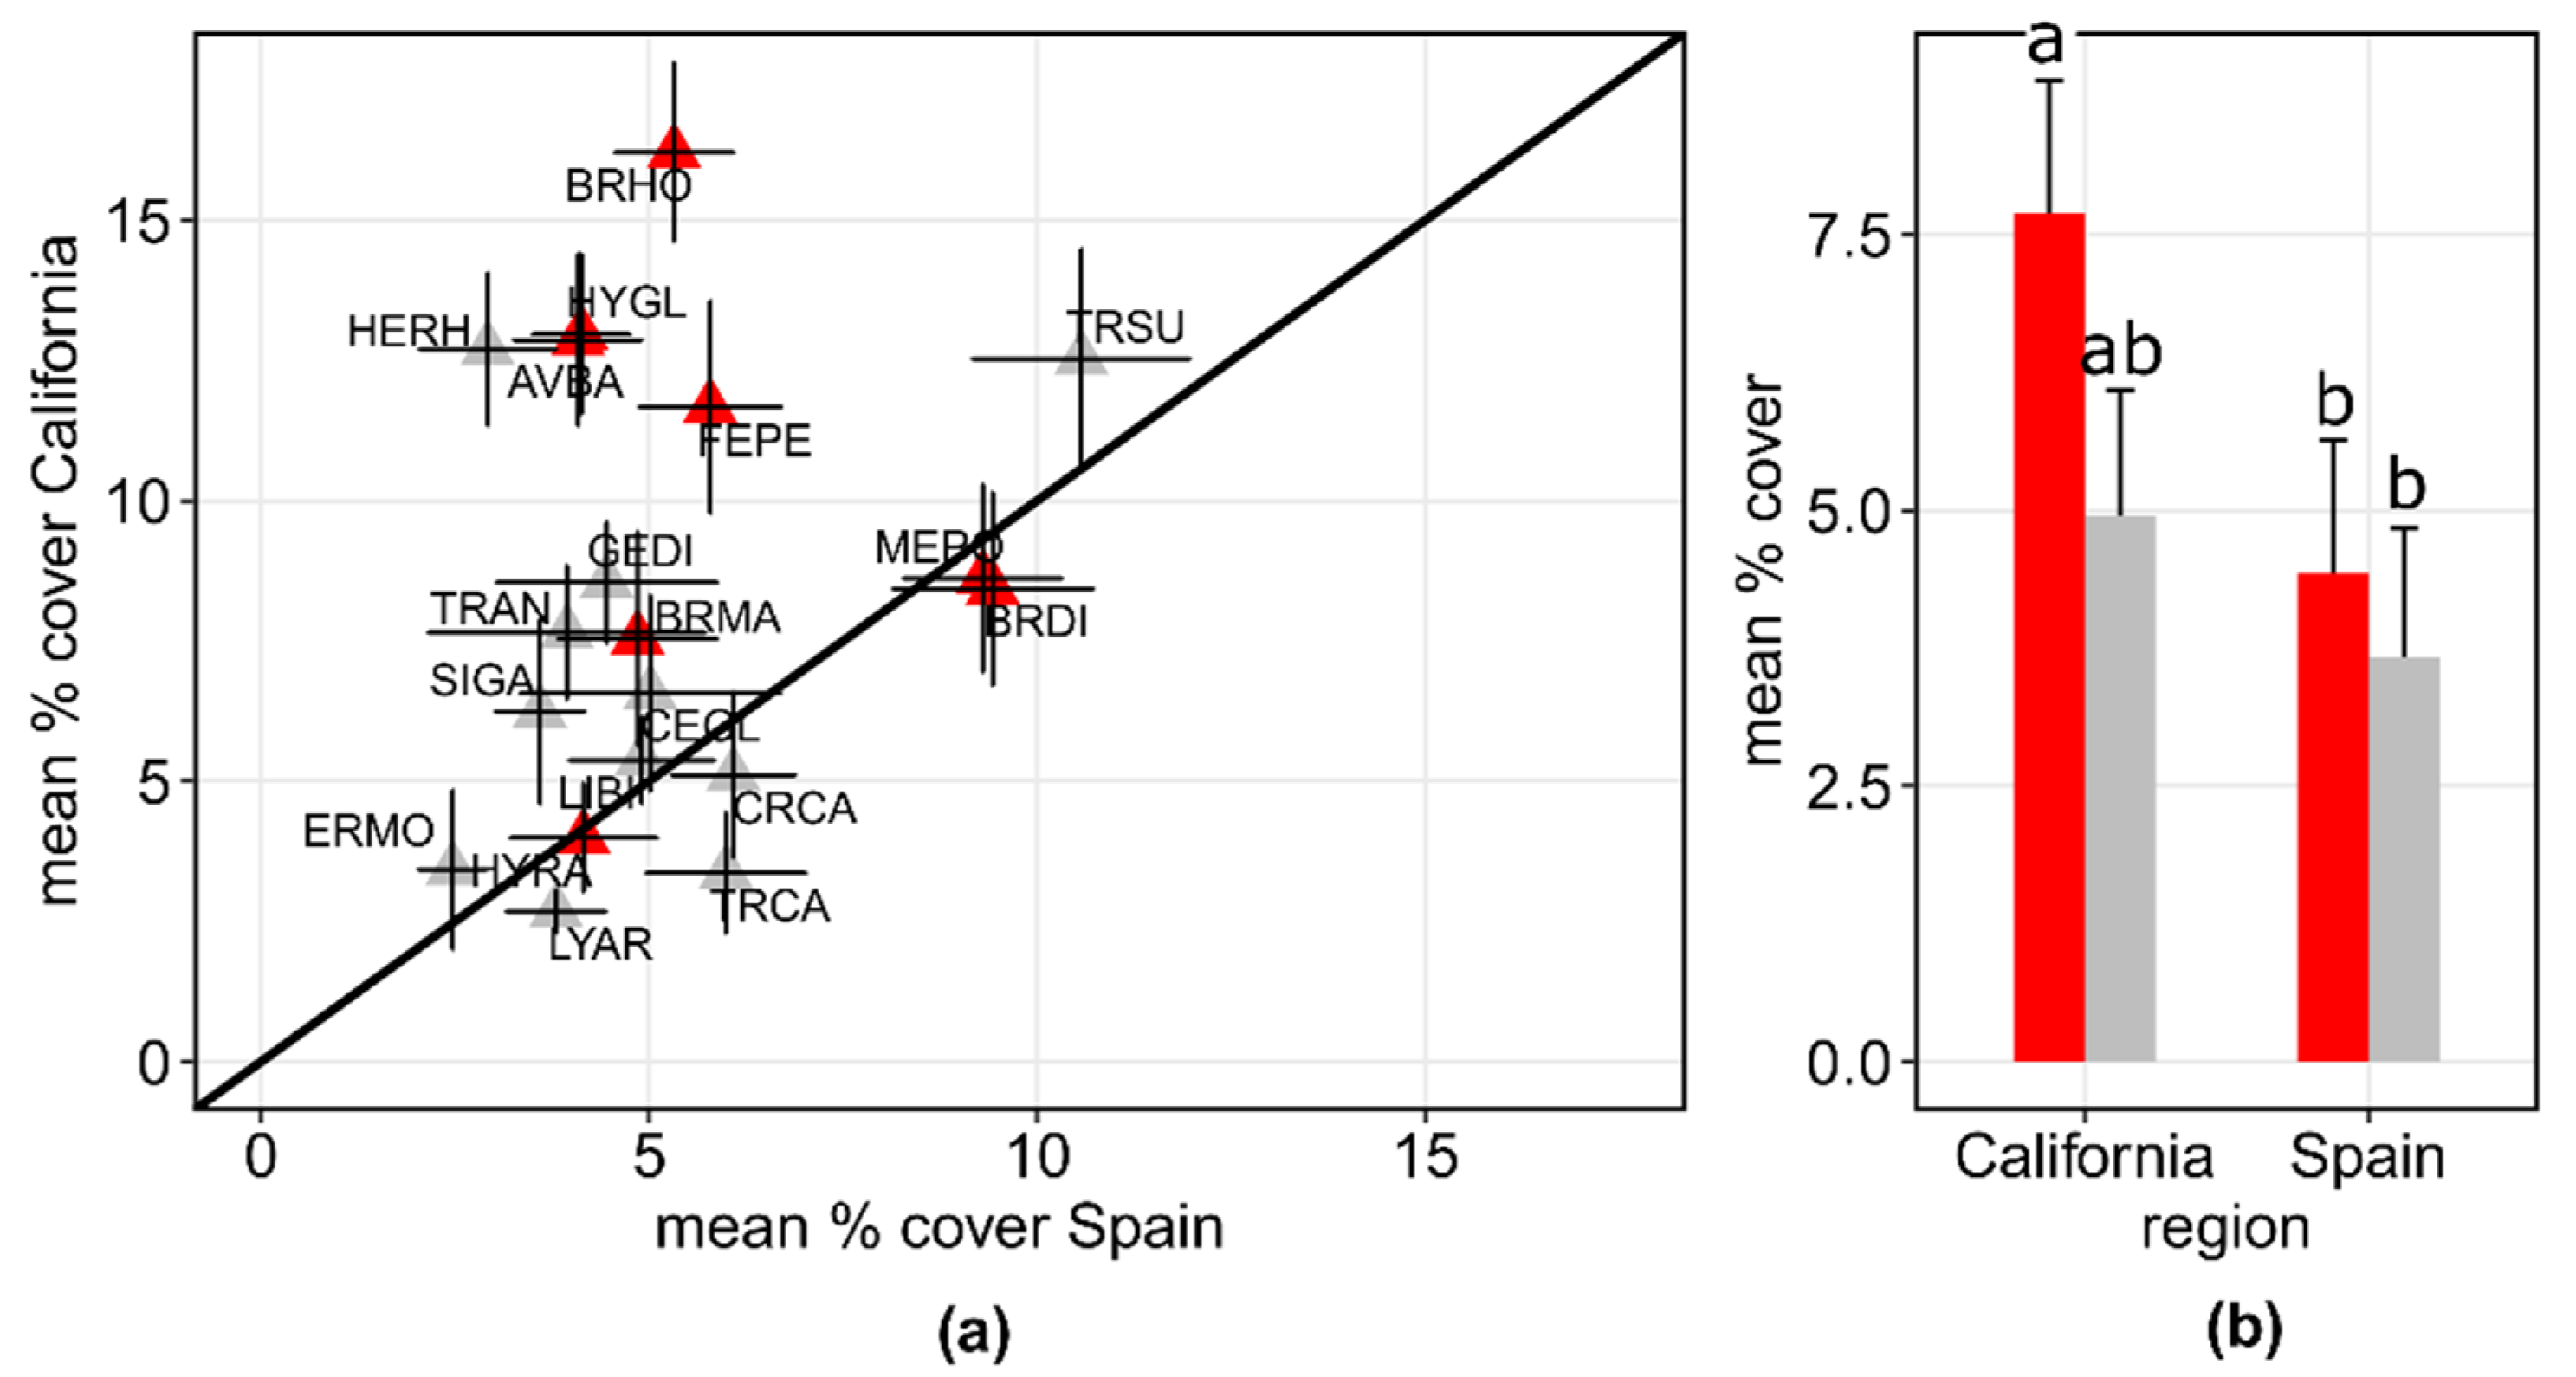
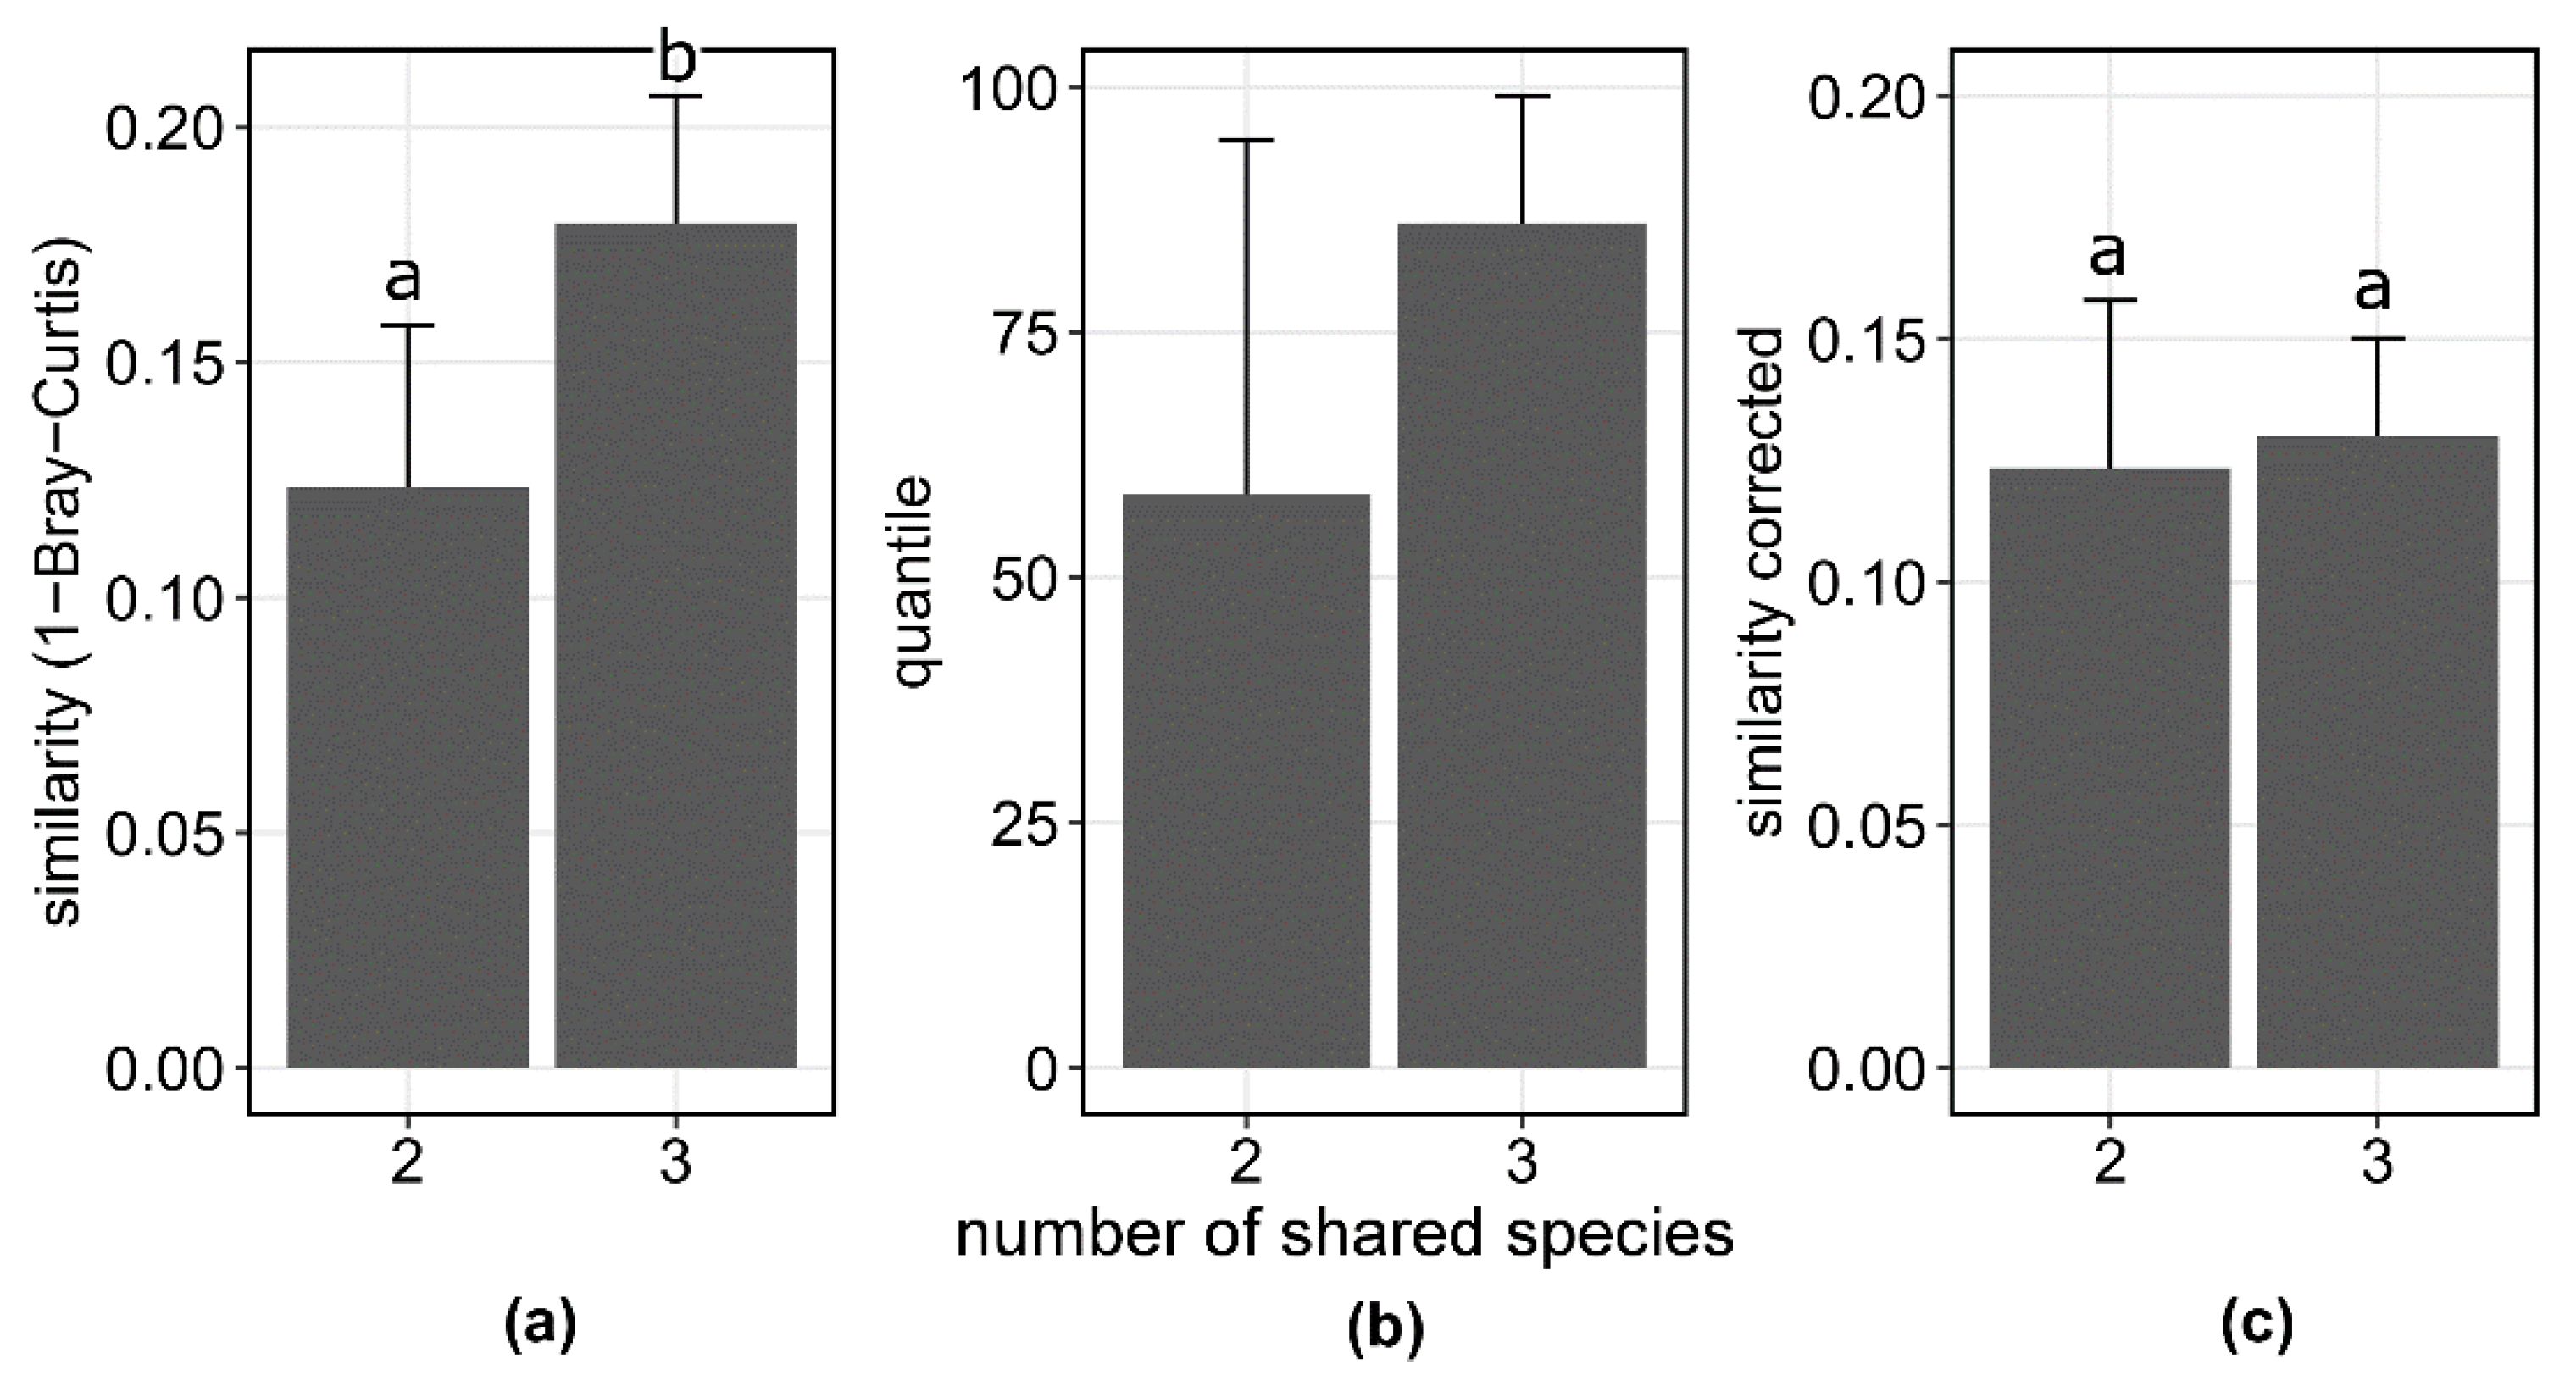
We assessed regional differences in total species richness and diversity (Shannon Index), as well as richness and relative cover of the three different groups of species per plot (native, colonizer, and shared). For this, we added the relative cover of native, colonizer, and shared species within each plot to obtain the proportion of shared, colonizer, and native species per plot, and fitted linear mixed models (LMM) with region as a fixed factor, and grassland as a random effect. We also compared richness and relative cover of native and colonizer species per plot within regions using LMM with origin as a fixed factor and grassland as a random effect. We ln-transformed relative cover to meet assumptions of normality and homoscedasticity of data [8]. We analyzed species richness using a log link function and a Poisson distribution error.
To explore overall floristic similarities between Californian and Spanish plots, we performed a two-dimensional non-metric multidimensional scaling (nMDS) analysis with Bray–Curtis dissimilarity. We square root transformed relative cover data to stress the importance of medium abundant and dominant species [36].
To check for changes in the assembly of shared species between regions, we conducted two analyses. First, we compared the abundance of shared species between Californian and Spanish plots. For each shared species, we calculated Hedges’d and bias-corrected 95% bootstrap-confidence interval as a measure of effect size. Hedges’d is an estimate of the standardized mean difference and it is not biased by small sample sizes. An effect size is significantly different from zero when its 95% confidence intervals do not bracket zero. Complementarily, we tested whether regional changes in mean cover of shared species depended on the level of invasion in California (pest vs. non-pest) by fitting LLM with region and level of invasion as fixed factors, and grassland and species as random effects.
Second, we assessed whether pools of shared species assembled similarly (i.e., exotics species maintain their relative abundances within the assemblage) in Californian and Spanish communities, and whether this depends on the richness of the shared pool. We included pairs of plots in Spain and California with two or three species in common (n = 46, only one pair of plots had four species in common). For each pair, we first calculated their similarity as 1−Bray–Curtis Dissimilarity Index (hereafter, observed similarity) as follows:
Observed   similarity a b = 1 j = 1 J | n a j n b j | n a + + n b +
where a and b refer to a pair of plots. j refers to each of the shared species. naj and nbj depicts the abundance of species j in plots a and b, respectively. na+ and nb+ depicts the total cover of species in plots a and b, respectively. Following Firn et al., we square root transformed the relative cover data prior to calculate the observed similarities to emphasize dominant and medium abundant species [7,36].
We later used this information to check two points. First, we calculated the probability of detecting the observed similarities by chance, and whether it decreased from two to three species. Just for the Californian plot, we created 99 null communities by reshuffling the abundance of its present species, and computed the similarity of the Spanish plot with each of its null Californian pairs (hereafter, null similarity). Then, we calculated the proportion of times that the observed similarity was higher than the null similarities. This value indicates the probability that the observed similarity may be random and that there is no similar assembly mechanism between the Californian and Spanish plots. Our null model is based on the general and global evidence that there are always “abundant” and “rare” species [37]. Thus, we assumed that colonizer species occupy the role of any pre-existing species (i.e., its abundance) and become an abundant or rare species, i.e., new exotic species in a recipient community do not disturb the general and global pattern of species assemblages. To check our assumption, we performed, on our communities, the same analyses as Calatayud et al. [37]; we found the same pattern. Secondly, we assessed whether the similarity between the plots in California and Spain also increases when the plots change from sharing two to three species, but correcting for the fact that the similarity between two plots can merely increase because of the inclusion of new shared species. The goal is to shed light on the presence of synergic effects among colonizer species when assembling in non-native communities. To this end, for each pair of plots with three species in common, we recalculated their similarity after removing each of the shared species from the Californian plot one at a time. We did this by removing the abundance of the given shared species from the numerator of the Bray–Curtis index, but not from the denominator. In that way, we simulate that the focal species is not shared, but it still exists in the community. We later averaged the recalculated similarities in each pair of plots, and compared the resulting values with the observed similarities of pairs of plots that shared two species with an ANOVA. If the average similarity after removing one shared species at a time is greater than the observed similarity of pairs of plots with two species in common, it would suggest that the more species they share, the more similar their relative abundances are compared to their native range. All statistical analyses were performed in the R-3.6.1 statistical platform [38].

3. Results

We recorded 139 species in Spain and 95 in California. In Spain, all species were native, of which 74 are known to be naturalized in California, i.e., colonizers (Figure 1). In California, we found 43 native species and 52 exotic species, all of which are native to Spain. Twenty-six species were found in plots of both regions: 15 are classified as non-pest and 11 as pest species [23]. Of these 26 shared species, there were 7 grasses (Poaceae) and 19 forbs, most commonly of the families Asteraceae (7 species) and Fabaceae (4 species).

3.1. Similarities of Californian and Spanish Grassland Communities

Spanish plots were significantly richer and more diverse than Californian plots (Table 2). In both regions, there were on average five more colonizers than native species per plot (California, native = all native species: F1,115 = 96.98, p < 0.001; Spain, native = non-colonizer: F1,115 = 103.26, p < 0.001). In Californian plots, Spanish colonizer species had four times greater cover than native species (F1,115 = 202.38, p < 0.001); whereas in Spain, colonizer species had twice greater cover than other native species (Spain: F1,118 = 92.65, p < 0.001). In Spain, even without including native colonizer species, there were three more native species per plot than in California, and these other species had twice as much cover per plot in Spain than native species in California (Table 2). The richness and cover of colonizer species was similar between Californian and Spanish plots. There were on average five shared species per plot in both Spain and California, but their cover was twice as high in California as in Spain (Table 2).
Communities segregated between regions (Figure 2). Interestingly, plots in La Honda Creek (California) were more similar to plots from Puerto (Spain) than to plots from San Joaquin and Merced. Communities within each region segregated in the nMDS plots according to their geographic distance (Figure 2).

3.2. Assembly of Shared Species in Californian and Spanish Grasslands

Of the 19 shared species included in these analyses, 6 were more abundant (i.e., mean cover per occupied plot) in Californian plots compared to Spanish plots. These were Hedypnois rhagadioloides, Hypochaeris glabra, Bromus hordeaceus, Avena barbata, Geranium dissectum, and Festuca perennis (Figure 3a). For the other 13 species the effect size was not significantly different from zero, i.e., they were equally abundant in Californian and Spanish plots (effect size estimates in Figure S2). Interestingly, when grouped by their level of invasion in California, shared species categorized as pests had a mean cover nearly two times greater in California, whereas non-pest species had similar mean relative cover in both regions (F3,39.9 = 7.33, p < 0.001; Figure 3b). Within regions, pest and non-pest species had similar relative cover (Figure 3b).
In total, 46 pairs of Californian and Spanish plots met the requirements to be included in the analyses of the assembly of pools of shared species in California and in Spain: 38 plot pairs shared two species (4 Californian plots/15 Spanish plots) and eight pairs shared three species (4/5). Pairs sharing three species were 5% more similar than pairs sharing two species (F1,43 = 18.66, p < 0.001; Figure 4a). The observed similarity between pairs sharing two species was 58.46% ± 36.17% (mean ± SE) greater than expected by chance, while the observed similarity between pairs of plots sharing three species was 86.13% ± 12.98% greater than expected by chance (Figure 4b). When corrected by the number of shared species, the similarities between pairs which shared two or three species were not significantly different (F1,43 = 0.27, p = 0.61; Figure 4c).

4. Discussion

Overall, Spanish grassland communities had greater species richness and diversity than Californian grasslands, as previously reported [39]. We show this result is primarily driven by a greater richness and cover of additional native non-colonizer species in Spain, in comparison to the abundance of native grassland species in California. It has been suggested that the cultural landscape of Europe may have promoted high levels of biodiversity through human-mediated niche construction [40]. On the other hand, the low number of native plants in California grasslands may well reflect an impoverished flora relative to its pre-invasion state [25]. It is unknown how many native species in California grasslands were locally (even globally) extirpated with the introduction and invasion of exotic plants and grazers from Spain starting in the 1700s [24]. Grasslands dominated by annual grasses can be considered a “novel ecosystem” in California; native-dominated perennial grasslands may have been poorly adapted to continuous grazing by livestock [26,28]. Interestingly, in Spain we did not find introduced plants from California or elsewhere. It has been hypothesized that exotic species might fail to establish in grasslands of the Mediterranean Basin because the herbaceous native flora is highly adapted to intense grazing and management regimes [19,41].
As we expected, we found a notable floristic similarity at the regional level. Half of the species found in Spain are colonizers, persisting as introduced species in California. Overall, these findings highlight the marked influence of the Mediterranean Basin as a donor of herbaceous exotic species to other Mediterranean regions [20]. In line with our results, Martín–Forés et al. also found that colonizer species accounted for half of the total species richness in surveys of Spanish grasslands, and that only a subset of the colonizer species were found in surveys of Mediterranean Chilean grasslands [42]. They suggest that this points to failures to establish after translocation. At the plot level, we also found that communities were strongly dominated by colonizer species in terms of both richness and cover. This translated into a high community similarity between regions. For example, La Honda Creek grasslands (California) were more similar in species composition to Puerto, Spain than to other California grasslands. La Honda Creek is close to San Francisco Bay, which is the California bioregion with the greatest number of exotic plant species [43]. In general, urban and agricultural landscapes are known to be positively correlated to propagule pressure [44]. The success of colonizer species in California grasslands is probably related to several interacting factors, such as a strong propagule pressure since the establishment of Spanish settlements in the 18th century [22], and the simultaneous introduction of agricultural practices traditionally in place in Europe [19].
Our results support the hypothesis that the abundance of exotic species in their native grasslands is a good indicator of their abundance in the introduced communities [7], but that this is also determined by the level of invasion of the exotic species in the introduced range [8]. Whereas non-pest species had similar relative cover in California and Spain, pest species were significantly more abundant in California. Interestingly, none of the species was more abundant in Spain. Overall, exotic species in Mediterranean grasslands might maintain their hierarchies, which suggests that they might be equally competitive in their native and introduced ranges [15,45,46]. This emphasizes the role of species attributes, in contrasts to external ecological factors, in influencing their establishment [8,16]. However, some species (i.e., pest species) might benefit from the biogeographical translocation and thrive under the ecological characteristics of the introduced region, becoming more abundant [14,16]. There is extensive evidence of the competitive dominance of these pest species in California grasslands, such as the grasses Bromus hordeaceus, B. madritensis, Brachypodium dystachyon, Avena barbata, and the forbs Hypochaeris spp. and Medicago polymorpha [24,27,28,29,31,39,47].
These analyses support our hypothesis that pools of exotic species might assemble more similarly in their native and recipient communities than expected by chance, i.e., species tend to maintain their relative abundances within home and away communities. We also observed that the average similarity between plots increased as they went from sharing two to sharing three species. However, the assembly of shared species in Spain and California was not more similar as the richness of the pool of shared species increased. This lack of evidence is most probably related to our limited sample size. Firn et al. observed that similarities between communities were higher as shared species increased from 10, even without correcting for shared species richness (Figure S1 in [7]). The absence of a strong effect in our study may be explained by the low numbers of shared species overall and how similarity is calculated. Note that a similarity value of two hypothetical communities sharing one species is higher if the exotic species is more abundant than rare. Because the abundant species has a higher influence on the similarity estimate, it is expected that for communities with the same number of shared species, their similarities will fluctuate less if they have more abundant species (i.e., assuming that species have similar relative cover in the native and recipient communities, as in our system). In addition, if species are introduced stochastically, the probability of containing more abundant species is positively correlated with the number of shared species. We thus expect that communities sharing fewer species will have more variation associated with stochastic processes, making it difficult to detect clear patterns. We encourage future studies comparing communities with a wider range of shared species to better understand exotic species assemblage in the introduced range [5].
Our results are among the first to compare the assembly of plant species in native and recipient communities, using the unidirectional flow of grassland species from Spain to California as a model system. We show that there are consistent differences in species richness and diversity at the regional and plot scale between Spain and California, which underscores the importance of community context when comparing exotic species between their native and introduced ranges [9]. Our study supports the claim that exotic species perform in a similar way in a given habitat type regardless the biogeographical region [7], and that only the subset that become invasive pests are consistently more abundant [8]. Furthermore, exotic species may maintain hierarchies of abundances when they co-occur together outside their native range, an interesting finding in the context of novel ecosystems.

Supplementary Materials

The following are available online at https://www.mdpi.com/1424-2818/12/5/193/s1, Figure S1: Location of sites considered in this study. Figure S2: Effect sizes (Hedges’d) of comparison of individual shared species abundances between Spain and California. Table S1: Species found in the surveys. Table S2: Soil properties of studied sites.

Author Contributions

Conceptualization, J.G.D., M.V. and M.J.L.; methodology, J.G.D., E.G.d.l.R. and R.B.-M.; formal analysis, J.G.D., E.G.d.l.R. and R.B.-M.; resources, J.G.D., M.V. and I.M.P.; data curation, J.G.D.; writing—original draft preparation, J.G.D.; writing—review and editing, J.G.D., E.G.d.l.R., I.M.P., M.J.L., R.B.-M., M.V. supervision, M.V. and E.G.d.l.R.; funding acquisition J.G.D. and M.V. All authors have read and agreed to the published version of the manuscript.

Funding

J.G.D. has received financial support through “la Caixa” INPhINIT Fellowship Grant for Doctoral studies at Spanish Research Centres of Excellence (LCF/BQ/DI17/11620012). M.V. from Belmont Forum-BiodivERsA project InvasiBES (PCI2018-092939) funded by the Spanish Ministerio de Ciencia, Innovación y Universidades.

Acknowledgments

We thank Caroline Dykstra, David Ragel and Rosa Sutcliffe for fieldwork assistance.

Conflicts of Interest

The authors declare no conflict of interest. The funders had no role in the design of the study; in the collection, analyses, or interpretation of data; in the writing of the manuscript, or in the decision to publish the results.

References

  1. McKinney, M.L. Measuring floristic homogenization by non-native plants in North America. Glob. Ecol. Biogeogr. 2004, 13, 47–53. [Google Scholar] [CrossRef]
  2. Sax, D.F.; Gaines, S.D. Species diversity: From global decreases to local increases. Trends Ecol. Evol. 2003, 18, 561–566. [Google Scholar] [CrossRef]
  3. Winter, M.; Schweiger, O.; Klotz, S.; Nentwig, W.; Andriopoulos, P.; Arianoutsou, M.; Basnou, C.; Delipetrou, P.; Didziulis, V.; Hejda, M.; et al. Plant extinctions and introductions lead to phylogenetic and taxonomic homogenization of the European flora. Proc. Natl. Acad. Sci. USA 2009, 106, 21721–21725. [Google Scholar] [CrossRef] [PubMed] [Green Version]
  4. Bernardo-Madrid, R.; Calatayud, J.; González-Suárez, M.; Rosvall, M.; Lucas, P.M.; Rueda, M.; Antonelli, A.; Revilla, E. Human activity is altering the world’s zoogeographical regions. Ecol. Lett. 2019, 22, 1297–1305. [Google Scholar] [CrossRef]
  5. Stotz, G.C.; Cahill, J.F.; Bennett, J.A.; Carlyle, C.N.; Bork, E.W.; Askarizadeh, D.; Bartha, S.; Beierkuhnlein, C.; Boldgiv, B.; Brown, L.; et al. Not a melting pot: Plant species aggregate in their non-native range. Glob. Ecol. Biogeogr. 2020, 29, 482–490. [Google Scholar] [CrossRef] [Green Version]
  6. Van Kleunen, M.; Dawson, W.; Essl, F.; Pergl, J.; Winter, M.; Weber, E.; Kreft, H.; Weigelt, P.; Kartesz, J.; Nishino, M.; et al. Global exchange and accumulation of non-native plants. Nature 2015, 525, 100–103. [Google Scholar] [CrossRef] [PubMed] [Green Version]
  7. Firn, J.; Moore, J.L.; MacDougall, A.S.; Borer, E.T.; Seabloom, E.W.; HilleRisLambers, J.; Harpole, W.S.; Cleland, E.E.; Brown, C.S.; Knops, J.M.H.H.; et al. Abundance of introduced species at home predicts abundance away in herbaceous communities. Ecol. Lett. 2011, 14, 274–281. [Google Scholar] [CrossRef]
  8. Pearson, D.E.; Eren, Ö.; Ortega, Y.K.; Villarreal, D.; Şentürk, M.; Miguel, M.F.; Weinzettel, C.M.; Prina, A.; Hierro, J.L. Are exotic plants more abundant in the introduced versus native range? J. Ecol. 2018, 106, 727–736. [Google Scholar] [CrossRef]
  9. Hierro, J.L.; Maron, J.L.; Callaway, R.M. A biogeographical approach to plant invasions: The importance of studying exotics in their introduced and native range. J. Ecol. 2005, 93, 5–15. [Google Scholar] [CrossRef]
  10. Hejda, M.; Štajerová, K.; Pyšek, P. Dominance has a biogeographical component: Do plants tend to exert stronger impacts in their invaded rather than native range? J. Biogeogr. 2017, 44, 18–27. [Google Scholar] [CrossRef] [Green Version]
  11. Hejda, M.; Štajerová, K.; Pergl, J.; Pyšek, P. Impacts of dominant plant species on trait composition of communities: Comparison between the native and invaded ranges. Ecosphere 2019, 10. [Google Scholar] [CrossRef]
  12. Sounding, E.; Sax, D.F.; Brown, J.H. The paradox of invasion. Glob. Ecol. Biogeogr. 2000, 9, 363–371. [Google Scholar] [CrossRef]
  13. Guerin, G.R.; Martín-Forés, I.; Sparrow, B.; Lowe, A.J. The biodiversity impacts of non-native species should not be extrapolated from biased single-species studies. Biodivers. Conserv. 2018, 27, 785–790. [Google Scholar] [CrossRef]
  14. Parker, J.D.; Torchin, M.E.; Hufbauer, R.A.; Bossdorf, O.; Byers, J.E.; Dunn, A.M.; Heckman, R.W.; Hejda, M.; Jarosik, V.; Kanarek, A.; et al. Do invasive species perform better in their new ranges? Ecology 2013, 94, 1–8. [Google Scholar] [CrossRef] [PubMed] [Green Version]
  15. Thompson, K.; Hodgson, J.G.; Rich, T.C.G.G. Native and alien invasive plants: More of the same? Ecography 1995, 18, 390–402. [Google Scholar] [CrossRef]
  16. Colautti, R.; Parker, J.D.; Cadotte, M.W.; Pyšek, P.; Brown, C.S.; Sax, D.; Richardson, D. Quantifying the invasiveness of species. NeoBiota 2014, 21, 7–27. [Google Scholar] [CrossRef] [Green Version]
  17. Arianoutsou, M.; Delipetrou, P.; Vilà, M.; Dimitrakopoulos, P.G.; Celesti-Grapow, L.; Wardell-Johnson, G.; Henderson, L.; Fuentes, N.; Ugarte-Mendes, E.; Rundel, P.W. Comparative Patterns of Plant Invasions in the Mediterranean Biome. PLoS ONE 2013, 8, e79174. [Google Scholar] [CrossRef] [Green Version]
  18. De Miguel, J.M.; Martín-Forés, I.; Acosta-Gallo, B.; Del Pozo, A.; Ovalle, C.; Sánchez-Jardón, L.; Castro, I.; Casado, M.A. Non-random co-occurrence of native and exotic plant species in Mediterranean grasslands. Acta Oecologica 2016, 77, 18–26. [Google Scholar] [CrossRef]
  19. MacDougall, A.S.; McCune, J.L.; Eriksson, O.; Cousins, S.; Pärtel, M.; Firn, J.; Hierro, J.L. The Neolithic Plant Invasion Hypothesis: The role of preadaptation and disturbance in grassland invasion. New Phytol. 2018. [Google Scholar] [CrossRef]
  20. Casado, M.A.; Martín-Forés, I.; Castro, I.; De Miguel, J.M.; Acosta-Gallo, B. Asymmetric flows and drivers of herbaceous plant invasion success among Mediterranean-climate regions. Sci. Rep. 2018, 8, 16834. [Google Scholar] [CrossRef]
  21. Martín-Forés, I. Exotic Plant Species in the Mediterranean Biome: A Reflection of Cultural and Historical Relationships. Mediterr. Identities Environ. Soc. Cult. 2017. [Google Scholar] [CrossRef] [Green Version]
  22. Rejmánek, M.; Randall, J. Invasive alien plants in California: 1993 summary and comparison with other areas in North America. Madroño 1994, 41, 161–177. [Google Scholar]
  23. California Invasive Plant Inventory (Cal-IPC). Available online: www.cal-ipc.org (accessed on 25 September 2019).
  24. D’Antonio, C.M.; Vitousek, P.M. Biological Invasions by Exotic Grasses, the Grass/Fire Cycle, and Global Change. Annu. Rev. Ecol. Syst. 1992, 23, 63–87. [Google Scholar] [CrossRef]
  25. Minnich, R.A. California’s Fading Wildflowers: Lost Legacy and Biological Invasions; University of California Press: Berkeley, CA, USA, 2008; ISBN 9780520253537. [Google Scholar]
  26. Hamilton, J.G. Changing perceptions of pre-European grasslands in California. Madroñoo 1997, 44, 311–333. [Google Scholar]
  27. Stromberg, M.R.; Griffin, J.R. Long-Term Patterns in Coastal California Grasslands in Relation to Cultivation, Gophers, and Grazing. Ecol. Appl. 1996, 6, 1189–1211. [Google Scholar] [CrossRef]
  28. Corbin, J.D.; D’Antonio, C.M. Competition between native perennial and exotic annual grasses: Implications for an historical invasion. Ecology 2004, 85, 1273–1283. [Google Scholar] [CrossRef]
  29. HilleRisLambers, J.; Yelenik, S.G.; Colman, B.P.; Levine, J.M. California annual grass invaders: The drivers or passengers of change? J. Ecol. 2010, 98, 1147–1156. [Google Scholar] [CrossRef] [Green Version]
  30. Reilly, M.J.; McCord, M.G.; Brandt, S.M.; Linowksi, K.P.; Butz, R.J.; Jules, E.S. Repeated, high-severity wildfire catalyzes invasion of non-native plant species in forests of the Klamath Mountains, northern California, USA. Biol. Invasions 2020, 22, 1821–1828. [Google Scholar] [CrossRef]
  31. Stuble, K.L.; Young, T.P. Priority Treatment Leaves Grassland Restoration Vulnerable to Invasion. Diversity 2020, 12, 71. [Google Scholar] [CrossRef] [Green Version]
  32. Martín-Forés, I.; Guerin, G.R.; Lowe, A.J. Weed abundance is positively correlated with native plant diversity in grasslands of southern Australia. PLoS ONE 2017, 12, 1–13. [Google Scholar] [CrossRef] [Green Version]
  33. Valdés, B.; Talavera, S.; Galiano, E.F. Flora Vascular de Andalucía Occidental; Ketres Editores, S.A.: Barcelona, Spain, 1987; ISBN 84-85256-63-8. [Google Scholar]
  34. Calflora: Information on California Plants for Education, Research and Conservation. Available online: https://www.calflora.org/ (accessed on 25 September 2019).
  35. Fick, S.E.; Hijmans, R.J. Worldclim 2: New 1-km spatial resolution climate surfaces for global land areas. Int. J. Climatol. 2017, 37, 4302–4315. [Google Scholar] [CrossRef]
  36. Clarke, K.R.; Green, R.H. Statistical design and analysis for a “biological effects” study. Mar. Ecol. Prog. Ser. 1988, 46, 213–226. [Google Scholar] [CrossRef]
  37. Calatayud, J.; Andivia, E.; Escudero, A.; Melián, C.J.; Bernardo-Madrid, R.; Stoffel, M.; Aponte, C.; Medina, N.G.; Molina-Venegas, R.; Arnan, X.; et al. Positive associations among rare species and their persistence in ecological assemblages. Nat. Ecol. Evol. 2020, 4, 40–45. [Google Scholar] [CrossRef] [PubMed]
  38. R Core Team. R: A Language and Environment for Statistical Computing (R-3.6.1); R Foundation for Statistical Computing: Vienna, Austria, 2019. [Google Scholar]
  39. Leiva, M.J.; Chapin, F.S.; Fernandez Ales, R. Differences in species composition and diversity among Mediterranean grasslands with different history—The case of California and Spain. Ecography 1997, 20, 97–106. [Google Scholar] [CrossRef]
  40. Eriksson, O. Species pools in cultural landscapes—Niche construction, ecological opportunity and niche shifts. Ecography 2013, 36, 403–413. [Google Scholar] [CrossRef]
  41. La Sorte, F.A.; Pyšek, P. Extra-regional residence time as a correlate of plant invasiveness: European archaeophytes in north America. Ecology 2009, 90, 2589–2597. [Google Scholar] [CrossRef] [Green Version]
  42. Martín-Forés, I.; Sánchez-Jardón, L.; Acosta-Gallo, B.; Del Pozo, A.; Castro, I.; De Miguel, J.M.; Ovalle, C.; Casado, M.A. From Spain to Chile: Environmental filters and success of herbaceous species in Mediterranean-climate regions. Biol. Invasions 2015, 17, 1425–1438. [Google Scholar] [CrossRef]
  43. Dark, S.J. The biogeography of invasive alien plants in California: An application of GIS and spatial regression analysis. Divers. Distrib. 2004, 10, 1–9. [Google Scholar] [CrossRef]
  44. Chytrý, M.; Jarošík, V.; Pyšek, P.; Hájek, O.; Knollová, I.; Tichý, L.; Danihelka, J.; Maskell, L.C.; Pino, J.; Pyšek, P.; et al. Separating Habitat Invasibility By Alien Plants. Ecology 2008, 89, 1541–1553. [Google Scholar] [CrossRef] [Green Version]
  45. Sutherland, S. What makes a weed a weed: Life history traits of native and exotic plants in the USA. Oecologia 2004, 141, 24–39. [Google Scholar] [CrossRef]
  46. Van Kleunen, M.; Weber, E.; Fischer, M. A meta-analysis of trait differences between invasive and non-invasive plant species. Ecol. Lett. 2010, 13, 235–245. [Google Scholar] [CrossRef] [PubMed] [Green Version]
  47. Molinari, N.A.; D’Antonio, C.M. Structural, compositional and trait differences between native- and non-native-dominated grassland patches. Funct. Ecol. 2014, 28, 745–754. [Google Scholar] [CrossRef] [Green Version]
Figure 1. Study grassland sites in the native and the introduced range. Spain (native region): 1. Puerto de la Pared, 2. Montes de Propios, 3. Ventas Quemadas, 4. Navalagrulla. California (introduced region): 5. La Honda Creek, 6. University of California Santa Cruz, 7. Merced Vernal Pools and Grassland Reserve, and 8. San Joaquin Experimental Range. Pie-charts indicate the number and percentage of species in the following categories. Colonizers are Spanish origin species known to be established in California, many colonizer species found in plots of one region were not found in the plots of the other. Shared species are the subset of colonizer species observed in our plots in both regions. Natives refer to non-colonizer native species in Spain and all native species in California. The location of each grassland and species list are available in Figure S1 and Table S1, respectively.
Diversity 12 00193 g001
Figure 2. Non-metric multidimensional scaling (nMDS) analysis with species composition and abundance in grassland plots in California (circles) and Spain (triangles). Analysis was done using Bray–Curtis dissimilarity. Relative cover was square root transformed. Two-dimensional stress was set to 0.17.
Diversity 12 00193 g002
Figure 3. (a) mean relative cover per plot of shared species in grassland plots in California and Spain, with indication of their level of invasion in California: Non-pest (grey) and pest (red). The 1:1 line indicates equal abundance between regions. (b) relative cover of shared species grouped by their level of invasion in California. Different letters on bars indicate significant differences (p < 0.05) according to LMM with region and level of invasion as a fixed factor and grassland and species as random factors. Error bars indicate SE. AVBA: Avena barbata, BRDI: Brachypodium distachyon, BRHO: Bromus hordeaceus, BRMA: Bromus madritensis, CEGL: Cerastium glomeratum, CRCA: Crepis capillaris, ERMO: Erodium moschatum, FEPE: Festuca perennis, GEDI: Geranium dissectum, HERH: Hedypnois rhagadioloides, HYGL: Hypochaeris glabra, HYRA: Hypochaeris radicata, LIBI: Linum bienne, LYAR: Lysimachia arvensis, MEPO: Medicago polymorpha, SIGA: Silene gallica, TRAN: Trifolium angustifolium, TRCA: Trifolium campestre, and TRSU: Trifolium subterraneum.
Diversity 12 00193 g003
Figure 4. (a) averaged observed similarities between pairs of Californian and Spanish plots grouped by the number of shared species. (b) proportion of null communities with similarities (1–Bray–Curtis) smaller than the observed similarity. (c) comparison of the averaged observed similarities of pairs of plots with two shared species (same as 4a), with the similarity of plots with three shared species, corrected by the number of shared species. Error bars indicate SE. Different letters on bars indicate significant differences (p < 0.05).
Diversity 12 00193 g004
Table 1. Characteristics of the sampled grasslands. Altitude and climate: Mean annual rainfall (MAR), mean annual temperature (MAT), and minimum temperature of coldest month (MCM), extracted from WorldClim [35]. Soil properties: N concentration, available phosphorus (P), carbon and nitrogen ratio (C:N), organic matter (OM) (mean ± SE), and pH. Information on measurements of soil properties can be found in Table S2. Total species richness and number of species per group. Colonizers are Spanish origin species established in California. Shared species are the subset of colonizers observed in our plots in both regions. Natives refer to non-colonizer native species in Spain and all native species in California.
RegionGrasslandAltitude (m)MAR (mm)MAT (°C)MCM (°C)N (%)P (mg/kg)C:NOM (%)pHRichnessNativesColonizersShared
SpainNavalagrulla3005961740.13 ± 0.0110.70 ± 1.4612.41 ± 0.072.88 ± 0.166–763184519
Ventas2806171740.13 ± 0.027.26 ± 0.9512.31 ± 0.522.78 ± 0.476–760233717
Montes1807531770.23 ± 0.0313.72 ± 3.9212.18 ± 0.354.80 ± 0.776–753233011
Puerto2457961650.17 ± 0.028.10 ± 0.7912.32 ± 0.873.64 ± 0.496–761283314
CaliforniaSan Joaquin3105191620.08 ± 0.018.86 ± 3.3013.01 ± 0.941.80 ± 0.216–73117148
Merced1003751620.23 ± 0.054.54 ± 1.0010.70 ± 0.494.26 ± 1.056–732191310
Santa Cruz1157691440.19 ± 0.024.44 ± 1.3712.18 ± 0.633.99 ± 0.356–73182314
La Honda4057941340.28 ± 0.0318.66 ± 4.1612.40 ± 0.685.82 ± 0.626–73172416
Table 2. Results of linear mixed models (LMM) on native and exotic species diversity, richness, and total relative cover (model estimate ± SE) between grassland plots in California and Spain. Colonizers are Spanish origin species established in California. Shared species are the subset of colonizers observed in our plots in both regions. Natives refers to non-colonizer native species in Spain and all native species in California.
Variable (per Plot)CaliforniaSpainDfFp
Total Shannon diversity2.09 ± 0.072.51 ± 0.111,615.380.007
Total richness11.05 ± 1.0516.65 ± 1.071,632.11<0.001
Richness natives2.62 ± 1.255.69 ± 1.361,66.440.01
Richness colonizers7.53 ± 1.1310.71 ± 1.201,63.170.08
Richness shared species5.39 ± 1.194.89 ± 1.281,60.160.69
Cover natives17.64 ± 15.5433.47 ± 23.391,67.490.03
Cover colonizers81.11 ± 8.0361.69 ± 11.431,65.750.05
Cover shared species59.20 ± 11.1526.57 ± 11.671,626.890.002

