Trappings of Success: Predator Removal for Duck Nest Survival in Alberta Parklands


Abstract
1. Introduction
2. Materials and Methods
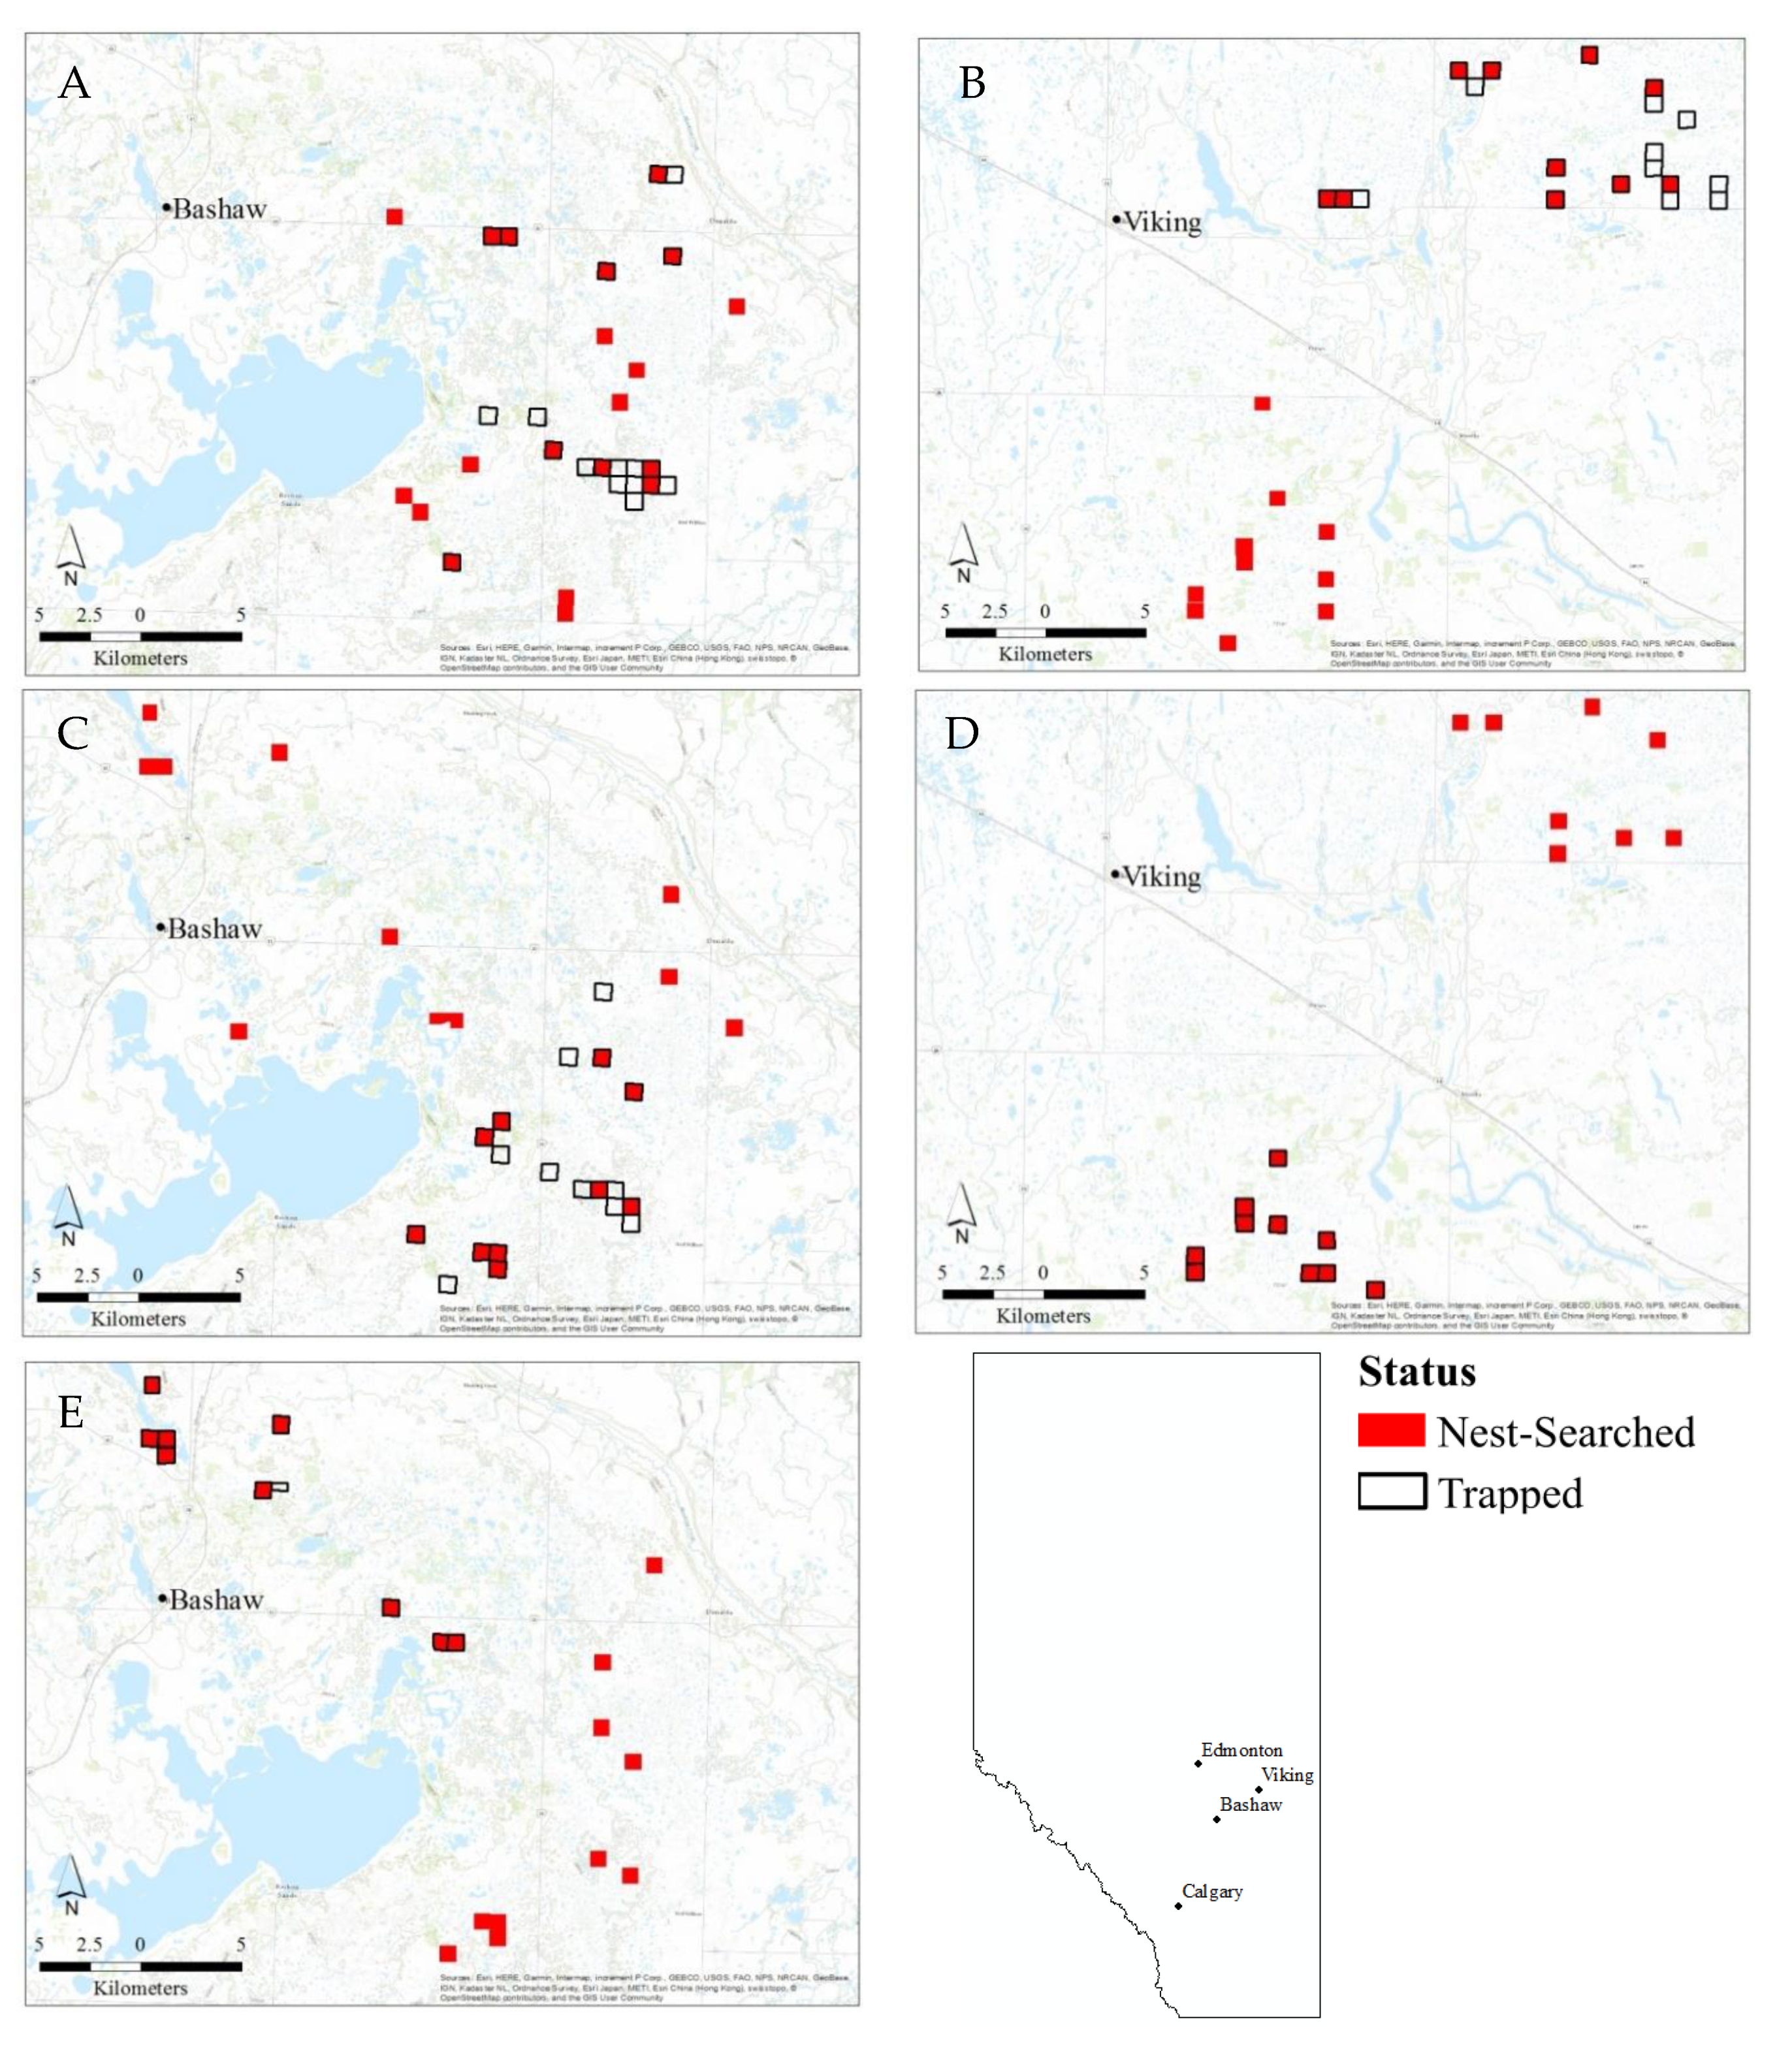
2.1. Study Area and Design
2.2. Field Methods
2.3. Nest-Survival Modelling
2.4. Nesting Hen Mortality
3. Results
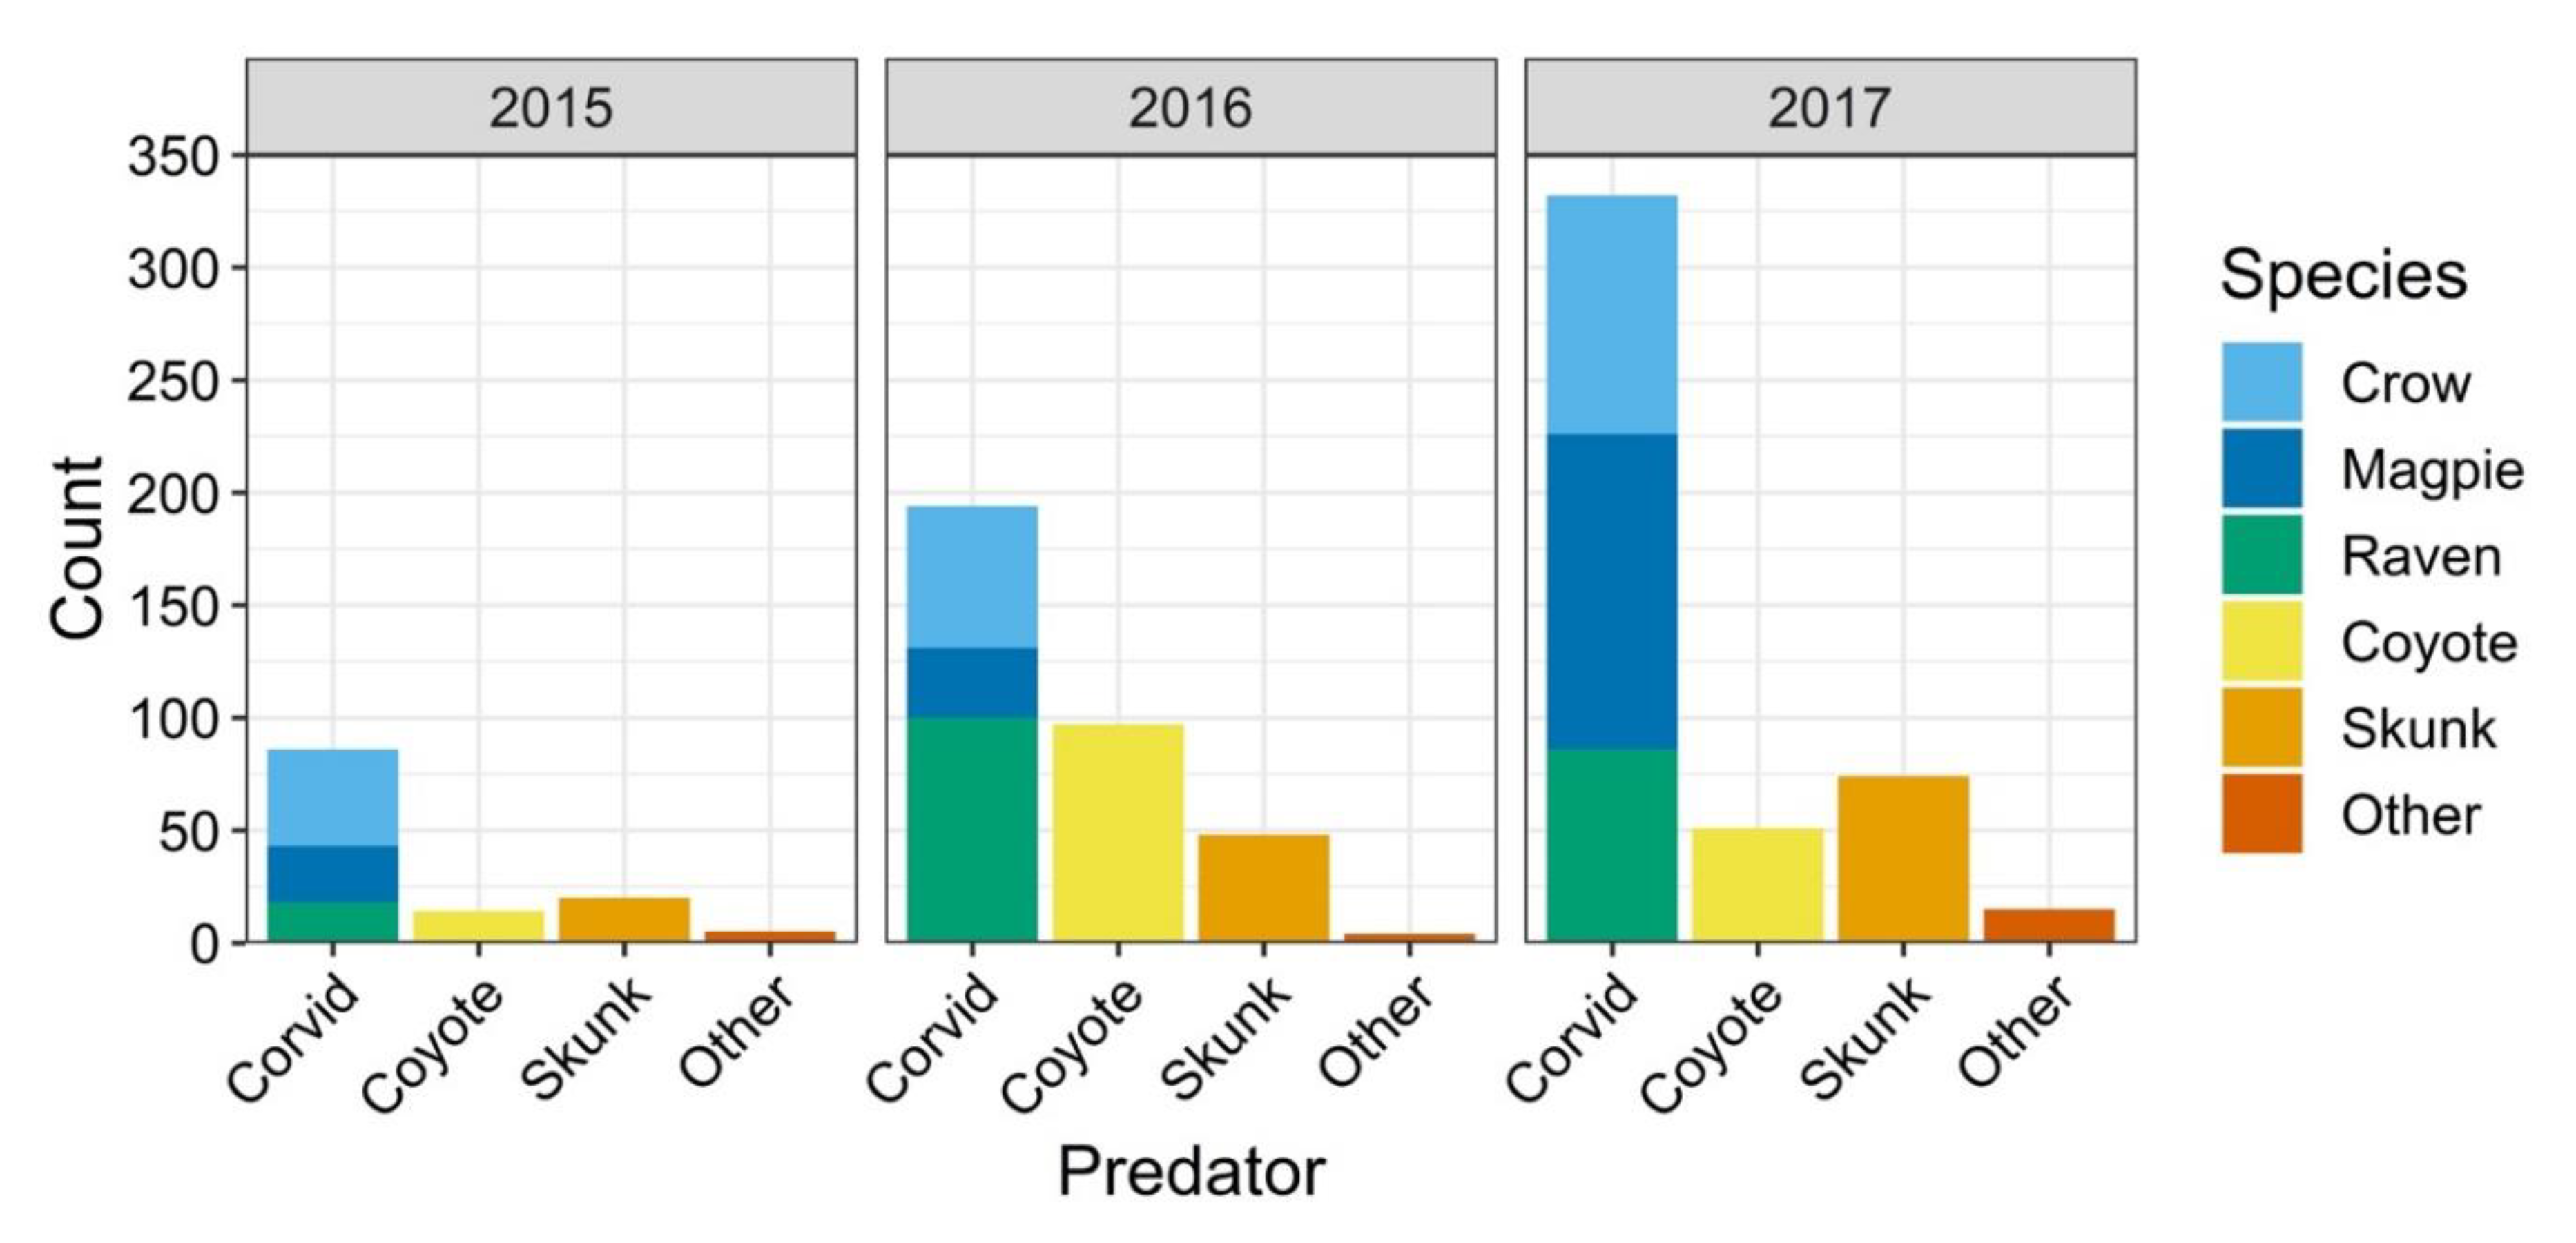
3.1. Nest Cameras
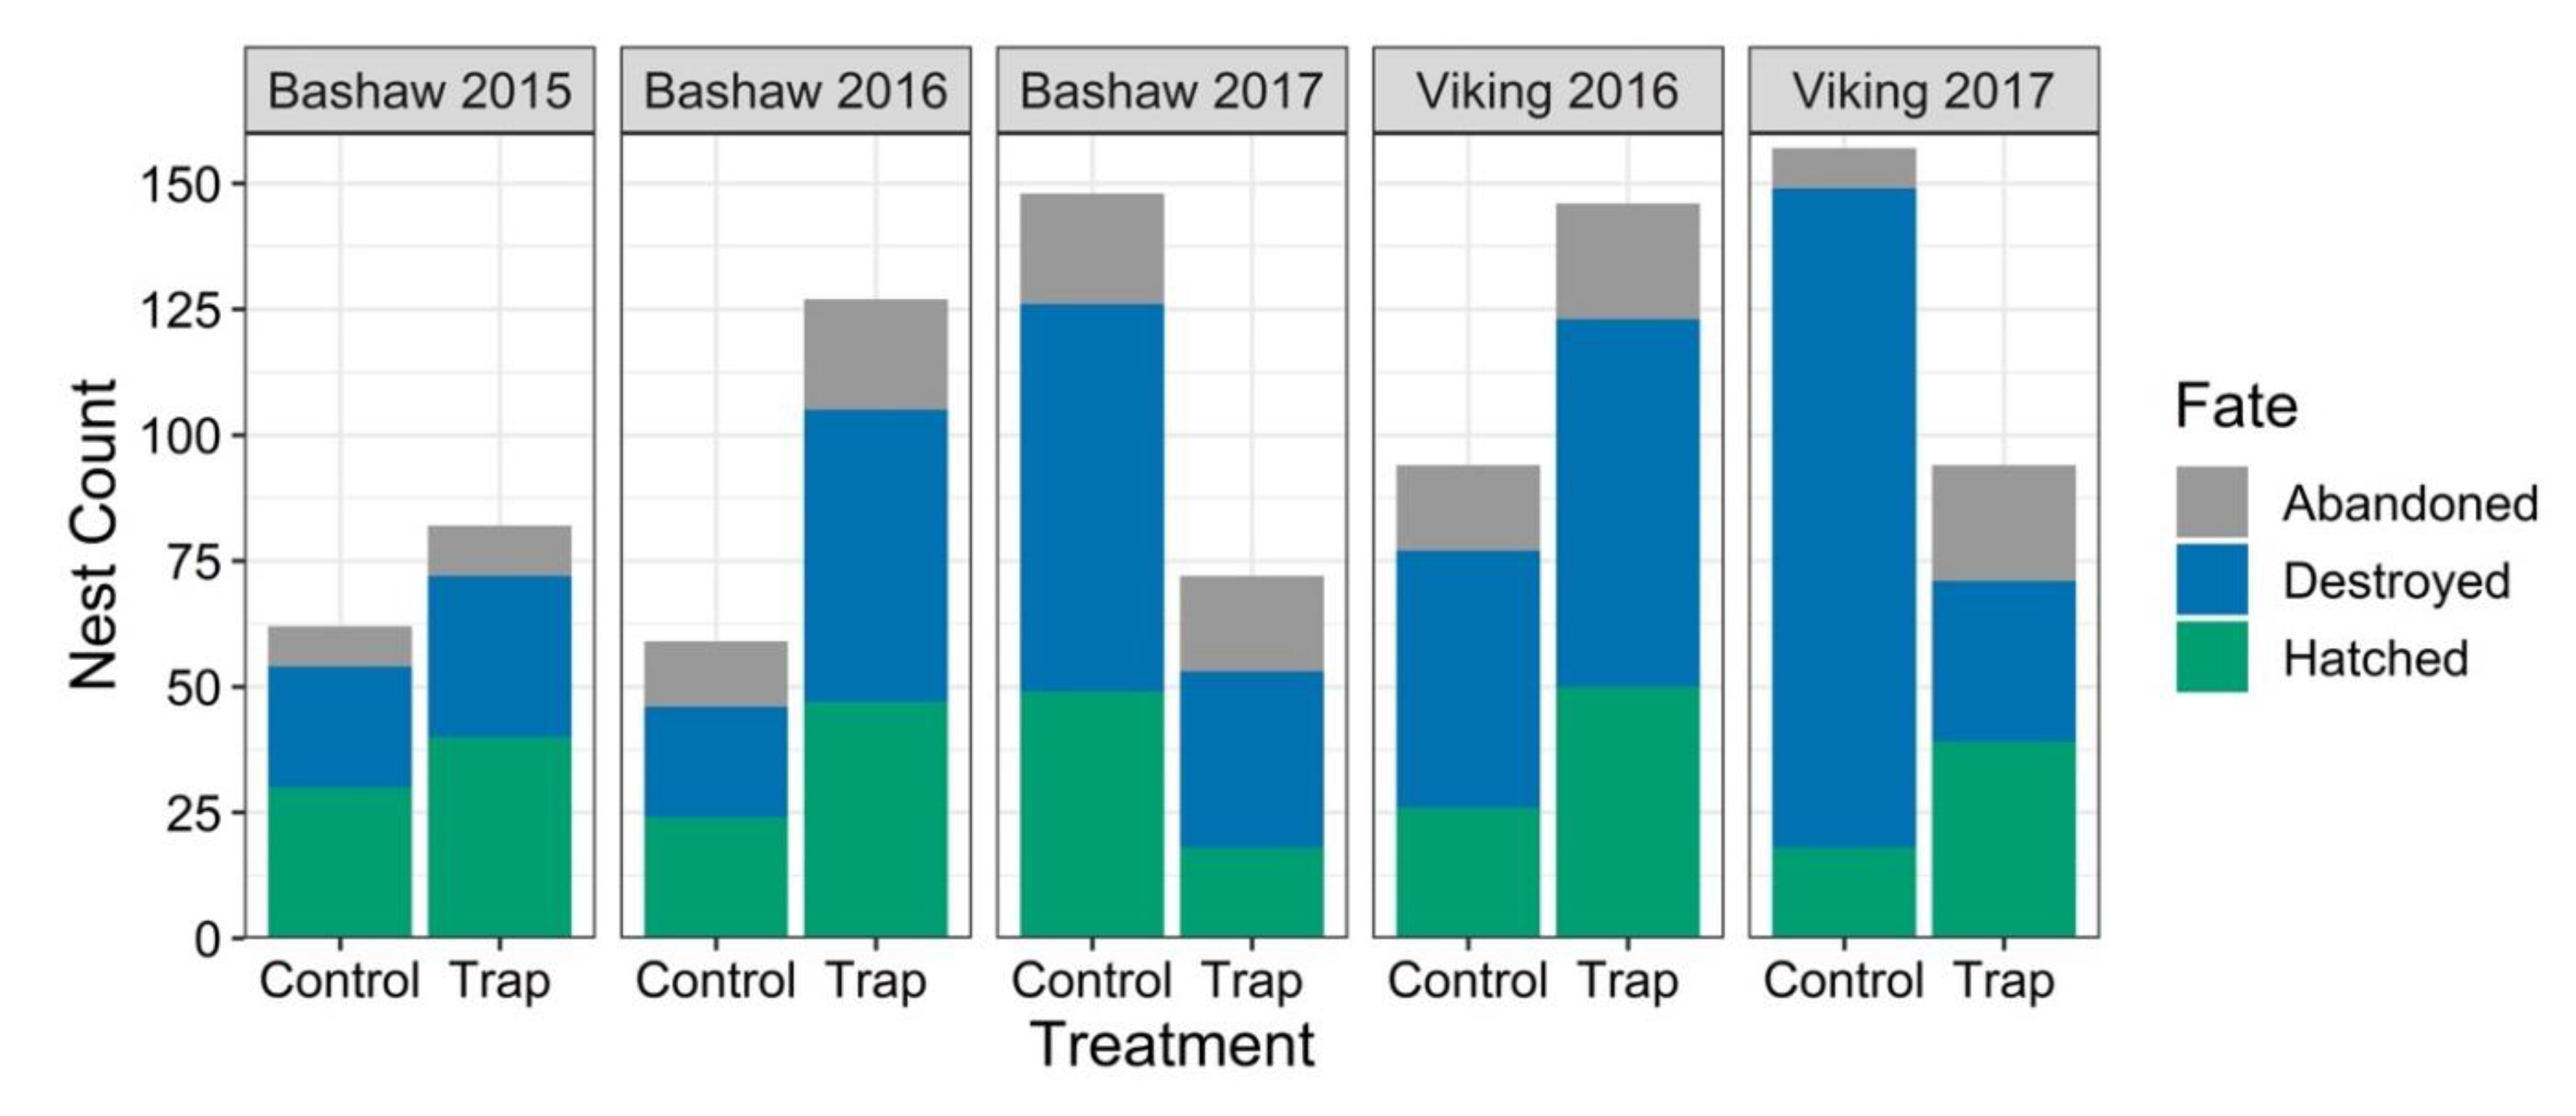
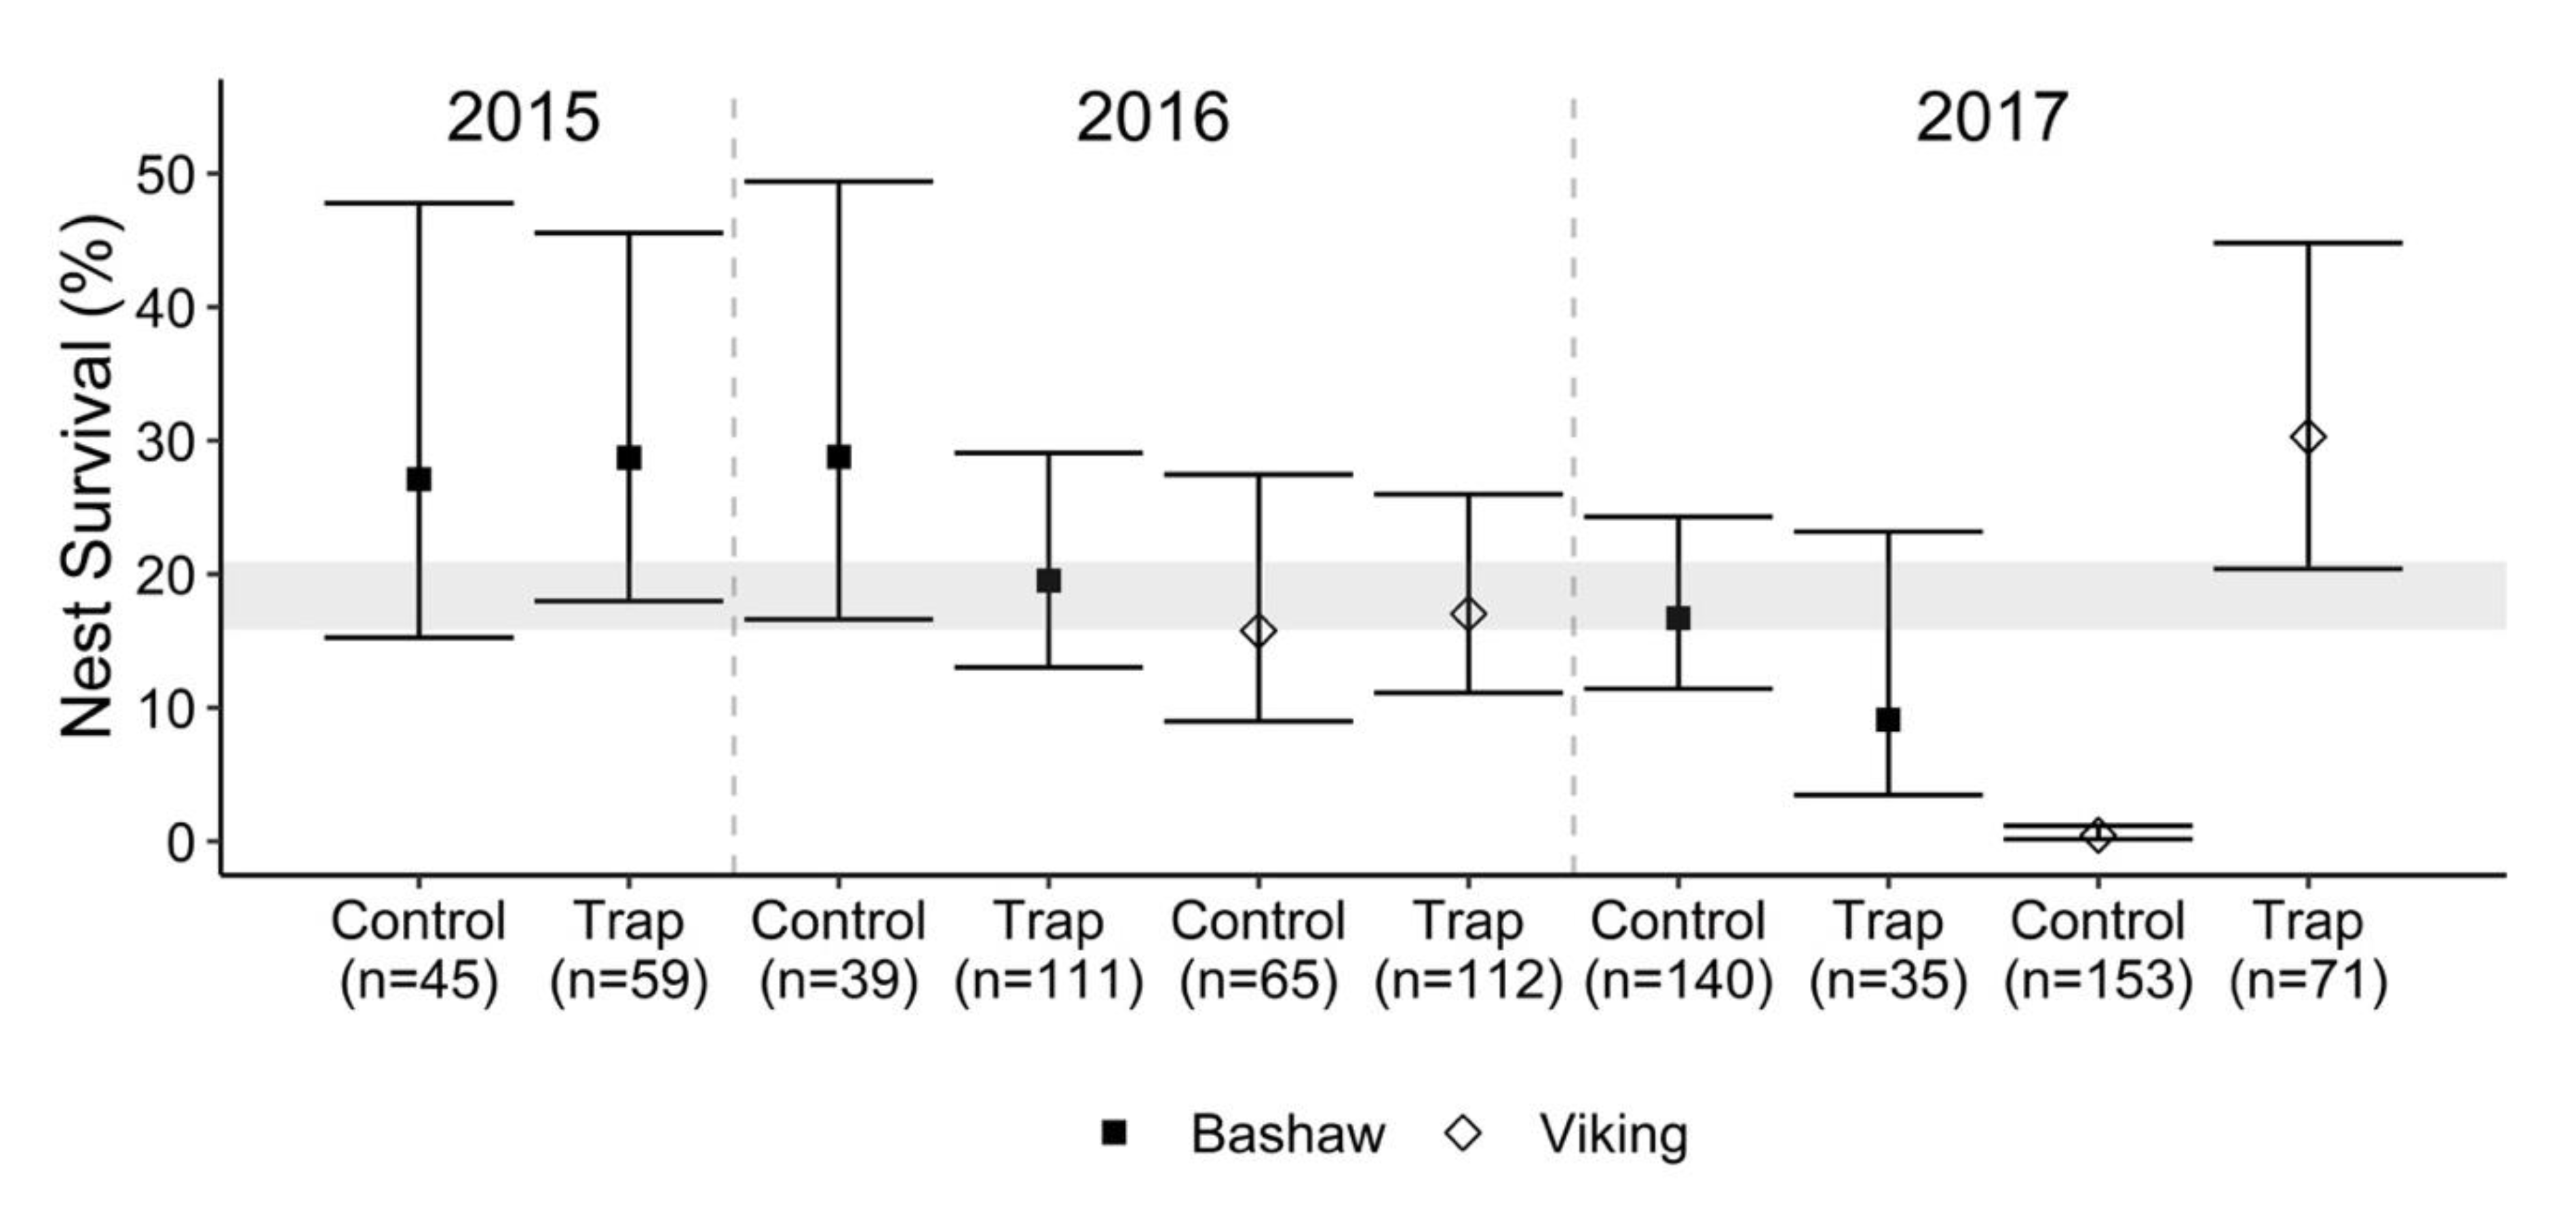
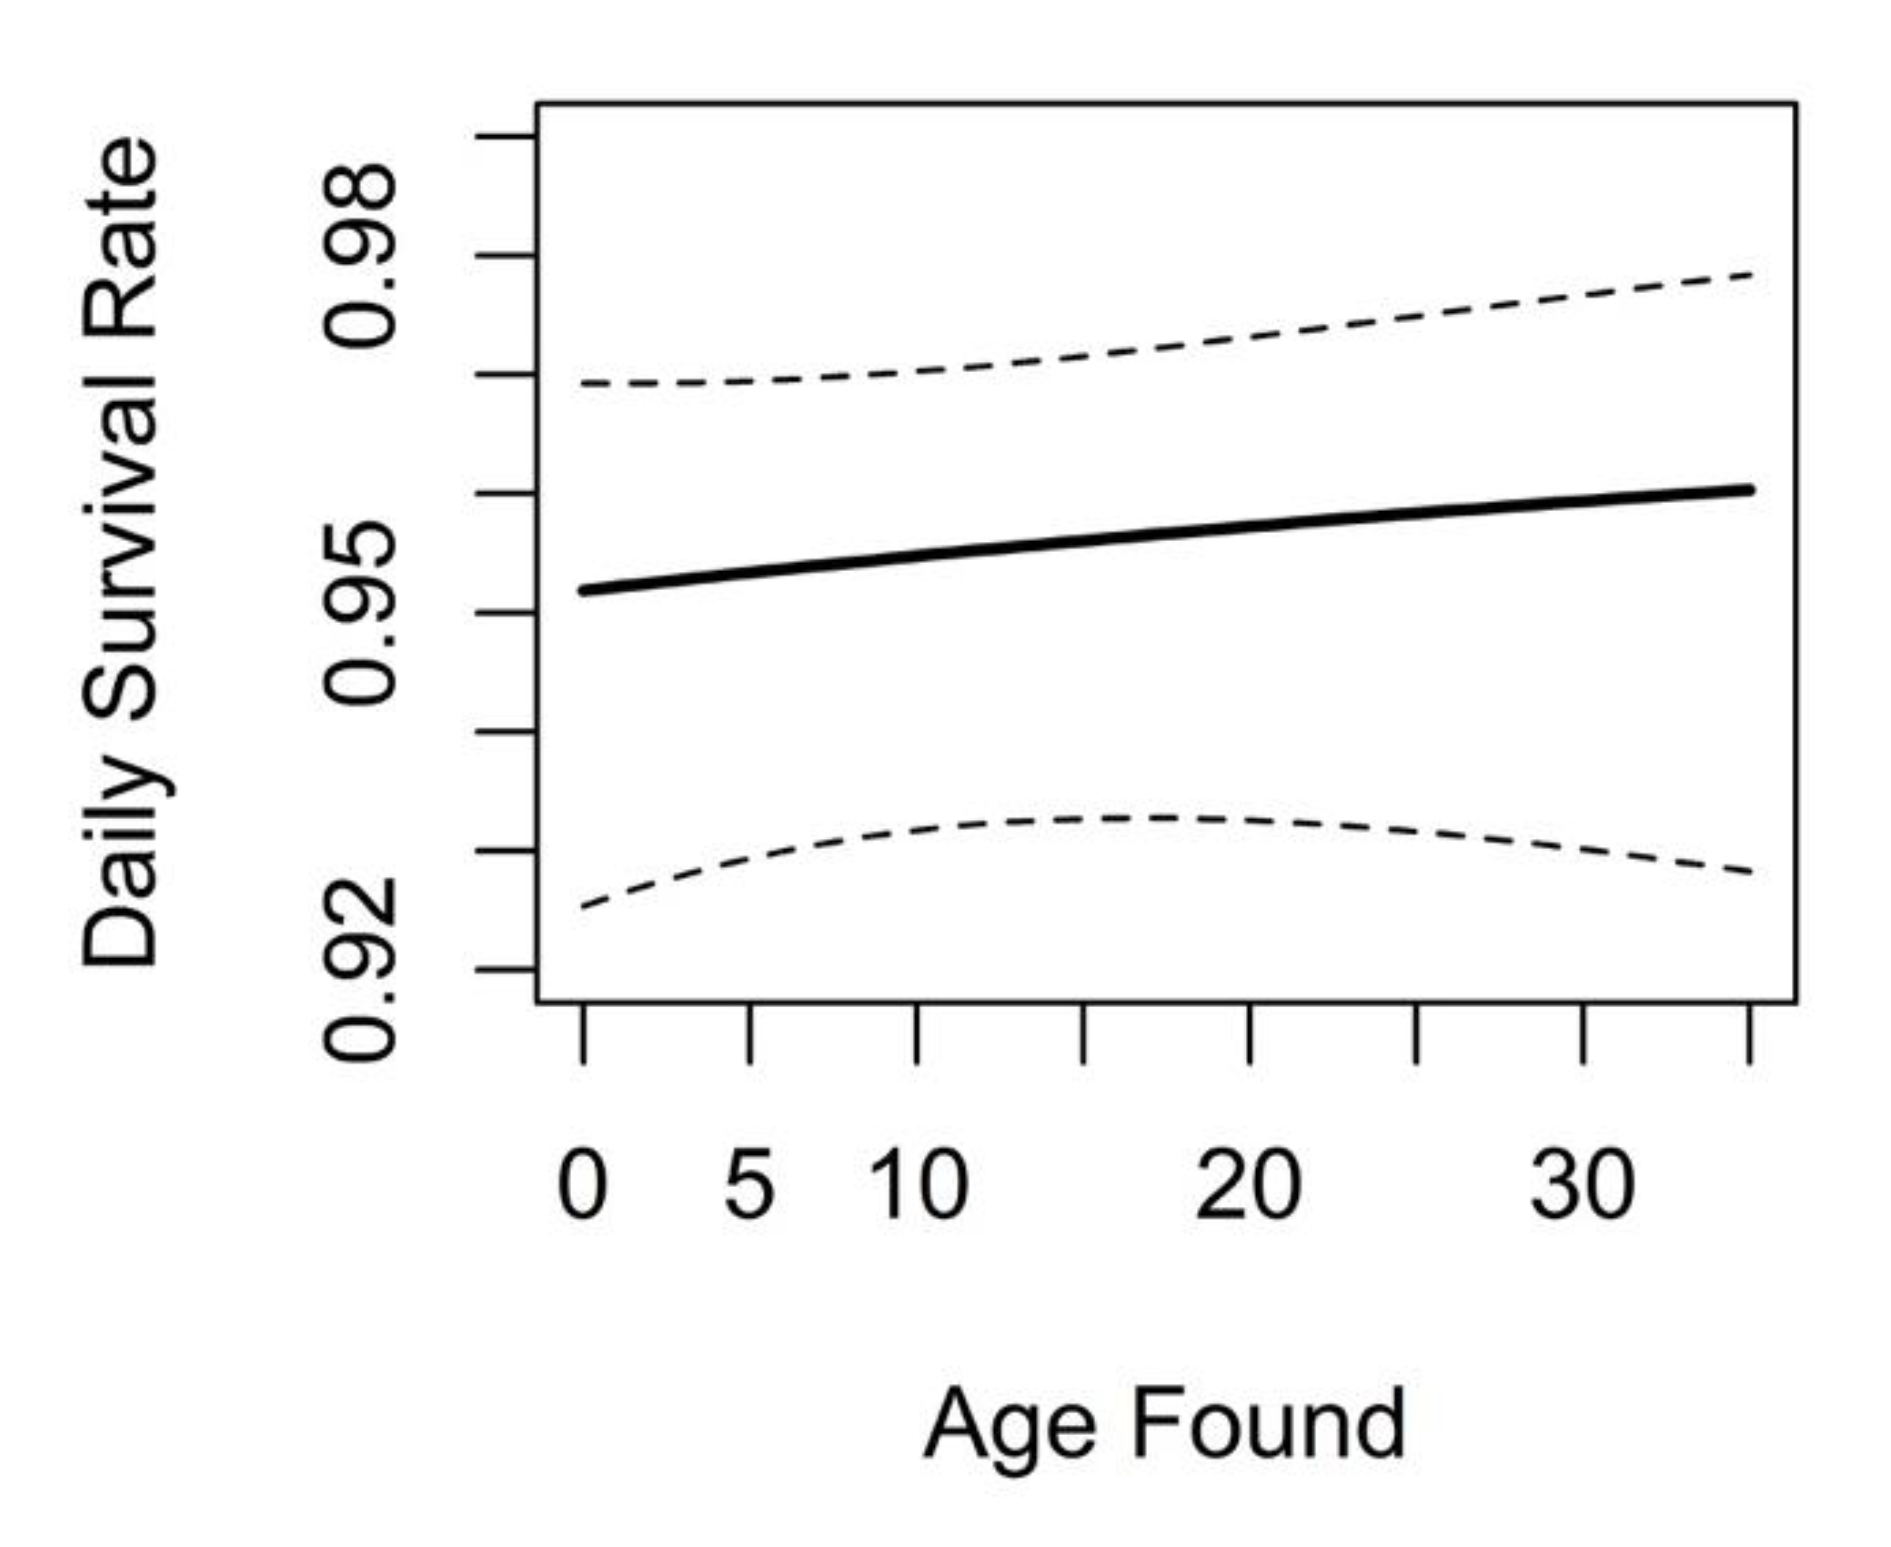
3.2. Nest Survival
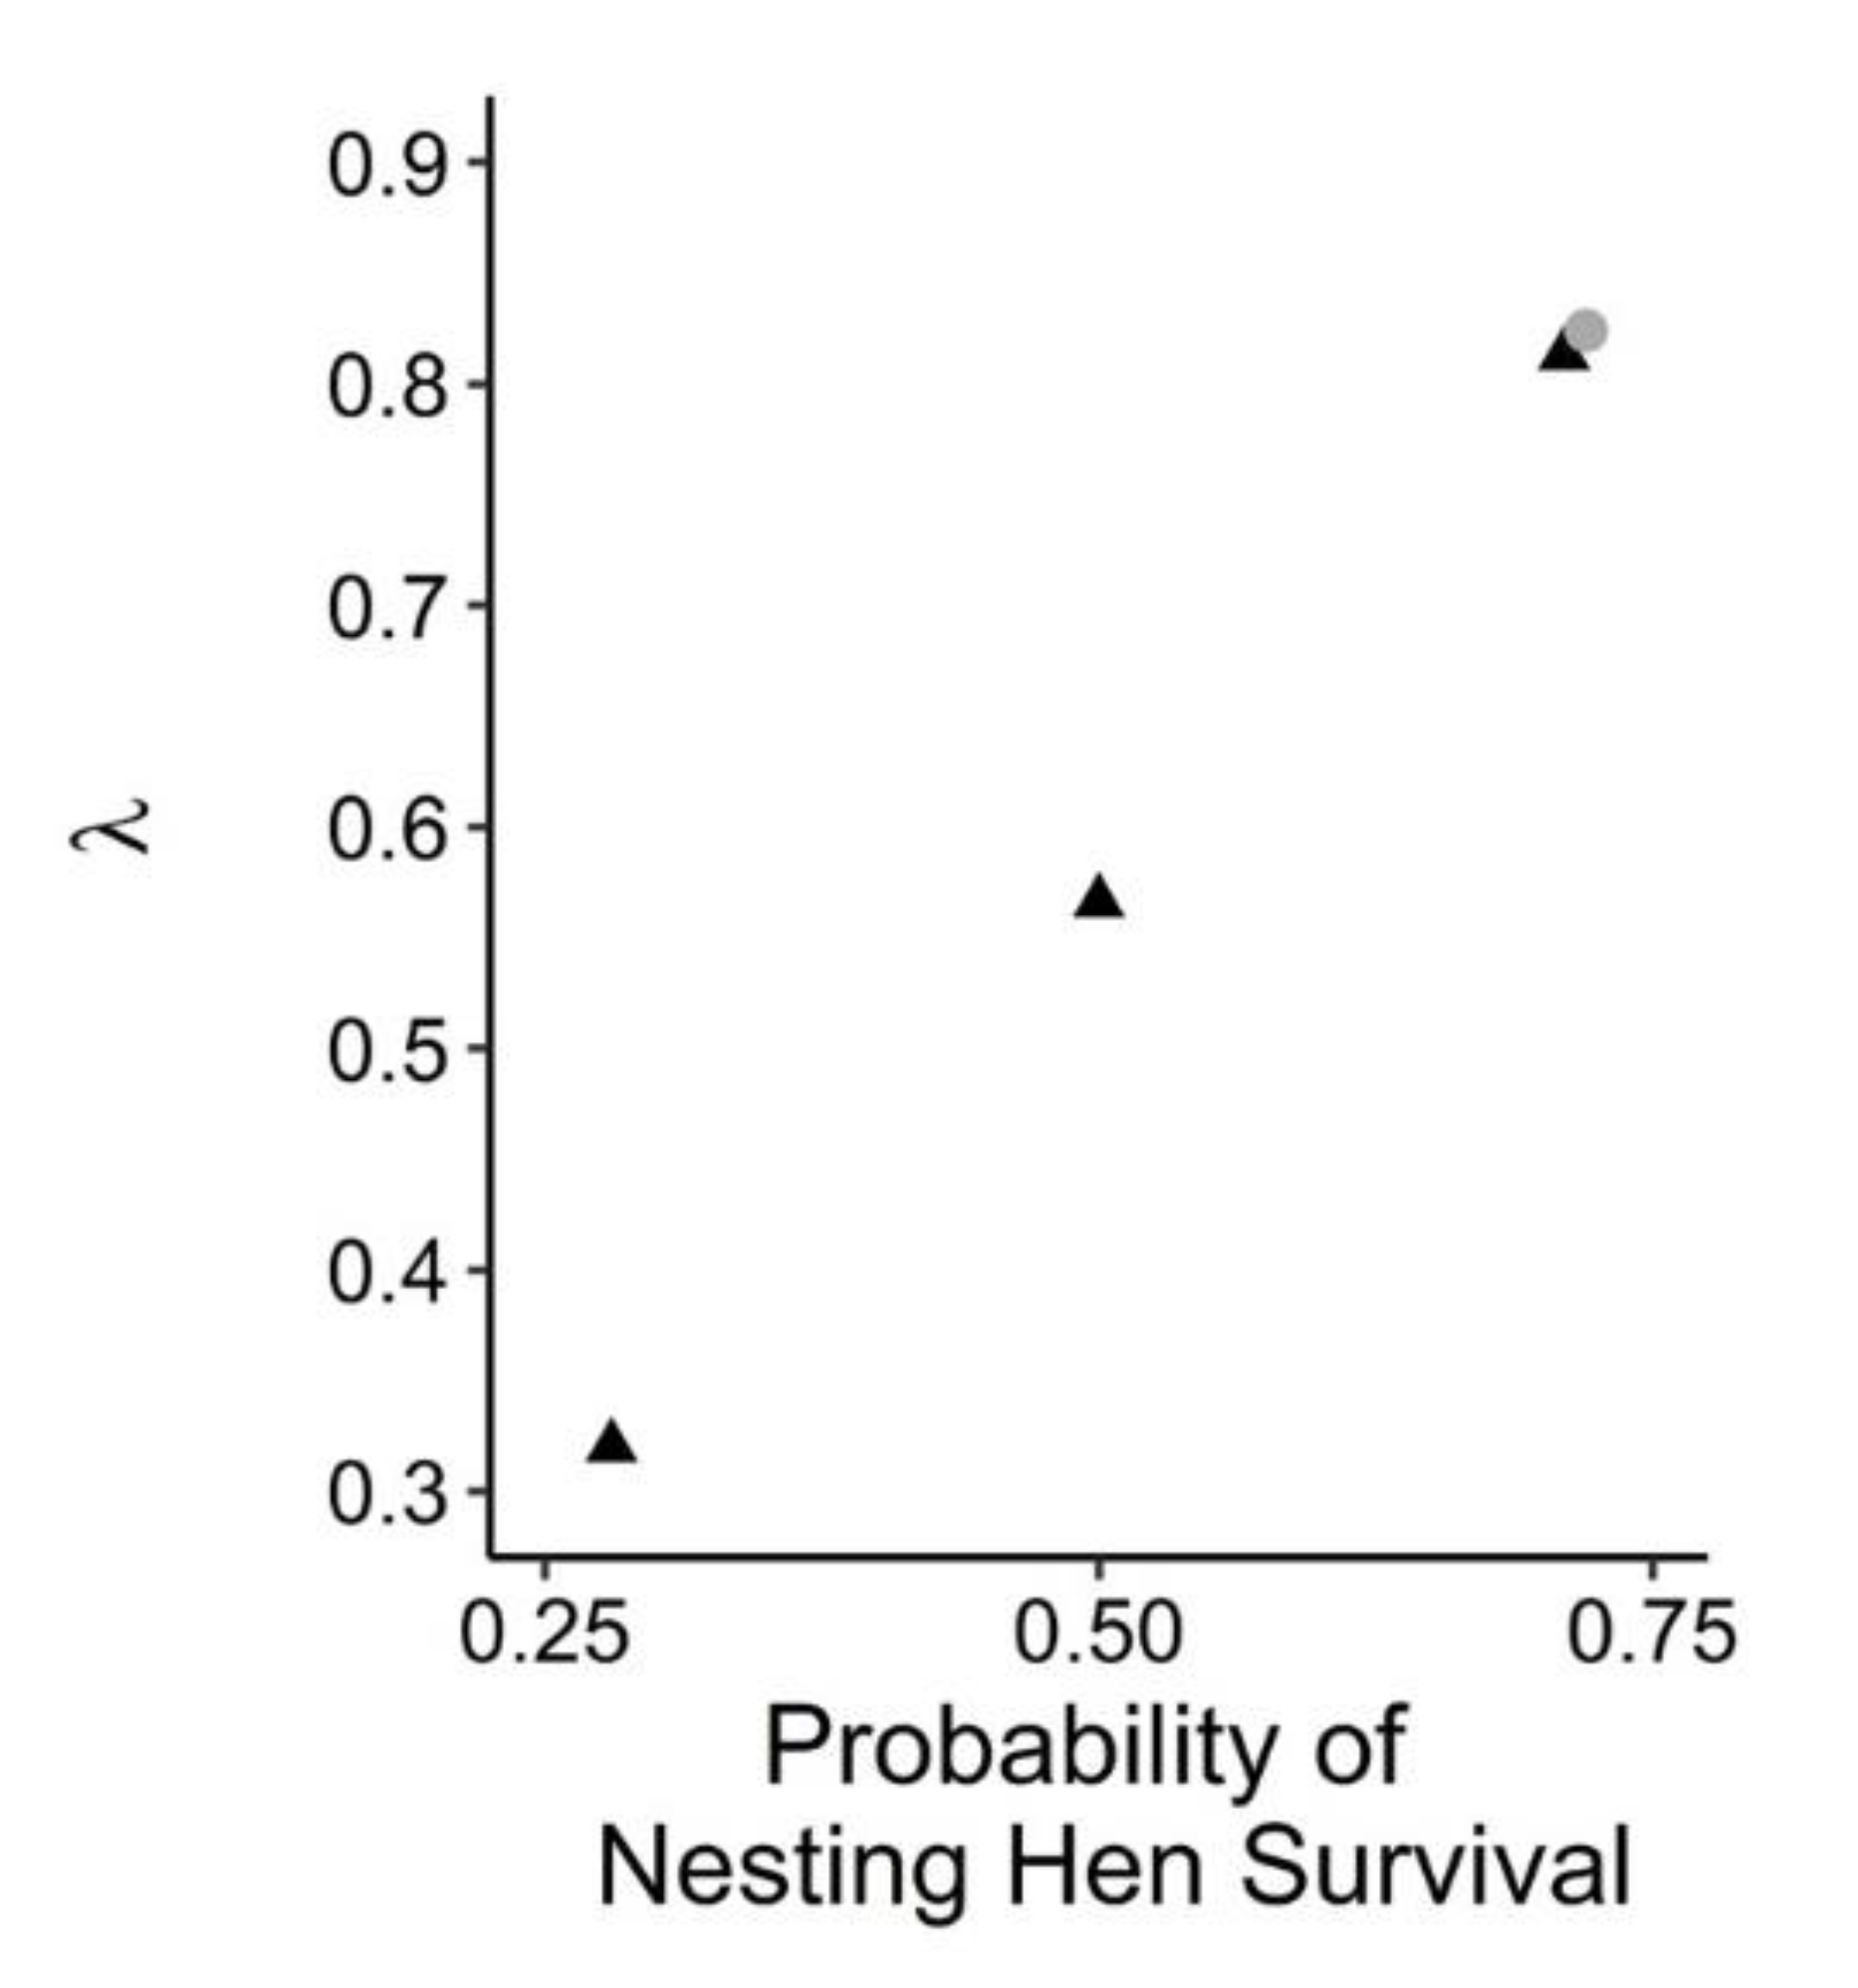
3.3. Nesting Hen Mortality
4. Discussion
5. Conclusions
Supplementary Materials
Author Contributions
Funding
Acknowledgments
Conflicts of Interest
References
- Hoekman, S.T.; Mills, S.; Howerter, D.W.; Devries, J.H.; Ball, I.J. Sensitivity Analyses of the Life Cycle of Midcontinent Mallards. J. Wildl. Manag. 2002, 66, 883–900. [Google Scholar] [CrossRef]
- Cowardin, L.M.; Gilmer, D.S.; Shaiffer, C.W. Mallard Recruitment in the Agricultural Environment of North Dakota. Wildl. Monogr. 1985, 92, 3–37. [Google Scholar]
- Greenwood, R.J.; Sargeant, A.B.; Johnson, D.H.; Cowardin, L.M.; Shaffer, T.L. Factors Associated with Duck Nest Success in the Prairie Pothole Region of Canada. Wildl. Monogr. 1995, 128, 1–57. [Google Scholar]
- Klett, A.T.; Shaffer, T.L.; Johnson, D.H. Duck Nest Success in the Prairie Pothole Region. J. Wildl. Manag. 1988, 52, 431–440. [Google Scholar] [CrossRef]
- Beauchamp, W.D.; Koford, R.R.; Nudds, T.D.; Clark, R.G.; Johnson, D.H. Long-Term Declines in Nest Success of Prairie Ducks. J. Wildl. Manag. 1996, 60, 247–257. [Google Scholar] [CrossRef]
- Sovada, M.A.; Anthony, R.M.; Batt, B.D.J. Predation on Waterfowl in Arctic Tundra and Prairie Breeding Areas: A Review. Wildl. Soc. Bull. 2001, 29, 6–15. [Google Scholar]
- Crimmins, S.M.; Walleser, L.R.; Hertel, D.R.; McKann, P.C.; Rohweder, J.J.; Thogmartin, W.E. Relating Mesocarnivore Relative Abundance to Anthropogenic Land-Use with a Hierarchical Spatial Count Model. Ecography 2016, 39, 524–532. [Google Scholar] [CrossRef]
- Sargeant, A.B.; Raveling, D.G. Mortality during the Breeding Season. In Ecology and Management of Breeding Waterfowl; Batt, B.D.J., Afton, A.D., Anderson, M.G., Ankney, C.D., Johnson, D.H., Kadlec, J.F., Krapu, G.L., Eds.; University of Minnesota Press: Minneapolis, MN, USA, 1992. [Google Scholar]
- Ricklefs, R.E. An Analysis of Nesting Mortality in Birds. Smithson. Contrib. Zool. 1969, 9, 1–48. [Google Scholar] [CrossRef]
- Ritchie, E.G.; Johnson, C.N. Predator Interactions, Mesopredator Release and Biodiversity Conservation. Ecol. Lett. 2009, 982–998. [Google Scholar] [CrossRef] [PubMed]
- Suraci, J.P.; Clinchy, M.; Dill, L.M.; Roberts, D.; Zanette, L.Y. Fear of Large Carnivores Causes a Trophic Cascade. Nat. Commun. 2016, 7, 10698. [Google Scholar] [CrossRef]
- Rodewald, A.D.; Kearns, L.J.; Shustack, D.P. Anthropogenic Resource Subsidies Decouple Predator-Prey Relationships. Ecol. Appl. 2011, 21, 936–943. [Google Scholar] [CrossRef] [PubMed]
- Borgo, J.S.; Conover, M.R. Influence of Shelterbelts on Success and Density of Waterfowl Nests within the Prairie Pothole Region of North America. Waterbirds 2016, 39, 74–80. [Google Scholar] [CrossRef]
- Clark, R.G.; Nudds, T.D. Habitat Patch Size and Duck Nesting Success: The Crucial Experiments Have Not Been Performed. Wildl. Soc. Bull. 1991, 19, 534–543. [Google Scholar]
- Pasitschniak-Arts, M.; Messier, F. Risk of Predation on Waterfowl Nests in the Canadian Prairies: Effects of Habitat Edges and Agricultural Practices. Oikos 1995, 73, 347–355. [Google Scholar] [CrossRef]
- Wirsing, A.J.; Phillips, J.R.; Obbard, M.E.; Murray, D.L. Incidental Nest Predation in Freshwater Turtles: Inter- and Intraspecific Differences in Vulnerability Are Explained by Relative Crypsis. Oecologia 2012, 168, 977–988. [Google Scholar] [CrossRef]
- Jiménez, J.M.; Conover, M.R.; Deuser, R.D.; Messmer, T.A. Influence of Habitat Patch Characteristics on the Success of Upland Duck Nests. Hum. Wildl. Confl. 2007, 1, 244–256. [Google Scholar]
- Ringelman, K.M. Predator Foraging Behavior and Patterns of Avian Nest Success: What Can We Learn from an Agent-Based Model? Ecol. Model. 2014, 272, 141–149. [Google Scholar] [CrossRef]
- Garrettson, P.R.; Rohwer, F.C. Effects of Mammalian Predator Removal on Production of Upland-Nesting Ducks in North Dakota. J. Wildl. Manag. 2001, 65, 398–405. [Google Scholar] [CrossRef]
- North American Waterfowl Management Plan: People Conserving Waterfowl and Wetlands; Canadian Wildlife Service, Ottawa and US Fish and Wildlife Service: Washington, DC, USA, 2012.
- Drever, M.C.; Wins-Purdy, A.; Nudds, T.D.; Clark, R.G. Decline of Duck Nest Success Revisited: Relationships with Predators and Wetlands in Dynamic Prairie Environments. Auk 2004, 121, 497–508. [Google Scholar] [CrossRef]
- Smith, R.K.; Pullin, A.S.; Stewart, G.B.; Sutherland, W.J. Effectiveness of Predator Removal for Enhancing Bird Populations. Conserv. Biol. 2010, 24, 820–829. [Google Scholar] [CrossRef]
- Lester, V.G. Nest Site Selection Patterns of Dabbling Ducks in Response to Variation in Predation Pressure: An Experimental Study. Master’s Thesis, University of Saskatchewan, Saskatoon, SK, Canada, 2004. [Google Scholar]
- Pieron, M.R.; Darr, M.J.K.; Rohwer, F.C. Duck Nest Success Adjacent to Predator-Reduced Sites. J. Wildl. Manag. 2012, 76, 1450–1455. [Google Scholar] [CrossRef]
- Pieron, M.R.; Rohwer, F.C. Effects of Large-Scale Predator Reduction on Nest Success of Upland Nesting Ducks. J. Wildl. Manag. 2010, 74, 124–132. [Google Scholar] [CrossRef]
- Amundson, C.L.; Pieron, M.R.; Arnold, T.W.; Beaudoin, L.A. The Effects of Predator Removal on Mallard Production and Population Change in Northeastern North Dakota. J. Wildl. Manag. 2013, 77, 143–152. [Google Scholar] [CrossRef]
- Chodachek, K.D.; Chamberlain, M.J. Effects of Predator Removal on Upland Nesting Ducks in North Dakota Grassland Fragments. Prairie Nat. 2006, 38, 25–37. [Google Scholar]
- Dassow, J.A. Upland-Nesting Ducks in the Parklands of Saskatchewan: The Effect of Predator Reduction on Nest Success and Reproductive Investment. Master’s Thesis, Southern Illinois University, Carbondale, IL, USA, 2010. [Google Scholar]
- Rosenthal, R. The “File Drawer Problem” and Tolerance for Null Results. Psychol. Bull. 1979, 86, 638–641. [Google Scholar] [CrossRef]
- Treves, A.; Krofel, M.; McManus, J. Predator Control Should Not Be a Shot in the Dark. Front. Ecol. Environ. 2016, 14, 380–388. [Google Scholar] [CrossRef]
- Boyce, M.S.; Sinclair, A.R.E.; White, G.C. Seasonal Compensation of Predation and Harvesting. Oikos 1999, 87, 419–426. [Google Scholar] [CrossRef]
- Ellis-Felege, S.N.; Conroy, M.J.; Palmer, W.E.; Carroll, J.P. Predator Reduction Results in Compensatory Shifts in Losses of Avian Ground Nests. J. Appl. Ecol. 2012, 49, 661–669. [Google Scholar] [CrossRef]
- Errington, P.L. Predation and Vertebrate Populations. Q. Rev. Biol. 1946, 21, 144–177, 221–245. [Google Scholar] [CrossRef]
- Porter, J.H.; Dueser, R.D.; Moncrief, N.D. Cost-Distance Analysis of Mesopredators as a Tool for Avian Habitat Restoration on a Naturally Fragmented Landscape. J. Wildl. Manag. 2015, 79, 220–234. [Google Scholar] [CrossRef]
- Sterling, B.; Conley, W.; Conley, M.R. Simulations of Demographic Compenstation in Coyote Populations. J. Wildl. Manag. 1983, 47, 1177–1181. [Google Scholar] [CrossRef]
- Minnie, L.; Gaylard, A.; Kerley, G.I.H.; Chapron, G. Compensatory Life-History Responses of a Mesopredator May Undermine Carnivore Management Efforts. J. Appl. Ecol. 2016, 53, 379–387. [Google Scholar] [CrossRef]
- Ruscoe, W.A.; Ramsey, D.S.; Pech, R.P.; Sweetapple, P.J.; Yockney, I.; Barron, M.C.; Perry, M.; Nugent, G.; Carran, R.; Warne, R.; et al. Unexpected Consequences of Control: Competitive vs. Predator Release in a Four-Species Assemblage of Invasive Mammals. Ecol. Lett. 2011, 14, 1035–1042. [Google Scholar] [CrossRef] [PubMed]
- Neuman, K.K.; Page, G.W.; Stenzel, L.E.; Warriner, J.C.; Warriner, J.S. Effect of Mammalian Predator Management on Snowy Plover Breeding Success. Waterbirds 2004, 27, 257–263. [Google Scholar] [CrossRef]
- Coluccy, J.M.; Yerkes, T.; Simpson, R.; Simpson, J.W.; Armstrong, L.M.; Davis, J. Population Dynamics of Breeding Mallards in the Great Lakes States. J. Wildl. Manag. 2008, 72, 1181–1187. [Google Scholar] [CrossRef]
- Pearse, A.T.; Lester, V.G. Correlation between Nest and Duckling Survival of Mallards Breeding in Saskatchewan. J. Wildl. Manag. 2007, 71, 1612–1616. [Google Scholar] [CrossRef]
- Darrah, A.J.; Cohen, J.B.; Castelli, P.M. A Bayesian Multinomial Logistic Exposure Model for Estimating Probabilities of Competing Sources of Nest Failure. Ibis 2018, 160, 23–35. [Google Scholar] [CrossRef]
- Holt, R.D. Predation, Apparent Competition, and the Structure of Prey Communities. Theor. Popul. Biol. 1977, 12, 197–229. [Google Scholar] [CrossRef]
- Holt, R.D.; Lawton, J.H. The Ecological Consequences of Shared Natural Enemies. Annu. Rev. Ecol. Syst. 1994, 25, 495–520. [Google Scholar] [CrossRef]
- DeCesare, N.J.; Hebblewhite, M.; Robinson, H.S.; Musiani, M. Endangered, Apparently: The Role of Apparent Competition in Endangered Species Conservation. Anim. Conserv. 2009, 13, 353–362. [Google Scholar] [CrossRef]
- McCarter, J. Trophic Control of Duck Abundance in a Prairie Pothole Food Web. Master’s Thesis, University of Guelph, Guelph, ON, Canada, 2009. [Google Scholar]
- Arnold, T.W.; Craig-Moore, L.M.; Armstrong, L.M.; Howerter, D.W.; Devries, J.H.; Joynt, B.L.; Emery, R.B.; Anderson, M.G. Waterfowl Use of Dense Nesting Cover in the Canadian Parklands. J. Wildl. Manag. 2007, 71, 2542–2549. [Google Scholar] [CrossRef]
- Howerter, D.W.; Anderson, M.G.; Devries, J.H.; Joynt, B.L.; Armstrong, L.M.; Emery, R.B.; Arnold, T.W. Variation in Mallard Vital Rates in Canadian Aspen Parklands: The Prairie Habitat Joint Venture Assessment. Wildl. Monogr. 2014, 188, 1–37. [Google Scholar] [CrossRef]
- Drever, M.C.; Nudds, T.D.; Clark, R.G. Agricultural Policy and Nest Success of Prairie Ducks in Canada and the United States. Avian Conserv. Ecol. 2007, 2. [Google Scholar] [CrossRef]
- Scarth, J.; Brice, J. Hen House and Predator Reduction Research in Parkland Habitats of Alberta: Nest Success and Long-Term Population Responses of Dabbling Ducks; Delta Waterfowl Foundation: Winnipeg, MB, Canada, 2014. [Google Scholar]
- Roy, L.D.; Dorrance, M.J. Coyote Movements, Habitat Use, and Vulnerability in Central Alberta. J. Wildl. Manag. 1985, 49, 307–313. [Google Scholar] [CrossRef]
- Larivière, S.; Messier, F. Effect of Density and Nearest Neighbours on Simulated Waterfowl Nests: Can Predators Recognize High-Density Nesting Patches? Oikos 1998, 83, 12–20. [Google Scholar] [CrossRef]
- Russell, A.P.; Bauer, A.M.; Lynch, W.; McKinnon, I. The Amphibians and Reptiles of Alberta: A Field Guide and Primer of Boreal Herpetology, 2nd ed.; University of Calgary Press: Calgary, AB, Canada, 2000. [Google Scholar]
- Bourne, J. Rat Control in Alberta; Alberta Agriculture and Forestry: Red Deer, AB, Canada, 2015. [Google Scholar]
- Alberta Environment and Parks. Alberta Wild Species General Status Listing; Government of Alberta: Edson, AB, Canada, 2015.
- Sargeant, A.B.; Sovada, M.A.; Greenwood, R.J. Interpreting Evidence of Depredation of Duck Nests in the Prairie Pothole Region; U.S. Geological Survey, Northern Prairie Wildlife Research Centre & Ducks Unlimited, Inc.: Jamestown, ND, USA, 1998; p. 72. [Google Scholar]
- Klett, A.T.; Duebbert, H.F.; Faanes, C.A.; Higgins, K.F. Techniques for Studying Nest Success of Ducks in Upland Habitats in the Prairie Pothole Region; United States Department of the Interior Fish and Wildlife Service: Washington, DC, USA, 1986. [Google Scholar]
- Blythe, E.M.; Boyce, M.S. Conventional Marking of Duck Nests May Increase Predation by Corvids. Unpublished.
- Picozzi, N. Crow Predation on Marked Nests. J. Wildl. Manag. 1975, 39, 151–155. [Google Scholar] [CrossRef]
- Buler, J.J.; Hamilton, R.B. Predation of Natural and Artificial Nests in a Southern Pine Forest. Auk 2000, 117, 739–747. [Google Scholar] [CrossRef]
- Weller, M.W. A Simple Field Candler for Waterfowl Eggs. J. Wildl. Manag. 1956, 20, 111–113. [Google Scholar] [CrossRef]
- Robel, R.J.; Briggs, J.N.; Dayton, A.D.; Hulbert, L.C. Relationships between Visual Obstruction Measurements and Weight of Grassland Vegetation. J. Range Manag. 1970, 23, 295–297. [Google Scholar] [CrossRef]
- Garrettson, P.R.; Richkus, K.D.; Rohwer, F.C.; Johnson, W.P. Factors Influencing Investigator-Caused Nest Abandonment by North American Dabbling Ducks. Can. J. Zool. 2011, 89, 69–78. [Google Scholar] [CrossRef]
- Richardson, T.W.; Gardali, T.; Jenkins, S.H. Review and Meta-Analysis of Camera Effects on Avian Nest Success. J. Wildl. Manag. 2009, 73, 287–293. [Google Scholar] [CrossRef]
- Renfrew, R.B.; Ribic, C.A. Grassland Passerine Nest Predators near Pasture Edges Identified on Videotape. Auk 2003, 120, 371–383. [Google Scholar] [CrossRef]
- Laake, J.L. Rmark: An R Interface for Analysis of Capture-Recapture Data with Mark; Alaska Fisheries Science Center, National Oceanic and Atmospheric Administration, National Marine Fisheries Service: Washington, DC, USA, 2013. [Google Scholar]
- White, G.C.; Burnham, K.P. Program Mark: Survival Estimation from Populations of Marked Animals. Bird Study 1999, 46, S120–S139. [Google Scholar] [CrossRef]
- Dinsmore, S.J.; White, G.C.; Knopf, F.L. Advanced Techniques for Modeling Avian Nest Survival. Ecology 2002, 83, 3476–3488. [Google Scholar] [CrossRef]
- Rotella, J.J.; Dinsmore, S.J.; Shaffer, T.L. Modeling Nest–Survival Data: A Comparison of Recently Developed Methods That Can Be Implemented in Mark and Sas. Anim. Biodivers. Conserv. 2004, 27.1, 187–205. [Google Scholar]
- McCullagh, P.; Nelder, J.A. Generalized Linear Models, 2nd ed.; Chapman and Hall: London, UK, 1989. [Google Scholar]
- R Core Development Team. R: A Language and Environment for Statistical Computing; R Foundation for Statistical Computing: Vienna, Austria, 2016. [Google Scholar]
- Dormann, C.F.; McPherson, J.M.; Araújo, M.B.; Bivand, R.; Bolliger, J.; Carl, G.; Davies, R.G.; Hirzel, A.; Jetz, W.; Kissling, W.D.; et al. Methods to Account for Spatial Autocorrelation in the Analysis of Species Distributional Data: A Review. Ecography 2007, 30, 609–628. [Google Scholar] [CrossRef]
- Burnham, K.P.; Anderson, D.R. Model Selection and Multimodel Inference: A Practical Information-Theoretic Approach, 2nd ed.; Springer: Berlin/Heidelberg, Germany, 2002. [Google Scholar]
- Zar, J.H. Biostatistical Analysis, 5th ed.; Pearson: Upper Saddle River, NJ, USA, 2010. [Google Scholar]
- Breslow, N.E.; Day, N.E. Statistical Methods in Cancer Research. Volume 1-the Analysis of Case-Control Studies; International Agency for Research on Cancer (IARC Scientific Publications: No. 32): Lyon, France, 1980. [Google Scholar]
- Yates, F. Contingency Tables Involving Small Numbers and the Χ2 Test. Suppl. J. R. Stat. Soc. 1934, 1, 217–235. [Google Scholar] [CrossRef]
- Agresti, A. Categorical Data Analysis, 2nd ed.; Wiley-Interscience: New York, NY, USA, 2002. [Google Scholar]
- Stubben, C.; Milligan, B. Estimating and Analyzing Demographic Models Using the Popbio Package in R. J. Stat. Softw. 2007, 22, 2–23. [Google Scholar] [CrossRef]
- Clark, R.G.; Meger, D.E.; Ignatiuk, J.B. Removing American Crows and Duck Nesting Success. Can. J. Zool. 1995, 73, 518–522. [Google Scholar] [CrossRef]
- Guyn, K.L. Sources of Variation in Waterfowl Nest Predation. Master’s Thesis, University of Saskatchewan, Saskatoon, SK, Canada, 1994. [Google Scholar]
- Sargeant, A.B.; Greenwood, R.J.; Sovada, M.A.; Shaffer, T.L. Distribution and Abundance of Predators that Affect Duck Production-Prairie Pothole Region; U.S. Fish and Wildlife Service Resource Publication 194: Washington, DC, USA, 1993. [Google Scholar]
- Blythe, E.M. Trappings of Success: Predator Removal & Habitat Associations with Dabbling Duck Nest Survival in Alberta Parklands. Master’s Thesis, University of Alberta, Edmonton, AB, Canada, 2019. [Google Scholar]
- Blythe, E.M.; Boyce, M.S. Duck Nest Predation Risk in Alberta Parklands. Unpublished work.
- Crooks, K.R.; Soulé, M.E. Mesopredator Release and Avifaunal Extinctions in a Fragmented System. Nature 1999, 400, 563–566. [Google Scholar] [CrossRef]
- Prugh, L.R.; Stoner, C.J.; Epps, C.W.; Bean, W.T.; Ripple, W.J.; Laliberte, A.S.; Brashares, J.S. The Rise of the Mesopredator. Bioscience 2009, 59, 779–791. [Google Scholar] [CrossRef]
- Sovada, M.A.; Sargeant, A.B.; Grier, J.W. Differential Effects of Coyotes and Red Foxes on Duck Nest Success. J. Wildl. Manag. 1995, 59, 1–9. [Google Scholar] [CrossRef]
- Mezquida, E.T.; Slater, S.J.; Benkman, C.W. Sage-Grouse and Indirect Interactions: Potential Implications of Coyote Control on Sage-Grouse Populations. Condor 2006, 108. [Google Scholar] [CrossRef]
- Lima, S.L.; Dill, L.M. Behavioral Decisions Made under the Risk of Predation: A Review and Prospectus. Can. J. Zool. 1990, 68, 619–640. [Google Scholar] [CrossRef]
- Manton, M.; Angelstam, P.; Naumov, V. Effects of Land Use Intensification on Avian Predator Assemblages: A Comparison of Landscapes with Different Histories in Northern Europe. Diversity 2019, 11, 70. [Google Scholar] [CrossRef]
- Sargeant, A.B.; Sovada, M.A.; Shaffer, T.L. Seasonal Predator Removal Relative to Hatch Rate of Duck Nests in Waterfowl Production Areas. Wildl. Soc. Bull. 1995, 23, 507–513. [Google Scholar]
- Novaro, A.J.; Funes, M.C.; Walker, R.S. An Empirical Test of Source-Sink Dynamics Induced by Hunting. J. Appl. Ecol. 2005, 42, 910–920. [Google Scholar] [CrossRef]
- Lieury, N.; Ruette, S.; Devillard, S.; Albaret, M.; Drouyer, F.; Baudoux, B.; Millon, A. Compensatory Immigration Challenges Predator Control: An Experimental Evidence-Based Approach Improves Management. J. Wildl. Manag. 2015, 79, 425–434. [Google Scholar] [CrossRef]
- Klett, A.T.; Johnson, C.J. Variability in Nest Survival Rates and Implications to Nesting Studies. Auk 1982, 99, 77–87. [Google Scholar] [CrossRef]
- Gosselink, T.E.; Van Deelen, T.R.; Warner, R.E.; Joselyn, M.G. Temporal Habitat Partitioning and Spatial Use of Coyotes and Red Foxes in East-Central Illinois. J. Wildl. Manag. 2003, 67, 90–103. [Google Scholar] [CrossRef]
- Nelson, J.L.; Cypher, B.L.; Bjurlin, C.D.; Creel, S. Effects of Habitat on Competition between Kit Foxes and Coyotes. J. Wildl. Manag. 2007, 71, 1467–1475. [Google Scholar] [CrossRef]
- Azevedo, F.C.C.; Lester, V.; Gorsuch, W.; Larivière, S.; Wirsing, A.J.; Murray, D.L. Dietary Breadth and Overlap among Five Sympatric Prairie Carnivores. J. Zool. 2006, 269, 127–135. [Google Scholar] [CrossRef]
- Henke, S.E.; Bryant, F.C. Effects of Coyote Removal on the Faunal Community in Western Texas. J. Wildl. Manag. 1999, 63, 1066–1081. [Google Scholar] [CrossRef]
- Richkus, K.D.; Rohwer, F.C.; Chamberlain, M.J. Survival and Cause-Specific Mortality of Female Northern Pintails in Southern Saskatchewan. J. Wildl. Manag. 2005, 69, 574–581. [Google Scholar] [CrossRef]
- Sargeant, A.B.; Eberhardt, R.T.; Allen, S.H. Red Fox Predation on Breeding Ducks in Midcontinent North America. Wildl. Monogr. 1984, 48, 1–41. [Google Scholar]
- Simms, D.A. North American Weasels: Resource Utilization and Distribution. Can. J. Zool. 1979, 57, 504–520. [Google Scholar] [CrossRef]
- Thomas, P.J.; Mineau, P.; Shore, R.F.; Champoux, L.; Martin, P.A.; Wilson, L.K.; Fitzgerald, G.; Elliott, J.E. Second Generation Anticoagulant Rodenticides in Predatory Birds: Probabilistic Characterisation of Toxic Liver Concentrations and Implications for Predatory Bird Populations in Canada. Environ. Int. 2011, 37, 914–920. [Google Scholar] [CrossRef] [PubMed]
- Ruette, S.; Stahl, P.; Albaret, M. Factors Affecting Trapping Success of Red Fox Vulpes Vulpes, Stone Marten Martes Foina and Pine Marten M. Martes in France. Wildl. Biol. 2003, 9, 11–19. [Google Scholar] [CrossRef]
- DeVink, J.; Berezanski, D.; Imrie, D. Comments on Brodie and Post: Harvest Effort: The Missing Covariate in Analyses of Furbearer Harvest Data. Popul. Ecol. 2011, 53, 261–262. [Google Scholar] [CrossRef]
- McKelvey, K.S.; Lofroth, E.C.; Copeland, J.P.; Aubry, K.B.; Magoun, A.J. Comments on Brodie and Post: Climate-Driven Declines in Wolverine Populations: Causal Connection or Spurious Correlation? Popul. Ecol. 2011, 53, 263–266. [Google Scholar] [CrossRef]
- Hernandez, F.; Rollins, D.; Cantu, R. An Evaluation of Trailmaster® Camera Systems for Identifying Ground-Nest Predators. Wildl. Soc. Bull. 1997, 25, 848–853. [Google Scholar]
- Larivière, S. Reasons Why Predators Cannot Be Inferred from Nest Remains. Condor 1999, 101, 718–721. [Google Scholar]
- Larivière, S.; Messier, F. Characteristics of Waterfowl Nest Depredation by the Striped Skunk (Mephitis Mephitis): Can Predators Be Identified from Nest Remains? Am. Midl. Nat. 1997, 137, 393–396. [Google Scholar] [CrossRef]
- Pieron, M.R.; Rohwer, F.C.; Chamberlain, M.J.; Kaller, M.D.; Lancaster, J. Response of Breeding Duck Pairs to Predator Reduction in North Dakota. J. Wildl. Manag. 2013, 77, 663–671. [Google Scholar] [CrossRef]
- Pearse, A.T.; Ratti, J.T. Effects of Predator Removal on Mallard Duckling Survival. J. Wildl. Manag. 2004, 68, 342–350. [Google Scholar] [CrossRef]
- Amundson, C.L.; Arnold, T.W. The Role of Predator Removal, Density-Dependence, and Environmental Factors on Mallard Duckling Survival in North Dakota. J. Wildl. Manag. 2011, 75, 1330–1339. [Google Scholar] [CrossRef]


| Species | Destroyed | Hatched | Abandoned | Total | |
|---|---|---|---|---|---|
| Predator | Unknown | ||||
| American green-winged teal | 1 | 4 | 0 | 0 | 5 |
| American widgeon | 8 | 4 | 1 | 2 | 15 |
| Blue-winged teal | 275 | 192 | 41 | 47 | 555 |
| Gadwall | 57 | 49 | 15 | 7 | 128 |
| Mallard | 58 | 30 | 10 | 8 | 106 |
| Northern pintail | 1 | 0 | 0 | 0 | 1 |
| Northern shoveler | 94 | 58 | 22 | 7 | 181 |
| Unidentified | 41 | 4 | 2 | 3 | 50 |
| All species combined | 1041 | ||||
| Study Area | Year-Treatment Pairing | z-Score | p-Value |
|---|---|---|---|
| Bashaw | 2015 control-2015 trapped | −0.16 | 0.88 |
| 2016 control-2017 trapped | 2.12 | 0.03 | |
| 2016 trapped-2017 control | 0.56 | 0.57 | |
| Viking | 2016 control-2017 trapped | −1.92 | 0.06 |
| 2016 trapped-2017 control | 7.13 | 0.00 |
| Treatment | Hen Killed | Year | ||
|---|---|---|---|---|
| 2015 | 2016 | 2017 | ||
| Predator Removal | Yes | 4 | 9 | 5 |
| No | 60 | 115 | 33 | |
| Control | Yes | 1 | 2 | 6 |
| No | 50 | 40 | 142 | |
© 2020 by the authors. Licensee MDPI, Basel, Switzerland. This article is an open access article distributed under the terms and conditions of the Creative Commons Attribution (CC BY) license (http://creativecommons.org/licenses/by/4.0/).
Share and Cite
Blythe, E.M.; Boyce, M.S. Trappings of Success: Predator Removal for Duck Nest Survival in Alberta Parklands. Diversity 2020, 12, 119. https://doi.org/10.3390/d12030119
Blythe EM, Boyce MS. Trappings of Success: Predator Removal for Duck Nest Survival in Alberta Parklands. Diversity. 2020; 12(3):119. https://doi.org/10.3390/d12030119
Chicago/Turabian StyleBlythe, Emily M., and Mark S. Boyce. 2020. "Trappings of Success: Predator Removal for Duck Nest Survival in Alberta Parklands" Diversity 12, no. 3: 119. https://doi.org/10.3390/d12030119
APA StyleBlythe, E. M., & Boyce, M. S. (2020). Trappings of Success: Predator Removal for Duck Nest Survival in Alberta Parklands. Diversity, 12(3), 119. https://doi.org/10.3390/d12030119