Relating Bat Passage Rates to Wind Turbine Fatalities


Abstract
1. Introduction
2. Materials and Methods
2.1. Study Area
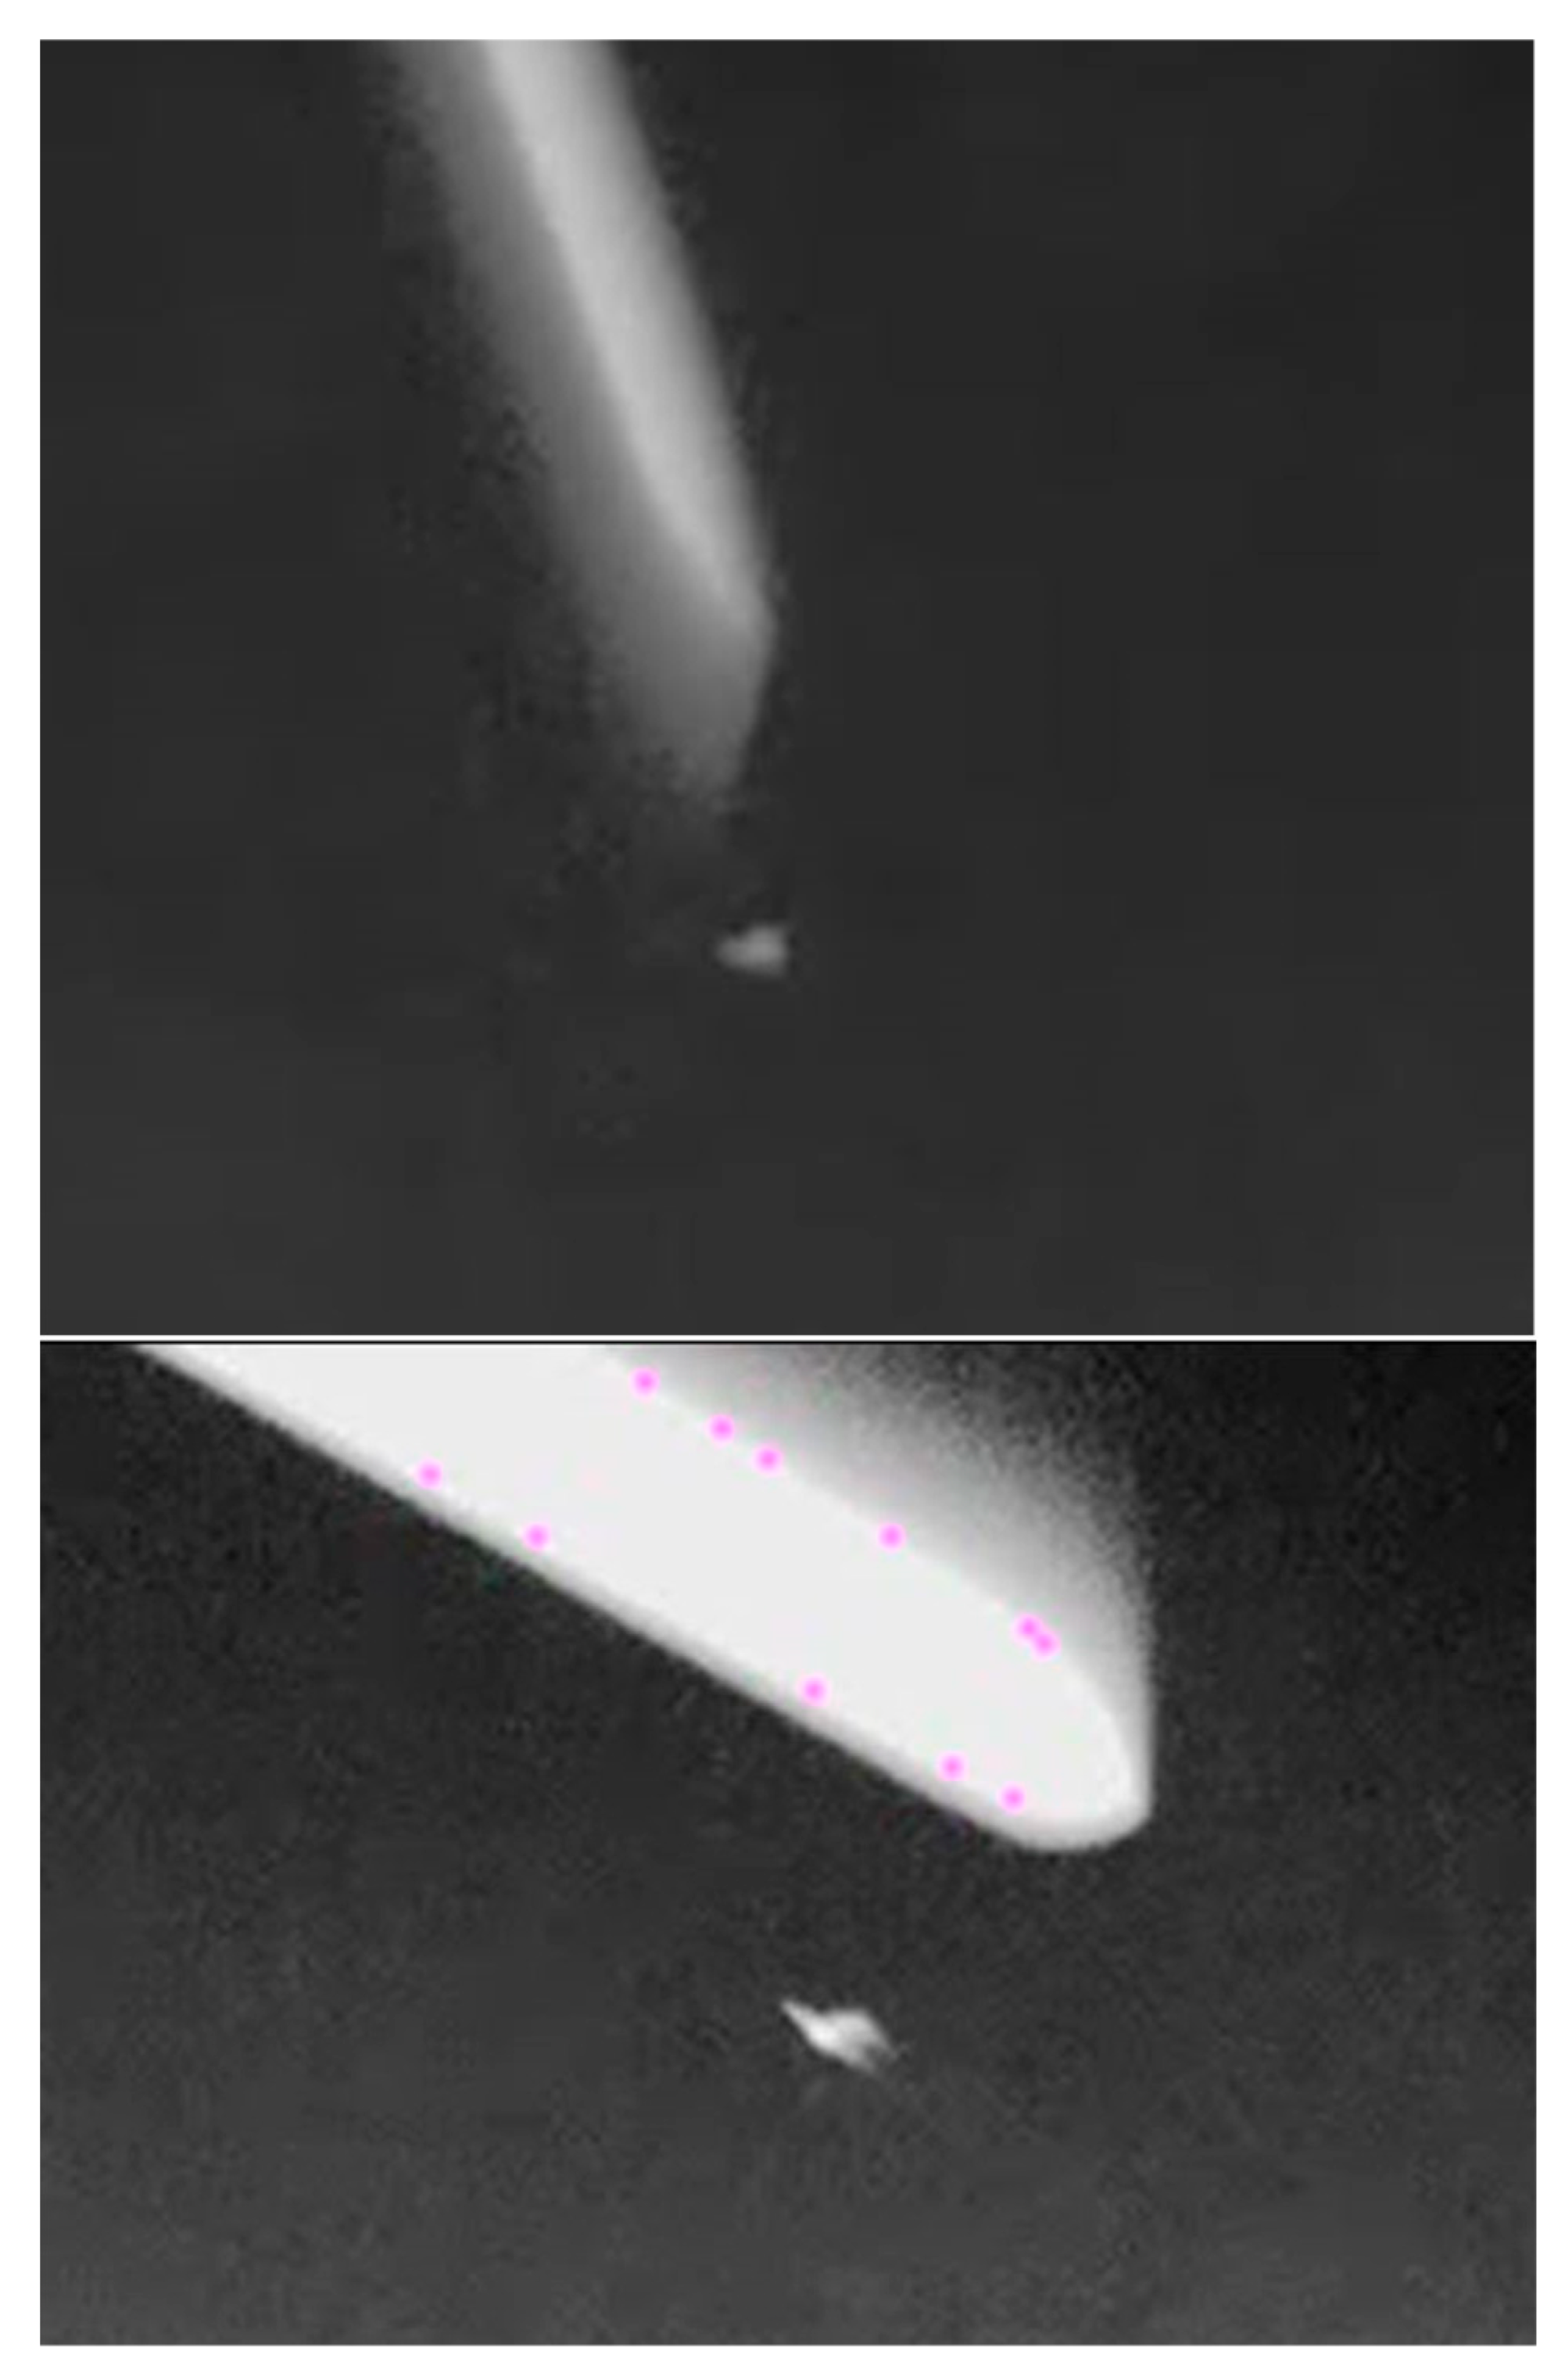
2.2. Field Methods
2.3. Fatality Estimation
3. Results
3.1. Daily Comparison of Passage Rates and Fatality Finds
3.2. Daily Comparison of Passage Rates and Fatality Finds by Wind Turbine
3.3. Fatality Estimates
3.4. Fatality Estimates from Observed Collisions
4. Discussion
4.1. Predicting Fatality Finds from Passage Rates
4.2. Fatality Estimates
5. Conclusions
Author Contributions
Funding
Acknowledgments
Conflicts of Interest
References
- Arnett, E.B.; Baerwald, E.F. Impacts of wind energy development on bats; implications for conservation. In Bat Evolution, Ecology, and Conservation; Adams, R.A., Pedersen, S.C., Eds.; Springer: New York, NY, USA, 2013; pp. 435–456. [Google Scholar] [CrossRef]
- Hayes, M.A. Bats killed in large numbers at United States wind energy facilities. BioScience 2013, 63, 975–979. [Google Scholar]
- Smallwood, K.S. Comparing bird and bat fatality-rate estimates among North American wind-energy projects. Wildl. Soc. Bull. 2013, 37, 19–33. [Google Scholar] [CrossRef]
- American Wind Energy Association. Available online: https://www.awea.org/wind-101/basics-of-wind-energy/wind-facts-at-a-glance (accessed on 8 December 2019).
- Smallwood, K.S.; Neher, L. Comparing Bird and Bat Use Data for Siting New Wind Power Generation. California Energy Commission Public Interest Energy Research Program 2017; Report CEC-500-2017-019, California Energy Commission: Sacramento, CA, USA, 2017. Available online: http://www.energy.ca.gov/2017publications/CEC-500-2017-019/CEC-500-2017-019.pdf (accessed on 21 February 2020).
- Smallwood, K.S. USA Wind Energy-Caused Bat Fatalities in 2014. Diversity 2020. in review. [Google Scholar]
- Hopkins, M.C.; Soileau, S.C. U.S. Geological Survey response to white-nose syndrome in bats. U.S. Geol. Surv. Fact Sheet 2018–3020. [CrossRef]
- Kunz, T.H.; Arnett, E.B.; Erickson, W.P.; Hoar, A.R.; Johnson, G.D.; Larkin, R.P.; Strickland, M.D.; Thresher, R.W.; Tuttle, M.D. Ecological impacts of wind energy development on bats: Questions, research needs, and hypotheses. Front. Ecol. Environ. 2007, 5, 315–324. [Google Scholar] [CrossRef]
- Smallwood, K.S.; Neher, L.; Bell, D.A. Siting to minimize raptor collisions: An example from the repowering Altamont Pass Wind Resource Area. In Wildlife and Wind Farms—Conflicts and Solutions; Perrow, M., Ed.; Pelagic Publishing: Exeter, UK, 2017; Volume 2. [Google Scholar]
- Baerwald, E.F.; Edworthy, J.; Holder, M.; Barclay, R.M.R. A large-scale mitigation experiment to reduce bat fatalities at wind energy facilities. J. Wildl. Manag. 2009, 73, 1077–1081. [Google Scholar] [CrossRef]
- Arnett, E.B.; Huso, M.M.P.; Schirmacher, M.R.; Hayes, J.P. Altering turbine speed reduces bat mortality at wind-energy facilities. Front. Ecol. Environ. 2011, 9, 209–214. [Google Scholar] [CrossRef]
- Behr, O.; Brinkmann, R.; Hochradel, K.; Mages, J.; Korner-Nievergelt, F.; Niermann, I.; Reich, M.; Simon, R.; Weber, N.; Nagy, M. Mitigating bat mortality with turbine-Specific curtailment Algorithms: A model-based Approach. In Wind Energy and Wildlife Interactions; Springer: Cham, Switzerland, 2017; pp. 135–160. [Google Scholar]
- Hayes, M.A.; Hooton, L.A.; Gilland, K.L.; Grandgent, C.; Smith, R.L.; Lindsay, S.R.; Collins, J.D.; Schumacher, S.M.; Rabie, P.A.; Gruver, J.C.; et al. A smart curtailment approach for reducing bat fatalities and curtailment time at wind energy facilities. Ecol. Appl. 2019, e01881. [Google Scholar] [CrossRef]
- Romano, W.B.; Skalski, J.R.; Townsend, R.L.; Kinzie, K.W.; Koppinger, K.D.; Miller, M.F. Evaluation of an acoustic deterrent to reduce bat mortalities at an Illinois wind farm. Wildl. Soc. Bull. 2019, 1–11. [Google Scholar] [CrossRef]
- Lintott, P.R.; Richardson, S.M.; Hosken, D.J.; Fensome, S.A.; Matthews, F. Ecological impact assessments fail to reduce risk of bat casualties at wind farms. Curr. Biol. 2016, 26, R1119–R1136. [Google Scholar] [CrossRef]
- Hein, C.; Erickson, W.; Gruver, J.; Bay, K.; Arnett, E.B. Relating pre-construction bat activity and post-construction fatality to predict risk at wind energy facilities. In Proceedings of the PNWWRM IX, Wind-Wildlife Research Meeting IX, Broomfield, CO, USA, 28–30 November 2012; Wildlife Workgroup of the National Wind Coordinating Collaborative. Schwartz, S.S., Ed.; American Wind and Wildlife Institute: Washington, DC, USA, 2013. [Google Scholar]
- Johnston, D.S.; Howell, J.A.; Terrill, S.B.; Thorngate, N.; Castle, J.; Smith, J.P.; Mabee, T.J.; Plissner, J.H.; Schwab, N.A.; Sanzenbacher, P.M.; et al. Bird and Bat Movement Patterns and Mortality at the Montezuma Hills Wind Resource Area; Report CEC-500-2013-015, California Energy Commission: Sacramento, CA, USA, 2013. [Google Scholar]
- Smallwood, K.S. Estimating wind turbine-caused bird mortality. J. Wildl. Manag. 2007, 71, 2781–2791. [Google Scholar] [CrossRef]
- Smallwood, K.S. Long search intervals under-estimate bird and bat fatalities caused by wind turbines. Wildl. Soc. Bull. 2017, 41, 224–230. [Google Scholar] [CrossRef]
- Smallwood, K.S.; Bell, D.A.; Karas, B.; Snyder, S.A. Response to Huso and Erickson comments on novel scavenger removal trials. J. Wildl. Manag. 2013, 77, 216–225. [Google Scholar] [CrossRef]
- Smallwood, K.S.; Bell, D.A.; Walther, E.L.; Leyvas, E.; Standish, S.; Mount, J.; Karas, B. Estimating wind turbine fatalities using integrated detection trials. J. Wildl. Manag. 2018, 82, 1169–1184. [Google Scholar] [CrossRef]
- Adams, A. Assessing and Analyzing Bat Activity with Acoustic Monitoring: Challenges and Interpretations. Ph.D. Thesis, The University of Western Ontario, London, ON, Canada, 2013. [Google Scholar]
- Weller, T.J.; Baldwin, J.A. Using echolocation monitoring to model bat occupancy and inform mitigations at wind energy facilities. J. Wildl. Manag. 2011, 76, 619–631. [Google Scholar] [CrossRef]
- Roemer, C.; Disca, T.; Coulon, A.; Bas, Y. Bat flight height monitored from wind masts predicts mortality risk at wind farms. Biol. Conserv. 2017, 215, 116–122. [Google Scholar] [CrossRef]
- Corcoran, A.J.; Weller, T.J. Inconspicuous echolocation in hoary bats (Lasiurus cinereus). Proc. R. Soc. 2018, 285, 20180441. [Google Scholar] [CrossRef]
- Gorresen, P.M.; Cryan, P.M.; Kristina Montoya-Aiona, K.; Bonaccorso, F.J. Do you hear what I see? Vocalization relative to visual detection rates of Hawaiian hoary bats (Lasiurus cinereus semotus). Ecol. Evol. 2017, 7, 6669–6679. [Google Scholar] [CrossRef]
- Smallwood, K.S. The challenges of addressing wildlife impacts when repowering wind energy projects. In Proceedings of the Wind Energy and Wildlife Impacts: Proceedings from the CWW 2015 Conference, Berlin, Germany, 10–12 March 2015; Köppel, J., Ed.; Springer: Cham, Switzerland, 2017; pp. 175–187. [Google Scholar]
- Reyes, G.A.; Rodriguez, M.J.; Lindke, K.T.; Ayres, K.L.; Halterman, M.D.; Boroski, B.R.; Johnston. D.S. Searcher efficiency and survey coverage affect precision of fatality estimates. J. Wildl. Manag. 2016, 80, 1488–1496. [Google Scholar] [CrossRef]
- Mathews, F.; Swindells, M.; Goodhead, R.; August, T.A.; Hardman, P.; Linton, D.M.; Hosken, D.L. Effectiveness of search dogs compared with human observers in locating bat carcasses at wind-turbine sites: A blinded randomized trial. Wildl. Soc. Bull. 2013, 37, 34–40. [Google Scholar] [CrossRef]
- Arnett, E. A preliminary evaluation on the use of dogs to recover bat fatalities at wind energy facilities. Wildl. Soc. Bull. 2006, 34, 1440–1445. [Google Scholar] [CrossRef]
- Smallwood, K.S.; Bell, D.A.; Standish, S. Dogs detect larger wind energy impacts on bats and birds. J. Wildl. Manage 2020. In press. [Google Scholar]
- Smallwood, K.S.; Bell, D.A.; Snyder, S.A.; DiDonato, J.E. Novel scavenger removal trials increase estimates of wind turbine-caused avian fatality rates. J. Wildl. Manag. 2010, 74, 1089–1097. [Google Scholar] [CrossRef]
- Smallwood, K.S. Bird and bat impacts and behaviors at old wind turbines at Forebay, Altamont Pass Wind Resource Area. In California Energy Commission Public Interest Energy Research Program 2016; Report CEC-500-2016-066, California Energy Commission: Sacramento, CA, USA, 2016. Available online: http://www.energy.ca.gov/2016publications/CEC-500-2016-066/CEC-500-2016-066.pdf (accessed on 21 February 2020).
- Limpens, H.J.G.A.; Boonman, M.; Korner-Nievergelt, F.; Jansen, E.A.; van der Valk, M.; La Haye, M.J.J.; Dirksen, S.; Vreugdenhil, S.J. Wind Turbines and Bats in the Netherlands—Measuring and Predicting; Final Report; Zoogdiervereniging & Bureau Waardenburg: Nijmegen, The Netherlands, 2013; p. 12. [Google Scholar]
- Horn, J.W.; Arnett, E.B.; Kunz, T.H. Behavioral responses of bats to operating wind turbines. J. Wildl. Manag. 2008, 72, 123–132. [Google Scholar] [CrossRef]
- Cryan, P.M.; Gorresen, P.M.; Hein, C.D.; Schirmacher, M.R.; Diehl, R.H.; Huso, M.H.; Hayman, D.T.S.; Fricker, P.D.; Bonaccorso, F.J.; Johnson, D.H.; et al. Behavior of bats at wind turbines. Proc. Natl. Acad. Sci. USA 2014, 111, 15126–15131. [Google Scholar] [CrossRef]
- Brown, K.; Smallwood, K.S.; Szewczak, J.; Karas, B. Avian and Bat Monitoring Project Vasco Winds, LLC; Final 2012–2015 Report; Prepared for NextEra Energy Resources: Livermore, CA, USA, 2016. [Google Scholar]
- H.T. Harvey & Associates. Golden Hills Wind Energy Center Post-Construction Fatality Monitoring Report: Year 2; Prepared for Golden Hills Wind LLC: Livermore, CA, USA, 2018. [Google Scholar]
- Insignia Environmental. Draft Final Report for the Buena Vista Avian and Bat Monitoring Project; Report to County of Contra Costa: Martinez, CA, USA, 2011. [Google Scholar]
- Lamphier-Gregory; West Inc.; Shawn Smallwood, S.; Jones & Stokes Associates; Illingworth & Rodkin Inc.; Environmental Vision. Environmental Impact Report for the Buena Vista Wind Energy Project; LP# 022005, County of Contra Costa Community Development Department: Martinez, CA, USA, 2005. [Google Scholar]
- Foo, C.F.; Bennett, V.J.; Hale, A.M.; Korstian, J.M.; Schildt, A.J.; Williams, D.A. Increasing evidence that bats actively forage at wind turbines. PeerJ 2017, 5, e3985. [Google Scholar] [CrossRef]
- Harriman, A.E. Olfactory acuity in the common raven (Corvus corax). Physiol. Behav. 1986, 36, 257–262. [Google Scholar] [CrossRef]


| Station | Date | Start Time | Turbines Surveyed | Status on Survey Date | Next-Morning Fatality Searcher | |
|---|---|---|---|---|---|---|
| Golden Hills | Buena Vista | |||||
| 12 | 9/4/2017 | 19:51 | 4 | Operable | Human | |
| 3 | 9/5/2017 | 19:53 | 5 | Operable | Human | |
| 89 | 9/7/2017 | 19:55 | 3 | Operable | Human | |
| 91 | 9/8/2017 | 19:52 | 5 | Operable | Human | |
| 85 | 9/10/2017 | 19:54 | 2 | Operable | Human | |
| 93 | 9/12/2017 | 19:52 | 5 | Operable | Human | |
| 92 | 9/14/2017 | 19:48 | 5 | Operable | Dog | |
| 66 | 9/15/2017 | 20:02 | 2 | Operable | Dog | |
| 95 | 9/17/2017 | 19:45 | 3 | Operable | Dog | |
| 61 | 9/18/2017 | 19:38 | 3 | Operable | Dog | |
| 97 | 9/19/2017 | 19:48 | 2 | Operable | Dog | |
| 64 | 9/21/2017 | 19:37 | 3 | Operable | Dog | |
| 96 | 9/22/2017 | 19:29 | 4 | Operable | Dog | |
| 3 | 9/24/2017 | 19:29 | 5 | Operable | Dog | |
| 86 | 9/25/2017 | 19:21 | 4 | Operable | Dog | |
| 91 | 9/26/2017 | 19:20 | 4 | Operable | Dog | |
| 94 | 9/28/2017 | 19:22 | 3 | Operable | Dog | |
| 89 | 9/29/2017 | 19:23 | 2 | Operable | Dog | |
| 93 | 10/1/2017 | 19:15 | 4 | Operable | Dog | |
| 90 | 10/2/2017 | 19:14 | 2 | Operable | Dog | |
| 71 | 10/3/2017 | 19:14 | 4 | Inoperable | Dog | |
| 12 | 10/5/2017 | 19:07 | 2 | Operable | Dog | |
| 95 | 10/6/2017 | 19:04 | 3 | Inoperable | Dog | |
| 85 | 10/8/2017 | 19:03 | 4 | Operable | Dog | |
| 92 | 10/9/2017 | 19:02 | 4 | Inoperable | Dog | |
| 66 | 10/10/2017 | 19:03 | 2 | Operable | Dog | |
| 61 | 10/12/2017 | 18:54 | 2 | Operable | Dog | |
| 96 | 10/13/2017 | 18:57 | 3 | Inoperable | Dog | |
| 97 | 10/15/2017 | 18:52 | 3 | Operable | Dog | |
| 94 | 10/16/2017 | 18:51 | 3 | Inoperable | Dog | |
| 64 | 10/17/2017 | 18:55 | 2 | Operable | Dog | |
| 92 | 10/19/2017 | 19:02 | 4 | Inoperable | Dog | |
| 86 | 10/20/2017 | 18:46 | 2 | Operable | Dog | |
| 63 | 10/22/2017 | 18:55 | 2 | Operable | Dog | |
| 3 | 10/23/2017 | 18:50 | 4 | Inoperable | Dog | |
| 90 | 10/24/2017 | 18:42 | 2 | Operable | Dog | |
| 93 | 10/26/2017 | 18:40 | 4 | Inoperable | Dog | |
| 12 | 10/27/2017 | 18:48 | 2 | Operable | Dog | |
| 89 | 10/29/2017 | 18:45 | 2 | Operable | Dog | |
| 91 | 10/30/2017 | 18:48 | 5 | Inoperable | Dog | |
| 85 | 10/31/2017 | 18:40 | 3 | Operable | Dog | |
| 95 | 11/2/2017 | 18:37 | 3 | Inoperable | Dog | |
| 98 | 11/3/2017 | 18:30 | 2 | Operable | Dog | |
| 88 | 11/5/2017 | 18:40 | 3 | Operable | Dog | |
| 92 | 11/6/2017 | 18:43 | 4 | Inoperable | Dog | |
| 70 | 11/7/2017 | 18:33 | 3 | Operable | Dog | |
| 68 | 11/9/2017 | 18:36 | 2 | Operable | Dog | |
| 96 | 11/10/2017 | 18:35 | 4 | Inoperable | Dog | |
| 94 | 11/12/2017 | 18:35 | 3 | Inoperable | Dog | |
| 69 | 11/13/2017 | 18:24 | 2 | Operable | Dog | |
| 61 | 11/14/2017 | 18:35 | 3 | Operable | Dog | |
| Days Since Death | Variable Measured the Night before Search | Fatalities Not Found | Fatalities Found | t-Test (DF = 1,65) | |||
|---|---|---|---|---|---|---|---|
| 95% CI | 95% CI | t | P | ||||
| ≤3 | Passages/hr/ha of rotor | 22.3 | 9–37 | 88.2 | 0–240 | −2.304 | 0.024 |
| ≤3 | Near misses/hr/ha a | 8.2 | 1–15 | 64.7 | 0–175 | −3.574 | 0.001 |
| ≤3 | Risky behavior/hr/ha b | 20.0 | 8–32 | 72.9 | 0–202 | −2.102 | 0.039 |
| ≤3 | Operative time (h) | 0.27 | 0.19–0.35 | 0.59 | 0.33–0.85 | −2.084 | 0.041 |
| ≤3 | Temperature (C) | 19.1 | 18.1–20.1 | 19.2 | 13.9–24.5 | −0.065 | 0.948 |
| ≤3 | Wind direction (°) | 215 | 208–223 | 265 | 177–352 | −3.201 | 0.002 |
| ≤3 | Visible moon (%) | 15 | 10–20 | 53 | 12–94 | −3.514 | 0.001 |
| ≤7 | Passages/hr/ha of rotor | 23.3 | 9–37 | 48.1 | 0–112 | −1.152 | 0.253 |
| ≤7 | Near misses/hr/ha a | 8.7 | 1–16 | 32.7 | 0–80 | −1.952 | 0.055 |
| ≤7 | Risky behavior/hr/ha b | 21.3 | 9–34 | 36.8 | 0–92 | −0.818 | 0.416 |
| ≤7 | Operative time (h) | 0.24 | 0.17–0.32 | 0.59 | 0.34–0.84 | −3.126 | 0.003 |
| ≤7 | Temperature (C) | 19.1 | 18.1–20.2 | 18.6 | 15.7–21.5 | 0.366 | 0.716 |
| ≤7 | Wind direction (°) | 215 | 208–223 | 240 | 202–278 | −2.115 | 0.038 |
| ≤7 | Visible moon (%) | 15 | 10–21 | 33 | 6–60 | −2.156 | 0.035 |
| ≤30 | Passages/hr/ha of rotor | 18.8 | 6–32 | 52.1 | 6–98 | −2.029 | 0.047 |
| ≤30 | Near misses/hr/ha a | 8.2 | 0–16 | 23.1 | 0–47 | −1.536 | 0.129 |
| ≤30 | Risky behavior/hr/ha b | 21.3 | 7–35 | 29.6 | 2–57 | −0.558 | 0.578 |
| ≤30 | Operative time (h) | 0.22 | 0.14–0.30 | 0.52 | 0.36–0.68 | −3.594 | 0.001 |
| ≤30 | Temperature (C) | 19.4 | 18.4–20.5 | 17.8 | 16.0–19.6 | 1.492 | 0.141 |
| ≤30 | Wind direction (°) | 213 | 205–220 | 238 | 216–260 | −2.820 | 0.006 |
| ≤30 | Visible moon (%) | 14 | 9–20 | 27 | 10–44 | −2.008 | 0.049 |
© 2020 by the authors. Licensee MDPI, Basel, Switzerland. This article is an open access article distributed under the terms and conditions of the Creative Commons Attribution (CC BY) license (http://creativecommons.org/licenses/by/4.0/).
Share and Cite
Smallwood, K.S.; Bell, D.A. Relating Bat Passage Rates to Wind Turbine Fatalities. Diversity 2020, 12, 84. https://doi.org/10.3390/d12020084
Smallwood KS, Bell DA. Relating Bat Passage Rates to Wind Turbine Fatalities. Diversity. 2020; 12(2):84. https://doi.org/10.3390/d12020084
Chicago/Turabian StyleSmallwood, K. Shawn, and Douglas A. Bell. 2020. "Relating Bat Passage Rates to Wind Turbine Fatalities" Diversity 12, no. 2: 84. https://doi.org/10.3390/d12020084
APA StyleSmallwood, K. S., & Bell, D. A. (2020). Relating Bat Passage Rates to Wind Turbine Fatalities. Diversity, 12(2), 84. https://doi.org/10.3390/d12020084