Abstract
Two-hundred and twenty-six old avocado trees (Persea americana Mill) derived from seeds were selected from eight districts of the Mbeya, Njombe and Songwe regions in Tanzania. The tree, leaf, fruit and seed characteristics were studied using the descriptors for avocado (Persea spp.) from the International Plant Genetic Resources Institute. Cross tabulation and Chi-square tests were conducted in order to assess the distribution of traits between districts and altitude ranges. Principle coordinate analysis (PCoA) and hierarchical cluster analysis (HCA) were used to assess variation of traits within and among districts. Various morphological features were observed among the samples which point to the existence of the Mexican, Guatemalan and West Indian avocado races in Tanzania. The biplot from PCoA revealed extensive variation between the sampled trees at the district level but no clear groupings of the samples based on geographic location. Likewise, dendrograms ensuing from the neighbor–joining and Wards methods displayed that the avocado samples from the same district and even region differed considerably. This morphological trait variation suggests high diversity that may help in planning germplasm management and conservation, as well as breeding strategies in the future.
1. Introduction
Avocado (Persea americana Mill) is an important plant from the family Lauraceae bearing fruits that are highly appreciated for their nutrition and health benefits [1,2]. The avocado tree may grow as high as 20 m, while its trunk can reach 90 cm in diameter and the leaf can grow up to 40 cm long [3,4]. Avocado leaves have diverse shapes like ovate, obovate, oval, roundish or lanceolate [4], whereas the fruits may show numerous shapes including rhomboid, ellipsoid, pyriform or obovate [3,4]. The fruits can be 7 to 20 cm long and up to 15 cm wide, weighing 100 to 1000 g [3]. The peel may be reddish purple, deep-green, yellowish green or dark purple and sometimes speckled with yellow dots, while its thickness can measure from less than one millimetre up to 6 mm [3]. In general, avocado flesh can be completely pale to rich-yellow in colour, buttery, bland or nutlike in taste [3]. The seed may have shapes like roundish, conical, oblate or ovoid. In some cases, the fruit may lack seed due to the absence of pollination [3,4].
Avocadoes are categorised into Guatemalan, Mexican and West Indian botanical groups, which are also referred to as horticultural or ecological races [5,6]. While the Mexican and Guatemalan races originated in the countries after which they are named, the West Indian race originated along the Pacific coast of Central America and thus would be more accurately named as the “lowland” race of avocado [5,7]. In truly tropical climates, only the West Indian race is well adapted, while the Guatemalan and especially the Mexican accessions generally show poor fruit set. In colder avocado regions, only accessions of the Mexican race survive [5]. However, hybrids from crosses between different races are adapted to a wide range of environments [5]. Popenoe [8] studied the different races and their performance in the region between the Tropic of Cancer and the Tropic of Capricorn (the Torrid Zone), and found that from sea level to an altitude of about 1000 metre above sea level (masl), the West Indian race was well adapted, together with other fruits such as mango and breadfruit. From about 1000 to 2000 masl, the Guatemalan race was well adapted, together with citrus and cherimoya. From about 1500 to 3000 masl, the Mexican lines did best, together with apple and peach. Nevertheless, all three races do well side-by-side in parts of Israel and Morocco [5].
In Tanzania, avocado cultivation was first reported in Zanzibar in 1892, and then increased extensively during the 1900s [9,10]. Avocado was grown for diverse purposes as fruits were used as food, leaf and seed used for feeding animals such as goats and cows, and stems used as timber and firewood [11]. Since then, avocado has been propagated through seeds obtained mainly after cross pollination, thus allowing high genetic diversity to accumulate over more than 100 years. Research studies on avocado were undertaken in Tanzania during the 1990s and thereafter from 2007 [11]. They mainly focused on increasing the local avocado production by importing improved cultivars like ‘Hass’ and ‘Fuerte’, which are propagated through grafting to maintain fruit quality and yield. Furthermore, these previous research studies involved mapping suitable areas for growing improved avocado cultivars, supporting farmers in the establishment and management of nurseries/orchards, grafting strategy, post-harvest handling and marketing [11]. However, research assessing the diversity of seed-propagated avocado grown in Tanzania is lacking. Thus, the present study aimed to characterize and document Tanzanian local avocado germplasm using qualitative and quantitative morphological traits. The results from this work will help in planning germplasm management and conservation, as well as breeding strategies, in the future.
2. Materials and Methods
2.1. Sites and Sampling
This research included eight districts in the Mbeya, Njombe and Songwe regions located in the Southern Highlands of Tanzania (Figure 1). The regions were chosen due to their great richness of avocado seedlings and their proximity which facilitated travelling between them. Seedlings in this context means old avocado trees grown from seed.
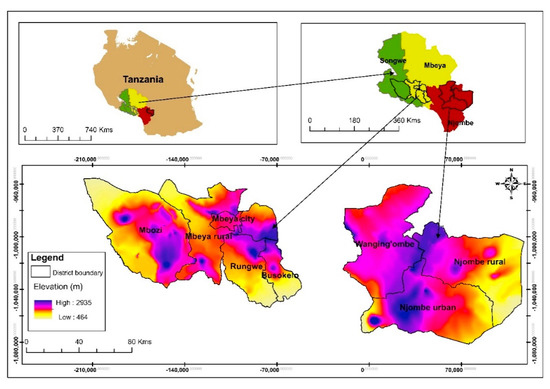
Figure 1.
Study site location.
Field visits were made from February to August 2017 with the help of local people who were familiar with avocado growing areas (village and streets) in a specific district. Upon arriving in a village or street and being introduced to the local authority, an inhabitant of the area took us to avocado farms, of which most were around the homesteads. Depending on the number of avocado trees found in a given village or street and availability of farmers, we sampled one to twelve avocado trees from each village or street. Care was taken that the sampled trees within a farm were not standing next to each other. In the same way, selected farms within a village or street were not located next to each other. When collecting tree samples in a village or street within an area, neighbouring villages were not selected for sampling. When an avocado tree was identified, we collected information regarding the farmer’s name, name of the village or street, district and region where the tree was found. Latitude, longitude and elevation (altitude) of the site were determined by using a Garmin Epic GPS (Global positioning system) mapping & Multisport Watch. The vernacular name of avocado, the ethnic group living in area where the study was conducted, the cropping system and associated flora were also recorded and photographed. The site environment was described using the field guide for avocado crops [12], thus collecting information regarding topography, higher level landform (general physiographic features), slope form, slope aspect (the compass direction that the slope on which the accession was collected faces), soil drainage, soil erosion and water availability. The slope aspect was determined with the Garmin Epic GPS mapping & Multisport Watch. A total of 226 avocado seedlings were studied in fifty villages/streets. Forty one villages/streets contributed with at least two sampled trees, whereas the other nine villages/streets contributed with a single tree each. The majority of these seedlings were older and massive. Information on number of avocado trees sampled in each district and vernacular names is given in Table 1.

Table 1.
Number of avocado trees sampled, representing eight districts and three regions in Tanzania.
2.2. Morphological Trait Measurements
For each chosen tree, tree trunk, young twigs, leaves of similar age, mature fruits and seeds were photographed and described using the International Plant Genetic Resources Institute (IPGRI) field guide for avocado crops [12]. Three twigs, four to six leaves, three to five fruits and three seeds were evaluated from each tree. We selected the 20 most important plant descriptors, which are marked with a star in the field guide. These descriptors facilitate an effortless and quick discrimination between phenotypes. They are generally highly heritable, easily observed by the eye and are equally expressed in all environments [12]. Due to some challenges in collecting information about some descriptors, we skipped 6 descriptors out of the 20. The 14 descriptors (characteristics) studied and their possible variants as listed by the IPGRI field guide are presented in Table 2.

Table 2.
List of characteristics evaluated and their alternative variants.
We touched the trunk surface with bare hands to feel its smoothness or roughness. In determining the colour of a young twig, we compared its colour against the Royal Horticultural Society (RHS) colour chart [13]. The presence of fine, short hairs on the young twig and on the underside of the leaf was observed by naked eye. The leaf shape, fruit shape, pedicel shape and seed shape of the samples were compared against their respective drawings in the field guide. We used a protractor to measure the primary leaf vein divergence at the middle part of the leaf on the right and left of the midrib. We then calculated the average of the two measurements. A transparent 30cm ruler was employed in determining fruit peel thickness at the equator of the fruit, while the RHS colour chart was used in assessing peel colour of the ripe fruits. Approximately 3 mature fruits per tree were ripened in a plastic box in order to check peel colour. In some cases, the ripe fruits were supplied by farmers from their storage. We tasted the fruits to evaluate flesh texture, but in a few cases we depended entirely on the information provided by the tree owner. The cotyledon surface smoothness or roughness was determined by touching the seed with bare hands, estimating the friction between the hand and the cotyledon surface.
2.3. Data Analysis
Data on the altitude of avocado tree sites were subjected to boxplot in order to display the data pattern and compare the medians between districts. We used Kruskal-Wallis test to determine whether the median groups for 8 districts differ. A Steel-Dwass-Critchlow-Fligner procedure was also employed in carrying out multiple pair-wise comparisons of the medians to determine variation between groups. Default significance level (5%) and asymptotic p-value were considered. Boxplot, Kruskal-Wallis test and Steel-Dwass-Critchlow-Fligner procedure were performed in XLSTAT-Base solution version 2018.6.54124 [14]. Data on morphological traits for 226 avocado trees were subjected to a cross tabulation statistical technique for determining the frequency distribution of the traits between districts and altitude ranges. The Pearson Chi-square test was employed to determine whether the variables subjected to cross tabulation are associated (dependent). The cross tabulation and Chi-square tests were performed in the Minitab® [15]. We used a bar chart to compare the frequency distribution of the traits of the 226 avocado trees in the districts and altitude ranges. We used Minitab® [15] to carry out one-way analysis of variance (one-way ANOVA) to analyse the differences among group means for the number of primary leaf veins and the leaf vein divergence. Post-hoc tests were performed with the Tukey method to determine variation in group means across categories of districts and altitude ranges. The coefficient of variation was computed to find out the degree of variability in the number of primary leaf veins and leaf vein divergence across districts and altitude ranges.
In order to conduct principal coordinate analysis (PCoA) and hierarchical cluster analysis (HCA) on the 226 avocado samples, we computed a dissimilarity matrix using the daisy function [16] in the XLSTAT-Base solution [14]. This matrix was formed from 13 characters, of which 10 were qualitative and 3 were quantitative while excluding the ripe fruit peel colour. The matrix consisted of 226 avocado samples with 226 rows × 227 columns. With this dissimilarity matrix as the input data, we performed principal coordinate analysis in order to graphically display the morphological relationships of the 226 avocado trees sampled in the 8 districts. Thereafter, we imported the same matrix in Trex-online–UQAM [17] to compute a dendrogram of the 226 avocado samples using the neighbor–joining method [18]. The Newick tree format was exported to the Interactive Tree Of Life (iTOL) v5 [19] for visualisation and customization of the dendrogram. For the purpose of studying the hierarchical clustering of the eight avocado populations (groups), we computed frequency of occurrence of character variants per district (population) in Microsoft Excel 2016. The dissimilarity matrix was then produced from this dataset following the methods described earlier. This matrix was based on 14 characteristics and consisted of 8 avocado populations with 8 rows × 9 columns. With this matrix, we generated the second dendrogram in the XLSTAT-Base solution [14] using Ward’s method [20].
3. Results
3.1. Altitude of the Sampling Sites
The median values for the altitude at which the samples were collected ranged from 1106 (Busokelo) to 1934 (Njombe urban) masl (Figure 2). The Mbeya rural and Wanging’ombe avocado tree samples were found at altitudes with comparable median values; 1876 and 1890 masl, respectively. In Mbeya rural, 50% of the avocado trees were found at altitude range of 1861 (the first quartile) to 1908 (the third quartile) masl, while others were found at altitudes that were as low as 1794 and as high as 1934 masl with exclusion of outliers whose lowest and highest values were 1534 and 2136 masl, respectively. For the Wanging’ombe avocado trees, 50% of them were found at altitude range of 1882 to 1954 masl, while others were at altitudes that were as low as 1860 and as high as 2007 masl. A Kruskal-Wallis test showed that there was a significant difference in the medians among groups (Х2 = 199.82, df = 7, p = 0.0001).
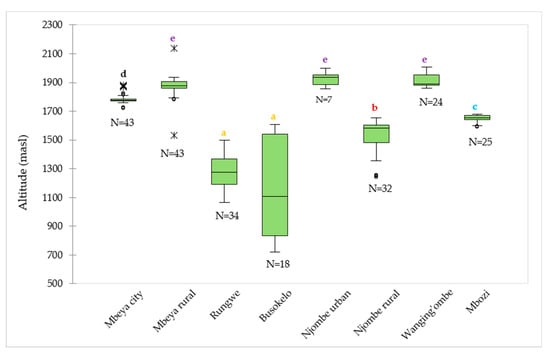
Figure 2.
Distribution of the 226 avocado trees with respect to the altitude in the eight districts. ‘N’ represents number of samples involved in the analysis in a given district, whereas circles and asterisks (*) represent outliers. Boxplots not identified by the same letter represent statistically different medians (p < 0.05) according to the Steel-Dwass-Critchlow-Fligner procedure.
3.2. Tree Trunk and Twig Characteristics
Three variants of trunk surface were noted among the trees studied (Figure 3a–d), with 36.9 and 38.7% of all the samples displaying rough and very rough trunk surfaces, respectively (Figure 3e). The highest abundance for smooth, rough and very rough trunk surfaces were observed in Mbeya city (44.2%), Njombe urban (85.7%) and Mbozi (68.0%), respectively. There was a statistically supported association between the trunk surface and districts (Х2 = 43.872, df = 14, p = 0.0001). The very rough trunk surface was predominant at 719–1200 and 1201–1600 masl, with abundance of 50.0 and 63.2%, respectively (Figure 3f). The rough trunk surface was predominant at 1901–2136 (43.3%) and 1601–1800 (38.4%) masl. At 1801–1900 masl both smoot and rough trunk surface occurred at equal proportions, 40.0% each. There was a statistically significant association between the trunk surface and the altitude range (Х2 = 30.627, df = 8, p = 0.0001).
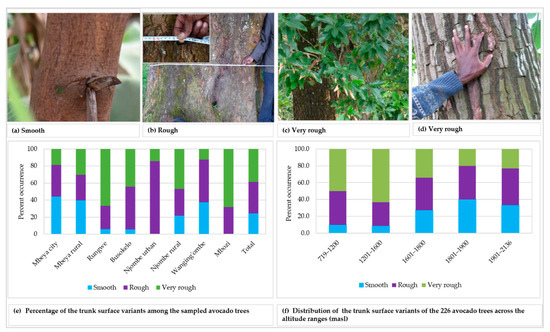
Figure 3.
Trunk surface of the studied trees.
The young twigs showed both pubescent and glabrous surfaces, with 55.8% of all the sampled trees displaying glabrous surface (Figure 4a). Glabrous surface was most predominant in avocado plants from Njombe urban (85.7%) whereas pubescent surface dominated in Mbeya city (79.1%). There was a statistically significant association between the young twig surface and the district (Х2 = 27.055, df = 7, p = 0.0001). The pubescent twig surface was most frequent at 1601–1800 masl with 59.7%, whereas the glabrous twig surface was predominant at the other elevation ranges, with abundance of 56.7 to 81.0% (Figure 4b). A statistically supported association between the young twig surface and the altitude ranges was detected (Х2 = 14136, df = 4, p = 0.007). The colour of the young twigs varied greatly among the plants studied (Figure 4c–e), with yellow-green group 144 found in 37.8% of all the sampled trees. About 27% of the studied twigs displayed speckled colours and were diverse in terms of colour composition and patterns. Trees from the Rungwe district showed nine colour groups, followed by those from Wanging’ombe exhibiting eight colour groups. The lowest number of identified colour groups was four, which was displayed by Mbeya city and Busokelo avocado trees.
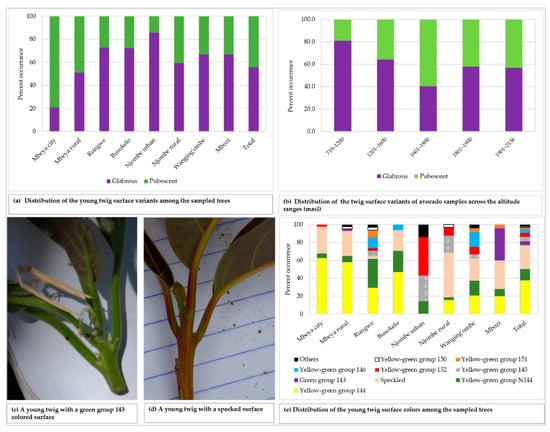
Figure 4.
The young twig characteristics among the sampled trees.
3.3. Leaf Characteristics
A total of eleven leaf shapes, of which seven are listed in the avocado descriptor guide, were recorded across the 226 trees studied (Figure 5). Data on the distribution of the 7 most common leaf shapes encountered are presented in Figure 6a while the remaining 4 leaf shapes are grouped into the ‘other’ category. The most common leaf shape was lanceolate (31.1% of the trees) whereas the rarest shape was ovate (0.9%), present only in the Mbeya city and Mbozi districts. Narrowly obovate and lanceolate shapes were recorded in all districts, and in Njombe urban only these two leaf shapes were found. The other shapes were found to varying degrees in the districts. Narrowly obovate leaves were most abundant in Rungwe (20.6%) whereas oval, roundish, lanceolate and oblong-lanceolate leaves were most abundant in Mbeya rural (48.8%), Busokelo (41.2%), Njombe urban (85.7%) and Mbozi (20%), respectively. About 4% of the trees exhibited leaf shapes that are not listed in the avocado descriptor guide.
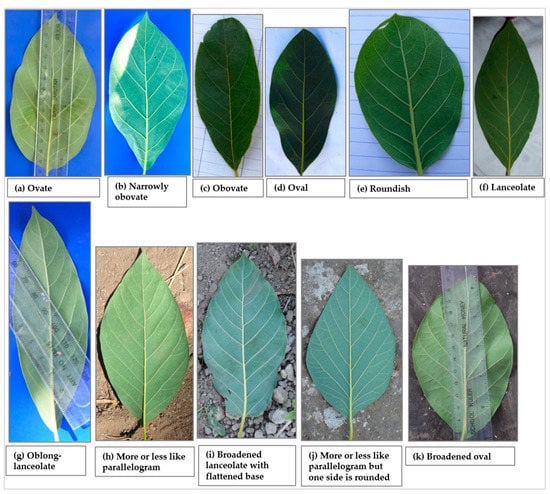
Figure 5.
Leaf shapes that were recorded among the studied trees; (a–g) are listed in the descriptor guide, (h–k) are not listed in the descriptor guide.
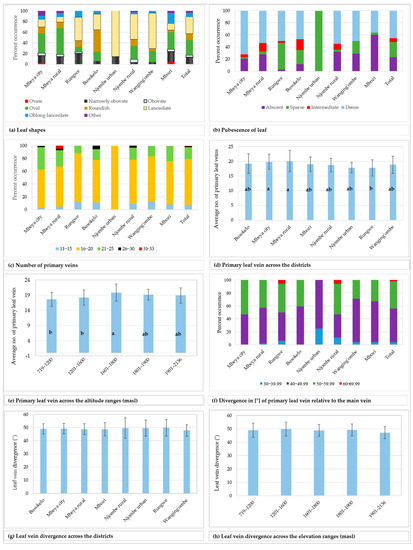
Figure 6.
Leaf characteristics among the sampled avocado trees. Bars not sharing a letter in a figure section (d–e) represent statistically different values (p < 0.05) according to Tukey test.
While 23.1% of the studied trees had leaves with no pubescence on the abaxial surface, others possessed pubescence which was either sparse, intermediate or dense (Figure 6b). The limited counts in some groups restricted the Chi-square tests at the district level. However, a statistically significant association was observed between the leaf pubescence and the three regions Mbeya, Njombe and Songwe (Х2 = 29.045, df = 6, p = 0.0001).
The number of primary leaf veins on the analysed leaves ranged from 11 to 33 (Figure 6c), with 71.7% of all trees having 16 to 20 primary leaf veins. Trees from the Mbeya rural district showed the widest span in the number of primary veins, whereas the trees from the Njombe urban area had a narrow span and displayed 16 to 20 primary veins per leaf. A higher number of primary veins (26 to 30) could be found in Mbeya city, Mbeya rural district, Busokelo and Njombe rural districts, whereas as many as 31 to 33 could be found in the Mbeya rural district. Analysis of variance (one–way ANOVA) showed that the means of the number of primary leaf veins across the districts ranged from 17.857 ± 1.773 (Njombe urban) to 20.14 ± 3.623 (Mbeya rural; Figure 6d), and the means were statistically different (F(221) = 2.73, p = 0.010). The Mbeya rural avocados were observed to have the highest degree of variability in the number of primary leaf veins with a coefficient of variation of 17.99% (Table 3), whereas the Mbeya urban avocados reported the lowest degree of variability, 9.93%. The mean values for the number of primary leaf veins across altitude ranges fluctuated from 17.65 ± 2.346 (719–1200 masl) to 19.875 ± 2.773 (1601–1800 masl; Figure 6e) and were statistically different (F(221) = 5.19, p = 0.001). The highest degree of variability in the number of primary leaf veins, with regard to elevation range, was 13.95% that was detected at 1601–1800 masl (Table 3). The lowest degree of variability, 9.44%, was noticed in the samples collected at 1801–1900 masl. The primary leaf vein divergence relative to the main vein, measured on the middle part of the leaf, ranged from 33.50 to 68.50° (Figure 6f), with 52% of all the samples in the range 40–49.99°. The minimum and maximum values for the means of the primary leaf vein divergence relative to the main vein across districts were 47.833 ± 4.442 and 49.84 ± 6.200, recorded in Wanging’ombe and Rungwe avocados, respectively (Figure 6g). However, no significant variation was detected between means of the groups (one–way ANOVA; F(212) = 0.31, p = 0.948). The district with the highest variability in the avocado leaf vein divergence was the Njombe rural (15.86%) (Table 3), whereas the lowest variability was noticed in Busokelo (7.93%). When analysed based on the altitude ranges, the means for the leaf vein divergence relative to the main vein ranged from 47.192 ± 4.624, recorded at the highest elevation range, to 49.81 ± 5.186, recorded at 1201–1600 masl (Figure 6h). The means were not statistically different between the groups (one–way ANOVA; F(212) = 1.34, p = 0.255). The samples collected at 1801–1900 masl had the lowest degree of variability (9.11%) whereas the ones collected at 719–1200 masl had the highest variability (10.76; Table 3).

Table 3.
Coefficient of variation for the number of primary leaf vein and leaf vein divergence.
3.4. Fruit Characteristics
The analysed mature unripe avocado fruits displayed 21 different fruit shapes, of which nine shapes are listed in the avocado descriptor guide. Figure 7 presents the twenty one avocado fruit shapes recorded. Data on the distribution of the nine most common fruit shapes encountered are reported in Figure 8. Distribution of the remaining 12 fruit shapes is grouped into the ‘other’ category.
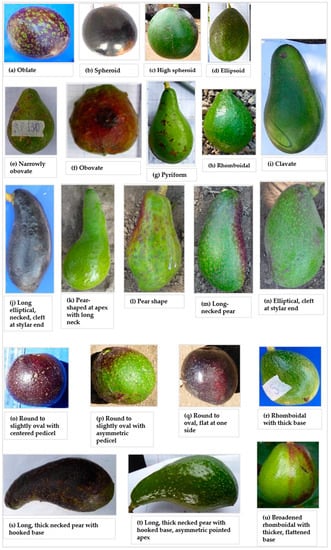
Figure 7.
Fruit shapes observed among the studied trees; (a–i) are listed in the descriptor guide, (j–u) are not listed in the descriptor guide.
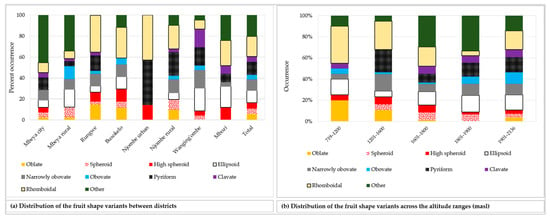
Figure 8.
Distribution of the nine most common fruit shapes among the sampled avocado trees, while the remaining 12 fruit shapes are categorised into ‘other’.
The rhomboidal was the most common individual fruit shape, as it accounted for about 19% of all samples (Figure 8a). Approximately 21% of all the trees had fruits with shapes not reported in the avocado field guide. While the Rungwe district harboured all nine avocado fruit shapes listed in the descriptors’ guide, the other districts lacked at least one shape each. Njombe urban district was unique, as only three avocado fruit shapes were identified; that is, high spheroid (14.3%), pyriform (42.9%) and rhomboidal (42.9%). The highest proportion for ellipsoid, narrowly obovate and clavate fruits were observed in the Wanging’ombe; 21.7, 17.4 and 17.4%, respectively. For the obovate and oblate fruits their highest proportions were observed in the Mbeya rural (12.2%) and Rungwe (14.7%). Due to the limited number of counts in some groups, Chi-square test at the district level was not applicable. However, a statistically significant association was detected between the fruit shapes and the regions (Х2 = 33.517, df = 18, p = 0.014). At almost all altitude ranges, the rhomboidal was the most frequent fruit shape but it was outnumbered by the ellipsoid at 1801–1900 masl (Figure 8b). The Chi-square test was not applicable because of limited number of counts in some groups. Fruits were characterised as having pedicels of cylindrical, conical, rounded, inverted conical, triangular prismatic or biconcave shapes (Figure 9a–f). While the conical pedicel was present in 64.1% of all samples, the rarest ones; that is, triangular prismatic and biconcave pedicels, each accounted for 0.5% of all the samples (Figure 9g). These rarest pedicel shapes were not listed in the avocado descriptor guide. In all districts and for all altitude ranges, the conical pedicel was the most frequent shape (Figure 9g–h).
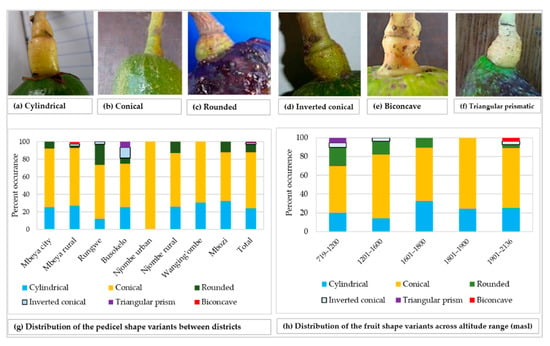
Figure 9.
Pedicel shape and its distribution among the studied trees.
The fruit peel showed diverse colour tones, of which black 203A was the most common and displayed by 19.3% of all the sampled fruits (Figure 10a). The peel from about 45% of the fruits was speckled and varied in colour composition and patterns. The peel thickness was ≤ 1 mm in 90.6% of all the sampled fruits, whereas only 0.5% had a peel that was 3 mm thick (Figure 10b). At least two variants of peel thickness were found in the majority of the districts, with the exception of Busokelo and Njombe urban districts where only ≤ 1 mm peel thickness was found. A peel thickness of ≤ 1 and 2 mm could be found in all altitude ranges whereas a thickness of 3 mm could only be found at 1601–1800 masl (Figure 10c). Flesh texture of the mature ripe fruits was either watery, buttery, pastose or granular with the most and least common variants being the buttery and the granular textures, which accounted for 58.3% and 1.4% of all samples, respectively (Figure 10d). All the districts had at least two variants of flesh texture, while the Njombe rural exclusively harboured all four flesh texture variants. Each category of altitude ranges possessed at least three flesh texture variants with the 719–1200 and 1601–1800 masl possessing all four variants (Figure 10e). Chi-square tests on the peel colour, thickness and flesh texture were not accomplished due to a limited number of counts in some groups.
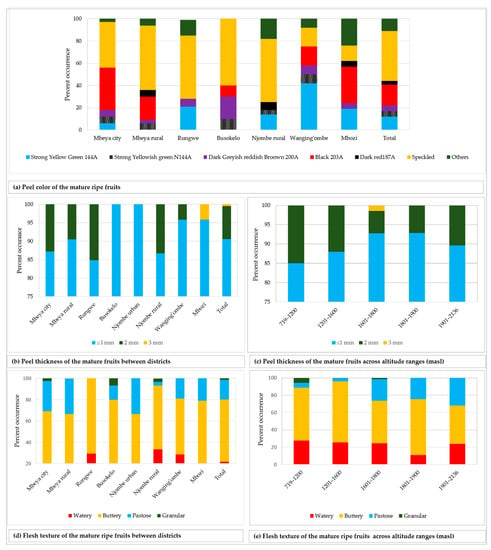
Figure 10.
Fruit peel colour, thickness and flesh texture among the studied trees.
3.5. Seed Characteristics
Seventeen seed shapes were found across sampled the trees. Figure 11 presents the seventeen seed shapes encountered and the distribution of the eight most common ones. The distribution of the remaining nine seed shapes are grouped into the ‘other’ category.
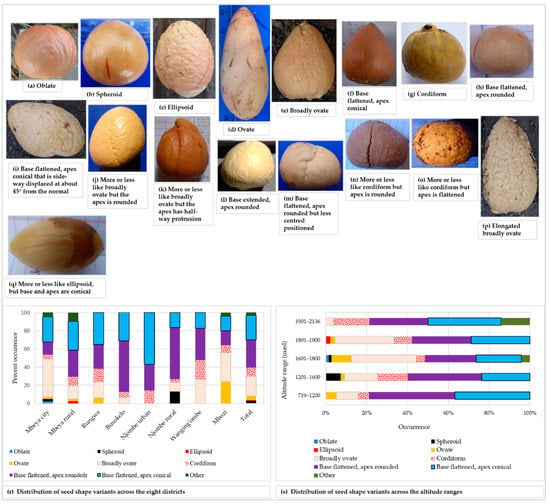
Figure 11.
Avocado seed shape among the sampled trees; shapes listed in the avocado field guide (a–h), shapes grouped into the ‘other’ category (i–q), distribution of the seed shape variants in districts (r) and altitude ranges (s).
The most common seed shapes were oblate, spheroid, ellipsoid, ovate, broadly ovate, cordiform, base flattened-apex rounded and base flattened-apex conical, all of which are listed in the avocado field guide (Figure 11a–h). Seed shapes not found in the avocado field guide are presented in Figure 11i–q. The base flattened-apex rounded seed shape was the most prevalent shape and it was present in 30.6% of all trees sampled. The rarest shapes were oblate (unique to Mbeya city) and ellipsoid (unique to Mbeya rural) each appeared in only 0.5% of all the trees (Figure 11r). Spheroid seeds were only reported in Mbeya city and Njombe rural districts. Ovate seeds were found in four districts, Mbeya city, Mbeya rural, Rungwe and Mbozi, with the highest abundance (24%) in Mbozi. Broadly ovate seeds were quite abundant (41.9%) in Mbeya city, however lacking in the Njombe urban district. Cordiform seeds were found in all districts, with the highest abundance (21.7%) in Wanging’ombe district. Also, the base flattened, apex rounded seed was found in all districts, as were the base flattened, apex conical seeds. The highest number of seed shapes listed in the field guide was found at 1601–1800, followed by 1801–1900 masl, which harboured 7 and 6 of the most common seed shapes, respectively (Figure 11s). The 1901–2136 masl altitude range displayed the lowest number of the most common seed shapes, that is, four shapes. Due to a limited number of counts in some groups, Chi-square tests were not applicable.
The surface of the seed cotyledon was either smooth, intermediate or rough, and each variant was found in approximately 30% of all the samples (Figure 12a–d). The smooth cotyledon surface was common in the Njombe rural district (51.6%), whereas the intermediate and rough cotyledon surfaces were most abundant in Mbeya city (41.9%) and Rungwe (55.9%), respectively. At 1601–1800 masl, the smooth cotyledon surface stood out with a value of 37.5% whereas the rough cotyledon was predominant at 1201–1600 (42.9%) and 1801–1900 masl (40%), (Figure 12e). The intermediate and rough cotyledons were most frequent at 719–1200 masl, both at a proportion of 40%.
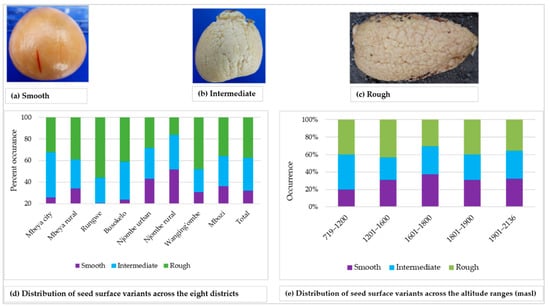
Figure 12.
Seed cotyledon surface and distribution of variants across the eight districts.
3.6. Principal Coordinate Analysis (PCoA) and Hierarchical Cluster Analysis
The PCoA on the avocado qualitative and quantitative morphological traits revealed extensive variation among the sampled trees at the district level, with no clear grouping of samples (Figure 13). The first three axes explained 18.39% of the total variation, corresponding to 7.98, 5.52 and 4.87% for the first, second and third axis, respectively.
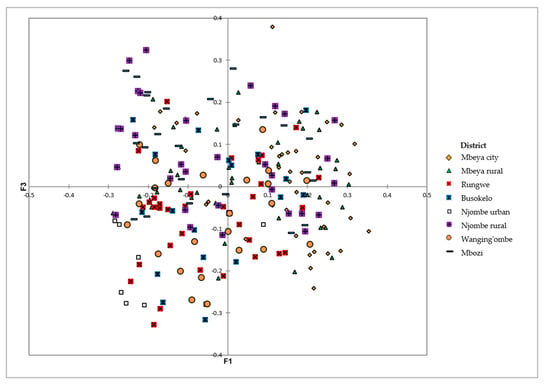
Figure 13.
PCoA showing the distribution of the 226 avocado trees from the eight districts on the first and third axes based on their dissimilarities.
The dendrogram ensuing from the neighbor–joining method sorted the 226 avocado samples originating from the eight districts into three major groups (A, B and C) with each group containing samples from at least six districts (Figure 14). The largest group was ‘C’ followed by ‘B’ each of them containing samples from all districts.
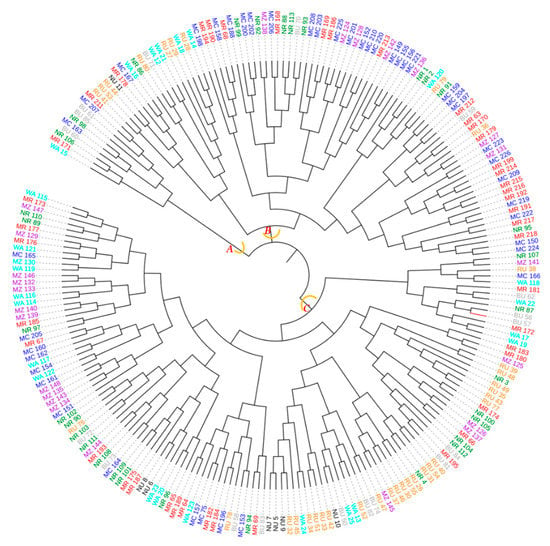
Figure 14.
Dendrogram computed based on the neighbor–joining algorithm using a dissimilarity matrix of the 226 avocado samples. Samples marked with the same colour were collected in the same district. The first two letters of the names stand for the districts (MC = Mbeya city, MR = Mbeya rural, RU = Rungwe, BU = Busokelo, NU = Njombe urban, NR = Njombe rural, WA = Wanging’ombe and MZ = Mbozi) and the digit(s) represent collecting number.
The dendrogram ensuing from the Wards method sorted the avocado populations into three groups at 0.198 Euclidian distance (Figure 15). Group 1 contained the Njombe rural, Mbeya city and Mbeya rural populations, whereas group 2 contained the Njombe urban, Busokelo, Mbozi and Rungwe populations. The Wanging’ombe population was clearly resolved into a distinct group.
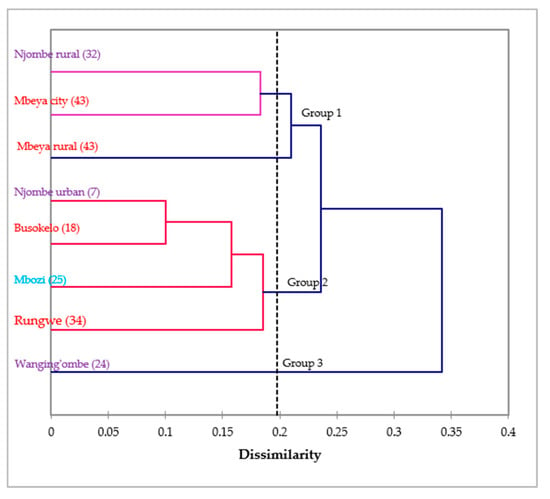
Figure 15.
Dendrogram of the eight avocado populations based on 14 morphological characteristics (in brackets are the number of individual trees studied). Populations marked with the same colour belong to the same region.
4. Discussion
The analysed avocado trees showed high diversity in the traits examined. Some of these traits, like fruit shape, peel colour of the ripe fruits and flesh texture, are of economic interest and can be used by farmers as selection criteria for future production, and by breeders for developing improved cultivars. According to Barrett et al. [21] fruit shape, size, gloss, and its external vibrant colour lure customers and stimulate impulse purchases. Upon eating the fruit, the texture, freshness, taste and other flavour attributes are critical to our eating pleasure [21]. At the point of purchase the consumer uses appearance factors to get an indication of freshness and flavour quality, though sometimes these factors can be misleading [21,22].
Smooth, rough and very rough trunk surfaces were recorded in all districts excluding Njombe urban district and Mbozi, where no trees showed a smooth surface (Figure 3). In the Mbozi district, this might be caused by accidental farmers’ selection in the past, whereas in the Njombe urban district the limited number of local avocado trees analysed might affect the result. Most of the local avocado varieties (seedlings), in Njombe urban, were already being replaced by the commercial cultivars, notably ‘Hass’ and ‘Fuerte’. Similarly, Ismadi and Hafifah [23] reported only rough and very rough trunk surfaces among 15 avocado accessions in the Central Aceh district of Indonesia. According to Bergh [5], the tree bark of the Guatemalan and Mexican avocado races are less rough, while those of the West Indian race are rougher.
Leaf shape is an important trait as it may express the extent of leaf area hence seasonal integral of light interception which can directly affect plant yield [24]. In the present study, the sampled avocado trees displayed extensive variation in leaf shape (Figure 5 and Figure 6a). Some of these shapes have been previously reported by Abraham et al. [4] and Nkansah et al. [24], who together described seven leaf shapes among avocado plants in Ghana. Ismadi and Hafifah [23] reported only lanceolate (73.33%) and oblong lanceolate (26.67) leaf shapes among 15 avocado accessions in Indonesia. The higher number of leaf shapes (11) found in the present study could be due to a larger sample size. Most of the trees analysed had hair on the underside of the leaves (pubescence), ranging from sparse to dense (Figure 6b). The dense pubescence was a predominant character in most districts with an occurrence of 72.1 (in Mbeya city) to 47.1% (in Busokelo). However, in Njombe urban district all trees show sparse pubescence, and in the Mbozi district approximately 60% of the trees have leaves with no pubescence. Ehleringer et al. [25] reported that the plant absorption of photosynthetic light can be reduced by the presence of leaf pubescence. The pubescense increases through the growing season, modifying the leaf energy balance and thus dramatically reducing the photosynthetic rate. Whereas the majority (71.7%) of the sampled trees had 16 to 20 primary leaf veins (Figure 6c), Abraham et al. [4] reported that the majority of Ghanaian avocado trees had 14 to 16 primary veins. A large number of primary leaf veins may improve movement of water, mineral salts and food through the xylem and phloem tissues [26]. Wolpert [27] reported that a large number of primary leaf veins in a small sized leaf safeguards the leaf from the effects of embolism—bubbles that form in the water tubes during drought—by delivering substitute routes for water passage around vein blockages.
Avocado fruit shape is a commercially important morphological character which appeals to consumers in the markets. Having great diversity in fruit shape offers a chance to interest diverse customers. In the present study, twenty one fruit shapes were recorded among the sampled trees (Figure 7). Most of these shapes have previously been reported among avocado cultivars of all three races (Table 4). The occurrence of these fruit shapes in the sampled trees points to the presence of genetic material from all three avocado races in Tanzania.

Table 4.
Recorded fruit shapes in this study which have been previously reported in avocado cultivars.
In the present study, the vast majority of mature fruits had thin fruit peels; that is, less than or equal to 1 mm thick (Figure 10b). In Busokelo and Njombe urban districts 100% of the trees had fruits with such thin peels. Popenoe [33] attributed thin avocado peel (≤ 1 mm) to Mexican and West Indian avocado races. Morton [3] reported thin avocado peel in the cultivars ‘Susan’, ‘Sharwil’, ‘Rincon’ and ‘Fuerte’, which are Guatemalan × Mexican hybrids. In the Rungwe district, 15.2% of the trees had fruits with thicker peels (2 mm) and in the Mbozi district 4.2% of the trees had fruits with 3 mm thick peel. The occurrence of a thicker peel in about 10% of all the sampled trees suggests the presence of genetic material from the Guatemalan race. Popenoe [33] described that most Guatemalan avocado cultivars have thick to very thick fruit peel, with the exception of ‘Taylor’. Thicker peel has also been observed in ‘Booth 1’, ‘Booth 7’ and ‘Booth 8’, cultivars which are Guatemalan × West Indian hybrids.
Analysis of ripe avocado fruits revealed four flesh textures; buttery (58.3%), watery (21.8%), pastose (18.5%) and granular (1.4%; Figure 10d). Buttery texture is of great economic value as it is preferred by most Tanzanian avocado consumers due to its taste. A high percentage of the local avocado growers in Tanzania have selected for buttery texture. Buttery flesh texture is generally described as specific to Mexican avocadoes, and some Guatemalan avocadoes [33]. Similarly, Crane et al. [34] highlighted that Mexican and Guatemalan avocado cultivars have moderate to high oil content, which might be associated to buttery and pastose flesh textures. Morton [3] has also reported buttery flesh texture in ‘Rincon’, which is a Guatemalan × Mexican hybrid. While the occurrence of Buttery and pastose flesh textures, in the present study, points to the presence of Mexican and Guatemalan avocadoes, the occurrence of watery flesh texture points to the existence of avocados of West Indian origin. Interestingly, some farmers involved in this study reported that some avocado trees produced fruits with buttery flesh texture in dry seasons and watery texture in rainy seasons. This suggests that apart from being genetically determined, flesh texture might be affected by environmental factors.
A great diversity in seed shape and cotyledon surface was noted (Figure 11). Among the seed shapes observed were spheroid, broadly ovate and base-flattened, apex-conical. Popenoe [33] observed spheroid seeds in some Guatemalan race cultivars, obovate (broadly ovate) seeds in some West Indian avocadoes and oblong-conic (base-flattened, apex conical) in some Mexican race cultivars. Occurrence of these seed shapes in the present study points to the presence of all three avocado races in Tanzania. All three variants of cotyledon surfaces were observed in all eight districts, however at varying proportions (Figure 12). Bergh [5] ascribed the rough cotyledon to the West Indian race and the smooth cotyledon to the Guatemalan and West Indian races, leading to the assumption that all three avocado races are present in Tanzania.
The PCoA biplot showed no clear grouping of the avocado trees on the basis of geographic location (Figure 13). There was a high level of variation within the districts, which obscured the variation that exists between them. These local avocados were propagated through sexual reproduction which could have contributed to the high diversity observed.
No clear grouping of avocado populations could be distinguished based on regions from the dendrogram presented in Figure 15. All three populations from Njombe region (Njombe rural, Njombe urban and Wanging’ombe populations) were resolved in distinct groups. Likewise, the Mbeya city and Mbeya rural populations were separated from Busokelo and Rungwe, all of them belonging to the Mbeya region. This shows that avocado populations from the same region differ considerably in their morphological traits, indicating high diversity. Furthermore, some avocado populations from different regions appeared to cluster together. For example, in group 1, the Njombe rural and Mbeya city populations clustered together while they belong to distinct regions. Similar case was observed for the Njombe urban and Busokelo populations in group 2. The grouping of avocado populations from different regions suggests a genetic admixture which might be caused by exchange of seeds between these areas. Farmers at different places tend to exchange seeds with friends and relatives. Also, avocado fruits from one district or region can be traded to another district or region where their seeds might be planted.
The present study confirmed the usefulness of morphological markers in detecting diversity among avocado genotypes as previously revealed by Abraham et al. [4] and Nkansah et al. [24]. The characteristics displayed by the analysed avocado trees suggest that the germplasm grown in Tanzania belongs to all three botanical groups; that is, the Mexican, Guatemalan and West Indian races. This assumption is also supported by the range in altitude of the tree collecting sites (719–2136 masl), as the different races are adapted to different altitudes [5]. The variation in morphological features observed in the present study is an indication of the diversity and adaptation of the avocado crop to different locations in Tanzania with varying topography, altitudes, soils and climate. Since a large proportion of avocado growers in Tanzania only use seeds for propagation, a high level of genetic diversity is maintained within this genepool.
5. Conclusions
The Mexican, Guatemalan and West Indian avocado races seem to be present in Tanzania. Differences in morphological traits observed among avocado trees suggest a high diversity, which could be used by breeders for development of new cultivars. The lack of clear grouping of samples in relation to their districts of origin indicate exchange of seeds between districts. The scarcity of seedling-propagated avocado trees encountered in the Njombe urban district, which was formerly renowned for being rich in avocado seedlings, points to a narrowing of the genetic base (i.e., genetic erosion) of this crop in this region. This in turn suggests the need to conserve local avocado varieties that are in danger of being replaced by commercial cultivars for international trade.
Author Contributions
Conceptualization, I.J., A.N., M.F. and R.O.O.; methodology, I.J., A.N., H.P.H, M.G. and R.O.O.; data collection, I.J.; data analysis, I.J. under guidance of M.G. and R.O.O.; resources, A.N. and R.O.O.; writing—original draft preparation, I.J.; writing—review and editing, A.N., H.P.H., M.F., M.G., A.S.C. and R.O.; supervision, A.N., H.P.H., M.F., M.G., A.S.C. and R.O.O.; project administration, R.O.O.; funding acquisition, R.O.O. All authors have read and agreed to the published version of the manuscript.
Funding
This research was funded by Swedish International Development Cooperation Agency (Sida), grant number SIDA-Tz-UDSM-2015 and The APC was funded by the same agency, Sida.
Acknowledgments
The authors thank Jan-Erik Englund and Adam Flöhr (Swedish University of Agricultural Sciences, SLU) for assisting with statistical analyses.
Conflicts of Interest
The authors declare no conflict of interest.
References
- Dreher, M.L.; Davenport, A.J. Hass avocado composition and potential health effects. Crit. Rev. Food Sci. Nutr. 2013, 53, 738–750. [Google Scholar] [CrossRef] [PubMed]
- Paz-Vega, R. Avocado production, marketing and consumption: A global perspective. In Plenary Talks, Proceedings of the VIII World Avocado Congress, Lima, Peru, September 2015. Available online: http://www.avocadosource.com/WAC8/Section_01/Section_01_Abstracts_English.pdf (accessed on 16 September 2019).
- Morton, J. Avocado. In Fruits of Warm Climates; Julia F. Morton: Miami, FL, USA, 1987; pp. 91–102. [Google Scholar]
- Abraham, J.D.; Abraham, J.; Takrama, J.F. Morphological characteristics of avocado (Persea americana Mill.) in Ghana. Afr. J. Plant Sci. 2018, 12, 88–97. [Google Scholar] [CrossRef]
- Bergh, B. The origin, nature, and genetic improvement of the avocado. The biennial conference of the Australian Avocado Growers’ Federation, Gold Coast, Australia, 28th September–October, 1992. Calif. Avocado Soc. Yearb. 1992, 76, 61–75. [Google Scholar]
- Ashworth, V.E.; Chen, H.; Clegg, M.T. Persea. In Wild Crop Relatives: Genomic and Breeding Resources Tropical and Subtropical Fruits; Kole, C., Ed.; Springer: Berlin-Heidelberg, Germany, 2011; pp. 173–189. [Google Scholar]
- Storey, W.B.; Bergh, B.O.; Zentmyer, G.A. The origin, indigenous range, and dissemination of the avocado. Calif. Avocado Soc. Yearb. 1986, 70, 127–133. [Google Scholar]
- Popenoe, W. The avocado (pp. 305–310). In Central American Fruit Culture; Ceiba: Tegucigalpa, Honduras, 1952; pp. 269–367. [Google Scholar]
- Purseglove, J.W. Tropical Crops, Dicotyledons; Wiley: New York, NY, USA, 1968; pp. 192–198. [Google Scholar]
- Ghosh, S.P. Avocado production in India. In Avocado Production in Asia and the Pacific; FAO/RAP Publication: Bangkok, Thailand, 2000; pp. 24–30. [Google Scholar]
- Mwakalinga, H.A. A Report on Avocado Value Chain Mapping in Siha and Njombe Districts. 2014. Available online: https://info.undp.org/docs/pdc/Documents/TZA/Report%20-%20Final%20Report%20Avocado%20July%2025%202014.pdf (accessed on 22 August 2018).
- International Plant Genetic Resources Institute (IPGRI). Descriptors for Avocado (Persea spp.); International Plant Genetic Resources Institute: Rome, Italy, 1995; p. 52. [Google Scholar]
- Royal Horticultural Society. RHS Large Colour Chart, 6th ed.; Royal Horticultural Society: London, UK, 2015. [Google Scholar]
- Addinsoft. The XLSTAT-Base Solution, Essential Data Analysis Tools for Excel, Boston, USA, 2018. Available online: https://www.xlstat.com/en/solutions/base (accessed on 16 September 2019).
- Minitab Statistical Software [Computer Software], Version 18.1; Minitab Inc.: State College, PA, USA, 2017.
- Rdocumentation. Daisy. Available online: https://www.rdocumentation.org/packages/cluster/versions/2.1.0/topics/daisy (accessed on 16 September 2019).
- Boc, A.; Diallo, A.B.; Makarenkov, V. T-REX: A web server for inferring, validating and visualizing phylogenetic trees and networks. Nucleic Acids Res. 2012, 40, W573–W579. [Google Scholar] [CrossRef] [PubMed]
- Saitou, N.; Nei, M. The neighbor-joining method: A new method for reconstructing phylogenetic trees. Mol. Biol. Evol. 1987, 4, 406–425. [Google Scholar] [CrossRef] [PubMed]
- Letunic, I.; Bork, P. Interactive Tree of Life (iTOL) v4: Recent updates and new developments. Nucleic Acids Res. 2019, 47, W256–W259. [Google Scholar] [CrossRef] [PubMed]
- Ward, J.H. Hierarchical Grouping to Optimize an Objective Function. J. Amer. Statist. Assoc. 1963, 58, 236–244. [Google Scholar] [CrossRef]
- Barrett, D.M.; Beaulieu, J.C.; Shewfelt, R. Color, Flavor, Texture, and Nutritional Quality of Fresh-Cut Fruits and Vegetables: Desirable Levels, Instrumental and Sensory Measurement, and the Effects of Processing. Crit. Rev. Food Sci. Nutr. 2010, 50, 369–389. [Google Scholar] [CrossRef] [PubMed]
- Shewfelt, R.L. ‘Fruit and vegetable quality’. In Fruit and Vegetable Quality: An Integrated View; Shewfelt, R.L., Bruckner, B., Eds.; CRC Press: Lancaster, PA, USA, 2000; pp. 144–157. [Google Scholar] [CrossRef]
- Ismadi, R.S.H.; Hafifah, I.F. Exploration and morphological characterization of vegetative part of avocado at Bebesan subdistrict central Aceh district, Indonesia. In Proceedings of MICoMS 2017 (Emerald Reach Proceedings Series, Vol. 1); Emerald Publishing Limited: Bingley, UK; pp. 69–73. [CrossRef]
- Nkansah, G.O.; Ofosu-Budu, K.G.; Ayarna, A.W. Genetic diversity among local and introduced avocado germplasm based on morpho-agronomic traits. Int. J. Plant Breed Genet. 2013, 7, 76–91. [Google Scholar] [CrossRef][Green Version]
- Ehleringer, J.; Björkman, O.; Mooney, H.A. Leaf Pubescence: Effects on Absorptance and Photosynthesis in a Desert Shrub. Science 1976, 192, 376–377. [Google Scholar] [CrossRef] [PubMed]
- Answers. What are the Advantages of Having a Network of Vein in a Leaf? 2013. Available online: https://www.answers.com/Q/What_are_the_advantages_of_having_a_network_of_vein_in_a_leaf (accessed on 12 January 2020).
- Wolpert, S. Being Small Has Its Advantages, If You Are A Leaf. 2011. Available online: https://phys.org/news/2011-07-small-advantages-leaf.html (accessed on 12 January 2020).
- UCAVO. Avocado Varieties, Variety List. Undated. Available online: http://www.ucavo.ucr.edu/AvocadoVarieties/VarietyFrame.html#Anchor-47857 (accessed on 15 March 2019).
- Florida Department of Agriculture and Consumer Services. Florida Avocado Varieties. Undated. Available online: https://www.ams.usda.gov/sites/default/files/media/FloridaAvocadoVarieties.pdf (accessed on 15 March 2019).
- Avocadosource. Variety Database Search Results for Russell. Undated. Available online: http://www.avocadosource.com/AvocadoVarieties/QueryDB.asp (accessed on 8 March 2019).
- Lahav, E.; Gazit, S. World listing of avocado cultivars according to flowering type. Fruits 1994, 49, 299–313. [Google Scholar]
- TFNet. Avocado – Common Varieties. International Tropical Fruits Network. 2016. Available online: http://www.itfnet.org/v1/2016/05/avocado-common-varities/ (accessed on 8 March 2019).
- Popenoe, W. Manual of Tropical and Subtropical Fruits; Hafner Press: New York, NY, USA, 1974. [Google Scholar]
- Crane, J.H.; Balerdi, C.F.; Maguire, I. Avocado Growing in the Florida Home Landscape. University of Florida, 2016. Available online: https://edis.ifas.ufl.edu/mg213 (accessed on 16 September 2019).
© 2020 by the authors. Licensee MDPI, Basel, Switzerland. This article is an open access article distributed under the terms and conditions of the Creative Commons Attribution (CC BY) license (http://creativecommons.org/licenses/by/4.0/).