Communication

Transferability of Microsatellite Markers Developed in Oenothera spp. to the Invasive Species Oenothera drummondii Hook. (Onagraceae)

by
Raquel Hernández-Espinosa
1,
Jorge González-Astorga
1,*,
Alejandro Espinosa de los Monteros
1,
Dánae Cabrera-Toledo
2 and
Juan B. Gallego-Fernández
3
1
Red de Biología Evolutiva, Instituto de Ecología A. C. Carretera Antigua a Coatepec No. 351, El Haya, Xalapa 91073, Veracruz, Mexico
2
Instituto de Botánica, Departamento de Botánica y Zoología, Centro Universitario de Ciencias Biológicas y Agropecuarias, Universidad de Guadalajara, Zapopan 44600, Mexico
3
Departamento de Biología Vegetal y Ecología, Universidad de Sevilla, 41012 Sevilla, Spain
*
Author to whom correspondence should be addressed.
Diversity 2020, 12(10), 387; https://doi.org/10.3390/d12100387
Submission received: 31 August 2020 / Revised: 2 October 2020 / Accepted: 6 October 2020 / Published: 8 October 2020

Abstract

:
Oenothera drummondii Hook. (Onagraceae) has life-history traits that make it an invasive species. Native populations are distributed along the coastal dunes from North Carolina in the United States to Tabasco in the Gulf of Mexico. It has been reported as an invasive species in Spain, Israel, and China, where this species can successfully colonize and dominate if the environmental conditions are appropriate. In South Africa, Australia, New Zealand, and France, it is reported to be naturalized. In this study, 28 microsatellite markers developed for other Oenothera species were evaluated for cross-amplification in O. drummondii. Nine primers showed consistent amplification and were polymorphic. Polymorphism was assessed in three populations from both native and invaded areas. Results indicated generalized low genetic variability. Three loci showed significant deviations from the Hardy Weinberg equilibrium, associated with null alleles’ presence. The observed heterozygosity and inbreeding coefficient reflected a generalized excess of homozygotes, particularly in the invaded population “El Dique”, likely due to allele fixation. High genetic differentiation was found between the three populations. These results highlight the accuracy of these markers for future population genetic studies in O. drummondii.

1. Introduction

Oenothera drummondii Hook. is a perennial, short-lived herb from the plant family Onagraceae [1]. Like its congeners, this species possesses traits that are considered to be advantageous for colonization i.e., life form, high seed production, successful spread capacity, short juvenile period, self-compatibility, high tolerance to different environmental conditions, and high flowering capacity for almost the entire year [2,3], suggesting its potential to be an invasive species. O. drummondii originates from North America and has two subspecies [4,5]. O. drummondii subsp. drummondii is a large-flowered and self-compatible subspecies distributed along the Gulf of Mexico’s coastal dunes, from North Carolina in the USA to Tabasco in Mexico, and O. drummondii subsp. thalassaphila is the rare and self-compatible subspecies found on the Pacific coast of the Baja California peninsula in Mexico [6]. This species has been documented as invasive in Spain [7,8], China [9], and Israel [10]. It is reported as naturalized in New Zealand [11], Australia [12], and South Africa [2]. The criteria to explain why this species is invasive in some countries, but not in others, are not clear. A recent study evaluating seed dispersal modes in Oenothera drummondii suggests that while for some naturalized areas, such as Australia, the species expansion was a natural dispersion process after the first arrival, in the invaded ones, like Spain, O. drummondii acquires its invader behavior when animals disperse the seeds. In Spain’s SW, the Iberian hare and the European rabbit are the dispersers in invading populations [13].
Although O. drummondii is usually dispersed by barochory, its seeds can be spread by thalassochory and endozoochory, with the latter mode of dispersal triggering the invasion process in naturalized populations [13]. In invaded areas, O. drummondii individuals can adapt to survive in coastal dunes and littoral areas with subtropical and Mediterranean weather, exhibiting increased root growth and photosynthetic rate and superior water performance than some native species, such as Achillea maritima L. [14]. Additionally, contrary to what happens in native areas, when invasive, this species forms dense aggregates that can reach 10–12 adult individuals per square meter, with higher densities in semi-stabilized dunes than active dunes or beaches [7,15]. In interior dunes, where the environmental conditions are stable, O. drummondii can successfully colonize, establish, and become dominant [15]. This invasion’s impact is well documented [7,8,15], as are eradication actions [16]. Additionally, O. drummondii has physiological features that enhance its’ photochemical efficiency, influencing its’ invasive capacity on Spanish coasts; the gas exchange and leaf water potential of O. drummondii were compared to a native species in the Iberian Peninsula, determining that the non-native species had a higher capacity to capture and use CO2 and water [14].
Invasion and colonization processes facilitate adaptive changes that allow the foreign species’ survival in new environmental conditions [17,18]. Introduced plants become invasive if their reproductive systems enable the establishment and maintenance of populations in new areas. There is an enormous diversity of reproductive modes in plants, potentially influencing their demography and genetics [17]. In this sense, the reproductive system is an essential life-history trait in invasive plants, particularly in self-compatible and monoecious species by strict self-fertilization or geitonogamy [19]. Evidence shows that good invaders can establish in the absence of natural pollinators due to pollination by wind, self-pollination, apomixis, or, in some cases, by mutualistic pollination relationships with local animals [20].
Additionally, rapid colonization allows for the spread of genetic diversity to new sites through the founder effect [21]. It refers to the migration of a sub-sample of the original population to a new area that carries only a fraction of the original genetic diversity [22], resulting in a founder population with less genetic diversity than the source population. This phenomenon is accentuated by the effect of endogamy, genetic drift, and bottlenecks [23]. A reduction in genetic diversity could reduce a species’ evolutionary potential and reproductive capacity [21,24]. However, many species with reduced genetic diversity become successful invaders [25]. Several studies show that diversity and genetic structure can change between native and invasive populations during the invasion event [26,27,28,29,30]. Although the obtained results do not follow a clear pattern, it has been suggested that higher genetic diversity is not necessarily related to the invader’s success [31]. Even if understanding the evolutionary and ecological processes underlying the invader’s invasion success can be challenging, knowing the genetic diversity and genetic variation structure can help us detect the possible origin and whether multiple introductions are probable or not in populations of O. drummondii. The insight into sources and pathways of expansion provides baseline data that can be used alongside other biological features to assess their influence in this species’ invasion success.
Molecular markers have been used for obtaining basic genetic information (e.g., genotypes), or for identifying genetic changes (e.g., reduced genetic diversity) that are characteristics of invasive species [32,33,34]. Microsatellites (SSRs) and single nucleotide polymorphisms (SNPs) are most commonly used to genotype plants [35]. Both types of markers are highly informative and reliable. However, an individual SSR tends to be more informative and polymorphic than an individual SNP [36], can reveal a hidden genetic structure by accumulating a higher quantity of private alleles per population [37,38], and are potentially the most informative molecular marker with the advantage of easy and low-cost detection by PCR-based methods [39,40]. Moreover, microsatellites can be transferred to related species [41], reducing the time and cost of developing species-specific primers that allow for the detection of variation in wild species [42,43].
In this study, we tested the transferability of 28 microsatellite markers developed for other species of the Oenothera genus to the invasive O. drummondii, aiming to identify useful markers to detect genetic variation at intra and inter-populational levels. Identifying useful markers will allow us to analyze further the species’ genetic diversity and structure throughout its native and invasive distributional ranges. O. drummondii seems to have dynamic ecological and demographic processes, i.e., high reproductive and growth rates, strong spread capacity, and the ability to colonize and establish in new areas. The founder effect that emerges from these dynamics establishes different genetic variation levels between founding and source populations. Therefore, one might expect the genetic variation and genetic structure of the three studied populations to show signs of a founder effect, reflected in (a) lower genetic diversity in the invasive population and (b) strong genetic structure, where the invasive population is the most genetically different.

2. Materials and Methods
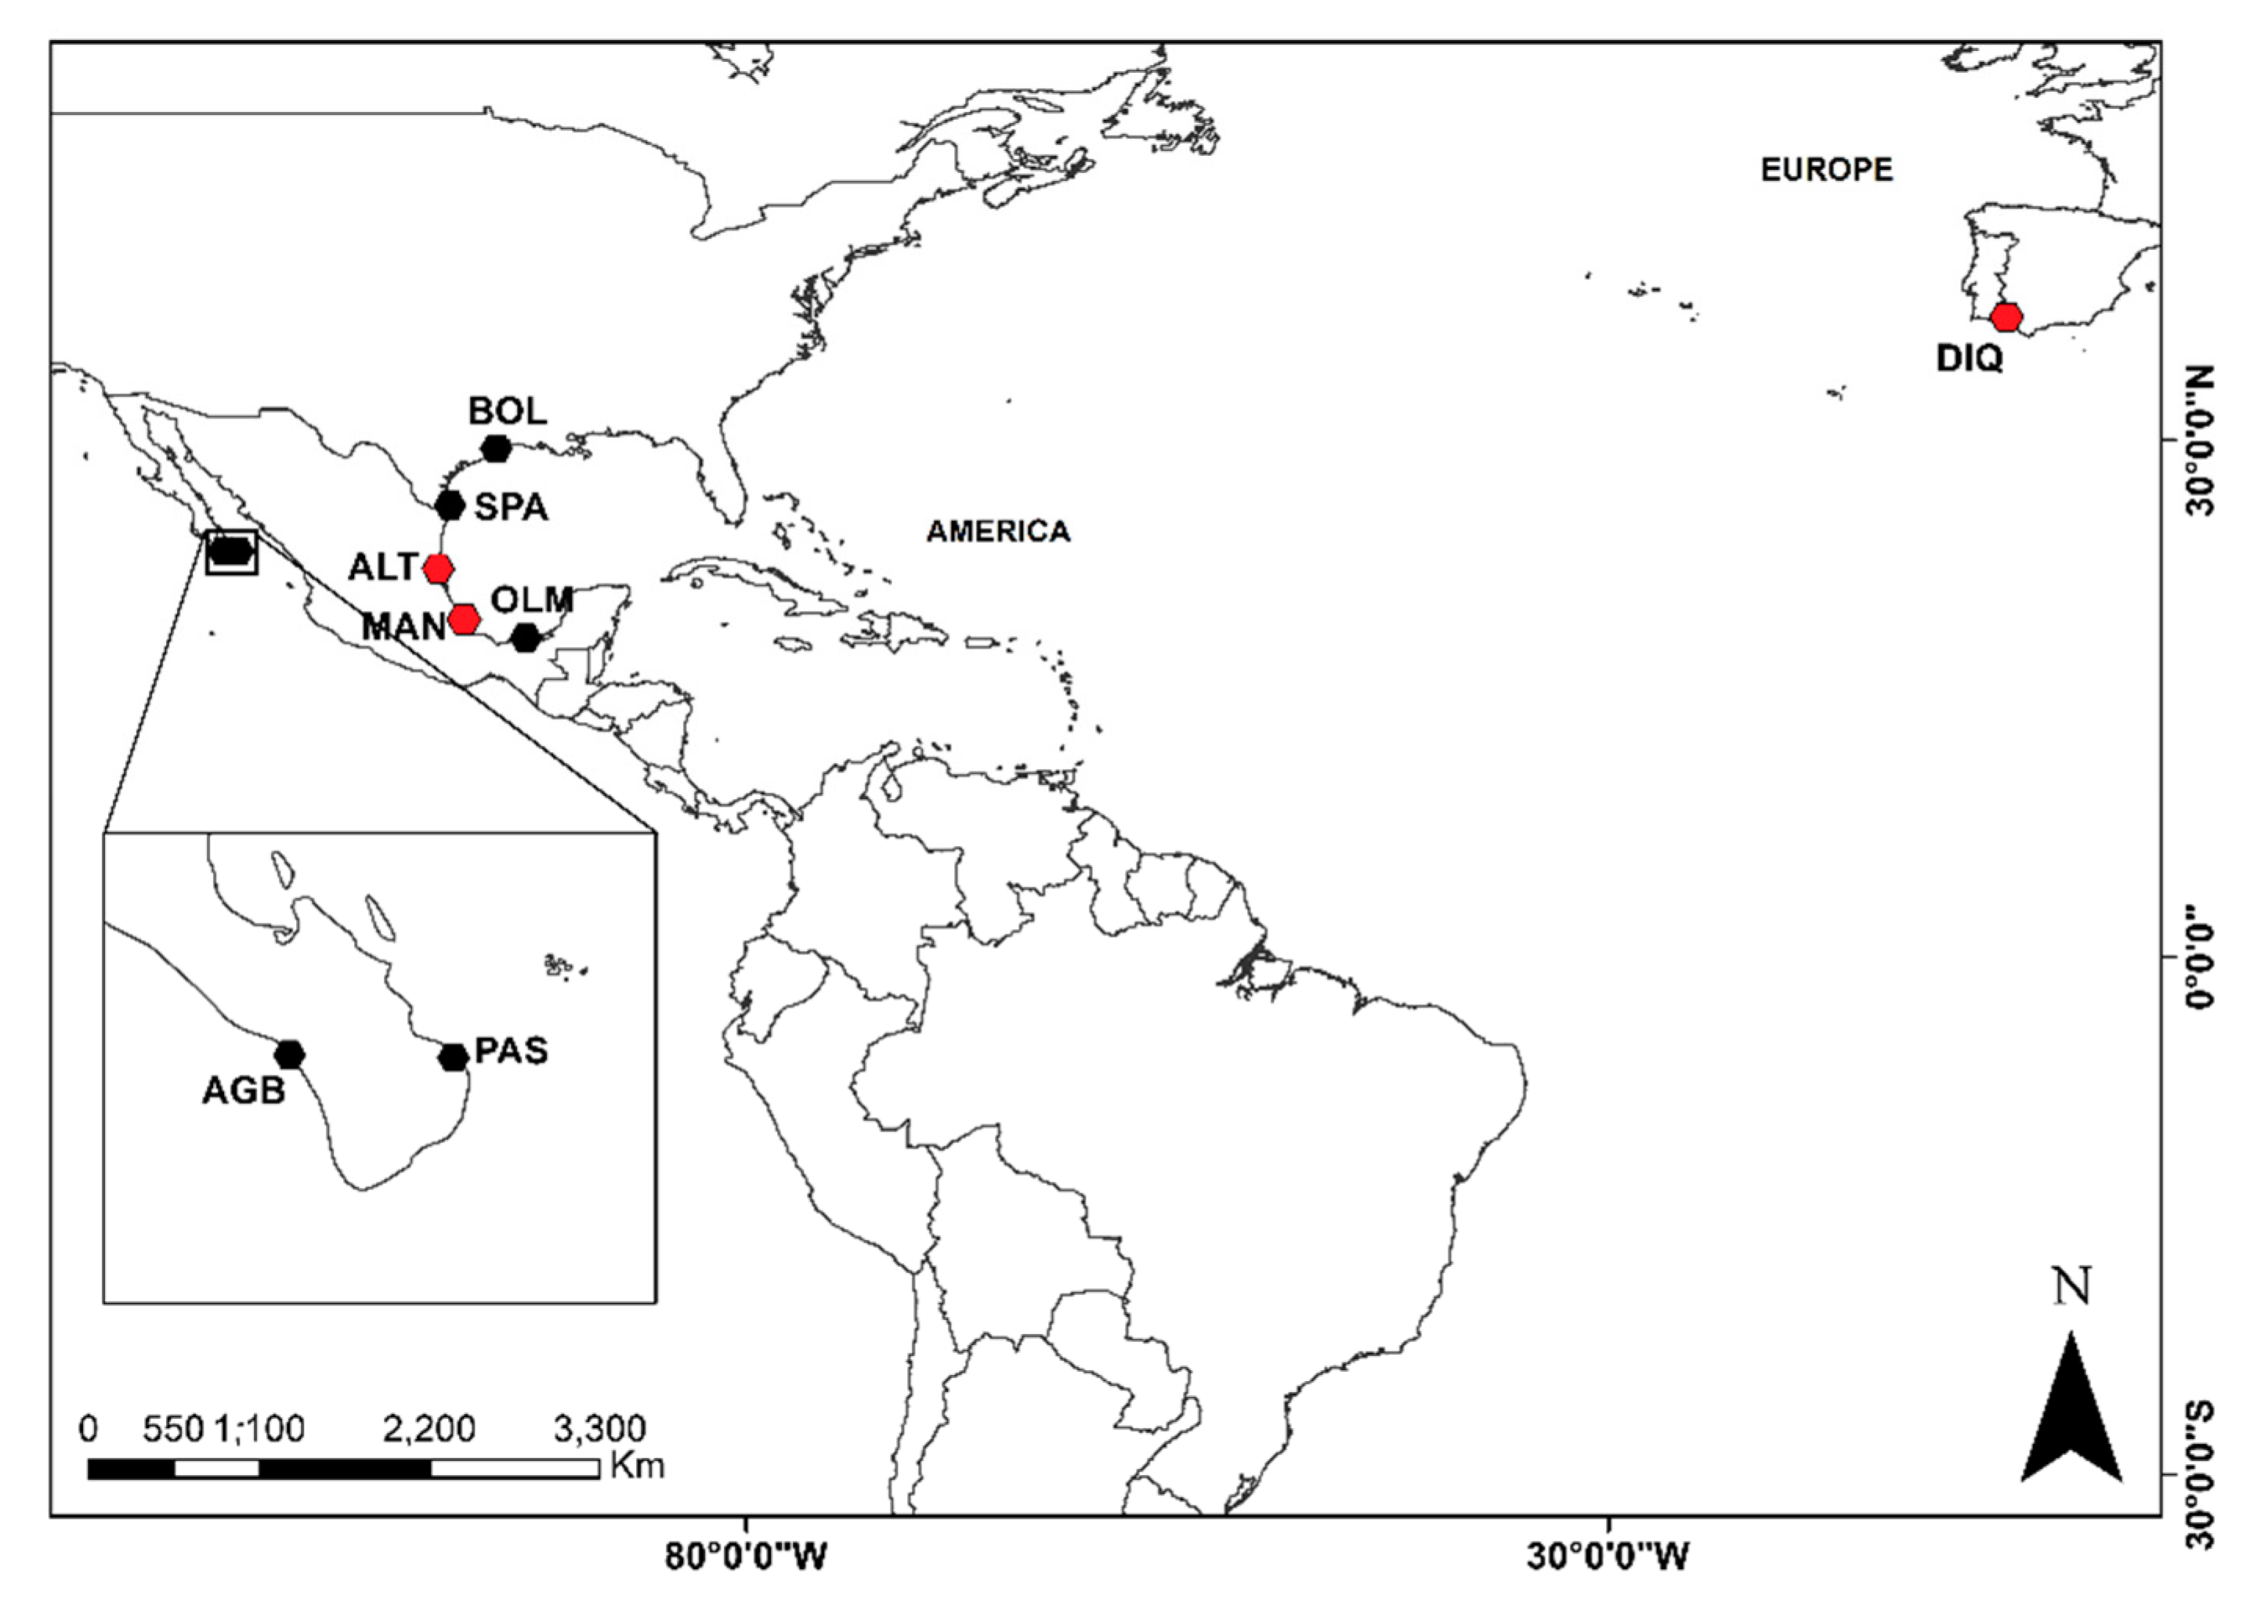
2.1. Sampling

Initially, SSR markers were screened using three randomly selected individuals of eight populations, spanning native and invaded areas of Oenothera drummondii (Figure 1). Seven native populations were used, including five geographically separated along the Gulf of Mexico of subsp. drummondii: Bolivar (BOL), South Padre Island (SPA), Altamira (ALT), La Mancha (MAN), and Olmeca (OLM), and two populations located in the Baja California peninsula of subsp. thalassaphila: Agua Blanca (AGB) and Punta Arena del Sur (PAS). The invasive population collected was El Dique (DIQ) (Table 1).
In the second stage of analysis, we selected three populations for further characterization. The populations chosen represent native and invasive areas of Oenothera drummondii. Altamira (ALT) and La Mancha (MAN) are native populations with nearly 350 km between them. These populations are restricted to small areas, with no more than 50 individuals, as seen in most native populations of the species [44]. The invasive population El Dique (DIQ) is the largest population, encompassing over three million individuals and densities that can reach 10–12 adult individuals per square meter [15]. For each population, we randomly sampled 20 individuals in plots of 1 ha. The sampled individuals kept a distance of at least 1 m between each other.

2.2. DNA Extraction and Vegetative Material

Leaf tissue was collected from each mature specimen with flowers and fruits, preserved in paper envelopes with silica gel as a desiccant, and stored at −20 °C until use. Genomic DNA extraction was made using 50 mg of dry tissue, following a modified cetylmethyl-ammonium bromide (CTAB) method (S1) [45]. The amount and quality of the extracted DNA were verified using a GeneRulerTM 1 kb DNA ladder (ThermoFisher Scientific, Waltham, MA, USA) and GelRed® dye (Biotium, Fremont, CA, USA) [46] for staining 1% agarose gels.

2.3. Primer Selection

We tested a combination of plastid and nuclear microsatellite loci and screened 28 published markers (nuclear: Oenbi2diA_C10, Oenbi2diA_E9, Oenbi2triA_A1, Oenbi2triA_A5, Oenbi2triA_C6, Oenbi2triA_D3, Oenbi2triA_E4, Oenbi2triA_F5, Oenbi2triA_H1, Oenbi2triA_H2, Oenbi39tri10, OenhaB105, OenhaC4, OenhaC105, OenhaC106, OenhaC126, OenhaD2, OenhaD5, OenhaD102, OenhaD111, OenhaD118, Oenbi2tri2, Oenbi39di2, Oenbi39tri4, plastid: OenelCp3, OenelCp5, OenelCp11, OenelCp12) [47,48,49]. Ten markers were designed for Oenothera harringtonii W.L. Wagner, Stockh. and W.M. Klein., 14 for Oenothera biennis L., and four corresponded to plastid microsatellites developed for Oenothera elata Kunth.
In the initial stage of experiments, we used 24 individuals from eight populations (three individuals each). From the 28 primer pairs tested, five did not amplify. Twenty-one primers with single bands and close to expected size products were selected for further characterization. The amplified products of the 504 reactions were sequenced to ensure that the fragments amplified were those anticipated and to verify polymorphism. The forty-eight sequenced products from two primer pairs were difficult to read, so these two markers were discarded. In the remaining 19 markers, the repeated motif was confirmed in the sequence, as product size and variation alone are not always enough to predict SSR presence. After alignment and analysis of the sequences, populational variation was confirmed in 12 nuclear markers.
In a second stage, from the 12 polymorphic markers, three had allelic peaks that were difficult to interpret, so they were not used in subsequent analyses. Nine markers were identified as polymorphic and reliable (Table 2), and later characterized in 60 individuals from three populations: two natives (Altamira (ALT) and La Mancha (MAN) from Mexico) and one invasive (El Dique (DIQ) from Spain).

2.4. Microsatellite Amplification

To visualize samples, each forward primer was modified with the addition of an M13 sequence to the 5′ end (5′-TGT AAA ACG ACG GCC AGT-3′) complementary to the M13 primer labeled with a fluorescent dye [50]. An initial PCR was conducted in a 20 μL reaction containing 2X reaction buffer, 2 μM of each dNTP, 1.6 mM MgCl2, 10 μM of each forward and reverse primer, 0.025 U/μL TaqDNA polymerase (Promega), and 20 ng of genomic DNA. This PCR was run for 3 min at 94 °C, then 35 cycles of 94 °C for 40 s, 47 °C for 40 s, and 72 °C for 1 min; and a final extension of 72 °C for 10 min. The reaction product was fluorescently labeled through a second PCR using a 30 μL reaction containing 1.2 μL of the first reaction PCR product that was purified (QIAquick PCR purification Kit (250) QIAGEN) and the same concentrations for the reaction buffer, dNTPs, MgCl2, and TaqDNA polymerase used in the first PCR reaction. In the second reaction, three primers were used, 10 μM of M13 primer labeled with HEX (green) dye, 2.5 μM of M13 added forward primer, and 10 μM of reverse primer with no modifications. This technique allows for generating a fluorescent product, reducing the costs of using a labeled forward primer for each locus [51,52,53]. The PCR conditions for this reaction were 3 min at 94 °C; followed by 30 cycles of 94 °C for 40 s, 47 °C for 40 s, and 72 °C for 1 min; adding an extra step of eight cycles of 94 °C for 60 s, 53 °C for 60 s, and 72 °C for 60 s where the hybridization of the M13 primer occurs; and a final extension of 72 °C for 10 min. The resulting PCR products were scored and analyzed using a 350 bp standard on an ABI 3730 genetic analysis system (Macrogen ©, Geumcheon-gu, Seoul, Korea). Allele sizes were determined in GeneMapper v.4.1. software (Applied Biosystems ©, Waltham, MA, USA).

2.5. Data Analysis

Initially, to confirm intra-populational variation in the eight populations screened (Table 1), we did an exploratory molecular variance analysis (AMOVA), using the sequences of 24 individuals and the nine polymorphic microsatellite markers identified (OenhaB105, OenhaD102, Oenbi2diA_C10, Oenbi2triA_A1, Oenbi2triA_D3, Oenbi39tri10, Oenbi2triA_F5, Oenbi2triA_H1, and Oenbi39tri4). The AMOVA was done in Arlequin v.3.5, using 10,000 permutations.
From the initial eight populations tested, we chose three for full microsatellite characterization. In each of the three populations selected (Altamira (ALT), La Mancha (MAN), and El Dique (DIQ)), the presence of null alleles, possible stuttering, and dropout alleles at each locus were determined using an exact test in MicroChecker v.2.2.3 [54]. Standard parameters were used to describe genetic diversity in the three populations. These parameters included the percentage of polymorphic loci, mean number of alleles per locus, number of private alleles, and observed (Ho) and expected (He) heterozygosity [55], using GenAIEx v.6.5. [56]. We used Arlequin v.3.5. [57] to calculate the deviation from Hardy Weinberg equilibrium and linkage disequilibrium. Additionally, Arlequin v.3.5. was used to perform an AMOVA analysis using the corrected FST index [58] and Markov chains (10,000 iterations) to estimate the differentiation between populations, as well as the fixation index, FIS, which allows for the verification of local inbreeding [59]. Kruskal Wallis tests were used to determine whether the assessed genetic diversity parameters have significant differences between the three characterized populations using the stats package version 3.6.3 in R version 3.6.3 [60]. Finally, a discriminant analysis of principal components (DAPC) (adegenet package version 2.1.3 in R version 3.6.3 [60]) was executed to visualize the genetic structure. DAPC retains the virtues of discriminant analysis, defining a model in which genetic variation components are maximized among groups and minimized within them. The DAPC is supported by a transformation using a principal component analysis (PCA) as a first step, guaranteeing that the subjected variables are not correlated and are lower in number than those of the individual analyses [61].

3. Results

3.1. Microsatellite Transferability

From the 28 primer pairs tested, nine were polymorphic and reliable (Table 2). From those, seven were developed for O. biennis and two for O. harringtonii. The transferability percentage in this study was 75%, and the polymorphism percentage was 32.1%.
For the nine polymorphic markers, an exploratory AMOVA confirmed microsatellite variation between sequences of eight populations of Oenothera drummondii. We found the highest percentage of variation within the populations (60.4%), and moderate genetic differentiation (39.6%).

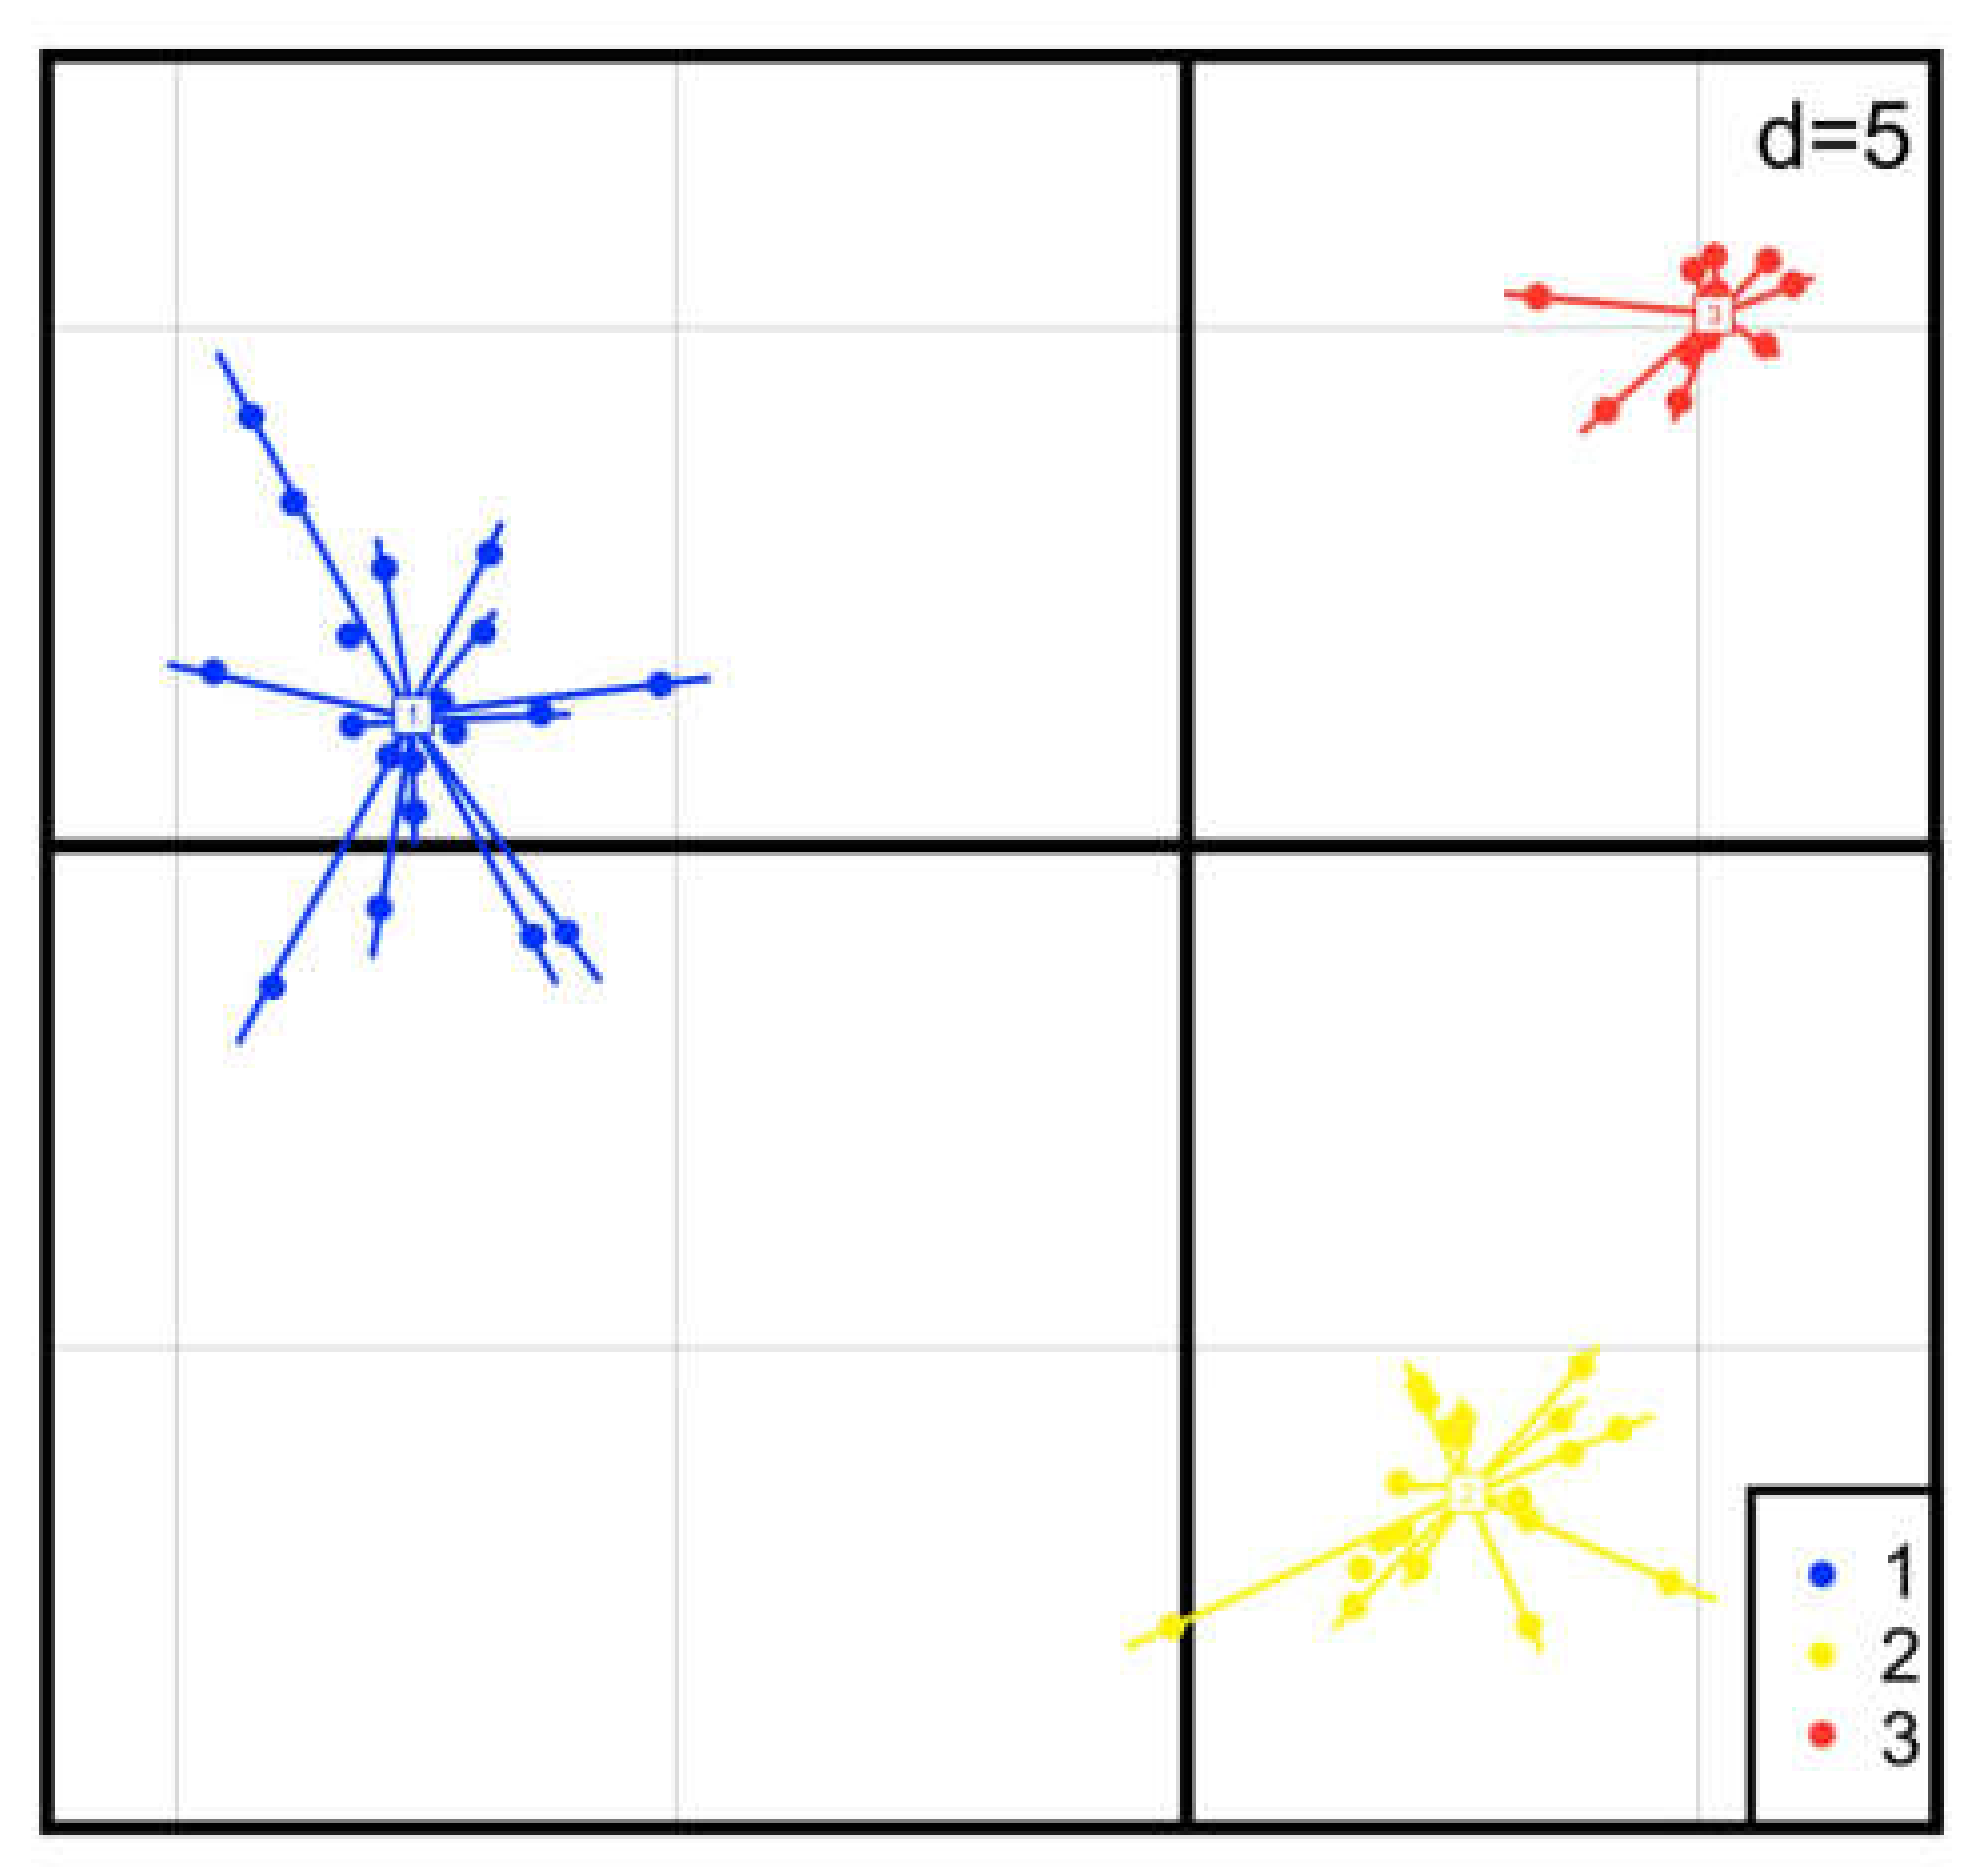
3.2. Characterization of Polymorphic Microsatellites in Three Populations

The polymorphism percentage varied for each population: 100% for Altamira (ALT), 88.89% for La Mancha (MAN), and 44.4% for El Dique (DIQ). The number of alleles varied between two and nine. Locus OenbidiA_C10 had nine alleles followed by Oenbi39tri4 with five. The average number of alleles per locus in Altamira was 2.89 (±1.62), La Mancha had 2.78 (±1.39), and El Dique 1.56 (± 0.73). A lower variation in the distribution of allele frequencies per locus and population was detected for most loci in El Dique, where six out of nine were monomorphic (Table 3). Altamira had the highest variation, with alleles representing almost all loci. La Mancha had the greatest number of private alleles. Overall observed and expected heterozygosities were 0.29 and 0.34, respectively. The locus with the highest value of Ho was Oenbi39tri4 in La Mancha (0.75).
Potential null alleles were identified in three primers tested and corresponded with the Hardy Weinberg equilibrium deviations found in the same loci (Oenbi2triA_A1, OenbidiA_C10, and Oenbi2triA_F5). Linkage disequilibrium analysis for all populations showed statistical significance (p < 0.05) between the same primer sets showing potential null alleles. The AMOVA showed the highest percentage of variation within individuals (51%), followed by the variation among populations (38.2%), and the lowest variation was found among individuals between populations (10.6%).
The FST global value showed significant differentiation between the three studied populations (0.382). The pairwise FST values showed the greatest differentiation between Altamira and El Dique (0.459), similar to La Mancha and El Dique (0.449). The shortest differentiation was found between Altamira and La Mancha (0.258). Additionally, DAPC showed an overall graphic view of the variation among populations and individuals within populations. As seen in Figure 2, the first two linear discriminants separated among the three populations as distinct clusters. DAPC is congruent with AMOVA a high level of variation among populations was found. Additionally, it is notable that the invader population (DIQ) showed the least genetic variation. The FIS index calculated for the dataset was 0.172, showing an excess of homozygotes. Although the overall value suggests a high occurrence of inbreeding, the same three loci with deviations from the Hardy Weinberg equilibrium due to null alleles’ presence showed FIS values of statistical significance (OenbidiA_C10 = 0.301, Oenbi2triA_A1 = 0.464, and Oenbi2triA_F5 = 0.546). Significant differences were found for the mean number of alleles and the He, but no significant differences were detected for the Ho (Kruskal Wallis; A: H = 7.31, P = 0.025; Ho: H = 5.58, P = 0.061; He: H = 9.49, P = 0.008).

4. Discussion

In general, our primer transferability results showed similar success compared to what was found in other studies. Rossetto in 2001 [62] collected and summarized information from several published studies on the transferability of plant microsatellites and reported an average success rate of over 70% between species of the same genus. Barbará et al. observed similar findings or even higher transferability levels in 2007 [63], where a percentage of transferability of 80% in eudicots is reported, similar to the ratio observed in this study (75%). Although the rate of success in the transferability of markers in O. drummondii could be considered good enough, the polymorphism percentage (32.1%) was lower than that reported by Rossetto in species within the same genus (86%), and by Barbará in eudicots (46%). The successful transferability of microsatellite markers involves different steps: the identification of libraries developed for another species, testing, and identification of polymorphic loci for the target species. There is a potential loss of loci in each step, and the final working set of primers is a small fraction of the original number [64,65]. Even when nearly all tested markers amplify the target regions, the number of identified polymorphic loci remains low [66,67]. The results may vary depending on the target organism, the number of markers tested, and the phylogenetic relationship between the source and the target species [63,68].
It is also essential to keep in mind that de novo development of SSR markers for new species used to be costly and complicated. New isolation strategies to develop genomic SSRs, such as next-generation sequencing technology (NGS), provide a more rapid approach for the generation of microsatellite loci, avoiding the construction of microsatellite-enriched DNA libraries [38]. Compared to traditional methodologies, NGS reduces the costs, time taken for development, and labor involved. However, transferability could save even more costs and time, avoiding steps like sequencing and primer design, which are necessary to obtain suitable microsatellite loci by NGS [69].
We found significant differentiation between the molecular variance analysis for eight populations (39.6%). This result was used to confirm the nine microsatellite markers’ suitability to conduct further genetic characterization analysis in the three chosen populations. However, given the small number of individuals used to perform the analysis (three per population), we cannot make any assumptions about the species’ genetic diversity and genetic structure. When three populations were evaluated, the genetic variation found was lower than that reported for Oenothera harringtonii and Oenothera biennis, for which the same primers were developed and tested [47,48]. The number of alleles found in O. drummondii was lower for most markers tested. However, we found preliminary evidence to support our hypotheses of a founder effect. We found less genetic variation and allelic fixation (monomorphic loci) in the invasive population of El Dique. In invasive species, the reduction of genetic diversity in founding populations has been associated with bottlenecks and the founder effect [24,31]. The impact of the genic drift and inbreeding is expected to be stronger in populations with recent invasion processes, such as El Dique [7].
In O. drummondii, we also found low genetic variation in the native populations of Altamira and La Mancha. Even though these results were preliminary, the three evaluated populations showed a small amount of genetic variation distributed mainly among populations with significant differentiation, indicating a high genetic structure between them. The population structure and genetic diversity found in O. drummondii seem to be the same found for Oenothera biennis, based on a genic heterozygosity and allozyme polymorphism analysis of 44 populations (up to 75 individuals each) [70]. In this study, it was suggested that the lack of genetic variation found was most likely due to the colonization of a new habitat by one or a few individuals and the high genetic differentiation between populations as a consequence of a predominantly self-fertilizing reproductive strategy. It is supported by the assumption that genetic uniformity is the optimal strategy for achieving maximum fitness in the immediate environment [71,72]. The two previous explanations seem to apply to the results of this study. Even though O. drummondii is a modally outcrossing species, like O. biennis, it has been reported as self-compatible [5]. Thus, single plants may become self-pollinating and self-fertilizing when stress periods prevent their cross-breeding. It is highly probable, considering that both native and invasive O. drummondii populations occur in coastal dunes and littoral areas. The extreme abiotic conditions and colonization extinction processes are typical of these environments [15,73], leading to stress periods and resulting in selfing as a consequence.
Self-fertilization is a typical reproduction mode in plants with significant genetic consequences. First, molecular data indicate lower genetic diversity in inbreeding species than in outcrossing taxa, even in closely related species [74]. This reduction could be due to selective sweeps (i.e., beneficial alleles become fixed), background selection (i.e., selection against weak deleterious alleles reduces the effective population size) [75], and variation in ecological or demographic processes such as migration and colonization [22]. To answer the hypotheses regarding the genetic diversity and genetic structure of O. drummondii, it is necessary to know the maximum allelic diversity via a sample protocol based on the amount and distribution of genetic diversity [76]. Considering that only three populations of O. drummondii were evaluated in this study, we want to highlight that the sampling depth is not sufficient enough to draw robust conclusions, and the presented results should be considered preliminary. As proposed by Lowe et al. in 2004 [77], additional sampling rounds are required.
Here, we attempted to identify microsatellite markers suitable for studies of the population genetics of O. drummondii, based on transferability tests. We successfully identified nine polymorphic markers. However, we suppose that more markers are needed to get the species’ full genetic diversity and structure. In that case, the utilization of next-generation sequencing could facilitate discovering specific markers for the species, at a fraction of the cost and effort compared to traditional microsatellite isolation approaches [38,78].

Supplementary Materials

The following are available online at https://www.mdpi.com/1424-2818/12/10/387/s1, File: Genomic DNA of all samples was extracted from leaf tissue.

Author Contributions

R.H.-E., J.G.-A., J.B.G.-F., and A.E.d.l.M. conceived of and designed the study. J.G.-A., A.E.d.l.M., J.B.G.-F., and R.H.-E. collected samples. R.H.-E., D.C.-T., J.G.-A., and A.E.d.l.M. analyzed and interpreted the data. J.B.G.-F. contributed reagents/materials/analysis tools. All authors contributed to writing and editing the document, read, revised, and approved the manuscript and agreed to its published version.

Funding

This study was funded by the Ministerio de Economía y Competitividad, Spain (MINECO Project CGL2015-65058-R co-funded by FEDER). This study was also supported by a CONACYT scholarship (636614) awarded to R.H.E.

Acknowledgments

We are grateful to Janet Nolasco-Soto and Maria Luisa Castillo for assistance with laboratory work, Denisse Maldonado for guidance with laboratory procedures, Carla Gutierrez for providing us with the PCR camera, equipment belonging to the Evolutionary Biology Network Molecular Laboratory, and Jessica Pérez Alquicira for the DAPC analysis and figure edition. We also thank Andrea Ballén for field assistance, José García-Franco, Rusty Feagin, and Anwar Medina-Villareal for providing samples, and Hannah James Bowen for the English editing.

Conflicts of Interest

The authors declare no conflict of interest. The funders had no role in the design of the study; in the collection, analyses, or interpretation of data; in the writing of the manuscript, or in the decision to publish the results.

References

  1. Dietrich, W. Vol. VIII Haloragaceae-Euphorbiaceae. In Flora Ibérica; Castroviejo, S., Aedo, C., Benedi, C., Lainz, M., Garmendia, F., Feliner, G., Paiva, J., Eds.; Real Jardín Botánico: Madrid, Spain, 1997; p. 375. ISBN 84-00-06221-3. [Google Scholar]
  2. Frean, M.; Balkwill, K.; Gold, C.; Burt, S. The expanding distributions and invasiveness of Oenothera in southern Africa. South Afr. J. Bot. 1997, 63, 449–458. [Google Scholar] [CrossRef] [Green Version]
  3. Lonard, R.I.; Judd, F.W. Phenology of Native Angiosperms of South Padre Island, Texas. In Proceedings of the Eleventh North American Prairie Conference, Lincoln, NE, USA, 7–11 August 1988; University of Nebraska—Lincoln: Lincoln, NE, USA, 1989; Volume 32, pp. 217–222. [Google Scholar]
  4. Wagner, W.L.; Hoch, P.C.; Raven, P.H. Revised classification of the Onagraceae. Syst. Bot. Monogr. 2007, 37, 1–240. [Google Scholar] [CrossRef]
  5. Dietrich, W.; Wagner, W.L. Systematics of Oenothera Section Oenothera Subsection Raimannia and Subsection Nutantigemma (Onagraceae); American Society of Plant Taxonomists: Ann Arbor, MI, USA, 1988; Volume 24, pp. 1–91. [Google Scholar] [CrossRef]
  6. Dietrich, W.; Wagner, W.L. New Taxa of Oenothera L. Sect. Oenothera (Onagraceae). Ann. Mo. Bot. Gard. 1987, 74, 144–150. [Google Scholar] [CrossRef]
  7. García-de Lomas, J.; Fernández-Carrillo, L.; Saavedra, M.; Mangas, L.; Rodríguez, C.; Sánchez-Gullón, E.; Martínez, E. Invasión of Oenothera drummondii Hook. (Onagraceae) en el paraje natural Marismas del Odiel (Huelva, Sur de España): Bases para la gestión de una invasión avanzada. Rev. Soc. Gad. Hist. Nat. 2015, 9, 41–50. [Google Scholar]
  8. Campos, J.A.; Herrera, M.; Biurrun, I.; Loidi, J. The role of alien plants in the natural coastal vegetation in central-northern Spain. Biodivers. Conserv. 2004, 13, 2275–2293. [Google Scholar] [CrossRef]
  9. Xu, H.; Qiang, S.; Genovesi, P.; Ding, H.; Wu, J.; Meng, L.; Han, Z.; Miao, J.; Hu, B.; Guo, J.; et al. An inventory of invasive alien species in China. NeoBiota 2012, 15, 1–26. [Google Scholar] [CrossRef]
  10. Dufour-Dror, J.M. Israel’s Least Wanted Alien Ornamental Plant Species Ornamental Plants Potentially Invasive in Israel’s Natural Ecosystems; The Middle East Nature Conservation Promotion Association: Jerusalem, Israel, 2013. [Google Scholar]
  11. Heenan, P.B.; de Lange, P.J.; Cameron, E.K.; Champion, P.D. Checklist of dicotyledons, gymnosperms, and pteridophytes naturalized or casual in New Zealand: Additional records 1999–2000. N. Z. J. Bot. 2002, 40, 155–174. [Google Scholar] [CrossRef]
  12. Heyligers, P.C. Flora of the Stockton and Port Hunter sandy foreshores with comments on fifteen notable introduced species. Cuninghamia 2008, 10, 493–511. [Google Scholar]
  13. Gallego-Fernández, J.B.; Martínez, M.L.; García-Franco, J.G.; Zunzunegui, M. Multiple seed dispersal modes of an invasive plant species on coastal dunes. Biological Invasions 2020, 6. [Google Scholar] [CrossRef]
  14. Zunzunegui, M.; Ruiz-valdepeñas, E.; Sert, M.A.; Díaz-barradas, M.C.; Gallego-fernández, J.B. Field comparison of ecophysiological traits between an invader and a native species in a Mediterranean coastal dune. Plant Physiol. Biochem. 2020, 146, 278–286. [Google Scholar] [CrossRef]
  15. Gallego-Fernández, J.B.; Martínez, M.L.; García-Franco, J.G.; Zunzunegui, M. The impact on plant communities of an invasive alien herb, Oenothera drummondii, varies along the beach-coastal dune gradient. Flora 2019, 260, 151466. [Google Scholar] [CrossRef]
  16. García-De-Lomas, J.; Fernández-Carrillo, L.; Saavedra, C.; Dana, E.D.; Rodríguez, C.; Martínez, E. Feasibility of using glyphosate to control beach evening primrose Oenothera drummondii in heavily invaded coastal dunes, Odiel Marshes, Spain. Conserv. Evid. 2016, 13, 72–78. [Google Scholar]
  17. Blackburn, T.M.; Pyšek, P.; Bacher, S.; Carlton, J.T.; Duncan, R.P.; Jarošík, V.; Wilson, J.R.U.; Richardson, D.M. A proposed unified framework for biological invasions. Trends Ecol. Evolut. 2011, 26, 333–339. [Google Scholar] [CrossRef] [PubMed] [Green Version]
  18. Hirsch, H.; Richardson, D.M.; Le Roux, J.J. Introduction to the special issue: Tree invasions: Towards a better understanding of their complex evolutionary dynamics. AoB PLANTS 2017, 9, 1–8. [Google Scholar] [CrossRef] [Green Version]
  19. Richards, A.J. Plant Breeding Systems; Chapman & Hall Ltd.: London, UK, 1997. [Google Scholar]
  20. Mazzolari, A.C.; Marrero, H.J.; Vázquez, D.P. Potential contribution to the invasion process of different reproductive strategies of two invasive roses. Biol. Invas. 2017, 19, 615–623. [Google Scholar] [CrossRef]
  21. Nei, M.; Maruyama, T.; Chakraborty, R. The Bottleneck Effect and Genetic Variability in Populations. Evolution 1975, 29, 1–10. [Google Scholar] [CrossRef]
  22. Liu, L.; Pei, C.; Liu, S.; Guo, X.; Du, N.; Guo, W. Genetic and epigenetic changes during the invasion of a cosmopolitan species (Phragmites australis). Ecol. Evolut. 2018, 8, 6615–6624. [Google Scholar] [CrossRef]
  23. Dlugosch, K.M.; Anderson, S.R.; Braasch, J.; Cang, F.A.; Gillette, H.D. The devil is in the details: Genetic variation in introduced populations and its contributions to invasion. Mol. Ecol. 2015, 24, 2095–2111. [Google Scholar] [CrossRef]
  24. Dlugosch, K.M.; Hays, C.G. Genotypes on the move: Some things old and some things new shape the genetics of colonization during species invasions. Mol. Ecol. 2008, 17, 44583–44585. [Google Scholar] [CrossRef]
  25. Frankham, R. Resolving the genetic paradox in invasive species. Heredity 2005, 94, 385. [Google Scholar] [CrossRef]
  26. Refoufi, A.; Esnault, M.A. Genetic diversity and population structure of Elytrigia pycnantha (Godr.) (Triticeae) in Mont Saint-Michel Bay using microsatellite markers. Plant Biol. 2006, 8, 234–242. [Google Scholar] [CrossRef] [PubMed]
  27. Chapman, H.; Robson, B.; Pearson, M.L. Population genetic structure of a colonizing, triploid weed, Hieracium lepidulum. Heredity 2004. [Google Scholar] [CrossRef] [PubMed]
  28. Jørgensen, S.; Mauricio, R. Neutral genetic variation among wild North American populations of the weedy plant Arabidopsis thaliana is not geographically structured. Mol. Ecol. 2004, 13, 3403–3413. [Google Scholar] [CrossRef] [PubMed]
  29. Durka, W.; Bossdorf, O.; Prati, D.; Auge, H. Molecular evidence for multiple introductions of garlic mustard (Alliaria petiolata, Brassicaceae) to North America. Mol. Ecol. 2005, 14, 1697–1706. [Google Scholar] [CrossRef]
  30. Meekins, J.F.; Ballard, H.E., Jr.; McCarthy, B.C. Genetic Variation and Molecular Biogeography of a North American Invasive Plant Species (Alliaria petiolata, Brassicaceae). Int. J. Plant Sci. 2001, 162, 161–169. [Google Scholar] [CrossRef]
  31. Sakai, A.K.; Allendorf, F.W.; Holt, J.S.; Lodge, D.M.; Molofsky, J.; With, K.A.; Baughman, S.; Cabin, R.J.; Cohen, J.E.; Ellstrand, N.C.; et al. The Population Biology of Invasive Species. Ann. Rev. Ecol. Syst. 2001, 32, 305–332. [Google Scholar] [CrossRef] [Green Version]
  32. Husband, B.C.; Barrett, S.C.H. Colonization history and population genetic structure of Eichornia paniculata in Jamaica. Heredity 1991, 66, 287–296. [Google Scholar] [CrossRef] [Green Version]
  33. Marrs, R.A.; Sforza, R.; Hufbauer, R.A. When invasion increases population genetic structure: A study with Centaurea diffusa. Biol. Invas. 2008, 10, 561–572. [Google Scholar] [CrossRef]
  34. Novak, S.J.; Welfley, A.Y. Genetic Diversity in the introduced Clonal Grass Poa bulbosa (Bulbous Bluegrass). NorthWest Sci. 1997, 71, 271–280. [Google Scholar]
  35. Vieira, M.L.C.; Santini, L.; Diniz, A.L.; de Freitas Munhoz, C. Microsatellite markers: What they mean and why they are so useful. Genet. Mol. Biol. 2016, 39, 312–328. [Google Scholar] [CrossRef]
  36. Daw, E.W.; Heath, S.C.; Lu, Y. Single-nucleotide polymorphism versus microsatellite markers in a combined linkage and segregation analysis of a quantitative trait. BMC Genetics 2005, 6, 4–6. [Google Scholar] [CrossRef] [PubMed] [Green Version]
  37. Tsykun, T.; Rellstab, C.; Dutech, C.; Sipos, G.; Prospero, S. Comparative assessment of SSR and SNP markers for inferring the population genetic structure of the common fungus Armillaria cepistipes. Heredity 2017, 119, 371–380. [Google Scholar] [CrossRef] [PubMed]
  38. Zalapa, J.E.; Cuevas, H.; Zhu, H.; Steffan, S.; Senalik, D.; Zeldin, E.; McCown, B.; Harbut, R.; Simon, P. Using next-generation sequencing approaches to isolate simple sequence repeat (SSR) loci in the plant sciences. Am. J. Bot. 2012, 99, 193–208. [Google Scholar] [CrossRef] [Green Version]
  39. Hoshino, A.A.; Bravo, J.P.; Nobile, P.M.; Morelli, K.A. Microsatellites as tools for genetic diversity analysis. In Genetic Diversity in Microorganisms; Caliskan, M., Ed.; InTech: Rijeka, Croatia, 2012. [Google Scholar]
  40. Gou, X.; Shi, H.; Yu, S.; Wang, Z.; Li, C.; Liu, S.; Ma, J.; Chen, G.; Liu, T.; Liu, Y. SSRMMD: A Rapid and Accurate Algorithm for Mining SSR Feature Loci and Candidate Polymorphic SSRs Based on Assembled Sequences. Front. Genet. 2020, 11, 1–10. [Google Scholar] [CrossRef] [PubMed]
  41. Guichoux, E.; Lagache, L.; Wagner, S.; Chaumeil, P.; Léger, P.; Lepais, O.; Lepoittevin, C.; Malausa, T.; Revardel, E.; Salin, F.; et al. Current trends in microsatellite genotyping. Mol. Ecol. Resour. 2011, 11, 591–611. [Google Scholar] [CrossRef]
  42. Soares, T.N.; Sant’Ana, L.L.; de Oliveira, L.K.; Telles, M.P.C.; Collevatti, R.G. Transferability and characterization of microsatellite loci in Anacardium humile A. St. Hil. (Anacardiaceae). Genet. Mol. Res. 2013, 12, 3146–3149. [Google Scholar] [CrossRef]
  43. Lavor, P.; van den Berg, C.; Versieux, L.M. Transferability of 10 nuclear microsatellite primers to Vriesea minarum (Bromeliaceae), a narrowly endemic and threatened species from Brazil. Braz. J. Bot. 2013, 36, 165–168. [Google Scholar] [CrossRef]
  44. Gallego-Fernández, J.B.; Martínez, M.L. Environmental filtering and plant functional types on Mexican foredunes along the Gulf of Mexico. Ecoscience 2011, 18, 52–62. [Google Scholar] [CrossRef]
  45. González, D.; Vovides, A. Low Intralineage Divergence in Ceratozamia (Zamiaceae) Detected with Nuclear Ribosomal DNA ITS and Chloroplast DNA trnL-F Non-coding Region. Syst. Bot. 2002, 27, 654–661. [Google Scholar]
  46. Yue, Q.; Da-li, F.; Meng-pei, L.; Yu-qin, L.; Shuo, W. Optimization of microsatellite DNA Gelred fluorescence imaging technology. Afr. J. Biotech. 2012, 11, 14749–14754. [Google Scholar] [CrossRef]
  47. Lewis, E.M.; Fant, J.B.; Moore, M.J.; Hastings, A.P.; Larson, E.L.; Agrawal, A.A.; Skogen, K.A. Microsatellites for Oenothera gayleana and O. hartwegii subsp. filifolia (Onagraceae), and Their Utility in Section Calylophus. Appl. Plant Sci. 2016. [Google Scholar] [CrossRef] [PubMed] [Green Version]
  48. Skogen, K.A.; Hilpman, E.T.; Todd, S.L.; Fant, J.B. Microsatellite primers in Oenothera harringtonii (Onagraceae), an annual endemic to the shortgrass prairie of Colorado. Am. J. Bot. 2012, 99, e313–e316. [Google Scholar] [CrossRef] [PubMed]
  49. Larson, E.L.; Bogdanowicz, S.M.; Agrawal, A.A.; Johnson, M.T.J.; Harrison, R.G. Isolation and characterization of polymorphic microsatellite loci in common evening primrose (Oenothera biennis). Mol. Ecol. Resour. 2008, 8, 434–436. [Google Scholar] [CrossRef] [PubMed]
  50. Schuelke, M. An economic method for the fluorescent labeling of PCR fragments. Nat. Biotech. 2000, 18, 233–234. [Google Scholar] [CrossRef]
  51. Missiaggia, A.; Grattapaglia, D. Plant microsatellite genotyping with 4-color fluorescent detection using multiple-tailed primers. Genet. Mol. Res. 2006, 5, 72–78. [Google Scholar]
  52. Oblessuc, P.R.; de Campos, T.; Cardoso, J.M.K.; Sforça, D.A.; Baroni, R.M.; de Souza, A.P.; Benchimol, L.L. Adaptation of fluorescent technique for genotyping with new microsatellite markers in common bean. Pesqui. Agropecu. Bras. 2009, 44, 638–644. [Google Scholar] [CrossRef] [Green Version]
  53. Culley, T.M.; Stamper, T.I.; Stokes, R.L.; Brzyski, J.R.; Hardiman, N.A.; Klooster, M.R.; Merritt, B.J. An Efficient Technique for Primer Development and Application that Integrates Fluorescent Labeling and Multiplex PCR. Appl. Plant Sci. 2013, 1, 1300027. [Google Scholar] [CrossRef]
  54. Van Oosterhout, C.; Hutchinson, W.F.; Wills, D.P.M.; Shipley, P. MICRO-CHECKER: Software for identifying and correcting genotyping errors in microsatellite data. Mol. Ecol. Notes 2004, 4, 535–538. [Google Scholar] [CrossRef]
  55. Hartl, D.; Clark, A. Principles of Population Genetics, 3rd ed.; Sinauer, A., Ed.; Sinauer Associates: Sunderland, MA, Canada, 1997; ISBN 0-87893-306-9. [Google Scholar]
  56. Peakall, R.; Smouse, P.E. GenAlEx 6.5: Genetic analysis in Excel. Population genetic software for teaching and research-an update. Bioinformatics 2012, 28, 2537–2539. [Google Scholar] [CrossRef] [Green Version]
  57. Excoffier, L.; Lischer, H.E.L. Arlequin suite ver 3.5: A new series of programs to perform population genetics analyses under Linux and Windows. Mol. Ecol. Resour. 2010, 10, 564–567. [Google Scholar] [CrossRef]
  58. Slatkin, M. Inbreeding coefficients and coalescence times. Genet. Res. 1991, 58, 167–175. [Google Scholar] [CrossRef] [PubMed] [Green Version]
  59. Wright, S. The Interpretation of Population Structure by F-Statistics with Special Regard to Systems of Mating. Evolution 1965, 19, 395–420. [Google Scholar] [CrossRef]
  60. R Core Team. R: A Language and Environment for Statistical Computing. An Introduction to dplR. 2013. Available online: http://cran.univ-paris1.fr/web/packages/dplR/vignettes/intro-dplR.pdf (accessed on 31 May 2013).
  61. Jombart, T.; Devillard, S.; Balloux, F. Discriminant analysis of principal components: A new method for the analysis of genetically structured populations. BMC Genetics 2010, 11, 1–15. [Google Scholar] [CrossRef] [PubMed] [Green Version]
  62. Rossetto, M. Sourcing of SSR markers from related plant species. In Plant Genotyping: The DNA Fingerprinting of Plants; Henry, R.J., Ed.; Centre of Agriculture and Bioscience International: Wallingford, UK, 2009; pp. 211–224. [Google Scholar]
  63. Barbará, T.; Palma-Silva, C.; Paggi, G.M.; Bered, F.; Fay, M.F.; Lexer, C. Cross-species transfer of nuclear microsatellite markers: Potential and limitations. Mol. Ecol. 2007, 16, 3759–3767. [Google Scholar] [CrossRef]
  64. Squirrell, J.; Hollingsworth, P.M.; Woodhead, M.; Russell, J.; Lowe, A.J.; Gibby, M.; Powell, W. How much effort is required to isolate nuclear microsatellites from plants? Mol. Ecol. 2003, 12, 1339–1348. [Google Scholar] [CrossRef]
  65. Zane, L.; Bargelloni, L.; Patarnello, T. Strategies for microsatellite isolation: A review. Mol. Ecol. 2002, 11, 1–16. [Google Scholar] [CrossRef]
  66. Singleton, J.J.; Mangat, P.K.; Shim, J.; Vavra, C.; Coldren, C.; Angeles-Shim, R.B. Cross-species transferability of Solanum spp. DNA markers and their application in assessing genetic variation in silverleaf nightshade (Solanum elaeagnifolium ) populations from Texas, USA. Weed Sci. 2020, 68, 396–404. [Google Scholar] [CrossRef]
  67. Zhu, X.; Raman, H.; Wu, H.; Lemerle, D.; Burrows, G.; Stanton, R. Development of SSR Markers for Genetic Analysis of Silverleaf Nightshade (Solanum elaeagnifolium) and Related Species. Plant Mol. Biol. Rep. 2012, 31. [Google Scholar] [CrossRef]
  68. Lobato-deMagalhães, T.; Cabrera-Toledo, D.; Martínez, M. Microsatellite loci transferability and genetic diversity of the aquatic plant Nimphoides fallax Ornduff (Menyanthaceae), endemic to the Mexican and Guatemalan highlands. Limnology 2019, 20, 223–241. [Google Scholar]
  69. Senan, S.; Kizhakayil, D.; Sasikumar, B.; Sheeja, T.E. Methods for Development of Microsatellite Markers: An Overview. Notulae Sci. Biol. 2014, 6, 1–13. [Google Scholar] [CrossRef] [Green Version]
  70. Levin, D.A. Genic heterozygosity and protein polymorphism among local populations of Oenothera biennis. Genetics 1974, 79, 477–491. [Google Scholar]
  71. Mather, K. Polygenic inheritance and natural selection. Biol. Rev. 1943, 18, 32–64. [Google Scholar] [CrossRef]
  72. Stebbins, G. Self-fertilization and population variability in plants. Am. Nat. 1957, 41, 337–352. [Google Scholar] [CrossRef]
  73. Martínez, M.L.; Psuty, N.; Lubke, R. A perspective on coastal dunes. In Coastal Dunes. Ecology and Conservation; Martínez, M.L., Psuty, N., Eds.; Springer-Verlag: Berlin, Germany, 2004; pp. 3–10. [Google Scholar]
  74. Ingvarsson, P.K. A metapopulation perspective on genetic diversity and differentiation in partially self-fertilizing plants. Evolution 2002, 56, 2368–2373. [Google Scholar] [CrossRef]
  75. Nordborg, M. Linkage Disequilibrium, Gene Trees and Selfing: An Ancestral Recombination Graph With Partial Self-Fertilization. Genetics 2000, 154, 923–929. [Google Scholar]
  76. Ward, S.M.; Jasieniuk, M. Review: Sampling Weedy and Invasive Plant Populations for Genetic Diversity Analysis. Weed Sci. 2009, 57, 593–602. [Google Scholar] [CrossRef]
  77. Lowe, A.; Harris, S.; Ashton, P. Ecological genetics: Design, Analysis and Application; Blackwell: Oxford, UK, 2004; ISBN 1-4051-0033-8. [Google Scholar]
  78. Taheri, S.; Abdullah, T.L.; Yusop, M.R.; Hanafi, M.M.; Sahebi, M.; Azizi, P.; Shamshiri, R.R. Mining and development of novel SSR markers using Next Generation Sequencing (NGS) data in plants. Molecules 2018, 23, 399. [Google Scholar] [CrossRef] [Green Version]
Figure 1. Sampling sites used for the initial screening of microsatellite loci in eight populations of Oenothera drummondii. Labels: AGB: Agua Blanca, PAS: Punta Arena del Sur, BOL: Bolivar, SPA: South Padre Island, ALT: Altamira, MAN: La Mancha, OLM: Olmeca, DIQ: El Dique. Red circles show the three populations used for further characterization.
Diversity 12 00387 g001
Figure 2. Discriminant analysis of principal components in nine loci and three populations of O. drummondii. The axes represent the first two linear discriminants (LDs). Numbers represent populations: 1 = Altamira (native, blue), 2 = La Mancha (native, yellow), and 3 = El Dique (invasive, red). Lines represent the genetic variation within populations, dots represent the 360 genotypes, and d represents the grid’s scale.
Diversity 12 00387 g002
Table 1. Sampling localities of eight populations of Oenothera drummondii.
CountryLocalityCodeCoordinates
LatitudeLongitude
SpainAndalucía; Huelva, El Dique DIQ37.09−6.54
USATexas; BolívarBOL29.30−94.30
USATexas; South Padre IslandSPA26.13−97.11
MexicoBaja California Sur; Punta Arena del SurPAS23.55−109.47
MexicoBaja California Sur; Agua BlancaAGB23.66−110.41
MexicoTamaulipas; AltamiraALT22.40−97.84
MexicoVeracruz; La ManchaMAN19.59−96.38
MexicoTabasco; OlmecaOLM18.23−94.06
Table 2. Characteristics of nine microsatellite primers tested on Oenothera drummondii populations; seven primers were developed in O. harringtonii and three in O. biennis.
Primer NameRepeat MotifPrimer Sequences (5′3′)Size (bp)Ta (°C)GenBank AccessRef. *
OenhaB105(TTG)17F: TAGCCTCCTCAAGAGACACA
R: CGATGCTGGAACTTCAAAG
150–16047JQ266359[48]
OenhaD102(ATG)8F: GCACAAATCCGAAACTCA
R: TGCCGCATCTAACCATAC
255–26547JQ266363[48]
Oenbi2diA_C10(GA)20F: AGGAGCAAACTGAAGCAGGA
R:TTGCAGAACCCAGAATCTGTT
232–26947KT762972[47]
Oenbi2triA_A1(TTC)8F: CCACAGCATCACCAAATTCTTACTT
R: GGGGCGCCAGGTATTGTCG
336–35547KT762970[47]
Oenbi2triA_D3(ATG)9F: CAGATTACGGCGAAAGGAGACAAC
R: CGCTCAGGCATCGCATCTC
300–31547KT762967[47]
Oenbi39tri10(CTT)6F: AACAAATTTATGCGATTTCGCC
R: CTGGAAGGGGCGACTGAAAC
170–18547KT900894[47]
Oenbi2triA_F5(GAT)8F: GGGACGCGACCTCAGATTC
R: CGCTCAGGCATCGCATCTC
235–25047KT762965[47]
Oenbi2triA_H1(GCT)14F: GAGCCGGAATAAACTGATACCACT
R: AGCAGAGAAGGCGTCAACCATAAT
200–21747KT762964[47]
Oenbi39tri4(CTT)16F: TTTCCTCTCCTTATCTCCTCAATTCTTCTCA
R: CTTGCGTTATCTTATGCGTAGCCGTTAGTTTAT
252–27847EF988090[48]
* Indicates the study from which the marker was taken.
Table 3. Results of the initial primer screening in three populations of Oenothera drummondii.
Altamira (ALT)La Mancha (MAN)El Dique (DIQ)
Primer nameNAApHoHe bNAApHoHe bNAApHoHe b
OenhaB105202-0.400.33202-0.300.50201-00
OenhaD102202-0.600.47201-00201-00
OenbidiA_C1020740.450.85 *20510.350.75 *202-0.650.45
Oenbi2triA_A1203-0.550.62 *202-0.200.43 *202-00.33 *
Oenbi2triA_D3202-0.200.3320210.200.18202-0.300.26
Oenbi39tri1020310.550.4420310.550.44201-00
Oenbi2triA_F5202-00.38 *20310.300.26201-00
Oenbi2triA_H120310.550.50202-0.250.48201-00
Oenbi39tri4202-0.400.5020510.750.66203-0.400.34
Note: - = not applicable; A = number of alleles; Ap = number of private alleles; Ho = observed heterozygosity; He = expected heterozygosity; N = number of individuals sampled. b Significant departures from Hardy Weinberg equilibrium: * p < 0.05.

