Article

Richness of Primary Producers and Consumer Abundance Mediate Epiphyte Loads in a Tropical Seagrass System

1
Centre for Tropical Water and Aquatic Ecosystem Research, James Cook University, Cairns, QLD 4870, Australia
2
College of Science and Engineering, James Cook University, Cairns, QLD 4870, Australia
*
Author to whom correspondence should be addressed.
Diversity 2020, 12(10), 384; https://doi.org/10.3390/d12100384
Submission received: 27 August 2020 / Revised: 2 October 2020 / Accepted: 2 October 2020 / Published: 7 October 2020
(This article belongs to the Special Issue Biodiversity in Seagrass Ecosystems)

Abstract

:
Consumer communities play an important role in maintaining ecosystem structure and function. In seagrass systems, algal regulation by mesograzers provides a critical maintenance function which promotes seagrass productivity. Consumer communities also represent a key link in trophic energy transfer and buffer negative effects to seagrasses associated with eutrophication. Such interactions are well documented in the literature regarding temperate systems, however, it is not clear if the same relationships exist in tropical systems. This study aimed to identify if the invertebrate communities within a tropical, multispecies seagrass meadow moderated epiphyte abundance under natural conditions by comparing algal abundance across two sites at Green Island, Australia. At each site, paired plots were established where invertebrate assemblages were perturbed via insecticide manipulation and compared to unmanipulated plots. An 89% increase in epiphyte abundance was seen after six weeks of experimental invertebrate reductions within the system. Using generalised linear mixed-effect models and path analysis, we found that the abundance of invertebrates was negatively correlated with epiphyte load on seagrass leaves. Habitat species richness was seen to be positively correlated with invertebrate abundance. These findings mirrored those of temperate systems, suggesting this mechanism operates similarly across latitudinal gradients.

1. Introduction

Both empirical and theoretical studies showed that consumer communities play an important role in maintaining ecosystem structure and function [1,2,3]. Consumers act as regulators within systems by moderating the biomass and structure of lower trophic levels [4,5,6]. Regulation can arise through the control of competitively superior species at population levels that prevent exclusion of less competitive ones, as well as through physical disturbances which maintain the persistence of pioneer-type species [2,3,5,7]. In plant–herbivore interactions, both of these processes act to increase plant richness within a system, which is positively linked to primary productivity, making herbivorous consumer communities critical to ecosystem function [1,2,7,8].
In marine environments, seagrass meadows are one system in which the occurrence of a rich and abundant community of organisms that consume primary producers is known to maintain and increase ecosystem functions, such as overall productivity, stability and resource use [6,9,10,11]. A large body of experimental research identified the important role that both large herbivores, such as green turtles, dugong/manatees, fish and sea urchins [6,12,13,14], as well as small invertebrate grazing communities (commonly referred to as mesograzers) [15,16,17], have on the structure and maintenance of seagrass meadows.
Algal grazing by mesograzer communities within seagrass meadows is an important function, providing a key link in trophic energy transfer within seagrass ecosystems and buffering negative effects to seagrasses associated with eutrophication and an overabundant epiphytic algae community [18,19]. For example, in eutrophication experiments, ambient grazing pressures associated with mesograzers promoted increases in both seagrass and grazer biomass [17,18]. However, when mesograzer abundance was reduced, algal dominance increased and seagrass abundance and biomass declined [18,19,20]. Mesograzer abundance alone may be inadequate to fully characterise the observed process. Richness within grazer communities, primarily in gastropod and amphipod taxa, was also shown to increase the efficiency of grazer consumption [19,21,22]. Previous experimental work regarding these systems also demonstrated an effect from primary diversity, whereby seagrass plots with higher genotypic richness recruited more abundant invertebrate communities and more diverse grazing communities were more effective at consuming epiphytic algae [23,24,25,26].
Seagrass ecosystems recently experienced significant global decline, with anthropogenic stressors being linked as the major drivers [27]. The complex interaction between seagrass, epiphytes and mesograzers is of particular interest as both nutrient enrichment and overfishing, two of the major anthropogenic stressors affecting coastal habitats [28,29], have strong cascading and direct effects on these interactions [30,31,32,33]. Experimental work on the seagrass–mesograzer interaction is strongly biased towards temperate systems, where seagrass meadows are generally monospecific [18,34]. Typically, tropical systems contain higher biodiversity than their temperate counterparts [35,36]. Work on herbivory was previously conducted in tropical seagrass systems, however the focus was generally on the effects of large herbivores, such as fish, turtles and dugong, as they are believed to play primary roles in structuring tropical and subtropical seagrass systems [10]. From the limited tropical studies available, the role of mesograzers in seagrass and epiphyte dynamics is unclear and may be confounded by the low epiphyte and mesograzer densities present at some study sites [17]. This leaves a critical gap to be filled exploring the role of mesograzers within these systems and how they interact with both the seagrass and the epiphyte communities [10].
This study aimed to identify the presence and drivers of the seagrass–mesograzer–epiphyte interactions within a tropical multispecies meadow. To do this, a paired manipulative experiment was deployed over a broad area within a tropical seagrass meadow. Grazer communities were perturbed via the introduction of an insecticide, intended to reduce the abundance and richness of invertebrates in manipulated plots compared to adjacent, unmanipulated control plots. Changes in epiphyte abundance were then recorded. It was hypothesised that this would increase the epiphytic algal biomass relative to control plots. Invertebrate and habitat assemblages were analysed to identify any structural changes caused by the experimental treatment. Generalised linear mixed models and path analysis were used to evaluate the primary drivers of assemblage structuring at each of the different trophic levels in the study system and the interaction pathways identifying how they operate as a whole. It was hypothesised that the epiphyte biomass within the system would be negatively correlated with grazer richness and that habitat richness would be positively linked with grazer abundances.

2. Materials and Methods

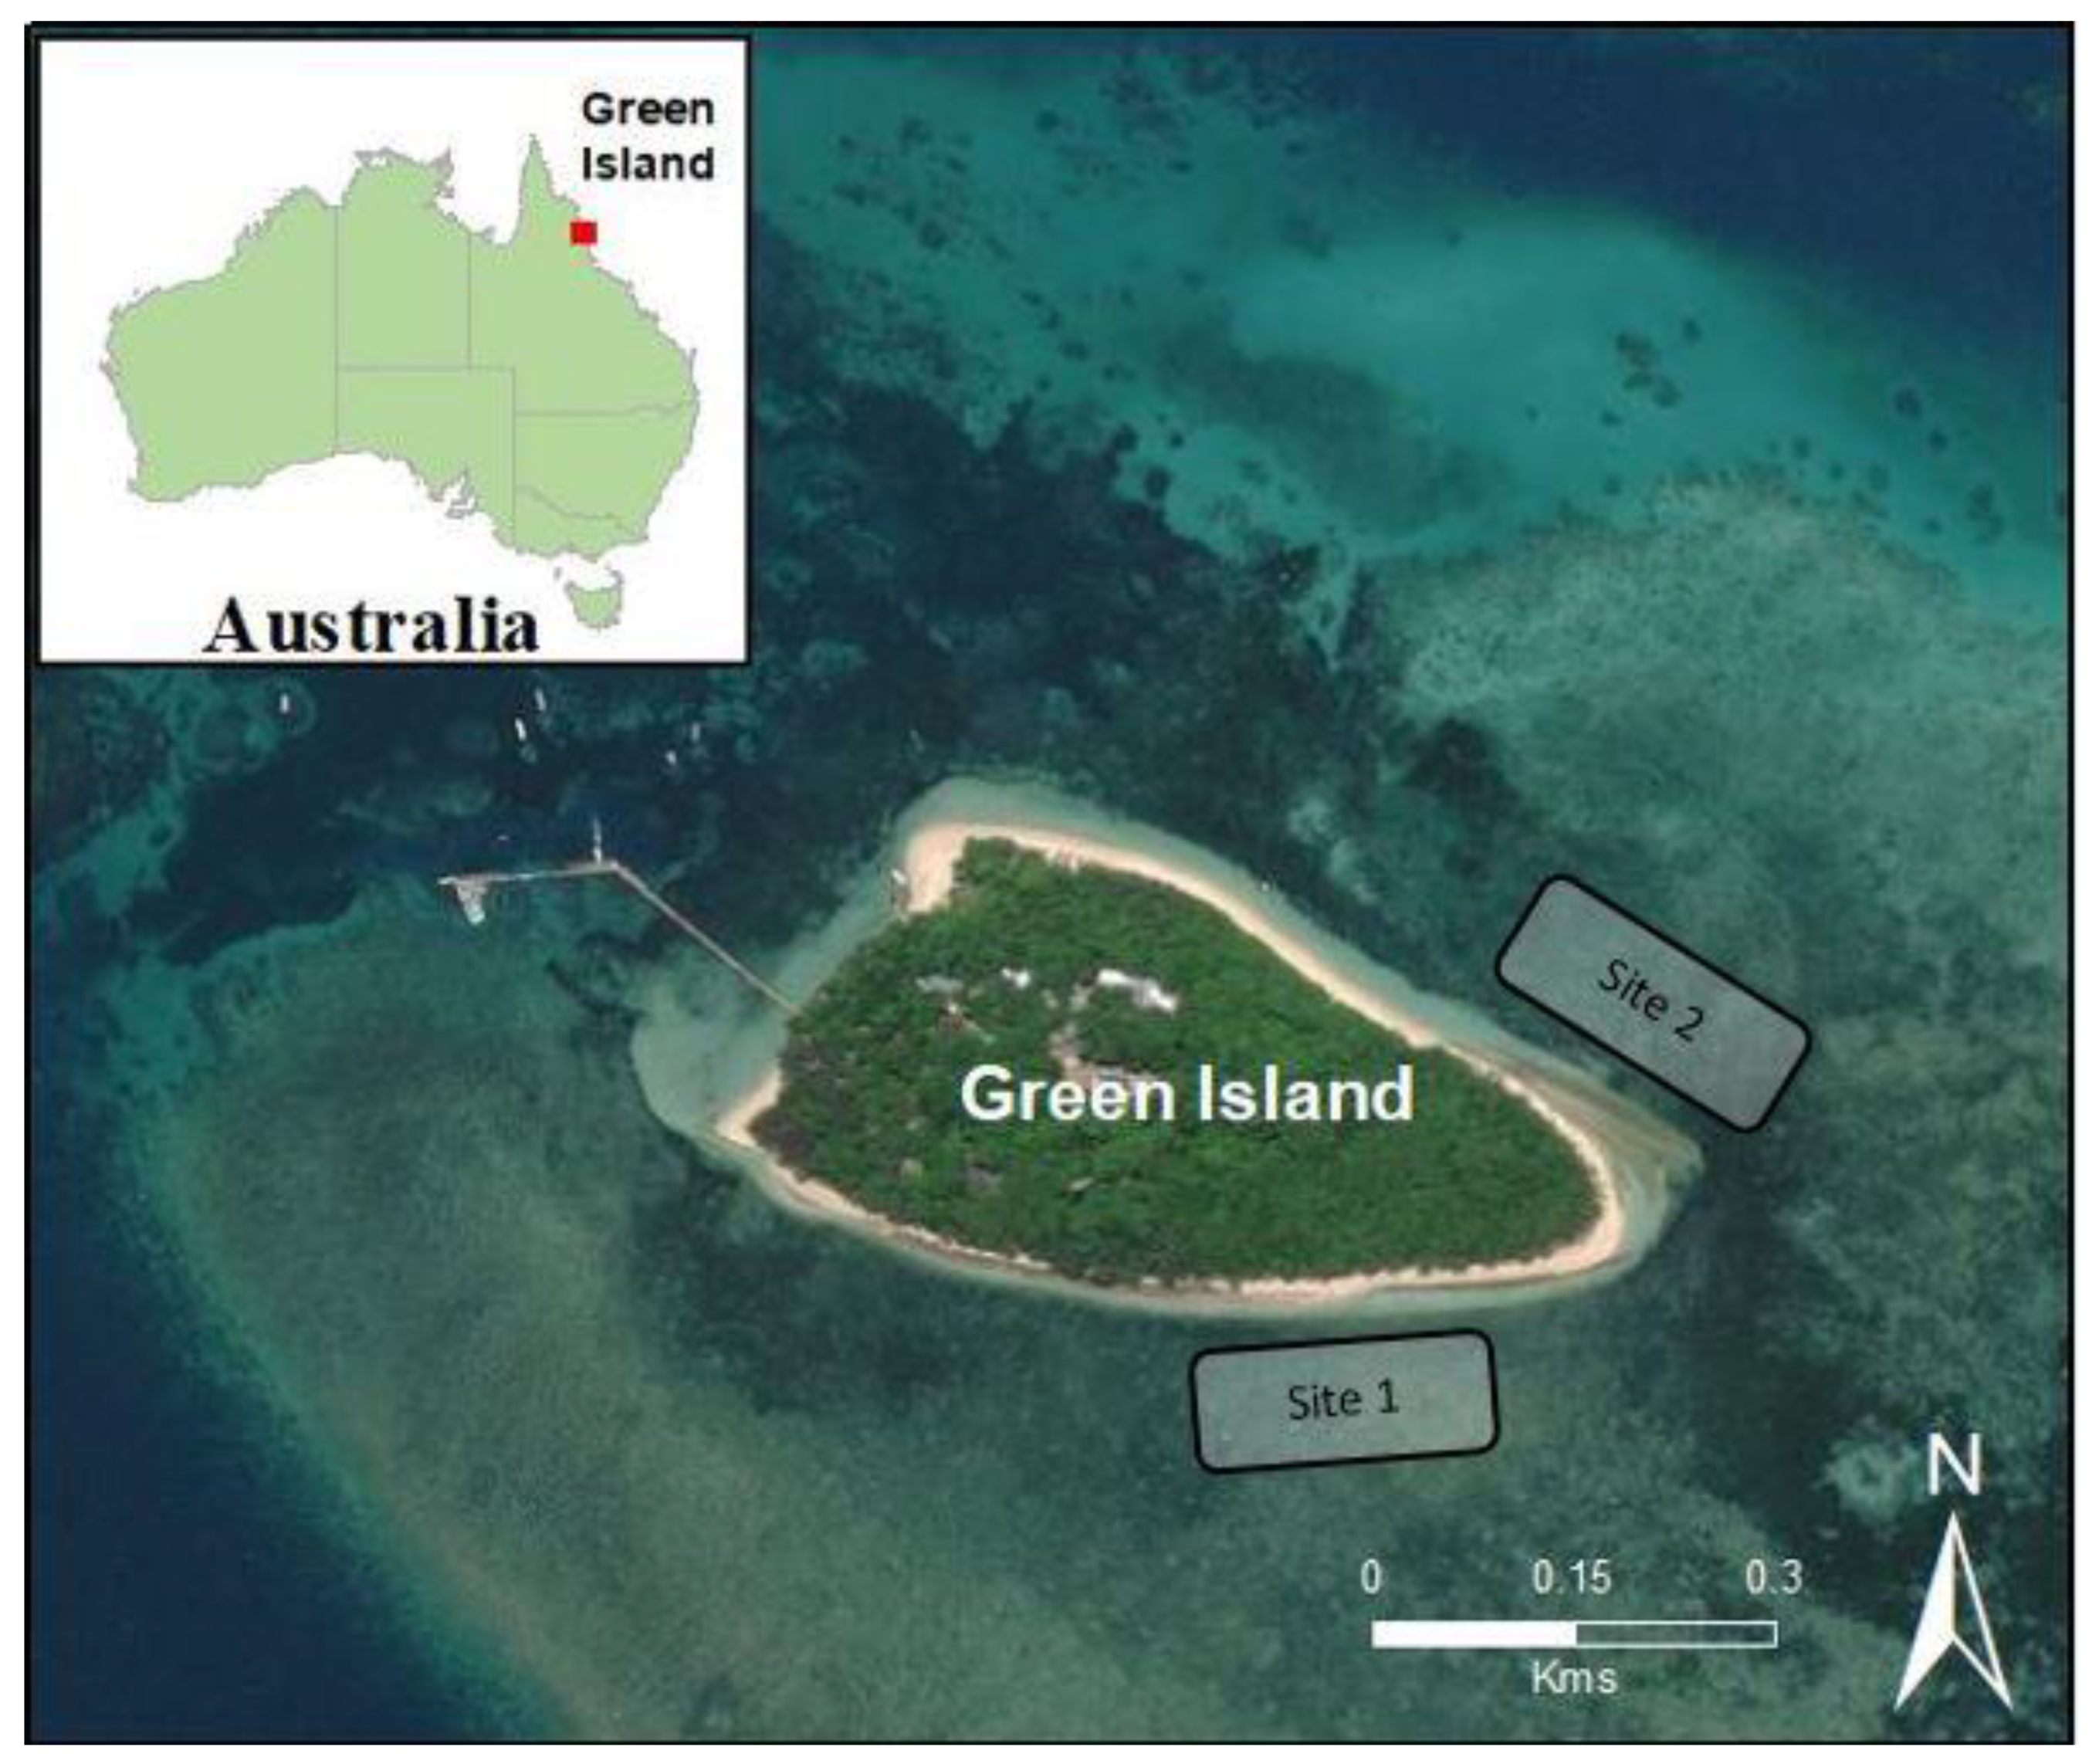
2.1. Site Selection and Experimental Design

The study was conducted at Green Island, located approximately 25 km northwest of Cairns, Queensland, Australia (~16°45′19.19″ S, 145°58′15.59″ E, Figure 1). The waters surrounding the island were first declared as a marine park in 1974 and, to this day, are incorporated and managed within the Great Barrier Reef Marine Park [37]. The island supports up to ten species of seagrass [38], six of which were observed within the study sites: Cymodocea rotundata, Cymodocea serrulata, Halodule uninervis, Syringodium isoetifolium, Thalassia hemprichii and Halophila ovalis. All of these species possess similar strap bladed growth form, with the exception of S. isoetifolium and H. ovalis, which are cylindrical and ovoid, respectively.
Two study sites were established in the intertidal, multispecies meadow on the north and southeastern edges of the island (Figure 1). Sites were selected in an attempt to incorporate as much of the natural variation in seagrass biomass and species composition as possible. Differences were present in both the seagrass and invertebrate communities between sites. Each site covered approximately 2.5 ha, and 11 paired plots were established within each site. Each paired plot included a control treatment and invertebrate reduction treatment (deterrent). Plots were defined by a 0.25 m2 quadrat, and pairs were spaced two meters apart to prevent treatment contamination [26]. Deterrent treatment was implemented by incorporating the degradable carbamate insecticide, Carbaryl, into a plaster matrix at ~7.6% w/w to form dissolvable blocks [39]. This treatment method was previously shown to be highly effective at reducing crustacean invertebrates within this 0.25 m2 treatment area [26]. In each plot, two blocks were pegged 50 cm apart within the seagrass meadow and positioned so that they were suspended at seagrass canopy height. Procedural control plots consisted of an identical arrangement of plaster blocks without insecticide. Based on pilot studies, treatment and control blocks were replaced every two weeks to ensure continuous delivery of insecticide. This study was conducted under strict permitting conditions from the Great Barrier Reef Marine Park Authority (Permit: G17/38934.1).

2.2. Sample Analysis

Experimental trials ran for six weeks between November and December of 2018. Upon completion, all aboveground biomass and associated invertebrate fauna were harvested from a 0.08 m2 area at the center of the treatment plot between the two plaster blocks by passing a sharpened metal plate beneath a 16 cm diameter PVC core at sediment level to sever all aboveground seagrass biomass and associated epiphytes and invertebrate fauna. The core was then inverted and the sample was drained and collected in a 500 µm sieve. All sample materials collected were frozen prior to sample analysis.
In the laboratory, all invertebrates were separated from plant biomass by rinsing the sample through a series of graduated metal sieves ranging from 1.4 mm to 500 µm. This resulted in all invertebrates, and any sediment, larger than 500 µm being grouped together for processing. Invertebrates were then removed and recorded manually using a microscope. Crustacean and gastropod taxa were recorded and stored in 70% ethanol. These taxa constitute the majority of the gazers within the system; this protocol was comparable to prior studies (see [19]). Epiphyte biomass was measured by manual removal from all seagrass leaf blades using a microscope slide, which was then dried at 60 °C for 72 h and weighed, recorded as grams dry weight (gDW). Plant materials, including both seagrass and macroalgae, were sorted into species, then dried and weighed (gDW).
From these data, several metrics were calculated to use in the models. Epiphyte biomass was standardised by the total aboveground seagrass biomass to obtain a relative measure of epiphyte abundance for each sample, namely, epiphyte load (gDW epiphyte. gDW seagrass−1). This metric was used in similar experiments [18,19] and found to be collinear with other seagrass metrics. e.g., surface area. Habitat (seagrass and macroalgae) richness (S) and diversity (Shannon–Wiener index (H′)) and invertebrate richness and diversity (H′) were also calculated (Table 1). Data is available at the Tropical Data Hub [40].

2.3. Statistical Analysis

Paired and two-sample t-tests were used to identify the effects of both site and application of the deterrent treatment on all variables measured. For the analysis of the invertebrate community composition, a species accumulation curve was generated to assess how well the sampling effort represented the true invertebrate community within the system studied using the vegan package [41] in the statistical software R [42]. Resampling methods were used to calculate expected community maxima and confidence intervals, against which observed estimates were compared. Ordination plots were then used to estimate similarities and differences in the invertebrate and habitat community between sites and between treatments.
The variables measured within this study form a complex theoretical interaction web separated into three levels (Table 1). The first and second levels represent the primary habitat (seagrass) and invertebrate community, respectively. For both habitat and invertebrate communities, we characterised three variables, namely, diversity (H′), species richness (S) and biomass (gDW). The third level was epiphytes, which was characterised by a single variable, i.e., epiphyte load (gDW·gDW−1). We characterised each interaction by generating a generalised linear mixed-effect model (GLMM), which included all variables from lower levels.

2.3.1. Model Selection

To remove unnecessary model complexity and avoid overfitting problems, a model selection process was performed to assess which of these variables should be included or removed from the final path analysis. As epiphyte load (gDW·gDW−1) was the primary response variable of this study, this was modelled first. Following this, model selection was undertaken using invertebrate abundance, richness (S) and diversity (H′) as response variables. Habitat variables were treated as predictor variables only within this system. This approach was considered the most appropriate, as the relatively short timeframe of the study meant that habitat variables were not likely to be impacted by the treatment effects due to the lag in growth responses of seagrass as a result of epiphyte pressures [19].
To identify the predictors of epiphyte load (gDW·gDW−1), we used a generalised linear mixed-effect model (GLMM), which was generated using the lme4 package [43] in the statistical software R [42]. ‘Site’ was included as a random factor to account for any nonindependence and possible differences in abiotic factors influencing the two study sites. All other measured variables (Table 1) were included as predictors within this ‘global’ model, except the deterrent treatment. Deterrent was excluded as it does not directly affect epiphyte growth and has an influence only indirectly via changes in the invertebrate community. Preliminary exploratory analysis of the variables [44] showed different ranges and distributions and, as such, all predictor variables were standardised using z-score transformations in order to allow for direct comparison of model coefficients.
Model fitting began by generating a single global model that included all response variables retained after the selection process described above. We used the dredge function from the MuMin package [45] to generate all possible model combinations from the global model. All models were then assessed based on Akaike’s Information Criteria corrected for small sample size (AICc) [46,47,48]. As the majority of the candidate models were very poor at explaining the data, a subset were selected using AICc Δ weights ≤ 3 [47], which were then averaged to obtain a final model that contained only those predictor variables and variable combinations that best described the data. This process was repeated to determine the predictor variables required to best describe invertebrate richness (S), diversity (H′) and abundance.

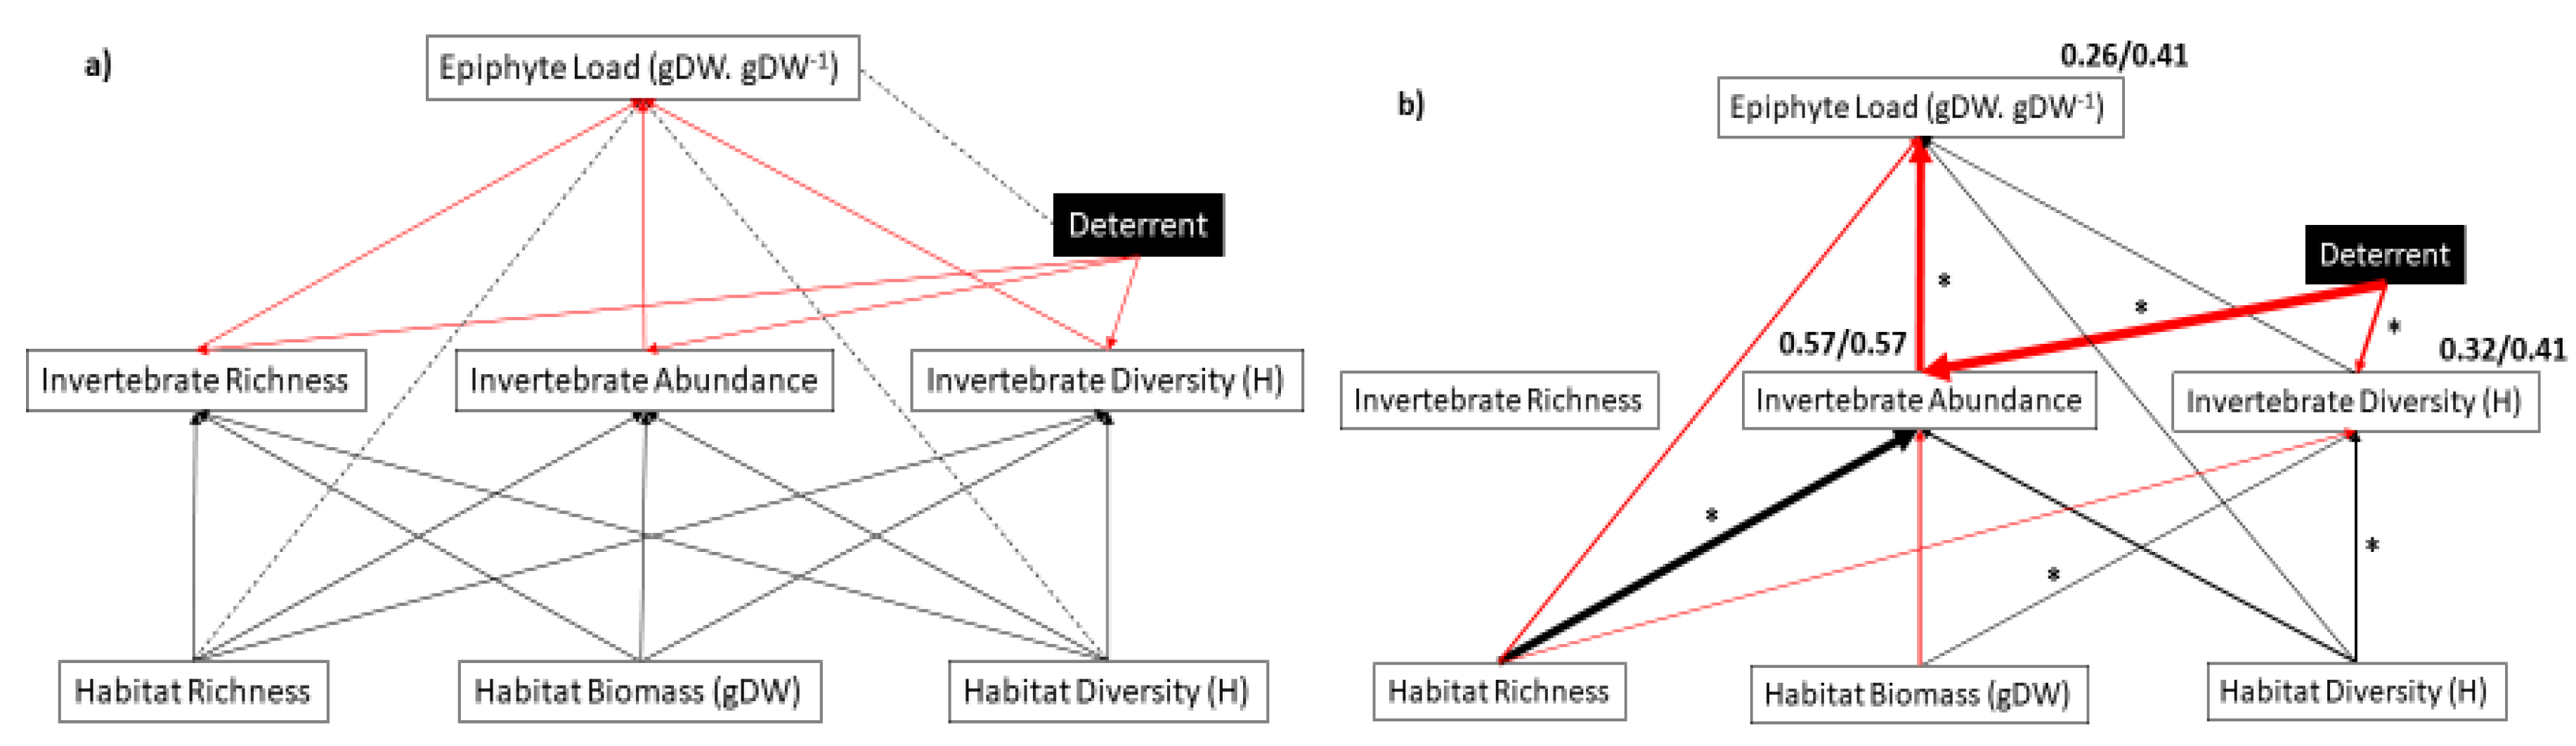
2.3.2. Path Analysis of Combined Interaction Web
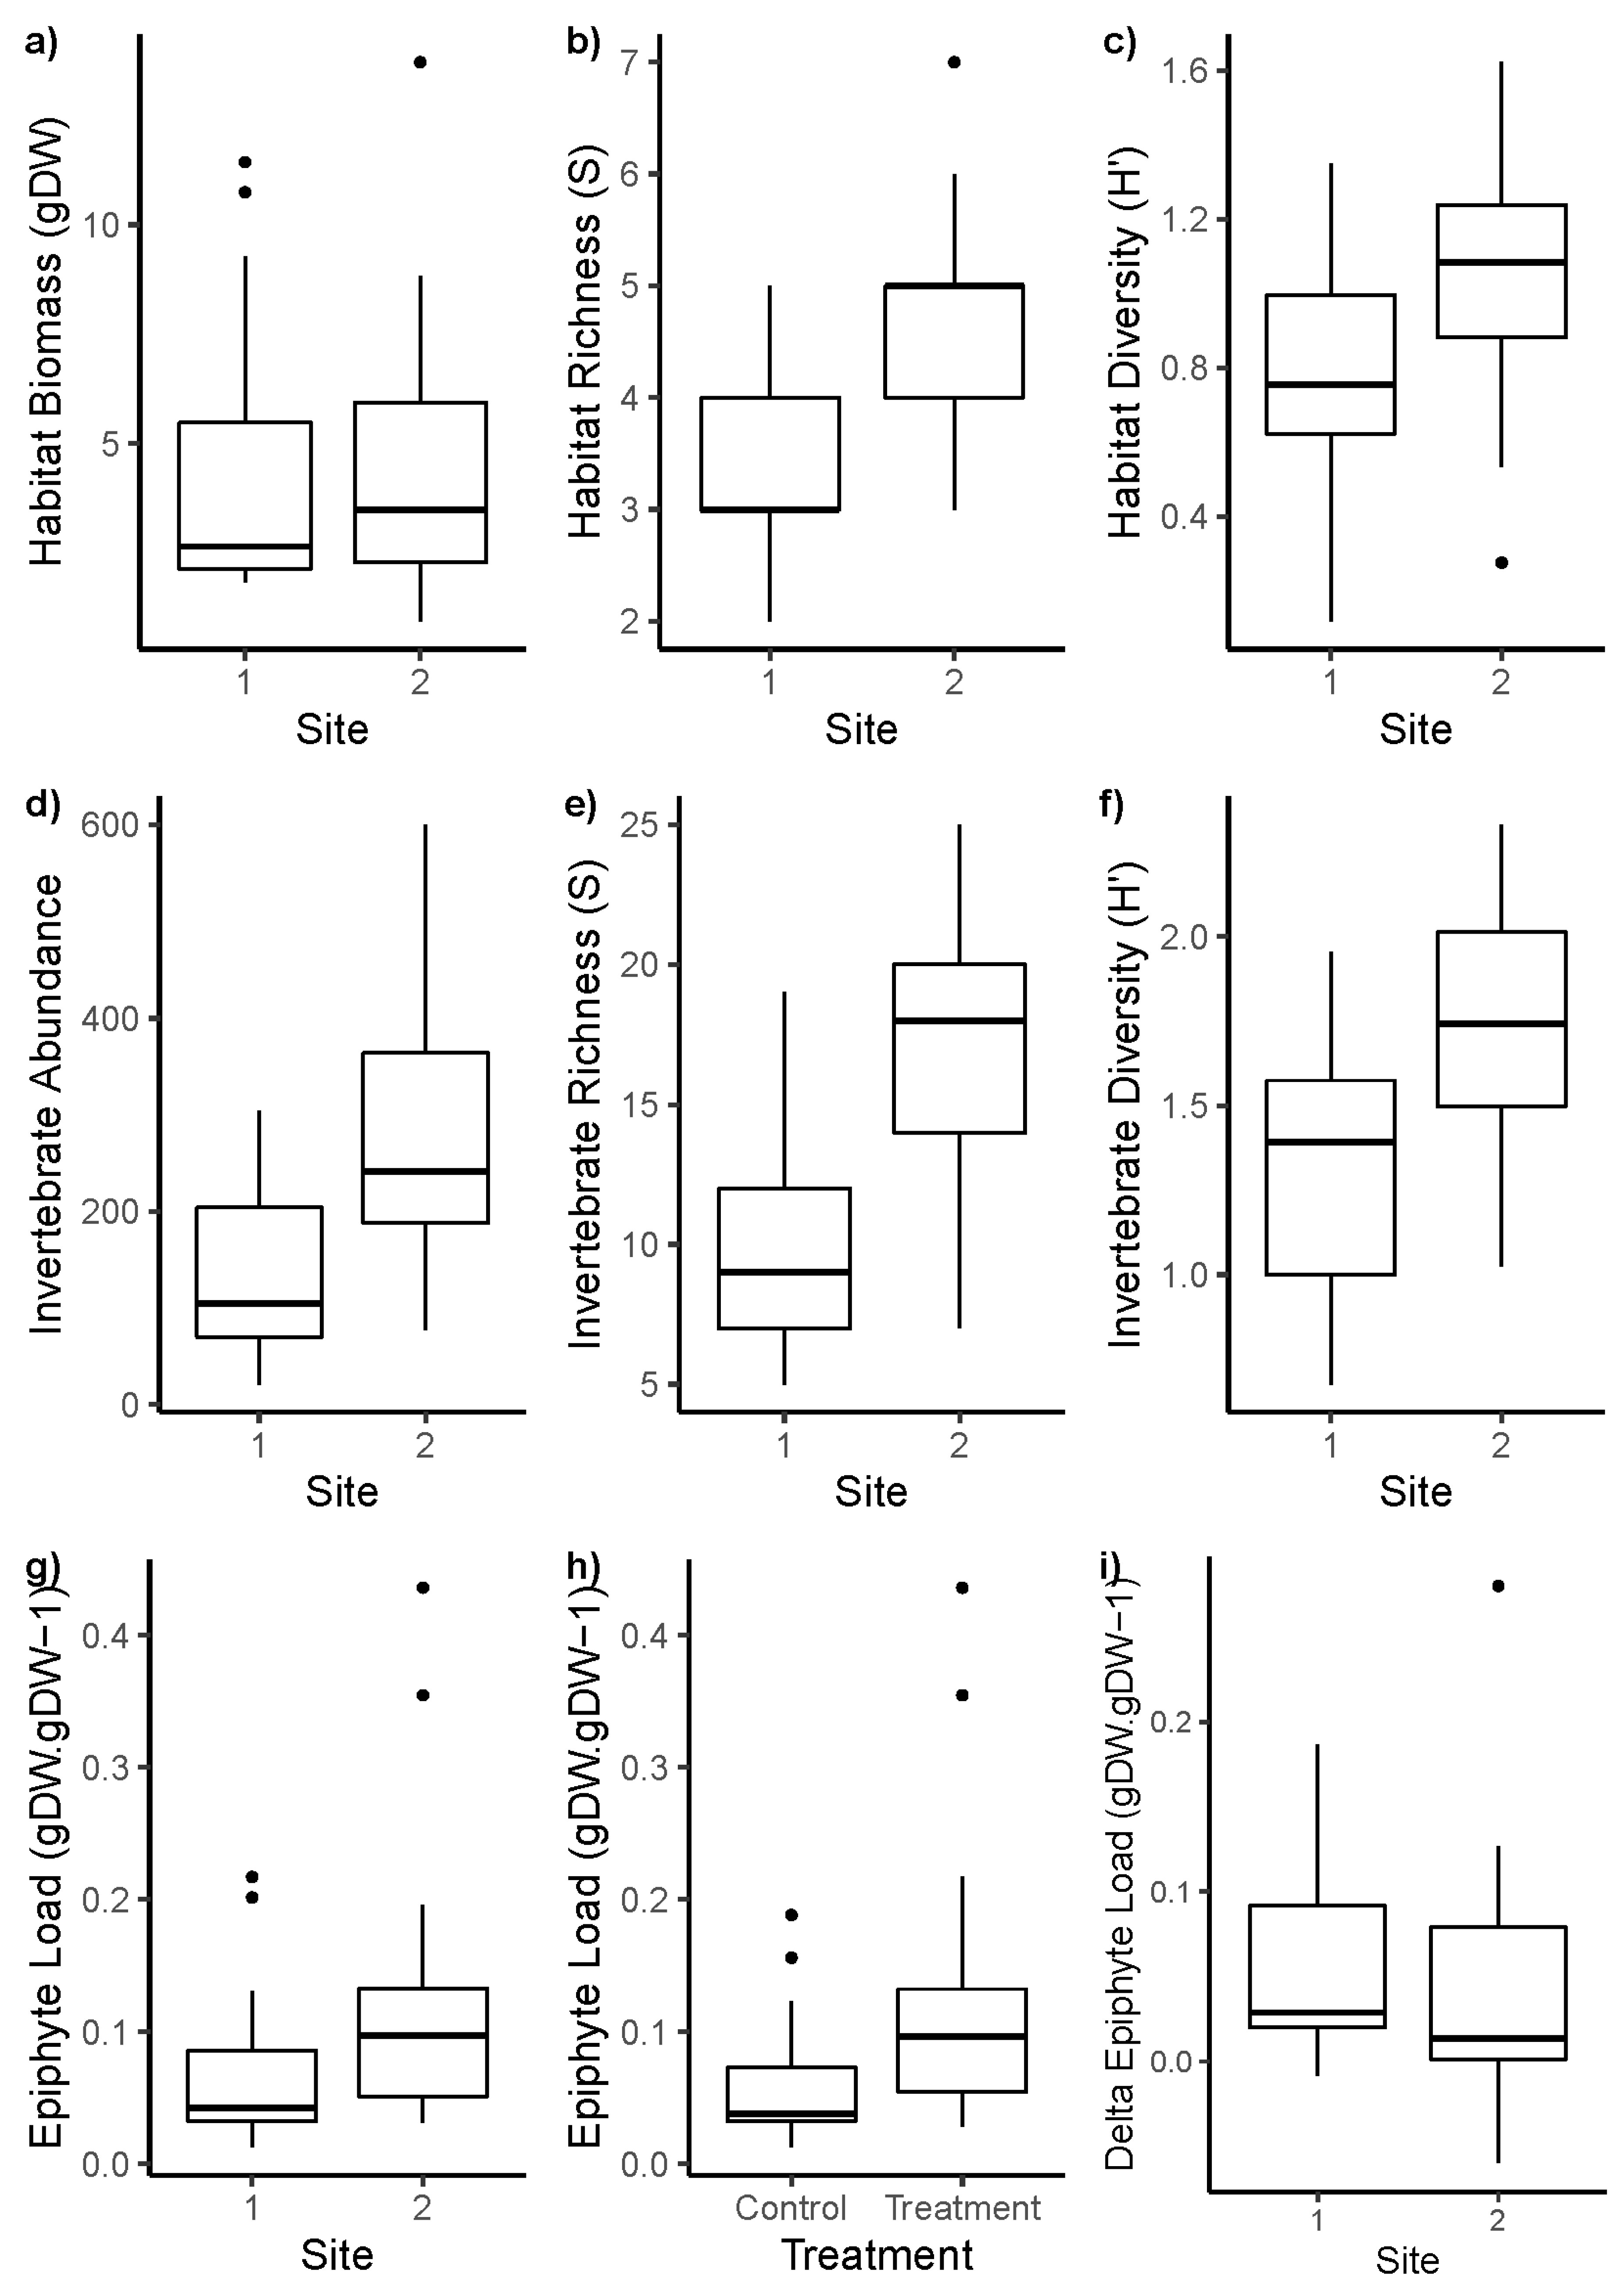
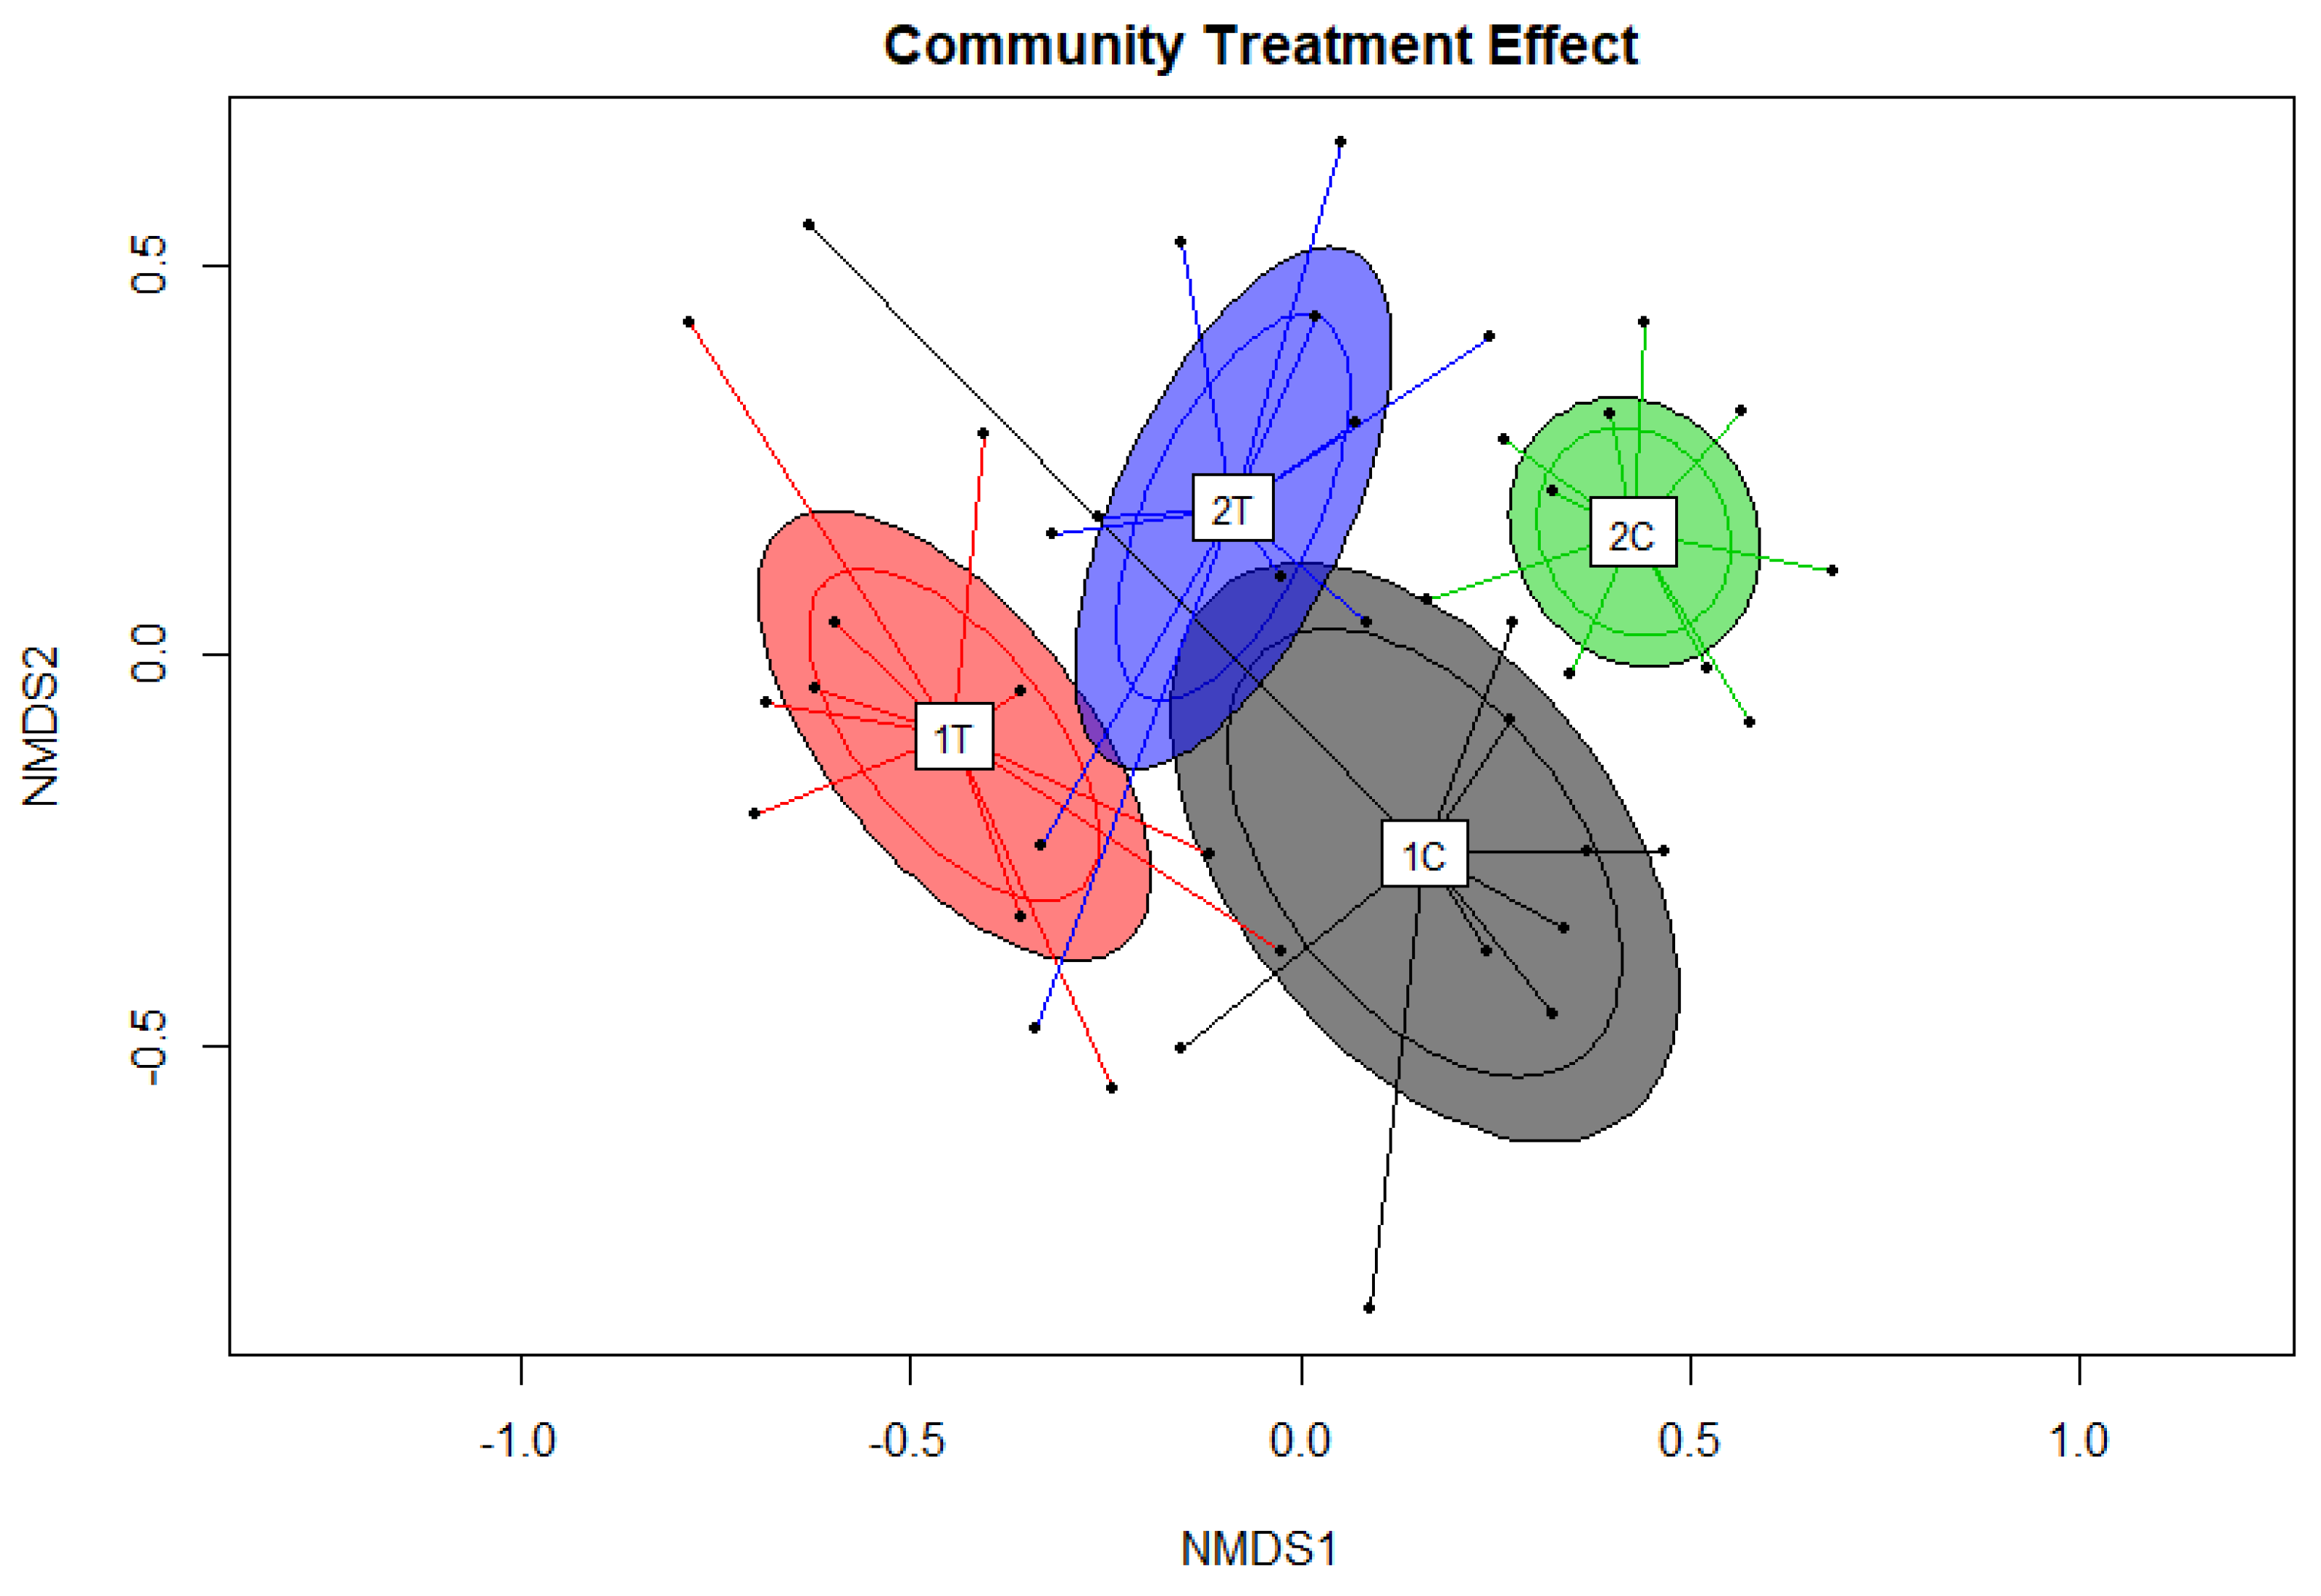
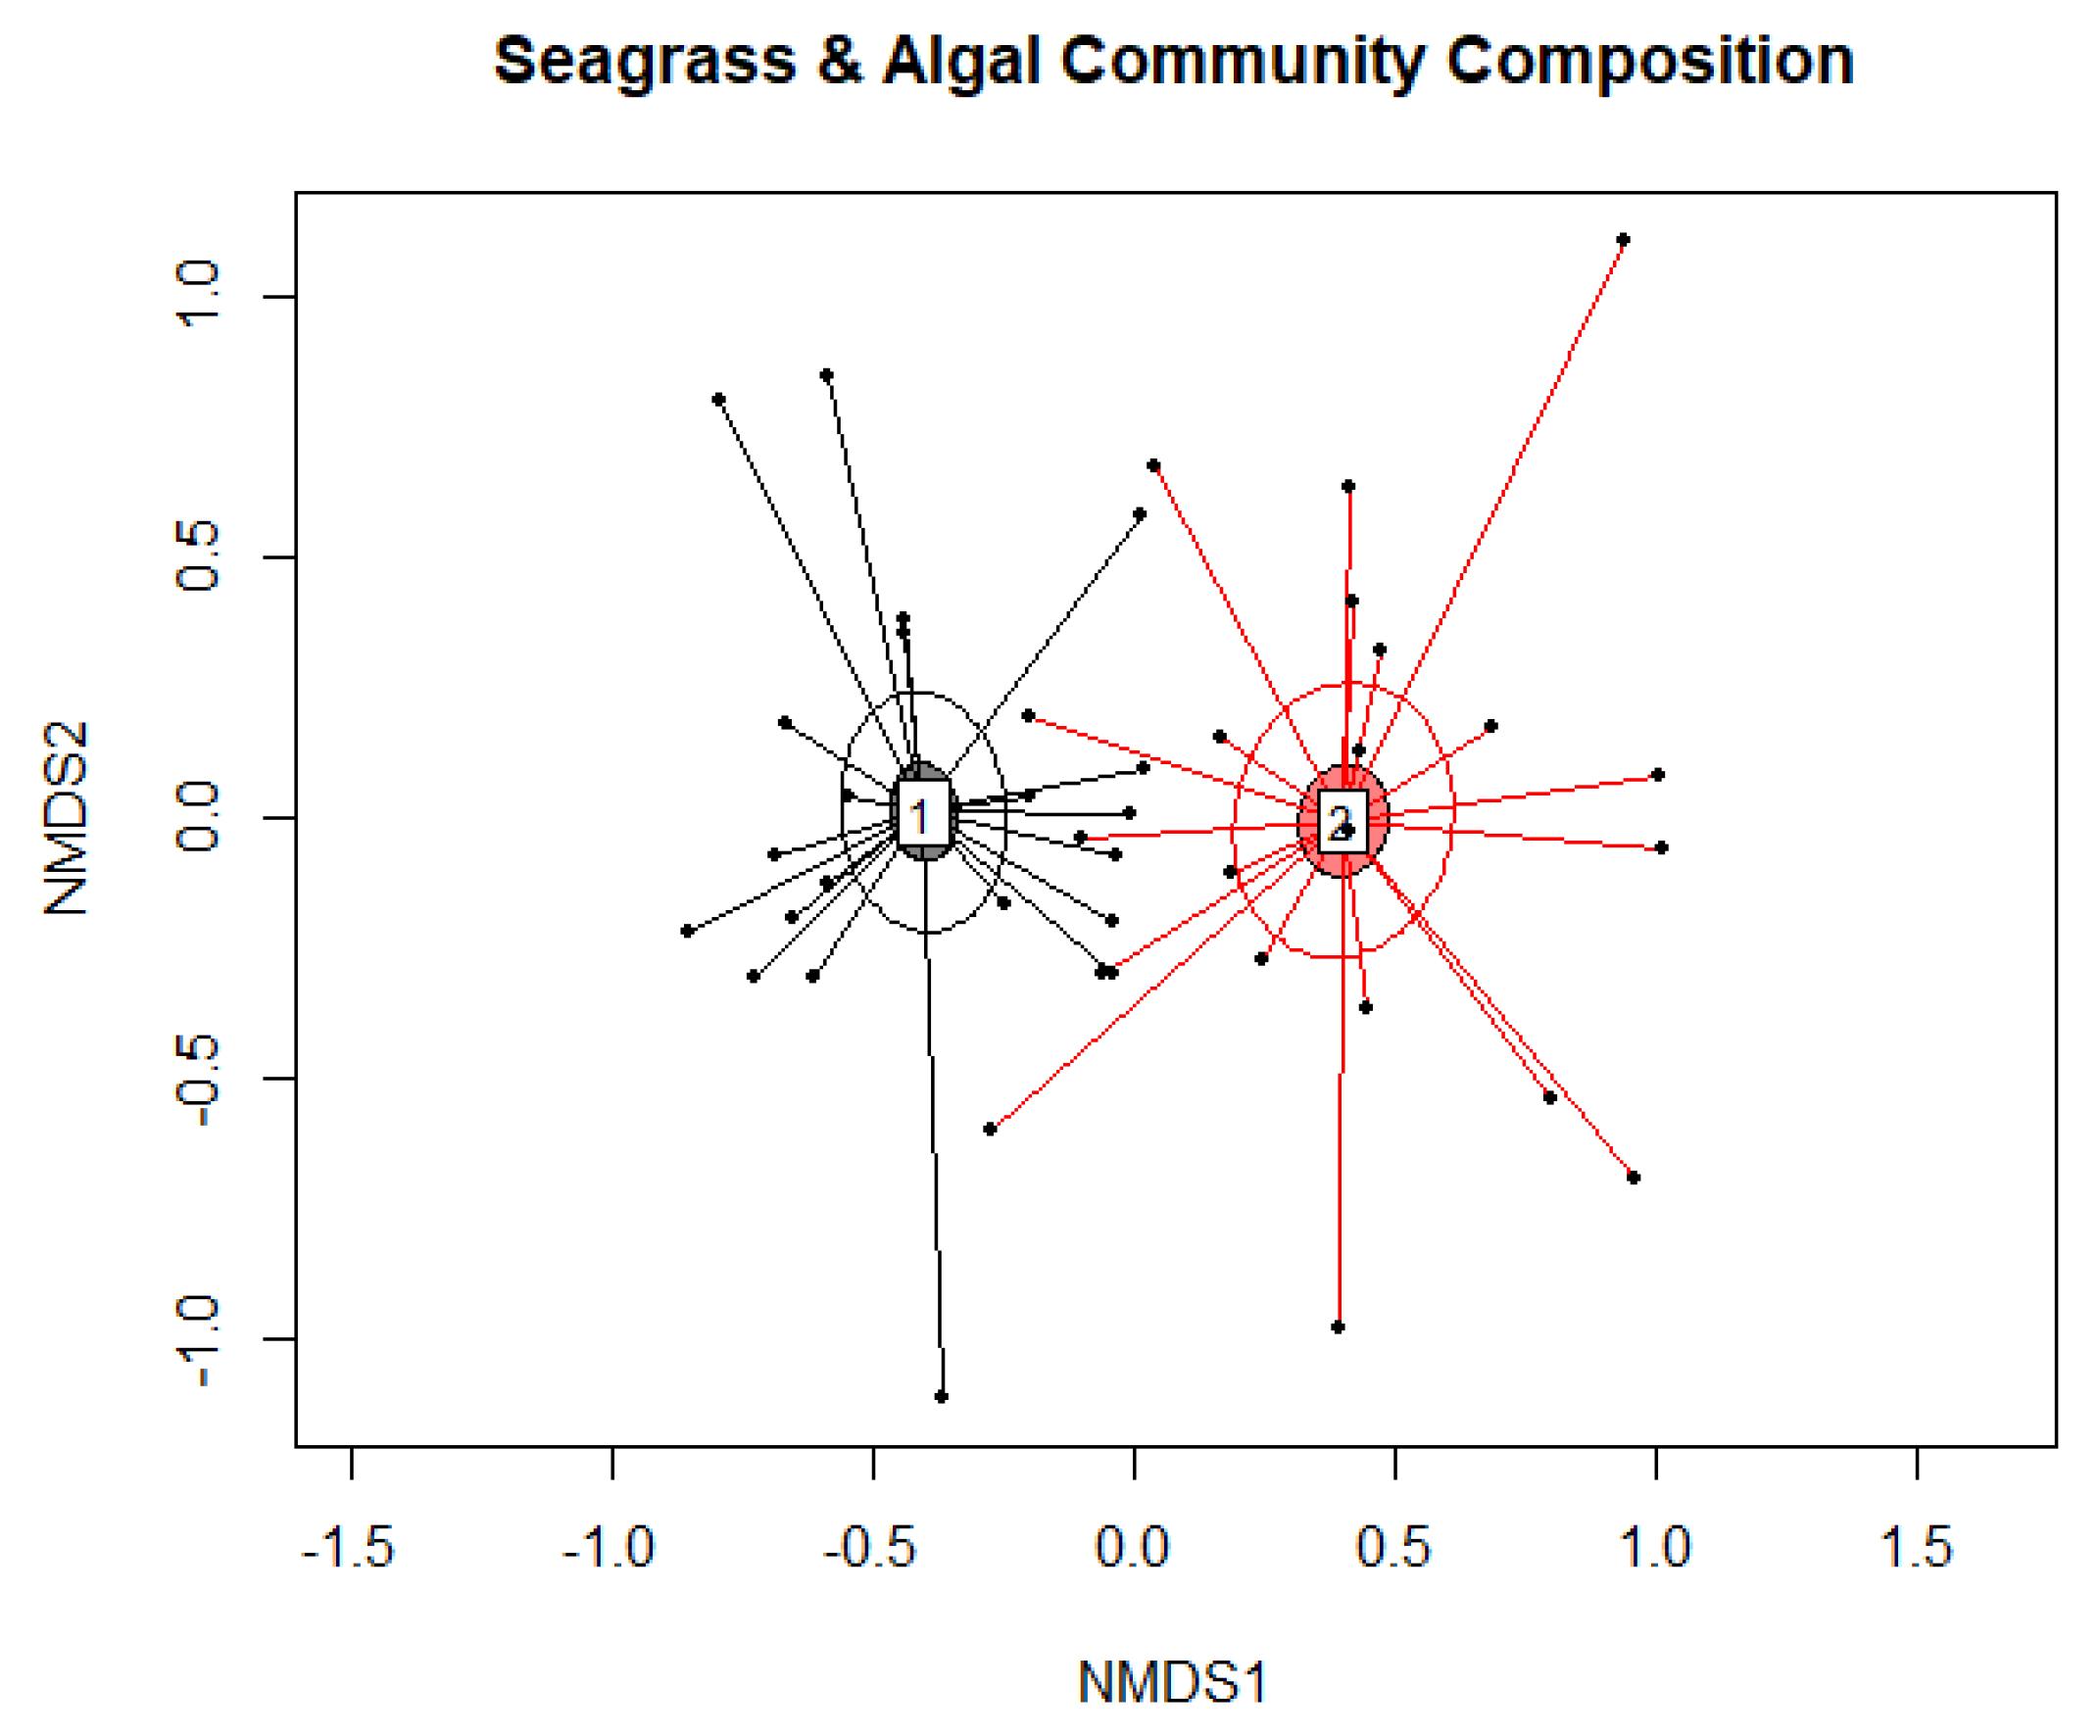
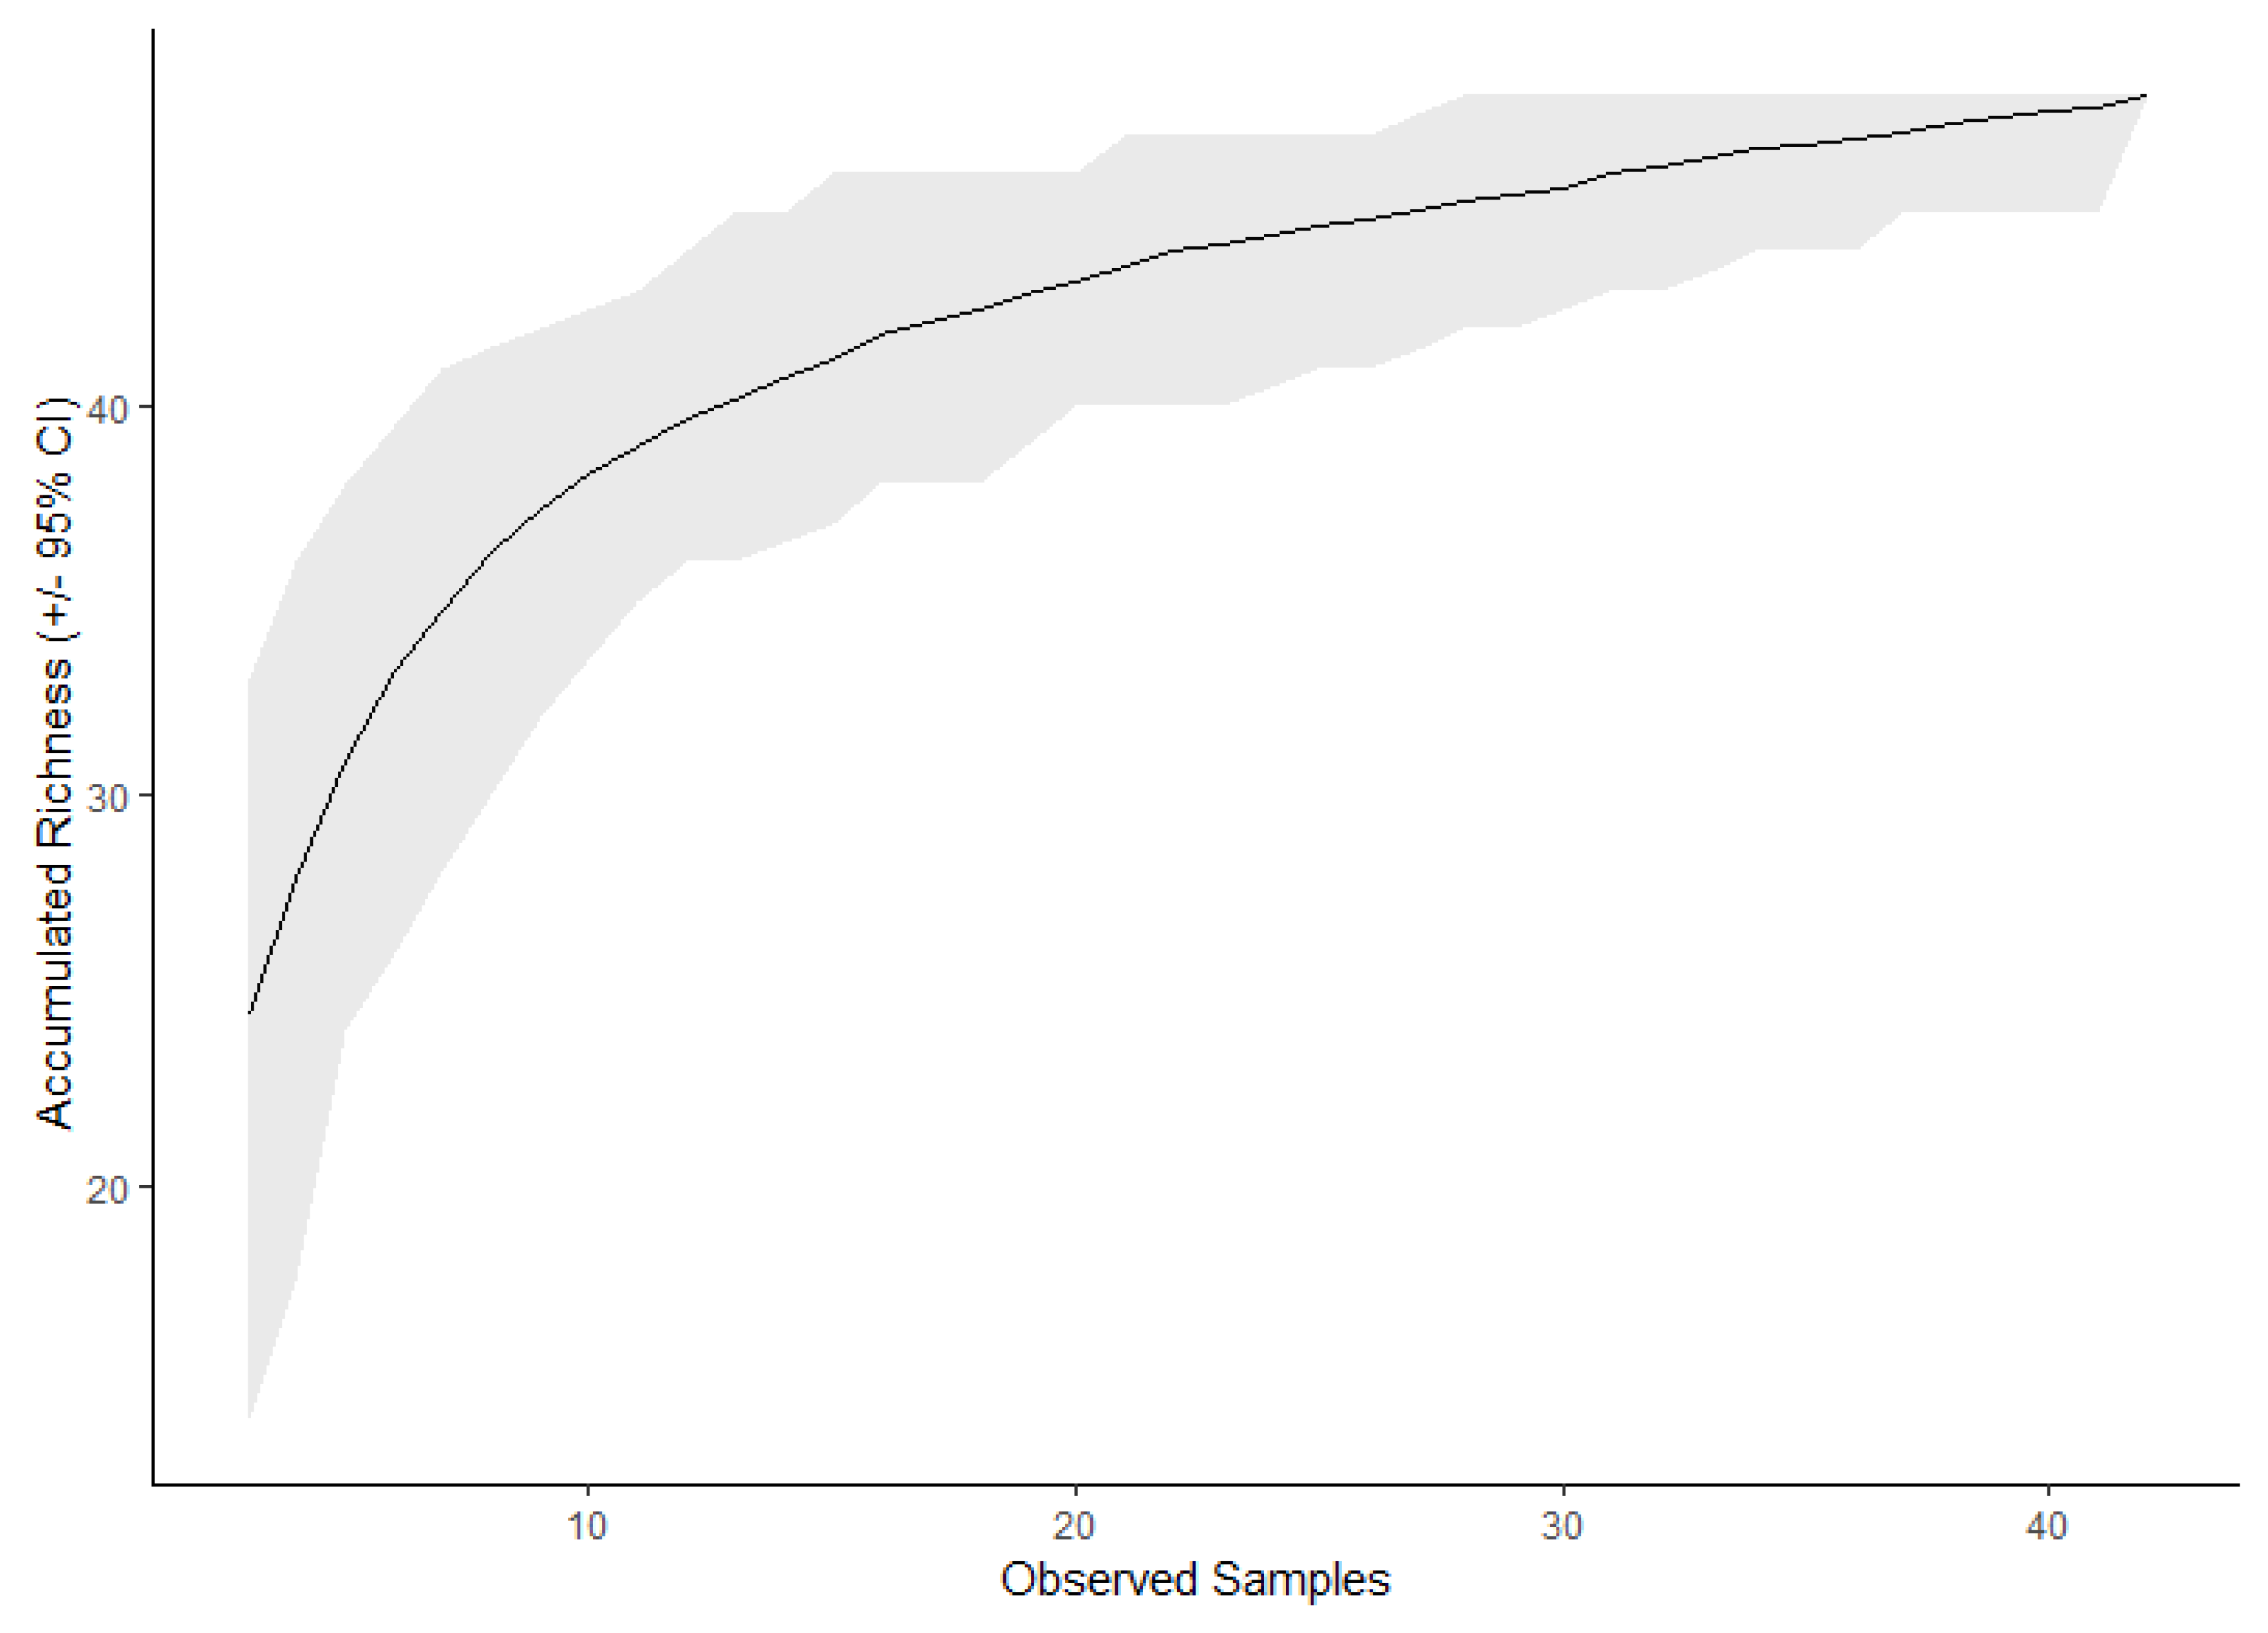
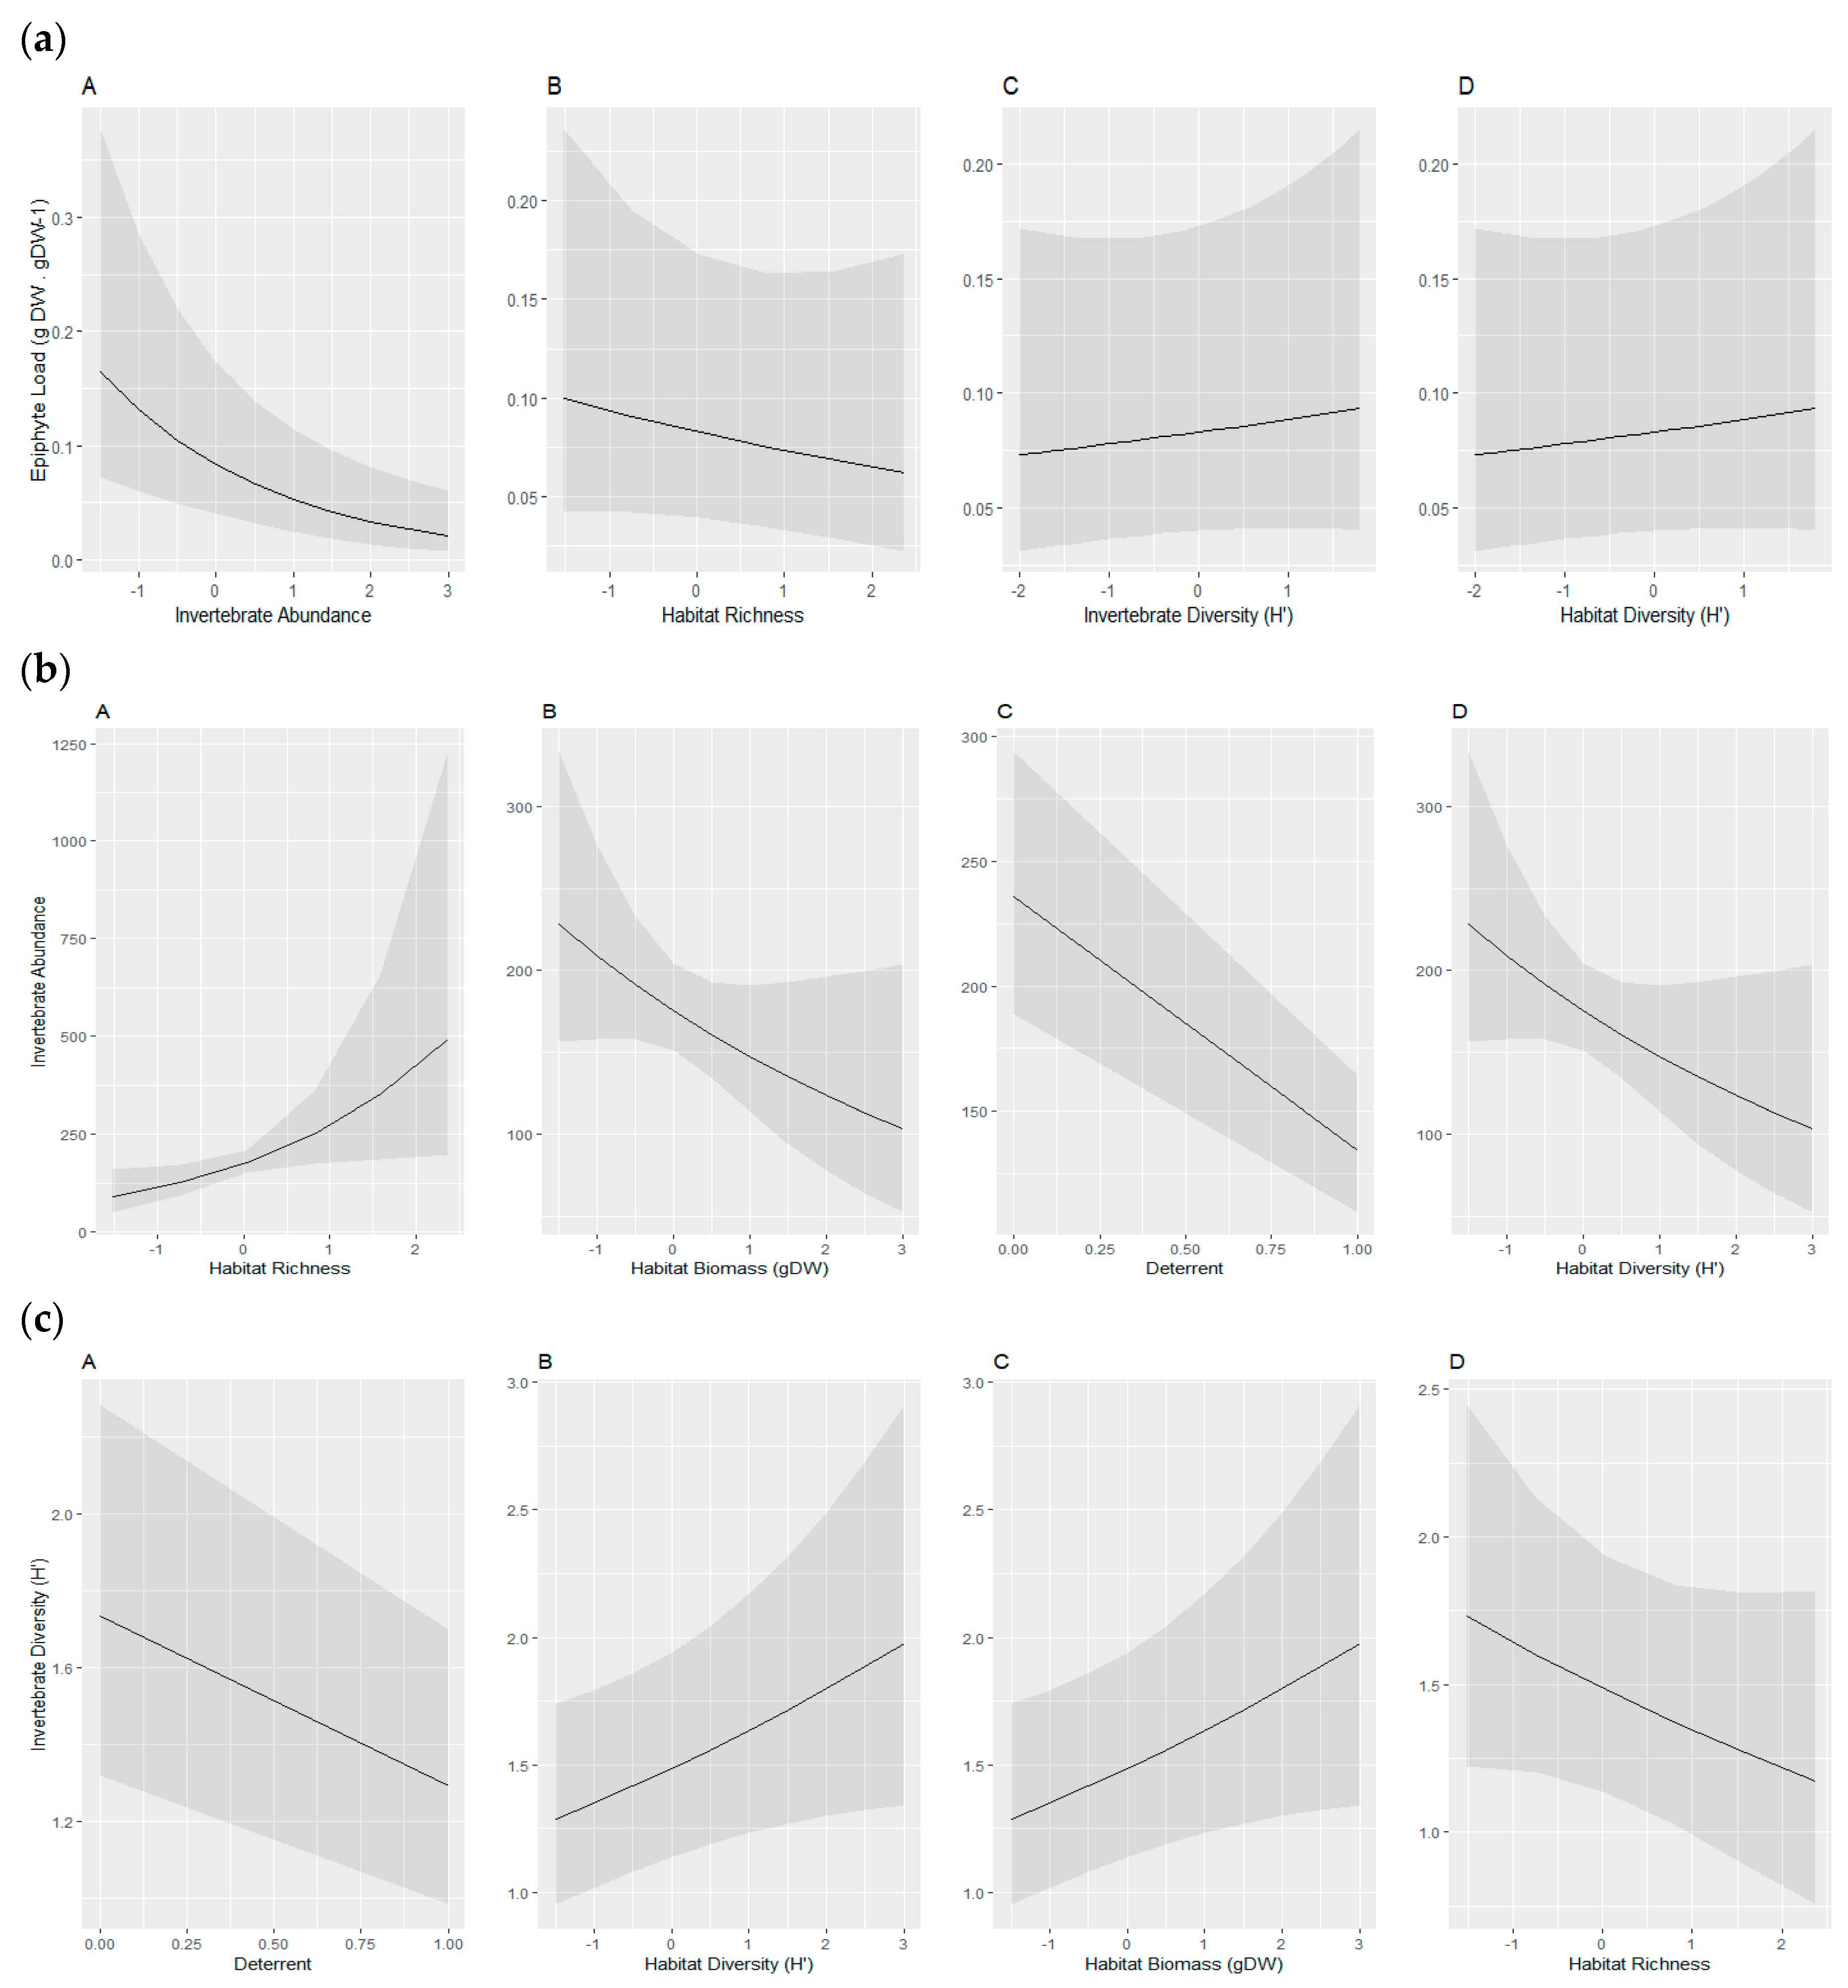
Based on the models identified above, the piecewiseSEM [49] package was used to perform path analysis to characterise the relationships and mechanisms deemed to be influential in describing the seagrass–mesograzer interaction within this system. Path analysis allows analysis of a complex set of causal interactions and estimates their direct and indirect effects on multiple response variables [50]. Constructing individual GLMM regression models prior to incorporation into a single interaction network allowed consideration of the unique variance, distribution and site differences of each response variable, which strengthened the overall model fit [22,50,51]. Validity of the individual paths within the model and overall model fit was tested using Shipley’s test for d-separation [51,52]. Both marginal and conditional R2 values were produced for each of the response variables. Marginal R2 values explain the variance in the response variable, which is explained by the predictor variables, whereas conditional R2 values incorporate the random factor, in this case, the amount of variance in the response explained by differences between sites [22].

3. Results

Differences in epiphyte load (gDW·gDW−1) were apparent between the two sites (t = −2.02, df = 30.6, p = 0.05), and a significant increase was seen with the application of the invertebrate deterrent treatment (t = −2.55, df = 29.9, p = 0.01) (Figure 2g,h). When the treatments were paired and the change in (delta) epiphyte load (gDW·gDW−1) was analysed, no site difference was seen (t = 0.39, df = 15.6, p = 0.7) (Figure 2i). This shows that despite differences between sites in other variables, the application of the deterrent treatment effected the epiphyte load (gDW·gDW−1) equally across sites. A significant increase in epiphyte load (gDW·gDW−1) (t = −2.94, df = 19, p = 0.008) was seen when the paired control and deterrent plots were averaged over the entire study, which equated to an 89% mean increase in epiphyte load (gDW·gDW−1).
Habitat analysis found differences between the two sites sampled, as expected from the site selection process. Across the sites, we found a total of five macroalgal species, two sponge species and six seagrass species. When comparing sites using two-sample t-tests (Figure 2a–c), no differences in habitat biomass were seen (t = −0.27, df = 40, p = 0.79), however, significant differences in mean habitat species richness (S) (t = −3.53, df = 38.4, p = 0.001) and diversity (H′) (t = −2.75, df = 40, p = 0.008) were found. Ordination analysis supported these findings, also showing differences in habitat composition between sites (See Appendix A, Figure A1) (p < 0.001, r2 = 0.5805, stress = 0.20). Two-sample t-tests also demonstrated that the application of deterrent treatment to the system did not affect the habitat biomass (t = −0.12, df = 40, p = 0.90), richness (S) (t = −0.01, df = 40, p = 0.99) or diversity (H′) (t = −0.44, df = 40, p = 0.66) when compared to control plots.
A total of 8404 individual invertebrates across 48 taxa were included in the analysis; Tenaidacea, Thalassinidae, Copepoda, Anthuridea and several Grammaridea taxa made up the majority of the individuals sampled, with low abundances across the rest of the taxa identified. Due to strict permit restrictions on insecticide use, the number of replicates used was limited, therefore a species accumulation curve (Figure A2) was produced. This showed species richness approaching an asymptote, suggesting nearly all species were represented by sampling despite variability between plots and sites. Resampling methods reinforced this, as the observed number of taxa fell within the confidence interval in three out of four of the resampling methods (Table A1). Invertebrate abundance (t = −3.76, df = 33.5, p < 0.001), richness (t = −5.11, df = 38.4, p < 0.001) and diversity (H′) (t = −3.50, df = 39.9, p = 0.001) were all seen to be significantly higher in Site 2 compared to Site 1 using two-sample t-tests (Figure 2d–f). Significant decreases in invertebrate abundances (t = 2.44, df = 19, p = 0.02), richness (t = 5.32, df = 19, p < 0.001) and diversity (H′) (t = 3.83, df = 19, p = 0.001) were seen when comparing control to deterrent treatment plots using paired t-tests. Ordination analysis showed significant differences between Site 1 and Site 2, control plots and treatment plots (Figure 3), indicating that all four groups had significantly different centroids (means) in the invertebrate communities sampled (p < 0.001, r2 = 0.5021, stress = 0.21).
Changes in invertebrate richness were highly collinear with invertebrate abundance and diversity (H′). As such, all three could not be included in the model explaining epiphyte load (gDW·gDW−1) without significant variance inflation. Invertebrate richness was identified as the worst performing variable and was subsequently removed, thereby reducing the variance inflation factor to acceptable levels and leaving invertebrate abundance and diversity (H′) in the model. Habitat biomass was also excluded as it was a measure from which epiphyte load was derived, therefore these two variables were strongly collinear. The final epiphyte model included invertebrate diversity (H′), invertebrate abundance, habitat diversity (H′) and habitat richness (S), with site as a random factor, all of which were included after model averaging (Table 2a). Of these, only invertebrate abundance and site were included in all final subset of models, and displayed the strongest coefficient values (−0.46 and −2.49, respectively, Table 2a). Path analysis showed invertebrate abundance to be the primary driver of epiphyte load (gDW·gDW−1), with marginal and conditional R2 values of 0.26 and 0.41, respectively (Figure 4b). The differences in these values reflected the effect that site had on epiphyte loading within the system (Figure 2g). Habitat richness (S), habitat diversity (H′) and invertebrate diversity (H′) all only appeared in a single candidate model and showed weak coefficient values (all < 0.1), and were therefore not considered to be primary drivers in path analysis (Figure 4b).
As the epiphyte model only contained two invertebrate variables (abundance and diversity (H′)), only these two variables were modelled. Habitat variables important in determining invertebrate abundance and diversity included; habitat biomass (gDW), habitat diversity (H′), habitat richness (S) and deterrent (Table 2b,c), again with site included as a random factor. The invertebrate abundance model showed a strong coefficient for site (−5.46, Table 2b), however, path analysis showed that this had little explanatory power when modelled within the system as a whole, as both the marginal and conditional models resulted in R2 values of 0.57 (Figure 4b). Deterrent treatment had a strong negative influence on the abundance of invertebrates (−0.55), and habitat richness (S) displayed the strongest positive coefficient (0.45) of all the habitat variables. As such, both were identified as primary drivers in path analysis. Of the remaining treatments, habitat biomass and habitat diversity (H′) were both positively linked to invertebrate diversity (H′) (Table 2c, 0.06 and 0.07, respectively), while habitat richness (S) displayed a minor (−0.01) negative influence on invertebrate diversity. The application of the deterrent treatment exhibited a strong negative impact on invertebrate diversity (H′) (−0.28). Including site as a random factor was also shown to explain some of the diversity within the system, as shown by the increase from a marginal to conditional R2 of 0.32 to 0.41.

4. Discussion

This study found that the invertebrate assemblages within Green Island’s multispecies seagrass meadow play a significant role in reducing epiphyte loads within the system. Despite differences in both the seagrass and invertebrate assemblages between sites, consistent increases in epiphyte load (gDW·gDW−1) were seen after application of the invertebrate deterrent treatment (Figure 2h). On average, epiphyte load (gDW·gDW−1) increased by 89% between control and treatment plots, which was slightly higher than the effect found by Campbell [10] in subtropical and tropical seagrass meadows. This was shown to be much lower than in temperate systems, where up to six-fold increases in epiphyte biomass were reported [18,26].
Differences in primary producer communities were seen between sites, primarily due to the inclusion of more opportunistic seagrass species, such as Halodule uninervis and Halophila ovalis at Site 2, as a result of increased natural levels of disturbance of the areas rather than as a result of any experimental effects manipulating the invertebrate community. This difference in primary habitat composition may have been the cause of the difference in invertebrate assemblages between the sites. Differences in seagrass meadow structural complexity and composition were shown to affect invertebrate assemblages in other studies, suggesting that niche partitioning causes different taxa to thrive in unique areas within a system [53,54]. Others did not find this to be the case, suggesting seagrass structure within a meadow has no effect due to the mobility and rapid life histories of mesograzers [55,56]. Natural spatial variation within the invertebrate communities or differences in abiotic factors may also have driven this dissimilarity between sites.
Invertebrate abundance was identified by pathway analysis as the primary driver controlling epiphytic loads within the system (Figure 4). Direct competition between the seagrass habitat and epiphytes was also apparent, as highlighted by the negative term between habitat richness and epiphyte load. This was expected, as seagrasses, macroalgae and microalgae all compete for, and utilise, the same light and nutrient resources within the system [56,57]. One extension of this current study would be an experimental design capable of linking the epiphyte loading to the biomass and species composition of the habitat, exploring these competitive effects, also seen in other systems, in more detail [58].
The positive link between invertebrate diversity and epiphyte load (gDW·gDW−1) suggested that not all invertebrate taxa identified were consuming epiphytes (Appendix C). Copepoda, Tanaidacea and Grammaridea formed the majority of invertebrates identified. All of these crustacean groups were reported as mesograzers in other studies [22,59], although there are potentially a variety of functional roles occurring within each group [60,61]. The strong negative interaction term between invertebrate abundance and epiphyte load suggested the same is true for Green Island. These taxa are also known to have varied diets, so may not all feed exclusively on epiphytes or may be specific in the types of epiphytes they consume [60]. Future studies using selective removal or molecular marker analyses could help to confirm this hypothesis by identifying the dietary preferences of the most abundant invertebrate taxa. Stable isotope ratios of carbon (δ13C), nitrogen (δ15N) and sulphur (δ34S) from animal tissue could be compared with those of likely food items (e.g., seagrass leaves, epiphytes, macroalgae, seston, microphyobenthos) using mixing models to determine the relative contributions of each source to their diet [62,63]. Combining this with analyses of the fatty acid composition of key consumers and looking for biomarkers of major food sources increases the predictive power for identifying their dietary components [64,65]. Given the evidence we found to suggest this is the case in tropical systems, we highlighted the need to develop a more detailed understanding of niche partitioning and feeding habits of mesograzers within these seagrass communities. Identifying the key taxa within them would also be beneficial for the potential for faunal communities to be used as bioindicators in seagrass monitoring efforts [66].
The positive link between invertebrate diversity and epiphyte load also indicated that predatory species were likely included within the invertebrate community samples. This point was supported by the inclusion of small crabs and shrimp, which are often thought to be predatory in seagrass systems, and therefore used in experimental work [22]. Due to limited taxonomic information surrounding the invertebrate communities in tropical seagrass in the region, we restricted analyses to include broad taxonomic groups within crustaceans and gastropods, identifying individuals to the highest resolution possible with the keys and literature available before separating them into taxa based on morphology. As species functional information increases in future, greater refinement in taxonomic classification according to feeding guild is expected to bring greater precision to studies similar to this.
The richness of primary producers (seagrass and macroalgae combined) was positively linked and the main driver of invertebrate abundance within the system (Figure 4b). Habitat diversity (H′) showed a similar, but weaker, influence. As seagrass and macroalgae were not partitioned in the analysis, their individual effects could not be derived, however, the positive linear relationship among primary producers suggested that macroalgae may also play a contributing role in determining the structure and composition of invertebrate communities within seagrass meadows. A recent meta-analysis showed that secondary foundation species (e.g., algae species nested in seagrass beds) enhances the richness and abundance of associated organisms living in the habitat greater than primary foundation species alone [67]. Diversity of primary producers was previously identified as the driver of invertebrate communities [19], showing that increased genotypic richness within monospecific Zostera marina meadows recruited more abundant invertebrate communities. This study suggested that increased invertebrate biomass was linked to the availability of a genotypically varied diet [54]. The multispecies habitat assemblages of our study site and other tropical seagrass habitats also provide a more heterogeneous living environment for invertebrate communities than low-diversity assemblages, thereby greatly increasing the available niche space for individuals in conjunction with providing a more complex environment to avoid predation [68,69,70]. The outcome of this is more abundant and species-rich invertebrate assemblages are able to coexist within the system.
These results were similar to general trends reported from analogous studies in temperate areas [23,24,25,26]. Strong evidence suggests that the diversity of primary producers affects the invertebrate community positively, as seen across both the tropics and temperate areas. Similarly, top-down control of epiphytic algae by marine invertebrates is an important aspect of seagrass ecology in general. In temperate systems, the seagrass–mesograzer interaction was shown to buffer seagrass systems against low to medium levels of nutrient loading [59,71], resulting in a net increase in both primary and secondary productivity [23]. These findings are unlikely to be universal for all tropical seagrass meadows, however, where there is great diversity in meadow form and associated ecology and trophic interactions. Understanding the varying response across different seagrass meadows and determining the potential for this interaction to buffer or ameliorate the effects of nutrient loading is an important next step regarding tropical systems. While not investigated in this study, our results suggest this ability to operate. This should be a priority for future studies, as eutrophication associated with coastal development and agriculture is a major risk leading to seagrass loss both in the tropics and globally [27,72].

Author Contributions

Conceptualization, L.H., P.H.Y., W.E. and M.A.R.; methodology, L.H., W.E. and P.H.Y.; formal analysis, L.H. and W.E.; investigation, L.H.; writing—original draft preparation, L.H.; writing—review and editing, P.H.Y., W.E. and M.A.R.; visualization, L.H.; supervision, W.E., P.H.Y. and M.A.R.; project administration, L.H.; funding acquisition, M.A.R. and P.H.Y. All authors read and agreed to the published version of the manuscript.

Funding

This research was funded by the Australian Research Council, grant number LP160100492.

Acknowledgments

The authors would like to thank Danica Lennox-Bulow and Olivia Rowley for their assistance in the field and collecting samples, and Abbi Scott for her assistance in the laboratory.

Conflicts of Interest

The authors declare no conflict of interest.

Appendix A

Figure A1. Ordination plots of seagrass and macroalgal community between sites at Green Island. Ordination showed significant community differences between Site 1 and 2 (p < 0.001, R2 = 0.5805, stress = 0.20). Individual samples are denoted by black dots, which are connected to their respective centroids. Lower and upper 95% confidence intervals (shaded area) for each centroid are also shown.
Diversity 12 00384 g0a1

Appendix B

Species accumulation curve (Figure A2) and resampling methods (Table A1) used to validate the sampling effort undertaken in the study. We found the observed number of taxa approaching an asymptote and falling within the confidence interval of the predicted number of taxa with three out of the four resampling methods used. This was done using the vegan package [43] in the statistical software R (R core team 2016).
Figure A2. Species accumulation curve (±95% CI) derived from the observed samples analysed in the experiment.
Diversity 12 00384 g0a2
Table A1. Observed and expected maximum number of taxa calculated using four separate resampling methods.
MethodExpected # of Taxa±95% C.I.
Observed48-
Chao71.9±59.6
Jackknife 154.8±6.9
Jackknife 260.6±6.9
Bootstrap51.3±3.7

Appendix C

Figure A3. Partial regression plots identifying the effect of each predictor variable on (a) epiphyte load (gDW·gDW−1), (b) invertebrate abundance and (c) invertebrate diversity when all others were held constant. The relative strength of the interaction is ordered from strongest to weakest (left to right). Predictor variables were z-transformed for direct comparison between regression slopes.
Diversity 12 00384 g0a3

References

  1. Proulx, M.; Mazumder, A. Reversal of Grazing Impact on Plant Species Richness in Nutrient-Poor vs. Nutrient-Rich. Ecology 1998, 79, 2581–2592. [Google Scholar] [CrossRef]
  2. Worm, B.; Lotze, H.K.; Hillebrand, H.; Sommer, U. Consumer versus resource control of species diversity and ecosystem functioning. Nature 2002, 417, 848–851. [Google Scholar] [CrossRef] [PubMed]
  3. Gruner, D.S.; Smith, J.E.; Seabloom, E.W.; Sandin, S.A.; Ngai, J.T.; Hillebrand, H.; Harpole, S.W.; Elser, J.J.; Cleland, E.E.; Bracken, M.E.S.; et al. A cross-system synthesis of consumer and nutrient resource control on producer biomass. Ecol. Lett. 2008, 11, 740–755. [Google Scholar] [CrossRef] [PubMed]
  4. Huntly, N. Herbivores and the dynamics or communities and ecosystems. Annu. Rev. Ecol. Syst. 1991, 22, 477–503. [Google Scholar] [CrossRef]
  5. Borer, E.T.; Seabloom, E.W.; Gruner, D.S.; Harpole, W.S.; Hillebrand, H.; Lind, E.M.; Adler, P.B.; Alberti, J.; Anderson, T.M.; Bakker, J.D.; et al. Herbivores and nutrients control grassland plant diversity via light limitation. Nature 2014, 508, 517–521. [Google Scholar] [CrossRef]
  6. Scott, A.L.; York, P.H.; Duncan, C.; Macreadie, P.I.; Connolly, R.M.; Ellis, M.T.; Jarvis, J.C.; Jinks, K.I.; Marsh, H.; Rasheed, M.A. The Role of Herbivory in Structuring Tropical Seagrass Ecosystem Service Delivery. Front. Plant Sci. 2018, 9, 1–10. [Google Scholar] [CrossRef]
  7. Hillebrand, H.; Gruner, D.S.; Borer, E.T.; Bracken, M.E.S.; Cleland, E.E.; Elser, J.J.; Harpole, W.S.; Ngai, J.T.; Seabloom, E.W.; Shurin, J.B.; et al. Consumer versus Resource Control of Producer Diversity Depends on Ecosystem Type and Producer Community Structure. Proc. Natl. Acad. Sci. USA 2007, 104, 10904–10909. [Google Scholar] [CrossRef] [Green Version]
  8. Grace, J.B.; Michael Anderson, T.; Seabloom, E.W.; Borer, E.T.; Adler, P.B.; Stanley Harpole, W.; Hautier, Y.; Hillebrand, H.; Lind, E.M.; Pärtel, M.; et al. Integrative modelling reveals mechanisms linking productivity and plant species richness. Nature 2016, 529, 390–395. [Google Scholar] [CrossRef]
  9. France, K.E.; Duffy, J.E. Diversity and dispersal interactively affect predictability of ecosystem function. Nature 2006, 441, 1139–1143. [Google Scholar] [CrossRef] [PubMed]
  10. Campbell, J.E.; Altieri, A.H.; Johnston, L.N.; Kuempel, C.D.; Paperno, R.; Paul, V.J.; Duffy, J.E. Herbivore community determines the magnitude and mechanism of nutrient effects on subtropical and tropical seagrasses. J. Ecol. 2018, 106, 401–412. [Google Scholar] [CrossRef]
  11. Duffy, J.E.; Cardinale, B.J.; France, K.E.; McIntyre, P.B.; Thébault, E.; Loreau, M. The functional role of biodiversity in ecosystems: Incorporating trophic complexity. Ecol. Lett. 2007, 10, 522–538. [Google Scholar] [CrossRef] [PubMed] [Green Version]
  12. Alcoverro, T.; Mariani, S. Patterns of Fish and Sea Urchin Grazing on Tropical Indo-Pacific Seagrass Beds. Ecography 2004, 27, 361–365. [Google Scholar] [CrossRef]
  13. Christianen, M.J.A.; Govers, L.L.; Bouma, T.J.; Kiswara, W.; Roelofs, J.G.M.; Lamers, L.P.M.; van Katwijk, M.M. Marine megaherbivore grazing may increase seagrass tolerance to high nutrient loads. J. Ecol. 2011, 100, 546–560. [Google Scholar] [CrossRef]
  14. Christianen, M.J.A.; Herman, P.M.J.; Bouma, T.J.; Lamers, L.P.M.; van Katwijk, M.M.; van der Heide, T.; Mumby, P.J.; Silliman, B.R.; Engelhard, S.L.; van de Kerk, M.; et al. Habitat collapse due to overgrazing threatens turtle conservation in marine protected areas. Proc. R. Soc. B. 2014, 281. [Google Scholar] [CrossRef] [PubMed] [Green Version]
  15. Orth, R.J.; van Montfrans, J. Epiphyte-seagrass relationships with an emphasis on the role of micrograzing: A review. Aquat. Bot. 1984, 18, 43–69. [Google Scholar] [CrossRef]
  16. Heck, K.L.; Valentine, J.F. Plant-herbivore interactions in seagrass meadows. J. Exp. Mar. Biol. Ecol. 2006, 330, 420–436. [Google Scholar] [CrossRef]
  17. Myers, J.A.; Heck, K.L. Amphipod control of epiphyte load and its concomitant effects on shoalgrass Halodule wrightii biomass. Mar. Ecol. Prog. Ser. 2013, 483, 133–142. [Google Scholar] [CrossRef] [Green Version]
  18. Reynolds, P.L.; Richardson, J.P.; Duffy, J.E. Field experimental evidence that grazers mediate transition between microalgal and seagrass dominance. Limnol. Oceanogr. 2014, 59, 1053–1064. [Google Scholar] [CrossRef]
  19. Duffy, J.E.; Reynolds, P.L.; Boström, C.; Coyer, J.A.; Cusson, M.; Donadi, S.; Douglass, J.G.; Eklöf, J.S.; Engelen, A.H.; Eriksson, B.K.; et al. Biodiversity mediates top-down control in eelgrass ecosystems: A global comparative-experimental approach. Ecol. Lett. 2015, 18, 696–705. [Google Scholar] [CrossRef]
  20. Baden, S.; Emanuelsson, A.; Pihl, L.; Svensson, C.; Åberg, P. Shift in seagrass food web structure over decades is linked to overfishing. Mar. Ecol. Prog. Ser. 2012, 451, 61–73. [Google Scholar] [CrossRef] [Green Version]
  21. Duffy, J.E.; Macdonald, K.S.; Rhode, J.M.; Parker, J.D. Grazer diversity, functional redundancy, and productivity in seagrass beds. Ecology 2009, 82, 2417–2434. [Google Scholar] [CrossRef]
  22. Lefcheck, J.S.; Duffy, E.J. Multitrophic functional diversity predicts ecosystem functioning in experimental assemblages of estuarine consumers. Ecology 2015, 96, 2973–2983. [Google Scholar] [CrossRef] [PubMed]
  23. Duffy, E.; Richardson, P.; Canuel, E. Grazer diversity effects on ecosystem functioning in seagrass beds. Ecol. Lett. 2003, 6, 637–645. [Google Scholar] [CrossRef] [Green Version]
  24. Hughes, A.R.; Stachowicz, J.J. Genetic diversity enhances the resistance of a seagrass ecosystem to disturbance. Proc. Natl. Acad. Sci. USA 2004, 101, 8998–9002. [Google Scholar] [CrossRef] [PubMed] [Green Version]
  25. Reusch, T.B.H.; Ehlers, A.; Hä, A.; Worm, B. Ecosystem recovery after climatic extremes enhanced by genotypic diversity. Proc. Natl. Acad. Sci. USA 2005, 102, 2826–2831. [Google Scholar] [CrossRef] [PubMed] [Green Version]
  26. Whalen, M.A.; Duffy, J.E.; Grace, J.B. Temporal shifts in top-down vs. bottom-up control of epiphytic algae in a seagrass ecosystem. Ecology 2013, 94, 510–520. [Google Scholar] [CrossRef] [PubMed]
  27. Waycott, M.; Duarte, C.M.; Carruthers, T.J.B.; Orth, R.J.; Dennison, W.C.; Olyarnik, S.; Calladine, A.; Fourqurean, J.W.; Heck, K.L.; Hughes, A.R.; et al. Accelerating Loss of Seagrasses across the Globe Threatens Coastal Ecosystems. Proc. Natl. Acad. Sci. USA 2009, 106, 12377–12381. [Google Scholar] [CrossRef] [Green Version]
  28. Howarth, R.W.; Anderson, D.B.; Cloern, J.E.; Elfring, C.; Hopkinson, C.S.; Lapointe, B.; Maloney, T.J.; Marcus, N.; McGlathery, K.; Sharpley, A.N.; et al. Nutrient pollution of coastal rivers, bays, and seas. Issues Ecol. 2000, 7, 1–16. [Google Scholar]
  29. Jackson, J.B.C.; Kirby, M.X.; Berger, W.H.; Bjorndal, K.A.; Botsford, L.W.; Bourque, B.J.; Bradbury, R.H.; Cooke, R.; Erlandson, J.; Estes, J.A.; et al. Historical Overfishing and the Recent Collapse of Coastal Ecosystems. Science 2001, 293, 629–638. [Google Scholar] [CrossRef] [Green Version]
  30. Hootsmans, M.J.M.; Vermaat, J.E. The Effect of Periphyton-Grazing by Three Epifaunal Species on the Growth of Zostera marina L. Under Experimental Conditions. Aquat. Bot. 1985, 22, 83–88. [Google Scholar] [CrossRef]
  31. Howard, R.K.; Short, F.T. Seagrass Growth and Survivorship Under the Influence of Epiphite Grazers. Aquat. Bot. 1986, 24, 287–302. [Google Scholar] [CrossRef]
  32. Neckles, H.A.; Wetzel, R.L.; Orth, R.J. Relative Effects of Nutrient Enrichment and Grazing on Epiphyte-Macrophyte (Zostera marina L.) Dynamics. Oecologia 1993, 93, 285–295. [Google Scholar] [CrossRef] [PubMed]
  33. Williams, S.L.; Ruckelshaus, M.H. Effects of Nitrogen Availability and Herbivory on Eelgrass (Zostera marina) and Epiphytes. Ecology 1993, 74, 904–918. [Google Scholar] [CrossRef]
  34. Orth, R.J.; Carruthers, T.J.B.; Dennison, W.C.; Duarte, C.M.; Fourqurean, J.W.; Heck, K.L.; Hughes, A.R.; Kendrick, G.A.; Kenworthy, W.J.; Olyarnik, S.; et al. A Global Crisis for Seagrass Ecosystems. Bioscience 2006, 56, 987–996. [Google Scholar] [CrossRef] [Green Version]
  35. Brown, J.H. Why are there so many species in the tropics? J. Biogeogr. 2014, 41, 8–22. [Google Scholar] [CrossRef] [Green Version]
  36. Leopardas, V.; Uy, W.; Nakaoka, M. Benthic macrofaunal assemblages in multispecific seagrass meadows of the southern Philippines: Variation among vegetation dominated by different seagrass species. J. Exp. Mar. Biol. Ecol. 2014, 457, 71–80. [Google Scholar] [CrossRef] [Green Version]
  37. Baxter, I.N. Green Island Information Review; Great Barrier Reef Marine Park Authority: Townsville, QLD, Australia, 1990. [Google Scholar]
  38. Rasheed, M.A. Recovery and succession in a multi-species tropical seagrass meadow following experimental disturbance: The role of sexual and asexual reproduction. J. Exp. Mar. Biol. Ecol. 2004, 310, 13–45. [Google Scholar] [CrossRef]
  39. Poore, A.G.B.; Campbell, A.H.; Steinberg, P.D. Natural densities of mesograzers fail to limit growth of macroalgae or their epiphytes in a temperate algal bed. J. Ecol. 2009, 97, 164–175. [Google Scholar] [CrossRef] [Green Version]
  40. Hoffmann, L. Richness of primary producers and consumer abundance mediate epiphyte loads in a tropical seagrass system (dataset). In Tropical Data Hub; James Cook University: Cairns, Australia, 2020. [Google Scholar] [CrossRef]
  41. Oksanen, J.; Blanchet, F.G.; Kindt, R.; Legendre, P.; Minchin, P.R.; O’Hara, R.B.; Simpson, G.L.; Solymos, P.; Stevens, M.H.H.; Wagner, H. Community Ecology Package ‘Vegan’, 2019, Version 2.5-6. Available online: https://cran.r-project.org/web/packages/vegan/index.html (accessed on 7 October 2020).
  42. R Core Team. A Language and Environment for Statistical Computing; R Foundation for Statistical Computing; R Core Team: Vienna, Austria, 2018; Available online: https://www.R-project.org (accessed on 3 September 2019).
  43. Bates, D.; Mächler, M.; Bolker, B.; Walker, S. Fitting Linear Mixed-Effects Models using lme4. J. Stat. Softw. 2015, 67, 1–48. [Google Scholar] [CrossRef]
  44. Zuur, A.F.; Ieno, E.N.; Elphick, C.S. A protocol for data exploration to avoid common statistical problems. Methods Ecol. Evol. 2010, 1, 3–14. [Google Scholar] [CrossRef]
  45. Bartoń, K. MuMIn: Multi-Model Inference. R Package 2020, Version 1.43.17. Available online: https://cran.r-project.org/web/packages/MuMIn/index.html (accessed on 7 October 2020).
  46. Burnham, K.P.; Anderson, D.R. Multimodel Inference Understanding AIC and BIC in Model Selection. Sociol. Methods Res. 2004, 33, 261–304. [Google Scholar] [CrossRef]
  47. Burnham, K.P.; Anderson, D.R.; Huyvaert, K.P. AIC model selection and multimodel inference in behavioral ecology: Some background, observations. Behav. Ecol. Sociobiol. 2011, 65, 23–35. [Google Scholar] [CrossRef]
  48. Shipley, B. The AIC model selection method applied to path analytic models compared using a d-separation test. Ecology 2013, 94, 560–564. [Google Scholar] [CrossRef] [PubMed]
  49. Lefcheck, J.S. piecewiseSEM: Piecewise structural equation modelling in R for ecology, evolution, and systematics. Methods Ecol. Evol. 2016, 7, 573–579. [Google Scholar] [CrossRef]
  50. Grace, J.B.; Schoolmaster, D.R.; Guntenspergen, G.R.; Little, A.M.; Mitchell, B.R.; Miller, K.M.; Schweiger, E.W. Guidelines for a graph-theoretic implementation of structural equation modeling. Ecosphere 2012, 3, 73. [Google Scholar] [CrossRef]
  51. Shipley, B. Confirmatory path analysis in a generalized multilevel context. Ecology 2009, 90, 363–368. [Google Scholar] [CrossRef]
  52. Shipley, B. A New Inferential Test for Path Models Based on Directed Acyclic Graphs. Struct. Equ. Model. 2000, 7, 206–218. [Google Scholar] [CrossRef]
  53. Bostrom, C.; Bonsdorff, E. Zoobenthic community establishment and habitat complexity—The importance of seagrass shoot-density, morphology and physical disturbance for faunal recruitment. Mar. Ecol. Prog. Ser. 2000, 205, 123–138. [Google Scholar] [CrossRef] [Green Version]
  54. Macreadie, P.I.; Connolly, R.M.; Jenkins, G.P.; Hindell, J.S.; Keough, M.J. Edge patterns in aquatic invertebrates explained by predictive models. Mar. Freshw. Res. 2010, 61, 214. [Google Scholar] [CrossRef] [Green Version]
  55. Tomas, F.; Abbott, J.M.; Steinberg, C.; Balk, M.; Williams, S.L.; Stachowicz, J.J. Plant genotype and nitrogen loading influence seagrass productivity, biochemistry, and plant-herbivore interactions. Ecology 2011, 92, 1807–1817. [Google Scholar] [CrossRef]
  56. Lefcheck, J.S.; Marion, S.R.; Lombana, A.V.; Orth, R.J. Faunal Communities are Invariant to Fragmentation in Experimental Seagrass Landscapes. PLoS ONE 2016, 11, e0156550. [Google Scholar] [CrossRef] [PubMed]
  57. Davis, B.C.; Fourqurean, J.W. Competition between the tropical alga, Halimeda incrassata, and the seagrass, Thalassia testudinum. Aquat. Bot. 2001, 71, 217–232. [Google Scholar] [CrossRef]
  58. Koch, M.; Bowes, G.; Ross, C.; Zhang, X.H. Climate change and ocean acidification effects on seagrasses and marine macroalgae. Glob. Chang. Biol. 2013, 19, 103–132. [Google Scholar] [CrossRef] [PubMed]
  59. Blake, R.E.; Duffy, J.E. Grazer diversity affects resistance to multiple stressors in an experimental seagrass ecosystem. Oikos 2010, 119, 1625–1635. [Google Scholar] [CrossRef]
  60. Jones, D.; Morgan, G. A Field Guide to Crustaceans of Australian Waters; Young, J., Ed.; Reed: Chatswood, NSW, Australia, 1994. [Google Scholar]
  61. Dauby, P.; Scailteur, Y.; de Broyer, C. Trophic diversity within the Eastern Weddell Sea amphipod community. Hydrobiologia 2001, 443, 69–86. [Google Scholar] [CrossRef]
  62. Farlin, J.; Lewis, L.; Anderson, T.; Lai, C. Functional diversity in amphipods revealed by stable isotopes in an eelgrass ecosystem. Mar. Ecol. Prog. Ser. 2010, 420, 277–281. [Google Scholar] [CrossRef] [Green Version]
  63. Jinks, K.I.; Brown, C.J.; Rasheed, M.A.; Scott, A.L.; Sheaves, M.; York, P.H.; Connolly, R.M. Habitat complexity influences the structure of food webs in Great Barrier Reef seagrass meadows. Ecosphere 2019, 10. [Google Scholar] [CrossRef] [Green Version]
  64. Kharlamenko, V.; Kiyashko, S.; Imbs, A.; Vyshkvartzev, D. Identification of food sources of invertebrates from the seagrass Zostera marina community using carbon and sulfur stable isotope ratio and fatty acid analyses. Mar. Ecol. Prog. Ser. 2001, 220, 103–117. [Google Scholar] [CrossRef] [Green Version]
  65. Jaschinski, S.; Brepohl, D.; Sommer, U. Carbon sources and trophic structure in an eelgrass Zostera marina bed, based on stable isotope and fatty acid analyses. Mar. Ecol. Prog. Ser. 2008, 358, 103–114. [Google Scholar] [CrossRef]
  66. York, P.H.; Smith, T.M.; Coles, R.G.; McKenna, S.A.; Connolly, R.M.; Irving, A.D.; Jackson, E.L.; McMahon, K.; Runcie, J.W.; Sherman, C.D.H.; et al. Identifying knowledge gaps in seagrass research and management: An Australian perspective. Mar. Environ. Res. 2017, 127, 163–172. [Google Scholar] [CrossRef] [Green Version]
  67. Thomsen, M.S.; Altieri, A.H.; Angelini, C.; Bishop, M.J.; Gribben, P.E.; Lear, G.; He, Q.; Schiel, D.R.; Silliman, B.R.; South, P.M.; et al. Secondary foundation species enhance biodiversity. Nat. Ecol. Evol. 2018, 2, 634–639. [Google Scholar] [CrossRef] [PubMed]
  68. Cadenasso, M.L.; Pickett, S.T.A.; Grove, J.M. Dimensions of ecosystem complexity: Heterogeneity, connectivity, and history. Ecol. Complex. 2006, 3, 1–12. [Google Scholar] [CrossRef]
  69. Gonzalez, A.; Loreau, M. The Causes and Consequences of Compensatory Dynamics in Ecological Communities. Annu. Rev. Ecol. Evol. Syst. 2009, 40, 393–414. [Google Scholar] [CrossRef] [Green Version]
  70. Navarro-Barranco, C.; Guerra-García, J.M. Spatial distribution of crustaceans associated with shallow soft-bottom habitats in a coral reef lagoon. Mar. Ecol. 2016, 37, 77–87. [Google Scholar] [CrossRef]
  71. Spivak, A.; Canuel, E.; Duffy, E. Top-down and bottom-up controls on sediment organic matter composition in an experimental seagrass ecosystem. Limnol. Oceanogr. 2007, 52, 2595–2607. [Google Scholar] [CrossRef] [Green Version]
  72. Grech, A.; Chartrand-Miller, K.; Erftemeijer, P.; Fonseca, M.; McKenzie, L.; Rasheed, M.; Taylor, H.; Coles, R. A comparison of threats, vulnerabilities and management approaches in global seagrass bioregions. Environ. Res. Lett. 2012, 7, 024006. [Google Scholar] [CrossRef]
Figure 1. Arial view of Green Island with site deployment, each containing 11 paired control and treatment plots. Service layer credits: Source ESRI, Digital Globe, GeoEye, Earthstar Geographics, CNES/Airbus DS, USDA, USGS, AeroGRID, ING and the GIS User Community.
Diversity 12 00384 g001
Figure 2. The effect of site on each of the habitat and invertebrate variables measured in the study (af). The effect of site (g) and treatment (h) on epiphyte load (gDW·gDW−1) and (i) the difference (delta) in epiphyte load (gDW·gDW−1) between paired controls and treatment plots for each site.
Diversity 12 00384 g002
Figure 3. Ordination plot showing significant invertebrate community differences between Site 1, control and treatment plots (1C and 1T respectively) and Site 2 control and treatment plots (2C and 2T respectively) (p < 0.001, R2 = 0.5021, stress 0.21). Individual samples are denoted by black dots, which are connected to their respective centroid. Lower and upper 95% confidence intervals (shaded area) for each centroid are also shown.
Diversity 12 00384 g003
Figure 4. Path analysis of combined interactions. (a) Full theoretical interaction web of measured variables and treatment effects and (b) final path model. Thickness of positive (black) and negative (red) paths is proportional to their standardised path coefficients. Dashed lines represent indirect paths. Marginal and conditional (respectively) R-squared values are displayed above each of the response variables measured. Primary drivers are indicated by (*).
Diversity 12 00384 g004
Table 1. The variables measured within the study for each of the three levels within the invertebrate–seagrass–epiphyte interaction. Each variable was modelled using all variables from the groupings below it, e.g., epiphyte load (gDW·gDW−1) was modelled using all invertebrate and habitat community variables.
Interaction GroupingVariables Included within Models
EpiphytesEpiphyte Load (gDW·gDW−1)
Invertebrate AssemblagesInvertebrate AbundanceInvertebrate Richness (S)Invertebrate Diversity (H′)
Habitat CommunityHabitat Biomass (gDW)Habitat Richness (S)Habitat Diversity (H′)
Table 2. List of variables included, regression coefficients, degrees of freedom (df) and Akaike’s Information Criteria corrected for small sample size (AICc), for all candidate models and averaged final model for each of the response variables within the path analysis. (a) Epiphyte load, (b) invertebrate abundance and (c) invertebrate diversity (H′).
(a) Epiphyte Load (Epiphyte gDW/Seagrass Biomass gDW−1) Model Coefficients
Model #Site (Intercept)Habitat DiversityInvertebrate DiversityInvertebrate AbundanceHabitat RichnessdfAICcΔ Weight
1−2.49NANA−0.46NA4−127.10
2−2.49NANA−0.42−0.075−124.81.53
3−2.49NA0.06−0.47NA5−124.82.08
4−2.490.02NA−0.47NA5−124.62.98
Averaged Model−2.490.020.06−0.46−0.07
(b) Invertebrate Abundance Model Coefficients
Model #Site (Intercept)Habitat DiversityHabitat Richness (S)Habitat Biomass (gDW)DeterrentdfAICcΔ Weight
15.46NA0.57−0.23−0.556498.50
25.460.220.23NA−0.566499.91.36
35.460.130.44−0.18−0.567500.41.86
45.450.37NANA−0.535500.82.22
55.45NA0.40NA−0.525500.92.43
Averaged Model5.460.230.45−0.22−0.55
(c) Invertebrate Diversity (H′) Model Coefficients
Model #Site (Intercept)Habitat DiversityHabitat Richness (S)Habitat Biomass (gDW)DeterrentdfAICcΔ Weight
10.54NANANA−0.27444.30
20.550.06NANA−0.28544.50.17
30.54NANA0.05−0.28544.80.47
40.550.06NA0.05−0.28645.20.85
50.54NA0.05NA−0.27545.71.40
60.550.12−0.100.09−0.29746.32.02
70.550.060.01NA−0.28647.22.91
Averaged Model0.550.07−0.010.06−0.28

