Article

Patterns in Alpha and Beta Phytoplankton Diversity along a Conductivity Gradient in Coastal Mediterranean Lagoons

by
Natassa Stefanidou
1,*,
Matina Katsiapi
1,2,
Dimitris Tsianis
3,
Maria Demertzioglou
4,
Evangelia Michaloudi
4 and
Maria Moustaka-Gouni
1,*
1
Department of Botany, School of Biology, Aristotle University of Thessaloniki, 54124 Thessaloniki, Greece
2
EYATH SA, Water Supply Division/Drinking Water Treatment Facility, Nea Ionia, 57008 Thessaloniki, Greece
3
Fisheries Department, Dir. of Agricultural Economy & Veterinary Med., Regional District of Xanthi, Region of Eastern Macedonia & Thrace, 67100 Xanthi, Greece
4
Department of Zoology, School of Biology, Aristotle University of Thessaloniki, 54124 Thessaloniki, Greece
*
Authors to whom correspondence should be addressed.
Diversity 2020, 12(1), 38; https://doi.org/10.3390/d12010038
Submission received: 16 December 2019 / Revised: 16 January 2020 / Accepted: 17 January 2020 / Published: 19 January 2020
(This article belongs to the Special Issue Biodiversity of Marine Microbes)

Abstract

:
Understanding the diversity patterns of phytoplankton assemblages in coastal lagoons is clearly important for water management. In this study, we explored alpha and beta diversity patterns in phytoplankton communities across five Mediterranean lagoons hydrologically connected to Vistonikos Gulf. We examined the phytoplankton community composition and biomass on a monthly basis from November 2018 to October 2019. For this, water samples were collected from seven inshore, brackish and coastal waters, sampling sites covering a wide range of conductivity. We found significant spatial and temporal differences in phytoplankton alpha diversity and in phytoplankton biomass metrics explained by the high variation of conductivity. Evenness remained low throughout the study period, reflecting significant dominance of several phytoplankton blooms. Harmful algal blooms of Prorocentrum minimum, Alexandrium sp., Rhizosolenia setigera and Cylindrotheca closterium occurred. The system’s species pool was characterized by relatively high phytoplankton beta diversity (average ~0.7) resulting from high temporal species turnover (90%). Overall, alpha and beta diversity components were indicative of rather heterogeneous phytoplankton communities which were associated with the high differences in conductivity among the sampling sites.

1. Introduction

Coastal lagoons are shallow semi-enclosed dynamic ecosystems which are connected to the sea by one or more restricted inlets [1]. They are transitional zones between the terrestrial and the marine environment occupying 13% of the coastal areas worldwide [2]. Coastal lagoons provide essential ecosystem services [3]. Due to their shallow depth and the restricted water exchange with the adjacent sea, they are naturally high productive ecosystems [4,5] that are usually subjected to intensive human activities, mostly aquaculture, with several consequences [6,7,8]. In addition to human exploitation, coastal lagoons have been identified as one of the most vulnerable habitants to potential impacts associated with climate change [5,9]. Projections for atmospheric temperature increase up to 6 °C in parallel with the more often and stronger hot extremes for the Mediterranean region [10,11] would most probably increase the salinity in coastal lagoons affecting, in turn, the biological communities. Studies using microbial communities as experimental systems have pointed out that a potential salinity change in coastal Mediterranean environment would significantly affect the microbial biodiversity, biomass and resource use efficiency [12,13].
Within the Mediterranean basin, there are numerous (>100) coastal lagoons of varying size [14,15]. Multiple line of evidence suggest that these ecosystems host an important fraction of global biodiversity including rare species [16,17,18]. A considerable number of studies examining the alpha diversity patterns (i.e., the local diversity within a site) of macrophytes (e.g., [19]), fish (e.g., [20]) and benthic invertebrates (e.g., [21]) in coastal lagoons relate them to environmental parameters (e.g., total phosphorus). More recently, studies of the spatial alpha diversity gradients of phytoplankton communities relate them to geographical variables (e.g., altitude in [22]) or other physical (e.g., water temperature in [23]) and chemical (e.g., nutrients in [24]) environmental aspects. Furthermore, investigations were carried out in order to determine the key environmental factors driving the frequent phytoplankton blooms in these shallow productive ecosystems [25]. The advancement of Next Generation Sequencing (NGS) tools in recent years has allowed the investigation of deep microbial diversity in coastal lagoons, revealing information for their alpha diversity patterns in relation to other biotic or abiotic parameters (e.g., [26,27,28]).
However, still today, very little is known about the microbial (including phytoplankton) beta diversity (i.e., the ratio of the local diversity divided by the regional diversity) and how it varies along the conductivity gradient in such ecosystems. Whittaker et al. [29] defined beta diversity as the extent of differentiation among biological communities along habitat gradients within an ecosystem. In particular, beta diversity is a measure of the difference in species composition between two or more local assemblages (e.g., the five Mediterranean lagoons under study) [30]. There are two potential ways in which two or more assemblages can be different: one is species replacement (i.e., turnover) and the second is species loss or gain, which implies that the poorest assemblage is a subset of the richest one (nestedness) [31]. The differentiation of the spatial turnover and nestedness components of beta diversity is crucial for understanding central biogeographic, ecological and conservation issues [32].
In the present study we explored the patterns of phytoplankton biodiversity across five Mediterranean lagoons which are located nearby and are hydrologically connected to Vistonikos Gulf, North Aegean Sea. To the best of our knowledge, this is the first study on these lagoons’ phytoplankton. Particularly, we examined the spatial and temporal differences in phytoplankton species richness and other alpha diversity estimators (i.e., Shannon index) along the conductivity gradient that characterizes these lagoons. Furthermore, we explored the degree of homogeneity across the different waterbodies by computing beta diversity. By calculating nestedness and turnover, we examined whether beta diversity originated from differences in richness level (nestedness) or from species replacement (turnover). Finally, in order to study the effect of conductivity on phytoplankton communities we modelled their relationship using different phytoplankton attributes (e.g., phytoplankton biomass, species and group composition richness). Overall, we aimed to evaluate whether hydrological connectivity through water intrusion from Vistonikos Gulf or environmental heterogeneity in terms of conductivity stronger affects the phytoplankton community structure across the five lagoons. In the first case we expect that phytoplankton communities would be relatively homogeneous (i.e., low beta diversity and low turnover) with no significant relationships between conductivity and the different phytoplankton attributes. Alternatively, in the case where conductivity would significantly affect the phytoplankton communities across the lagoons, we expect rather heterogeneous phytoplankton communities (i.e., high beta diversity) resulting from species turnover.

2. Materials and Methods

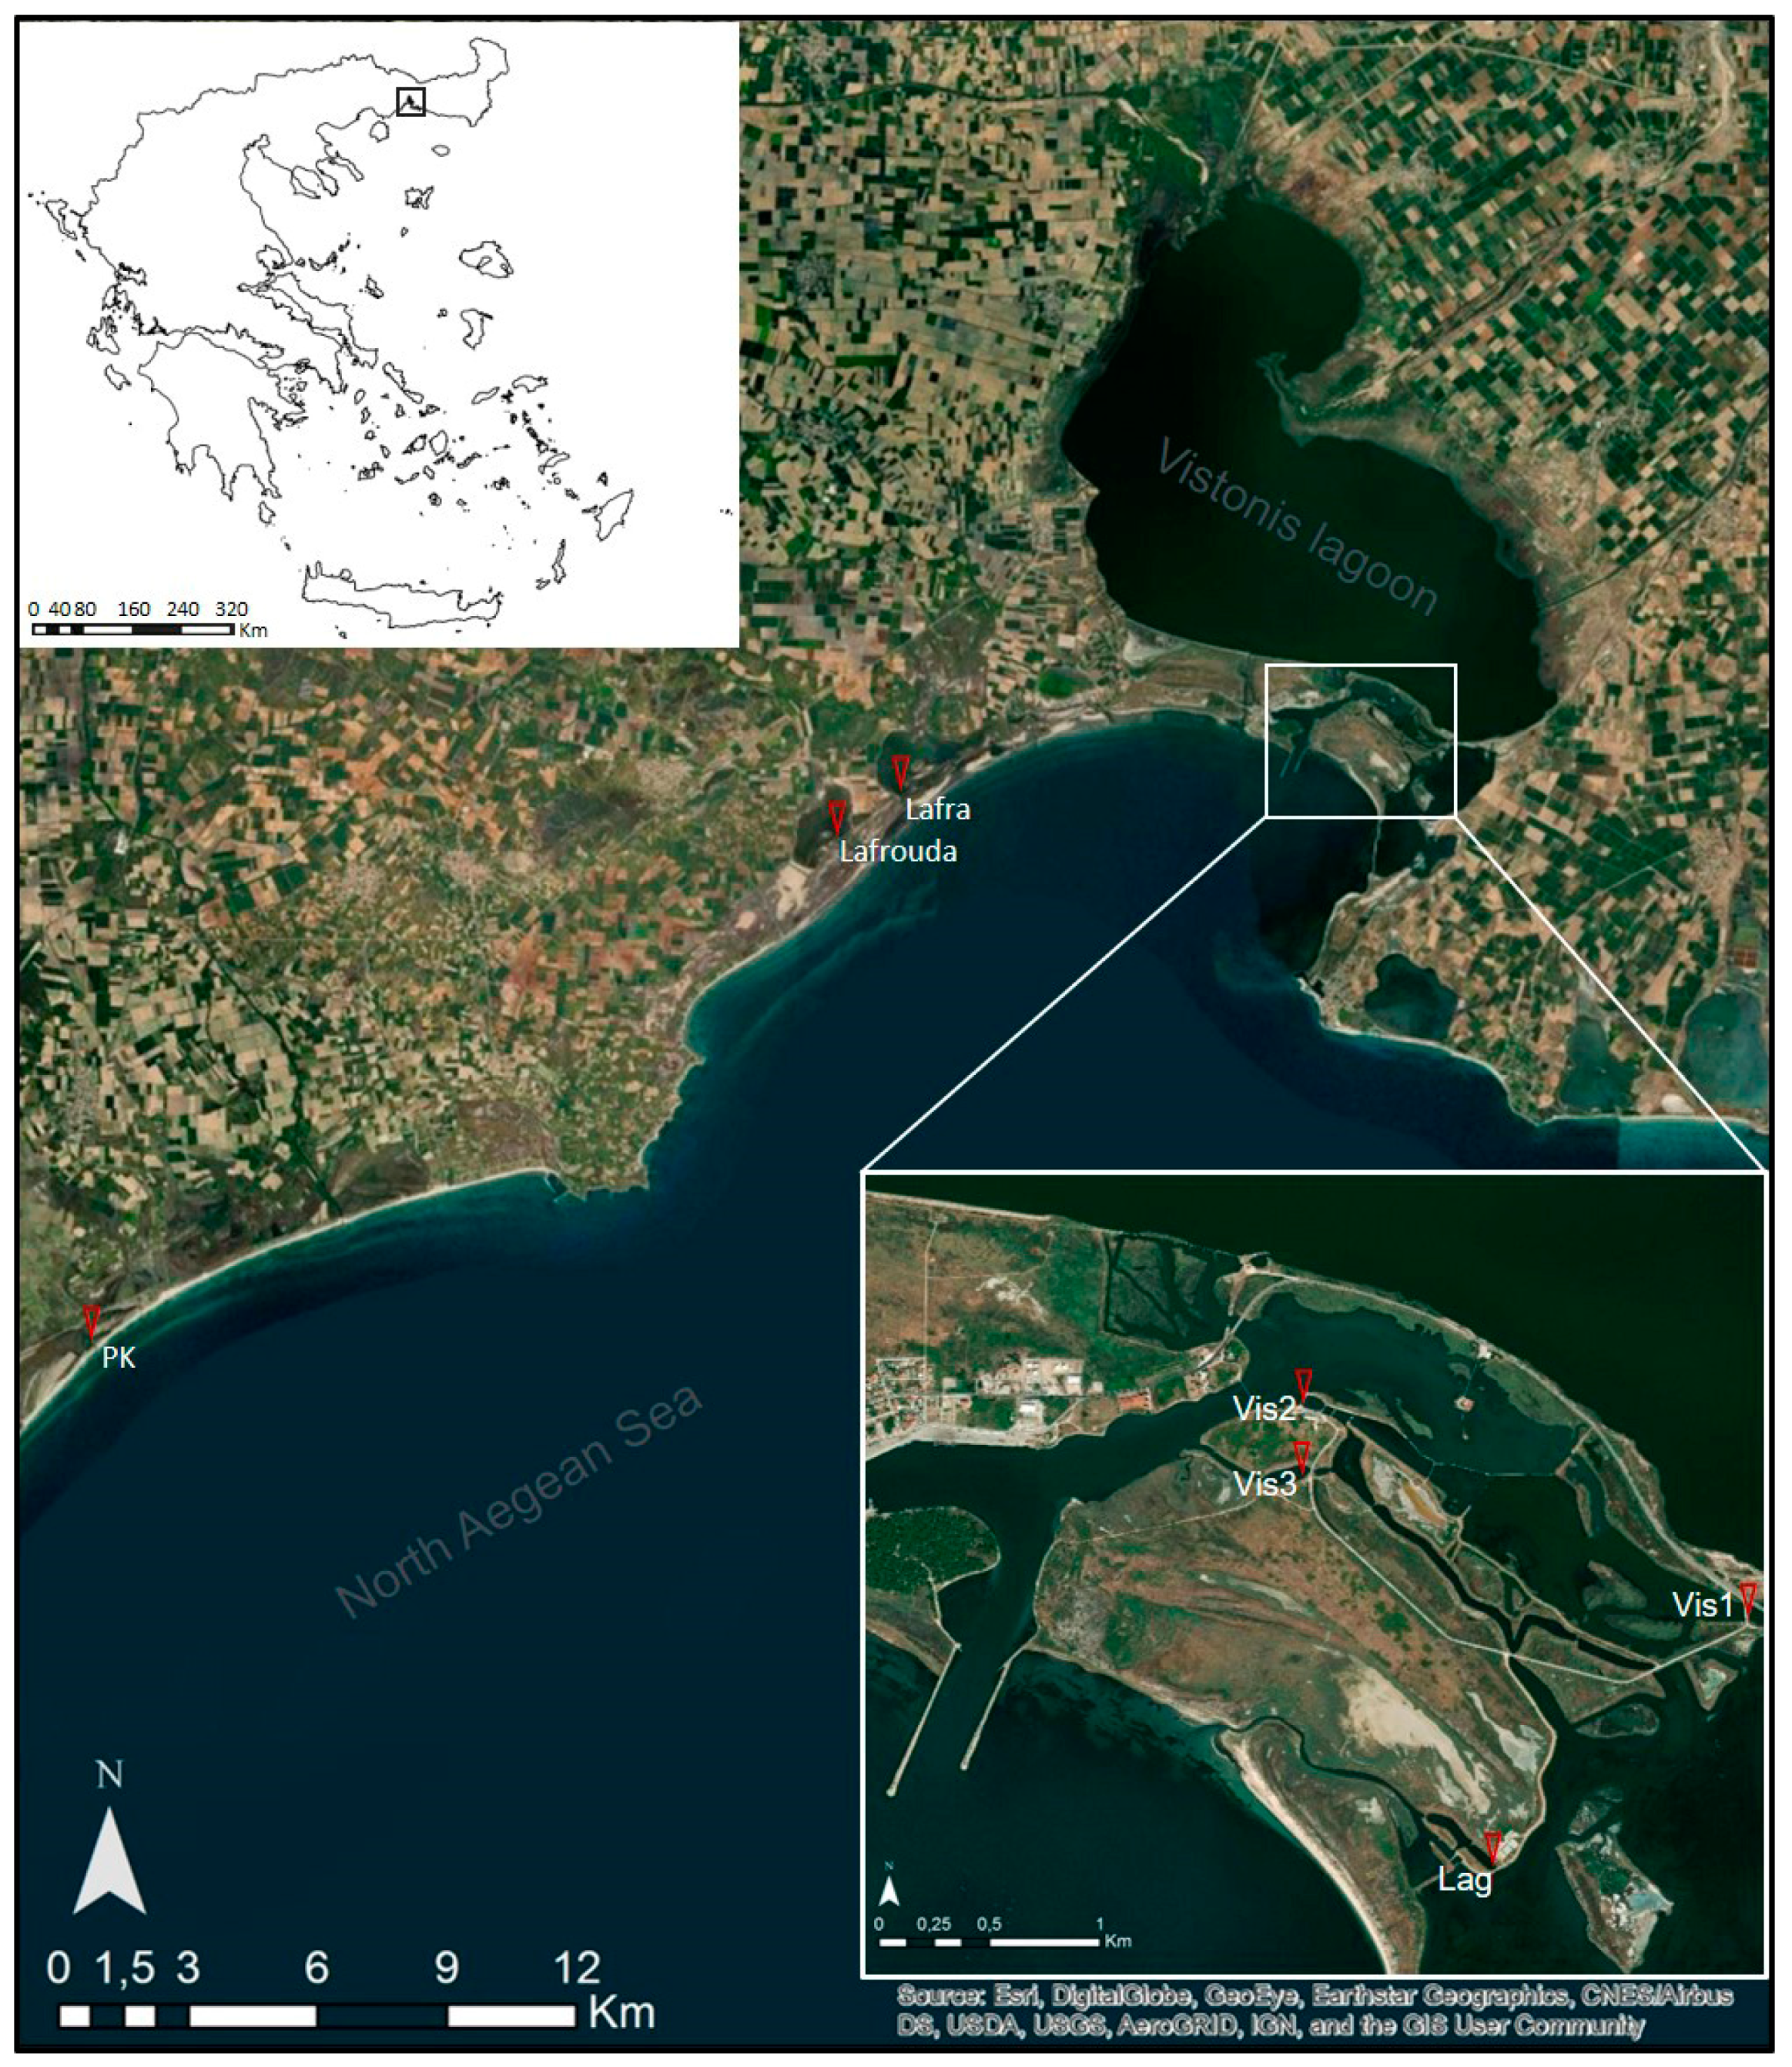
2.1. Sampling Sites and Sample Collection

Phytoplankton samples were collected monthly on an annual basis (November 2018 to October 2019) from five Mediterranean lagoons located in Thrace, Northeastern Greece. All the lagoons are connected to Vistonikos Gulf (North Aegean Sea) by canals (Table 1; Figure 1). In total, 84 phytoplankton samples were analyzed from seven inshore sites of these lagoons. Vistonis lagoon has a surface area of approximately 45 km2 with a mean depth of 3 m and it is connected to Vistonikos Gulf through three tidal canals [33]. Being the largest lagoon among the five studied, samples were collected from three different sites in the southern part of Vistonis lagoon nearby Vistonikos Gulf. The second largest lagoon, Lagos lagoon, has a surface area of 3 km2 and mean depth of 2 m. In its northern part it communicates with the southern part of Vistonis lagoon while in its southern part with Vistonikos Gulf through tidal canals [34]. Lafra and Lafrouda are smaller lagoons than Vistonis and Lagos and have approximately 1.2 km2 and 0.8 km2 surface areas, respectively, and a mean depth <0.5 m [35]. The smallest lagoon is Palaia Koiti lagoon which occupies a surface area of <0.1 km2 and has a mean depth of approximately 1 m [35]. Lafra, Lafrouda and Palaia Koiti lagoons are connected with Vistonikos Gulf through tidal canals.
During all samplings, in situ measurements of water temperature and conductivity were made with the use of a HACH HQ40D portable multi meter. Conductivity was transformed to salinity based on the equation in Weyl [36]. Phytoplankton samples of 0.5 L were collected from the surface layer (0–1 m) and were preserved immediately with Lugol’s solution. The samples were kept in the dark until they were microscopically analyzed within the next few days.

2.2. Microscopy Analysis

Phytoplankton samples were examined using an inverted epi-fluorescence microscope (Nikon Eclipse TE 2000-S, Melville, ΜSA) with phase contrast. Phytoplankton identification was based on taxonomic keys and papers and counting was done using the inverted microscope method following the same protocol described in Mazaris et al. [37]. For biomass estimation, the dimensions of 30 individuals of each abundant species were measured using a digital microscope camera (Nikon DS-L1). Mean cell volume estimates were calculated using the appropriate geometric formulae [38]. Phytoplankton biovolume for individuals > 180 μm3 was converted into carbon content using the formulae C = 0.288 V0.811 for diatoms and C = 0.216 V0.939 for other phytoplankton taxa (C is carbon content in pg, V is cell volume in μm3) [39]. For individuals < 180 μm3, conversion factors of 0.108 pg C μm−3 for diatoms and 0.157 pg C μm−3 for other phytoplankton taxa were used [40].

2.3. Diversity

Alpha diversity estimators for the phytoplankton community (the Shannon and Evenness indices) were calculated with the PAST3 software [41].
To compute beta diversity of the phytoplankton community for each sampling, we used the ‘betapart’ R package version 1.5.1 [31]. Baselga’s [31,42] approach suggests that Sorensen multiple-site dissimilarity (bSOR) is partitioned into two components: spatial turnover in species composition, measured as Simpson dissimilarity (bSIM) and variation in species composition due to nestedness (bNES) measured as nestedness-resultant fraction of Sorensen dissimilarity. Furthermore, Sorensen pair-wise dissimilarity (bSOR) between site pairs was computed in order to use the values for the construction of non-linear regression fitting models. The above analyses were run in R environment version 3.5.3 [43].

2.4. Non-Linear Regression Models

To explore the relationship between conductivity and phytoplankton metrics (abundance, biomass, phytoplankton C, species richness, Evenness and Shannon index) we created non-linear regression models using conductivity as the predictor variable and phytoplankton metrics as the response variable. Models were fit to the data according to the polynomial equation y = α1X2 + a2X + a3, where y is the response variable, X is the predictor variable and α1, α2 and α3 the model coefficients estimated by maximum likelihood. The statistical significance of the coefficients in the constructed models was assessed by their individual p-value; a p-value < 0.05 indicated a significant coefficient for the predictor variable. The overall significance of each constructed model was assessed by the F-statistic and its p-value. Finally, the strength of the relationship between the predictor and the response variable was determined through the multiple R2. All the included data for the construction of the models were log(x + 1) transformed in order to produce the smallest error possible when making a prediction and improve the fit of the model [44].
To explore the relationship of beta diversity with conductivity we constructed a model using the difference in conductivity (absolute values) between pair of sites and Sorensen pair-wise dissimilarity (bSOR). The polynomial equation was also used to fit the data, the statistical significance of the coefficients was evaluated by their p-value and the overall significance of the model by the F-statistic and its p-value. Multiple R2 was used to examine the strength of the relationship between the difference in conductivity and pair-wise bSOR.

2.5. Statistical Analysis

Multidimensional scaling (MDS) based on Jaccard similarity coefficient of presence-absence data was used to depict the similarities of phytoplankton communities among the different lagoons. Significant differences in phytoplankton community structure among the samples were evaluated with one-way analysis of similarities (ANOSIM) and similarity percentage (SIMPER) analysis was run to determine the percentage contribution of phytoplankton species in dissimilarity between the site pairs. Finally, we used a one-way permutational multivariate analysis of variance (PERMANOVA) to test the significance of conductivity on the phytoplankton community composition and biomass among the different sampling sites. The above statistical analyses were run in PAST 3.

3. Results

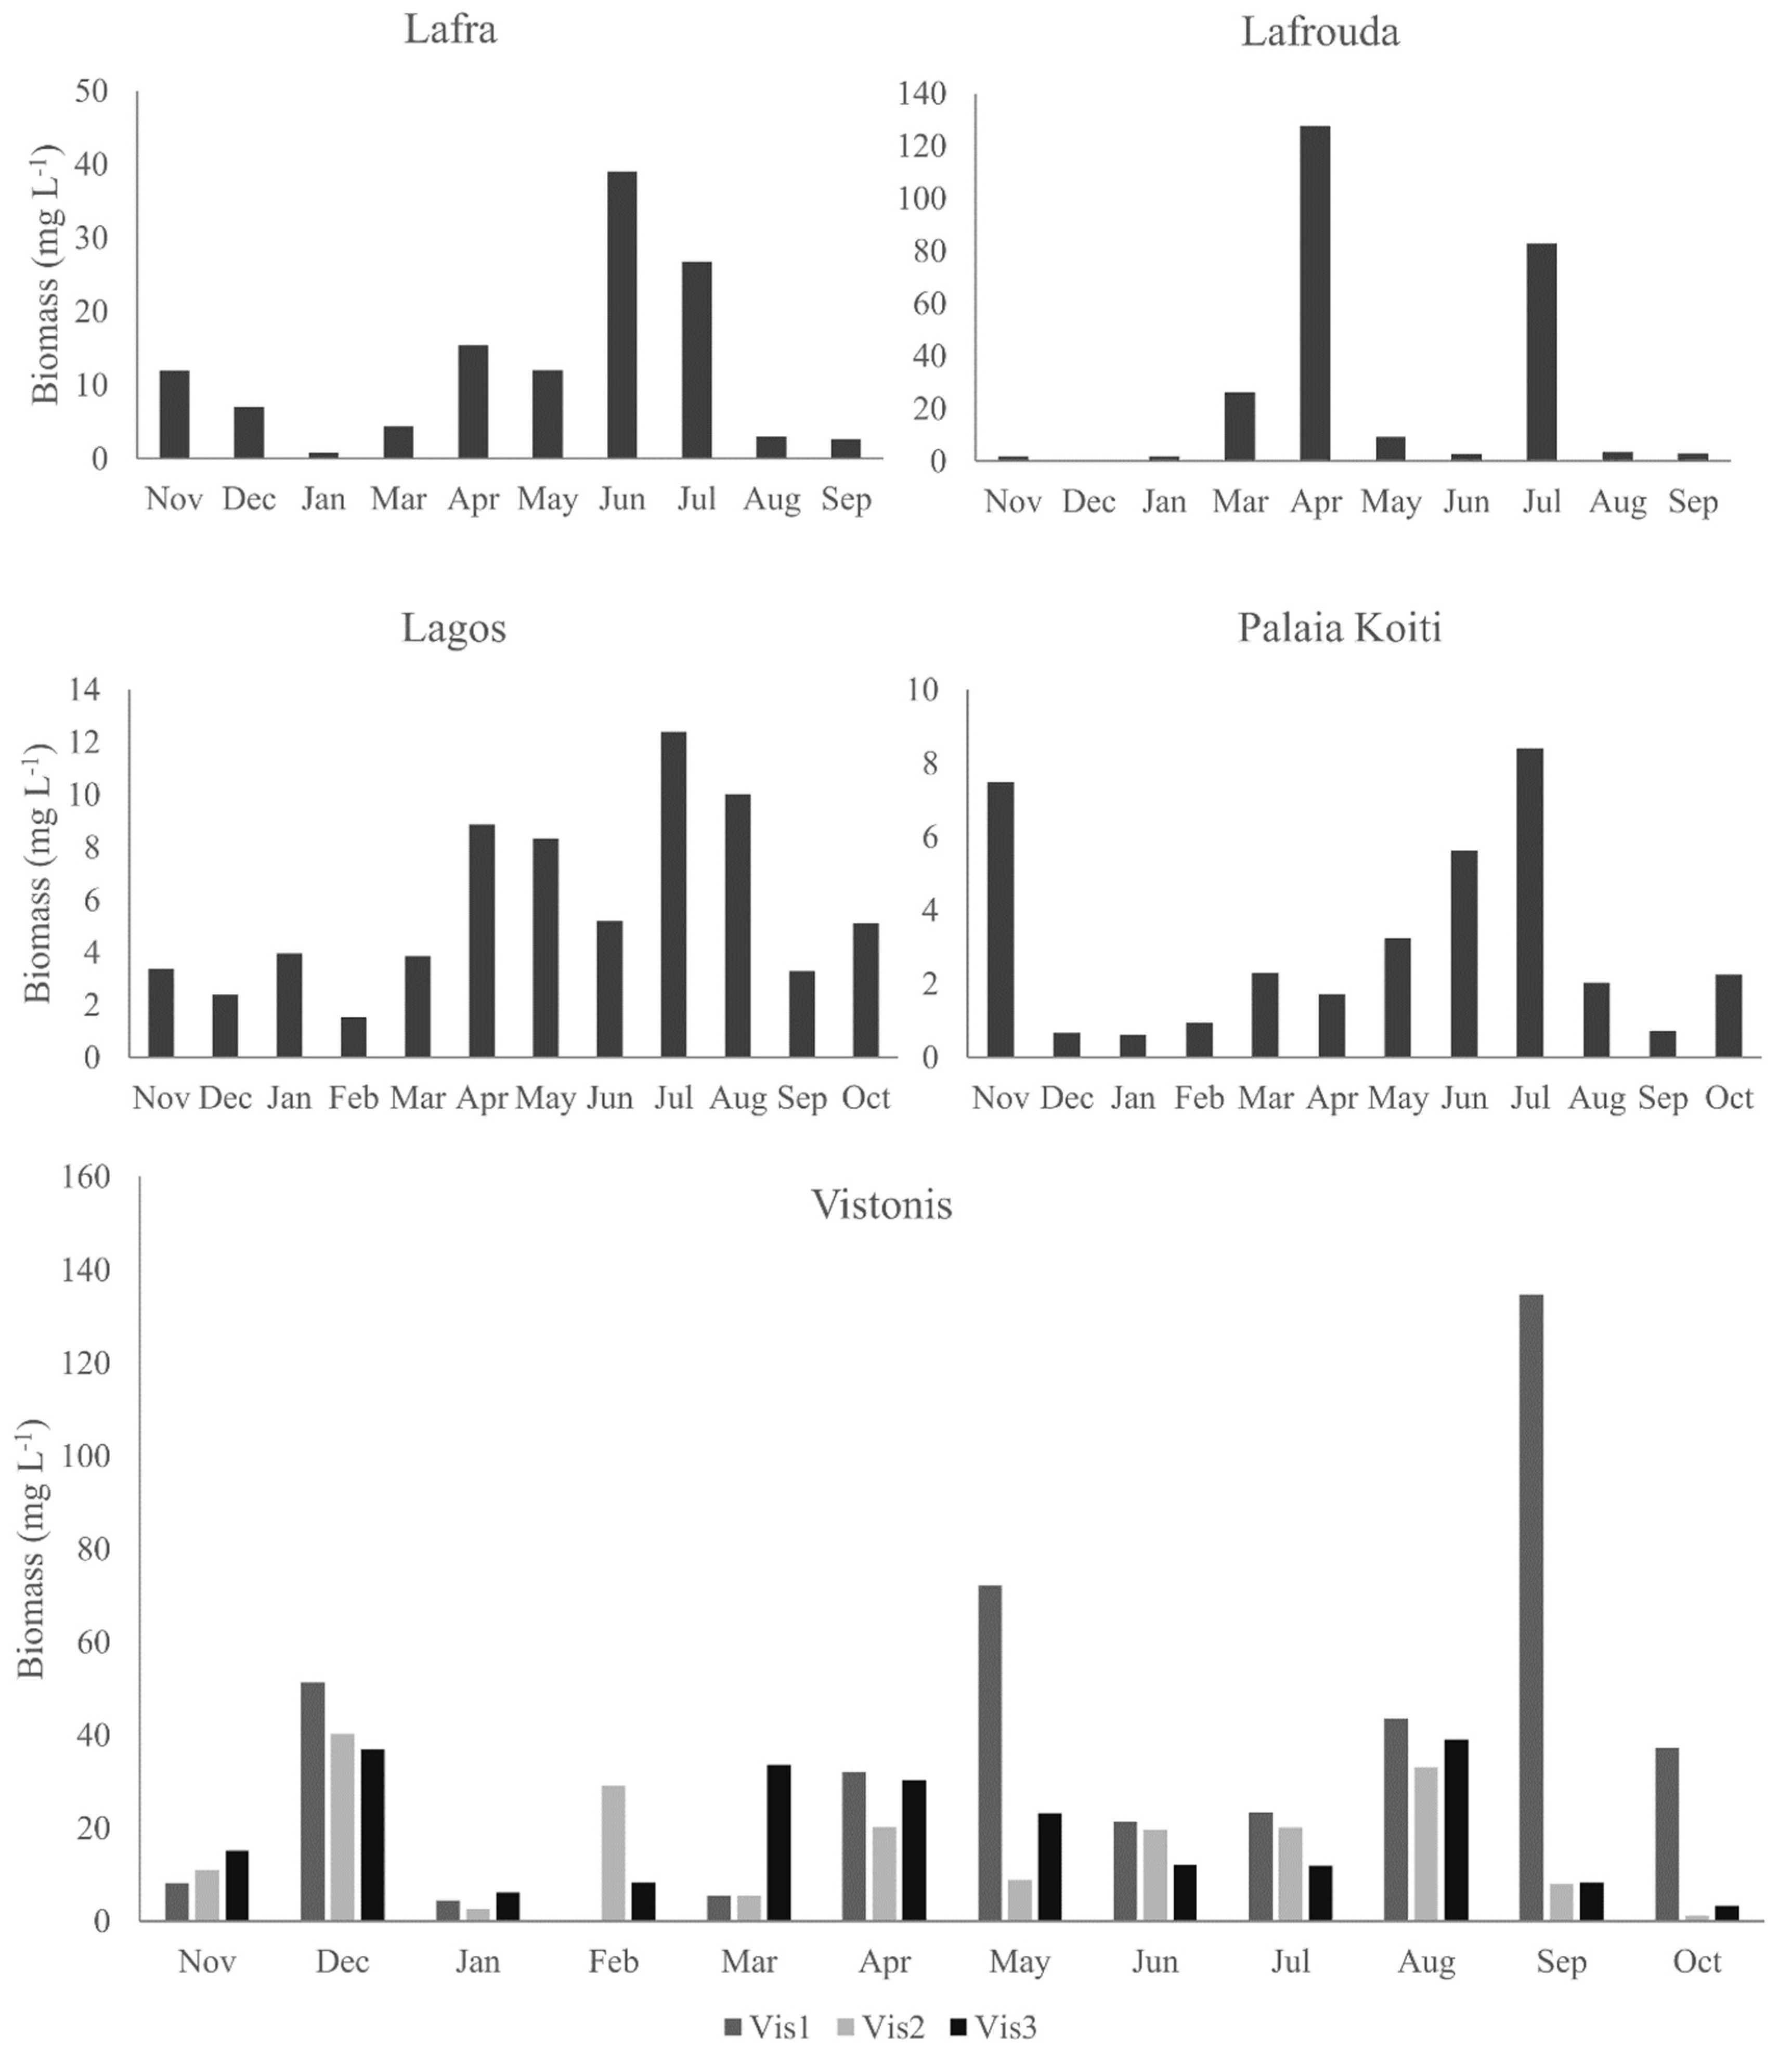
3.1. Phytoplankton Community Structure and Biomass

A total of 77 phytoplankton species were identified in all the sampling sites during one year (November 2018 to October 2019) which were affiliated to 10 taxonomic groups (Supplementary Table S1). Bacillariophyceae (diatoms) had the highest overall species richness among the taxonomic groups with 31 representatives, followed by Dinophyceae (17 species), Chlorophyceae (10 species) and Cyanobacteria (8 species) (Supplementary Table S1). The rest of the taxonomic groups (Cryptophyceae, Haptophyceae, Prymnesiophyceae, Prasinophyceae, Euglenophyceae & Raphidophyceae) contributed with ≤4 species each to total phytoplankton richness. Diatoms were also the most diverse group in terms of species richness in all the sampling sites. Palaia Koiti lagoon with mean annual conductivity 49,468.2 μS cm−1 (mean annual salinity 30.7 psu; Table 1) exhibited the highest diatom richness (28) while Vis1 in Vistonis lagoon with mean annual conductivity 11,664.6 μS cm−1 (mean annual salinity 7.3 psu) the lowest (13) (Table 2). Dinoflagellates had higher richness in Lafra, Lafrouda, Lagos and Palaia Koiti lagoons with a mean annual conductivity > 40,000 μS cm−1 (mean annual salinity > 28 psu). Chlorophytes and cyanobacteria appeared to be more diverse in Vistonis lagoon with mean annual conductivity ≤ 30,000 μS cm−1 (mean annual salinity < 18.5 psu).
Phytoplankton biomass varied highly throughout the year in all the sampling sites with the highest biomass values being most commonly measured during spring and summer and the lowest during winter (Figure 2). The highest variability was recorded in Vis1 where the maximum biomass (134.7 mg L−1) was measured in September 2019. This high biomass was made up by the diatom Rhizosolenia setigera forming a bloom (12,315 cell mL−1) at a conductivity of 16,090 μS cm−1 (9.7 psu). The minimum biomass (4.4 mg L−1) in Vis1 was measured in January 2019 dominated by the diatom Cyclostephanos sp. at a conductivity of 2620 μS cm−1 (2.6 psu). Similarly, high variability in phytoplankton biomass was recorded in Lafrouda lagoon reaching a maximum biomass of 127.8 mg L−1 in April 2019, concurrent with a Prorocentrum minimum bloom (301 cell mL−1) at conductivity 46,400 μS cm−1 (31.6 psu). The minimum biomass (0.2 mg L−1) in this lagoon was measured in December 2018 and was mainly made up by Cyclostephanos sp. at a conductivity of 25,700 μS cm−1 (8.6 psu).
A comparable high variability was noticed for the phytoplankton biomass proxy (phytoplankton C) in all the sampling sites (Supplementary Figure S1a). The widest range was observed in Lafrouda lagoon with a maximum value of 16,448.5 μg C L−1 coinciding with the highest biomass (April 2019) and a minimum of 16.9 μg C L−1 coinciding with the lowest biomass (December 2018). Vis3 followed with a similar wide range and particularly a maximum value of 12,851.4 μg C L−1 was recorded in March 2019 at a conductivity of 23,900 μS cm−1 (14.6 psu). The minimum value of phytoplankton C (417.6 μg C L−1) in Vis3 was observed in October 2019 at a conductivity of 31,600 μS cm−1 (18.6 psu).

3.2. Phytoplankton Diversity

3.2.1. Alpha Diversity Estimators

The number of phytoplankton taxa varied among samples between 7 in December 2018 in Lafrouda lagoon at a conductivity of 25,700 μS cm−1 (8.6 psu) and 29 in June 2018 in Lagos lagoon at a conductivity of 50,600 μS cm−1 (32.7 psu) (Supplementary Table S2). We found an overall increasing trend in the total species richness over spring and summer in all the sampling sites with the lowest number of taxa being most commonly recorded during winter. The highest number of phytoplankton taxa as well as the highest mean annual number of taxa were found in Lagos (29 taxa) and Palaia Koiti (27 taxa) while the lowest in Lafrouda (7 taxa) (Supplementary Figure S1b). Likewise, the Shannon diversity index showed an increasing trend over spring and summer compared to winter months. The highest values along with the highest mean annual values were computed for Lagos and Palaia Koiti (Supplementary Figure S1c). Evenness remained relatively low throughout the study period in all the sampling sites reflecting significant dominance by few taxa (Supplementary Figure S1d). Hence, the lowest values of Evenness were observed at the same time as heavy phytoplankton blooms (e.g., the case of Prorocentrum minimum bloom in April 2019 in Lafrouda lagoon).

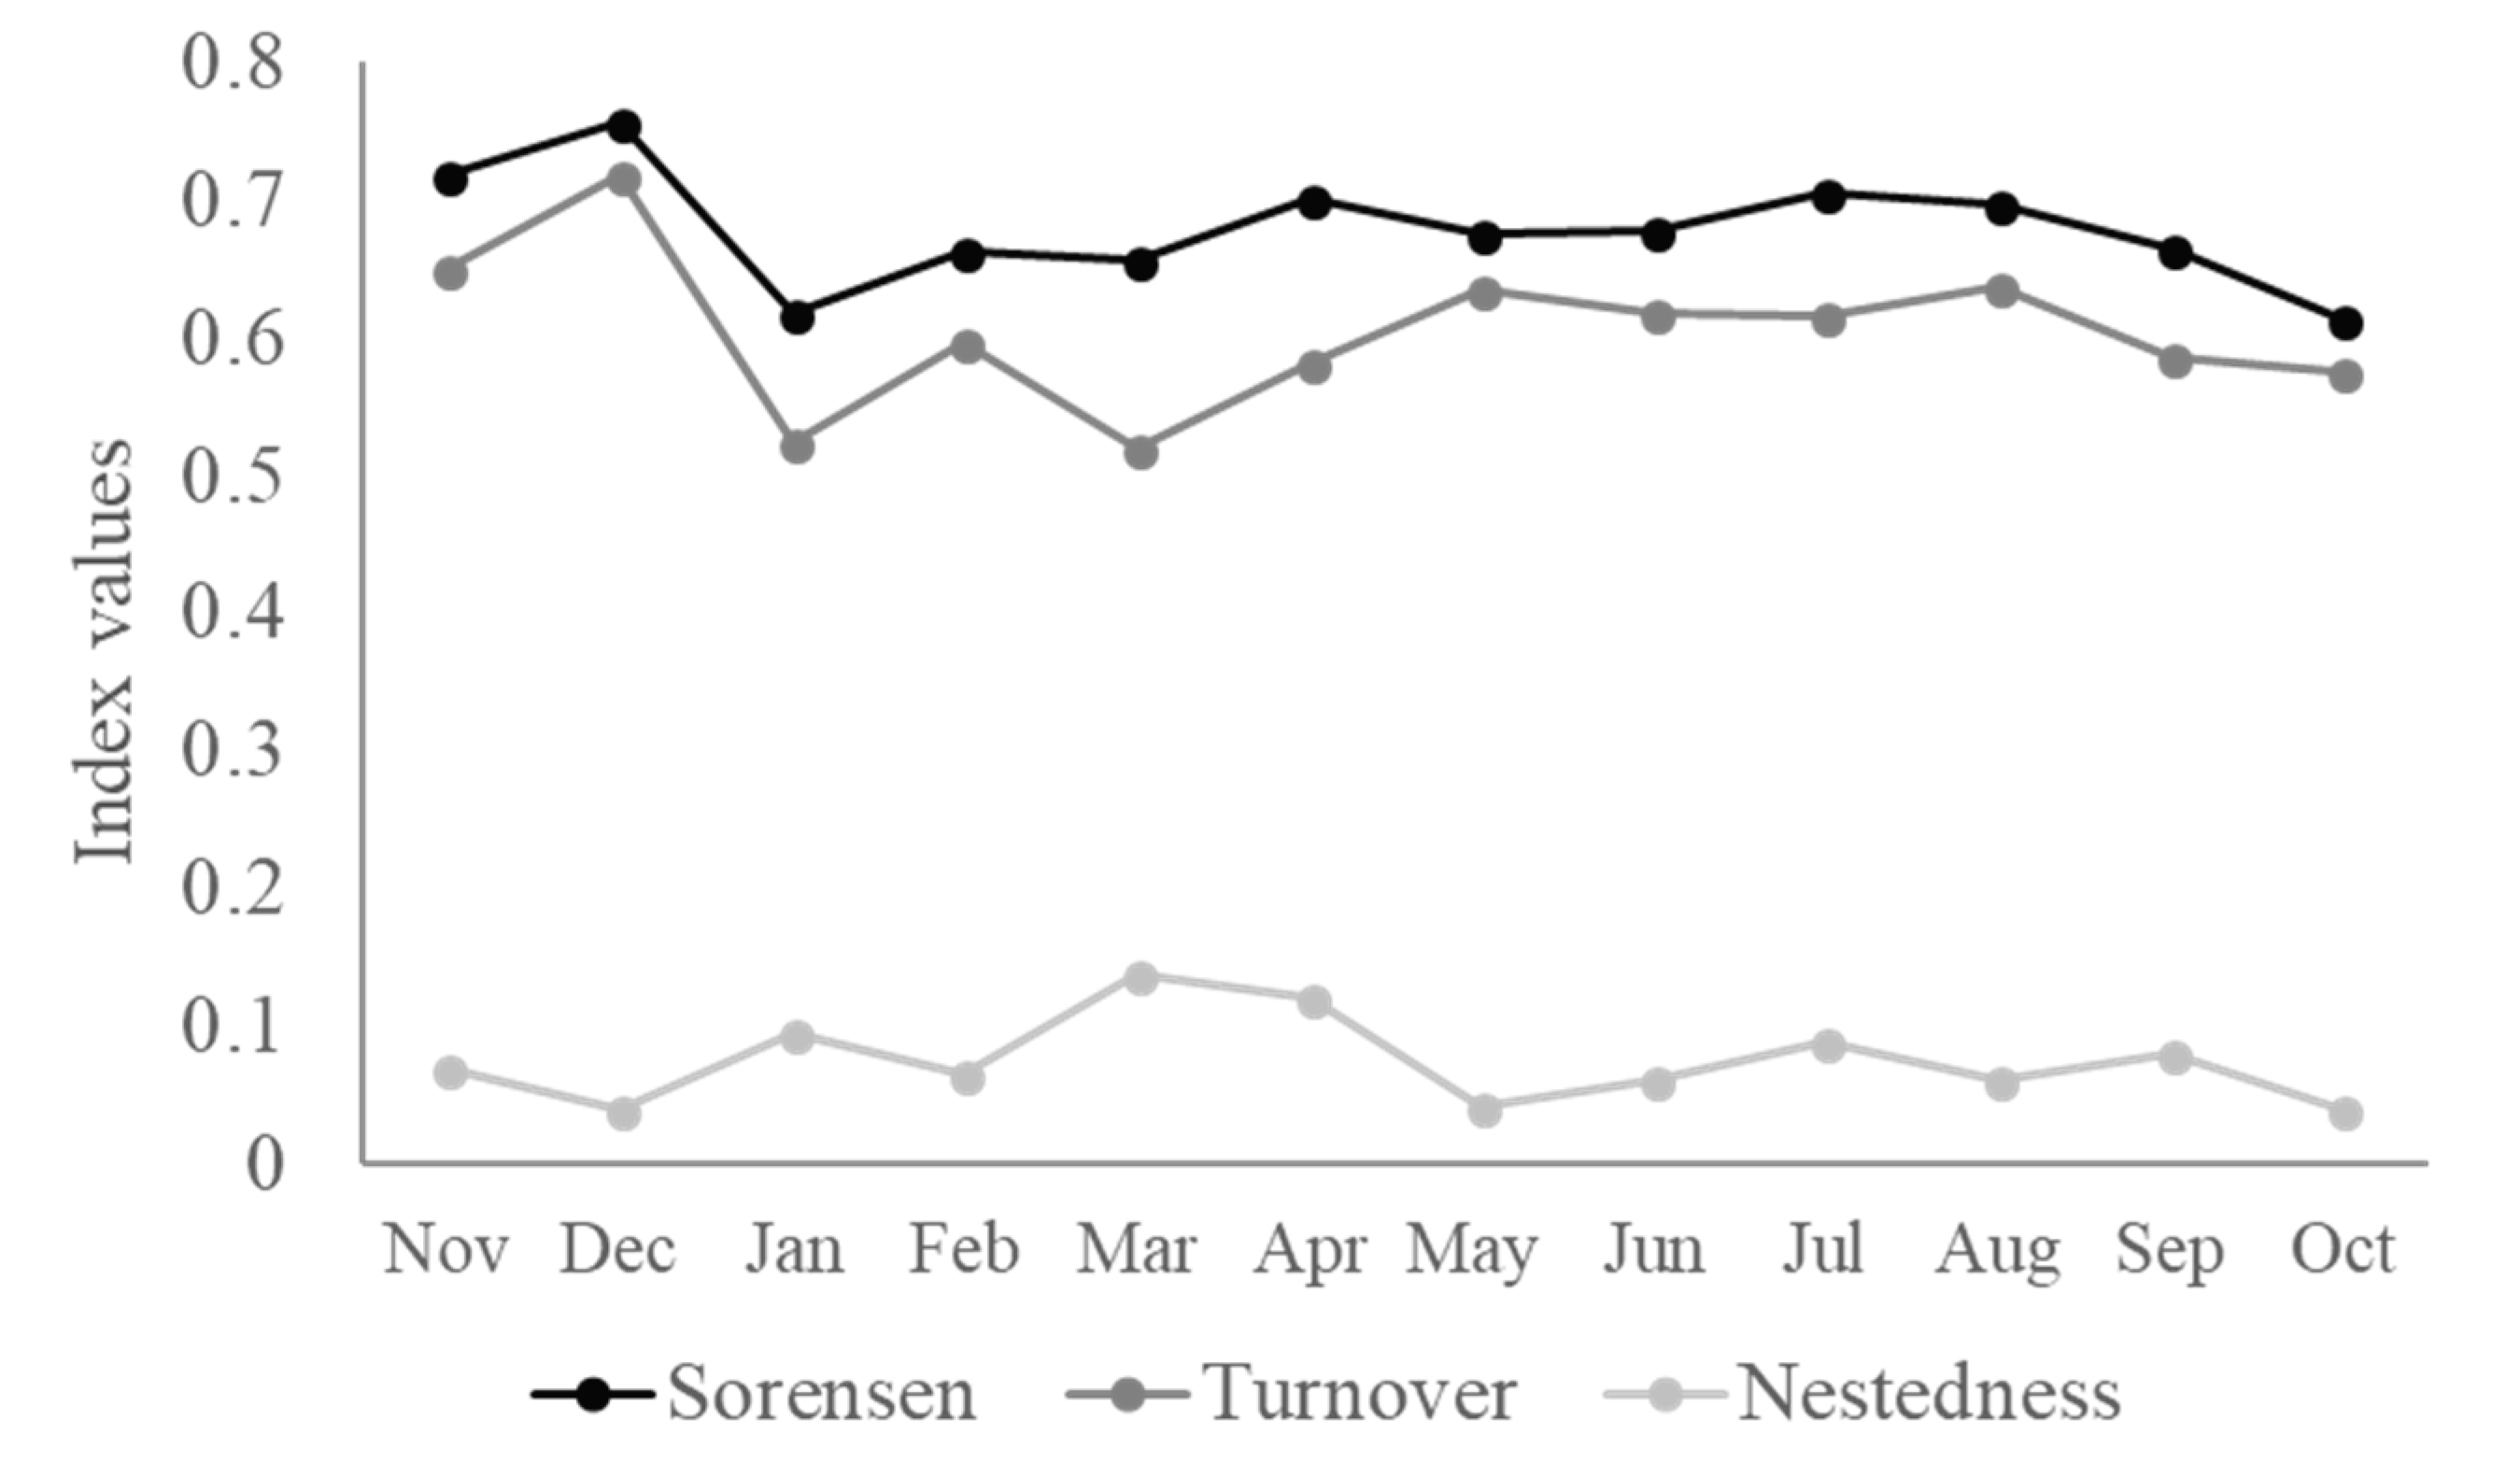
3.2.2. Beta Diversity

Phytoplankton beta diversity ranged from 0.6 (January and October 2019) to 0.76 (December 2018) and did not display a seasonal pattern similar to the majority of alpha diversity estimators (e.g., Species richness and Shannon index). Community compositional variation was almost entirely attributed to species turnover (0.60 ± 0.05 SE) rather than nestedness (0.07 ± 0.05 SE; Figure 3). Both turnover and nestedness did not show high fluctuation under different conductivity levels.

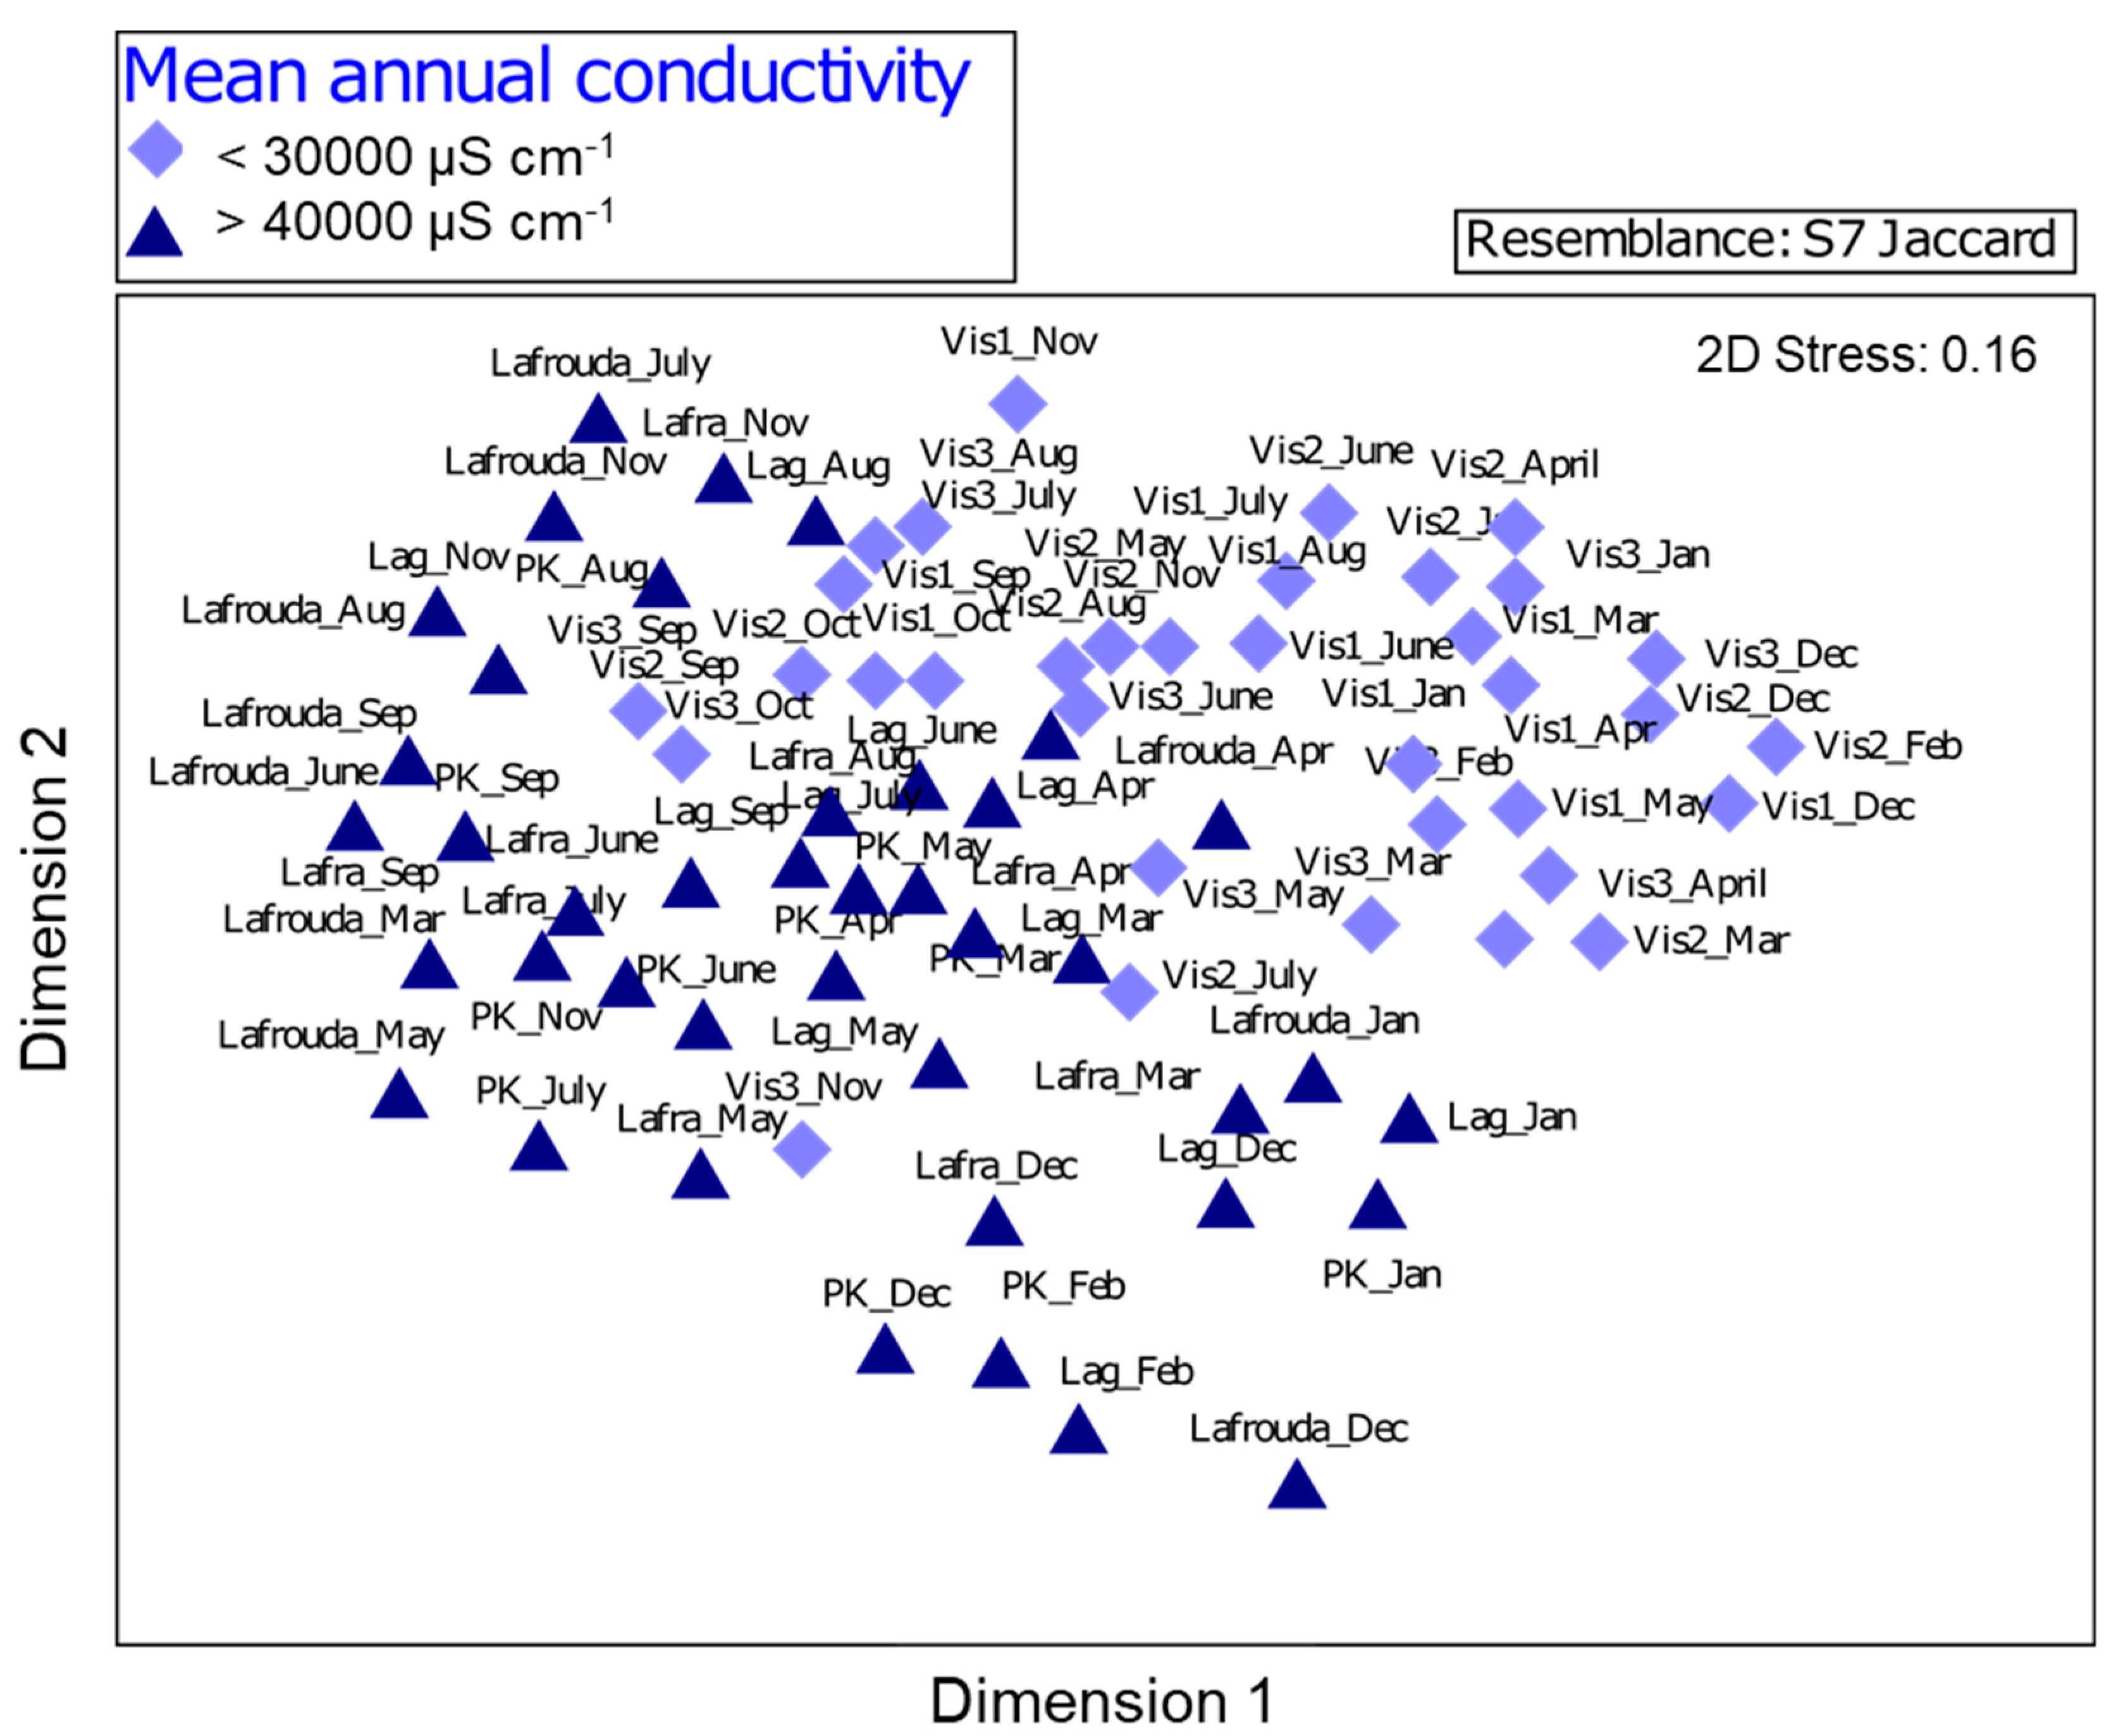
3.3. Phytoplankton Grouping

MDS showed a separation of the phytoplankton community composition based on mean annual conductivity (Figure 4). The majority of the samples from Vistonis lagoon, with a mean annual conductivity ≤ 30,000 μS cm−1 (mean annual salinity < 18.5 psu), were placed together and separately from the samples of Lafra, Lafrouda, PK and Lag sampling sites with mean annual conductivity > 40,000 μS cm−1 (mean annual salinity > 28 psu). This separation was supported by one-way PERMANOVA which detected significant effects of conductivity (F  =  2.0, p  <  0.01) on the phytoplankton community structure. One-way ANOSIM also indicated significant differences (R  =  0.2, psame  <  0.01) since higher similarities in the phytoplankton community composition were found within the same site in two different time points than between two different sites. According to SIMPER analysis, four to nine species were responsible for > 70% of the compositional differences between the three sampling sites of Vistonis lagoon (Vis1, Vis2, Vis3) and Lafra, Lafrouda, PK and Lag with Prorcentrum minimum contributing with > 20% to the compositional differences in all cases (Supplementary Table S3). The other species discriminating the phytoplankton communities among the sampling sites were the diatoms Chaetoceros sp., Cyclostephanos sp., Rhizosolenia setigera and Skeletonema cf. costatum, the dinoflagellates Alexandrium sp. and Gonyaulax verior as well as the coccoid cyanobacteria.
Regarding the biomass values of the discriminating species, Prorocentrum minimum reached the extremely high biomass of 124.6 mg L−1 in April 2019 in Lafrouda lagoon with a conductivity of 46,400 μS cm−1 (31.6 psu). Occasionally, very high biomass was measured for this species in the three sampling sites of Vistonis lagoon; 55.6 mg L−1 in May 2019 in Vis1 at conductivity 15,910 μS cm−1 (9.6 psu) and 26.1 mg L−1 in August 2019 in Vis3 at conductivity 34,900 μS cm−1 (22 psu). On the contrary, the biomass of Prorocentrum minimum remained rather low (<2.5 mg L−1) in Lagos and Palaia Koiti lagoons with mean annual conductivity > 49,000 μS cm−1 (>29 psu). In contrast to Prorocentrum minimum, Alexandrium sp. and Gonyaulax verior were detected only in one or two samples of Vistonis lagoon throughout the study period. However, they were recorded more frequently and with higher biomass in Palaia Koiti, Lagos, Lafra and Lafrouda lagoons. The maximum biomass of Alexandrium sp. (81.4 mg L−1) was measured in July 2019 in Lafrouda at a conductivity of 47,400 μS cm−1 (30.9 psu) and of Gonyaulax verior (3.7 mg L−1) at the same month in Lafra at a conductivity of 36,800 μS cm−1 (25.5 psu). Even though the diatoms Chaetoceros sp., Cyclostephanos sp., Rhizosolenia setigera and Skeletonema cf. costatum were detected in the majority of the samples in the seven sampling sites, they all reached their maximum biomass in Vistonis lagoon, except for Skeletonema cf. costatum, which had higher biomass in Lagos and Palaia Koiti lagoons. In particular, the maximum biomass of Chaetoceros sp. (9.3 mg L−1) was measured in November 2018 in Vis3 at a conductivity of 44,850 μS cm−1 (17.2 psu), of Cyclostephanos sp. (20.5 mg L−1) in December 2018 in Vis2 at a conductivity of 17,457 μS cm−1 (1.7 psu), and of Rhizosolenia setigera (123.2 mg L−1) in September 2019 in Vis1 at a conductivity of 16,090 μS cm−1 (9.7 psu). For Skeletonema cf. costatum the maximum biomass (1.4 mg L−1) was measured in August 2019 in PK at a conductivity of 49,300 μS cm−1 (26.4 psu). Regarding the coccoid cyanobacteria, they were also detected in the majority of the samples. Nevertheless, their biomass was higher in Vistonis lagoon where they reached their maximum value (6.7 mg L−1) in May 2019 in Vis1 at a conductivity of 15,910 μS cm−1 (9.6 psu). Furthermore, in Vistonis lagoon, we measured the maximum biomass for other two cyanobacterial species Dolichospermum flos-aquae in September 2019 at a conductivity of 16,090 μS cm−1 (9.7 psu) and Aphanizomenon favalaroi in November 2018 at a conductivity of 11,716 μS cm−1 (12.8 psu). It is worth noting that Dolichospermum flos-aquae and Aphanizomenon favalaroi were not detected in the samples from the other four lagoons (Lafra, Lafrouda, Lagos, Palaia Koiti) with the exception of two samples in Lagos lagoon where only few individuals were found.

3.4. Non-linear Regression Models

Five out of the seven constructed models demonstrated significant relationships (p-value < 0.05) between conductivity (predictor) and phytoplankton variables (phytoplankton abundance and biomass, phytoplankton C, species richness and pair-wise bSOR) (Table 3). A negative relationship was noticed in all five cases between the predictor and responses variables and in particular, we found that a potential increase in conductivity will lead to significant negative effects on phytoplankton abundance and biomass, phytoplankton C, species richness and pair-wise bSOR (Supplementary Figure S2). The strongest relationship (R2 of 0.4) was detected between conductivity and phytoplankton abundance while the weakest (R2 = 0.1) was between conductivity and pair-wise bSOR. The lowest residual standard error (0.1) was computed for the constructed model between conductivity and species richness since the majority of our observation data were placed above or very close to the best fit (Supplementary Figure S2).

4. Discussion

The significant role of salinity/conductivity in determining the composition and diversity of microbial communities in aquatic ecosystems is supported by a series of studies carried out in coastal lagoons (e.g., [45]), in marine environments (e.g., [12]) as well as in lakes (e.g., [46]). Hydrological connectivity has also been identified as an emergent driver for species homogenization between two or more adjacent sites [47]. After discussing how conductivity affected the phytoplankton community structure and diversity across the five studied lagoons, we will discuss the degree of homogeneity (beta diversity) among the communities. Thus, we address the question of whether environmental heterogeneity in terms of conductivity or hydrological connectivity is the primary driver for shaping the less studied phytoplankton communities in transitional water bodies.

4.1. Phytoplankton Composition and Alpha Diversity

In our study, diatoms were the most diverse group with the highest species number in all five lagoons. This result corroborates previous findings on phytoplankton community structure in other Mediterranean lagoons where diatoms supported the highest taxonomic richness [22,24]. Commonly, diatoms are considered as an important component of phytoplankton communities in estuaries and coastal waters being typically the dominant taxonomic group in terms of species richness in such environments [48]. This success and dominance may be attributed to the higher inherent plasticity that several diatom genera (such as Skeletonema, Chaetoceros, Thalassiosira) have in comparison to other phytoplanktonic genera such as the dinoflagellates Alexandrium and Gonyaulax or the cyanobacterium Aphanizomenon and the chlorophyte Monoraphidium. Bussard et al. [49] associated the phenotypic plasticity of diatoms under different environmental conditions (including a salinity gradient) with their ability to change their gene expression pathways. They mentioned that this taxonomic group induces the expression of stress-related genes under stress environmental conditions. This characteristic justifies the higher acclimation capability of diatoms to environmental fluctuations in comparison to other phytoplankton taxonomic groups. On the other hand, dinoflagellates due to low inherent plasticity together with higher marine affinity were more diverse in the lagoons with relatively high mean annual conductivity/salinity (> 40,000 μS cm−1 and > 28 psu). This is in contrast to chlorophytes and cyanobacteria which are characterized by higher freshwater affinity in brackish waters [50] and appeared to be more diverse in Vistonis lagoon (< 30,000 μS cm−1 and < 18.5 psu).
Conductivity significantly determined the phytoplankton composition and biomass according to one-way PERMANOVA in line with previous studies in similar ecosystems (e.g., [51,52]). In addition, there was very high variation in the values of the two alpha diversity indices with annual mean values of the Shannon index being double in Palaia Koiti lagoon compared to Lafrouda lagoon. Conductivity did not account or only weakly (non-significantly) accounted for differences in alpha diversity indices across the sampling sites (based on the relationships as demonstrated in the constructed non-linear regression models). Thus, most probably, the different typological descriptors (size, morphometry) of the lagoons were responsible for the high variation in species richness. Smith et al. [53] analyzed data from 142 different natural ponds, lakes, and oceans and 239 experimental ecosystems that revealed a strong phytoplankton species–area relationship. Although there is broad agreement on the positive effect of diversity on community productivity [54,55], during our survey, the lowest values of alpha diversity indices were concurrent with the highest phytoplankton biomass. These findings are well in line with the humped-back biomass–species richness relationship in phytoplankton communities due to the habitat and trophic state of the ecosystem [56]. The resultant biomass–species richness relationship indicates that heavily eutrophic environments as our studied lagoons are expected to have strong dominance and not the optimum species richness and diversity. According to Dodson et al. [57] an optimum of phytoplankton species richness is found at intermediate productivity for lake areas <100 km2. In the majority of the cases where very high phytoplankton biomass values was measured, it was attributed to the very high proliferation of one or two species (i.e., Prorocentrum minimum contributed with 97.5% to the total phytoplankton biomass of 127.8 mg L−1 at Lafrouda lagoon measured on April 2019).
Prorocentrum minimum formed blooms in all studied lagoons. This is a harmful, common bloom-forming species in eutrophic, low to moderate salinity coastal and brackish environments [58]. In the Mediterranean region, this species can proliferate in a wide range of water temperatures (4–27 °C) showing great ability to adapt to widely varying natural conditions as shown in our study. Alexandrium, also formed blooms at high biomass at different salinities. The ability of Alexandrium to colonize multiple habitats and its adaptability and persistence over large region has been recognized in association with the ability of its species to produce toxins [59]. Blooms of the other euryhaline species, the mucilage producing diatoms Cylindrotheca closterium, Rhizosolenia setigera and Chaetoceros sp. have been observed in a eutrophic coastal sea contributing to frequent mucilage events [60].

4.2. High Variation in Conductivity Promotes High Phytoplankton Beta Diversity

Beta diversity is considered positively dependent on environmental heterogeneity since an increase in the latter incorporates an increase in the variety of environmental conditions to which different species are adapted, hence promoting greater variation in species composition among local communities within a region [61,62]. Studies on phytoplankton communities from different aquatic environments have provided consistent evidence and relate the enhanced beta diversity to environmental gradients within a region [63,64]. Under different circumstances, environmental homogeneity has been shown to generate biotic homogenization and thus, low beta diversity of biological communities, including phytoplankton [65]. In aquatic ecosystems, hydrological connectivity has been associated with environmental homogeneity and hence, with species dispersal and high shared diversity throughout a region [66,67,68]. Even though hydrological connectivity is supported for the five lagoons connected to Vistonikos Gulf by tidal canals, according to our analyses, instead of finding evidence of biotic homogenization (i.e., low beta diversity and low turnover), we calculated relatively high beta diversity for the entire monitoring period. Community compositional variation was almost entirely attributed to species turnover (i.e., species replacement among the different sampling sites). This result contradicts our hypothesis for biotic homogenization and decreased beta diversity, as a consequence of hydrological connectivity of the lagoons.
We assume that conductivity contributed to the species replacement (turnover) between the sampling sites since a significant effect was detected between conductivity and the pair-wise beta diversity (according to the constructed non-linear regression models). Hence, our hypothesis for heterogeneous phytoplankton communities is clearly supported, reflecting the direct effects of environmental heterogeneity, by means of conductivity in our case, on species turnover according to Soininen et al. [69]. It seems that lagoon typological factors (size, morphometry and especially the share of water volume or surface area in contact to the sediment) and local environmental variables were significant determinants of the community structure in agreement with previous studies [62,70]. Our study provides evidence that habitat fragmentation together with environmental heterogeneity constitute an important part of the theory of metacommunity organization [71].
Understanding the relationships between biological communities and environmental aspects remains a challenge for climate research [72] and at the same time, it is essential for establishing water management policies [70]. Therefore, during this study, we modeled conductivity with several phytoplankton metrics in order to determine the type of relationship (negative or positive) between them. As demonstrated by the constructed non-linear models, all phytoplankton metrics (phytoplankton C, abundance, biomass, species richness and pair-wise beta diversity) consistently exhibited a negative relationship with conductivity, implying that a potential increase in the latter will negatively affect them. Nevertheless, this is a first attempt to predict the phytoplankton response of five Mediterranean lagoons to enhanced salinity due to climate change and longer time series in the future will allow us to strengthen the accuracy of the model and of projections [18].

5. Conclusions

Conductivity/salinity was a key environmental factor in shaping phytoplankton communities across five Mediterranean lagoons connected to the Vistonikos Gulf. In particular, we showed that environmental heterogeneity, by means of conductivity, led to high phytoplankton beta diversity due to high turnover exceeding the effects of hydrological connectivity. This fact implies that local conditions in each lagoon were important in determining which species were capable not only of maintaining a viable population but also of forming a heavy bloom. Nevertheless, the exposure of phytoplankton to continuous salinity fluctuations had as a consequence the increase of euryhaline harmful species. Overall, our results provide useful information for ecological water management of transitional eutrophic water bodies in the Mediterranean region.

Supplementary Materials

The following are available online at https://www.mdpi.com/1424-2818/12/1/38/s1. Supplementary Figure S1: Boxplots of phytoplankton C (a), species richness (b), Shannon index (c) and Evenness (d) in the lagoons Lafra, Lafrouda, Lagos (Lag), Palaia Koiti (PK) and Vistonis (Vis1, Vis2, Vis3). Supplementary Figure S2: Scatter plots conductivity and the different phytoplankton metrics. Supplementary Table S1: Species list of phytoplankton taxa per sampling site during the study period. Supplementary Table S2: Species number, total phytoplankton biomass and alpha diversity indices per sample. Supplementary Table S3: List of higher contributing phytoplankton species in communities’ dissimilarity determined by SIMPER between site pairs.

Author Contributions

Conceptualization, N.S. and M.M.-G.; Sampling D.T., Microscopy Analysis, N.S., M.K.; Data analysis N.S.; Resources, M.M.-G.; Writing-Original Draft Preparation, N.S. and M.M.-G.; Writing Review and Editing N.S., M.M.-G., M.K., E.M., M.D., D.T.; Visualization, N.S., M.D.; Supervision, M.M.-G.; Project Administration, M.K., D.T. and M.M.-G.; Funding Acquisition, M.M.-G. All authors have read and agreed to the published version of the manuscript.

Funding

This research was partially funded by PREFECTURE OF EASTERN MACEDONIA AND THRACE, grant number ELKE-AUTh: 97071.

Conflicts of Interest

The authors declare no conflict of interest.

References

  1. Kjerfve, B. Coastal Lagoon Processes; Elsevier Science Publishers: Amsterdam, The Netherland, 1994; p. 577. [Google Scholar]
  2. Knoppers, B. Aquatic primary production in coastal lagoons. In Coastal Lagoon Processes; Kjerfve, B., Ed.; Elsevier Science Publishers: Amsterdam, The Netherland, 1994; pp. 243–286. [Google Scholar]
  3. Levin, L.A.; Boesch, D.F.; Covich, A.; Dahm, C.; Erséus, C.; Ewel, K.C.; Kneib, R.T.; Moldenke, A.; Palmer, M.A.; Snelgrove, P.; et al. The function of marine critical transition zones and the importance of sediment biodiversity. Ecosystems 2000, 4, 430–451. [Google Scholar] [CrossRef]
  4. Mouillot, D.; Gaillard, S.; Aliaume, C.; Verlaque, M.; Belsher, T.; Troussellier, M.; Thang, D.C. Ability of taxonomic diversity indices to discriminate coastal lagoon environments based on macrophyte communities. Ecol. Indic. 2005, 5, 1–17. [Google Scholar] [CrossRef] [Green Version]
  5. Lloret, J.; Marín, A.; Marín-Guirao, L. Is coastal lagoon eutrophication likely to be aggravated by global climate change? Estuar. Coast. Shelf Sci. 2008, 78, 403–412. [Google Scholar] [CrossRef]
  6. De Casabianca, M.L.; Laugier, T.; Marinho-Soriano, E. Seasonal changes of nutrients in water and sediment in a Mediterranean lagoon with shellfish farming activity (Thau Lagoon, France). ICES Mar. Sci. 1997, 54, 905–916. [Google Scholar] [CrossRef] [Green Version]
  7. Pérez-Ruzafa, A.; Fernández, A.I.; Concepción, M.; Gilabert, J.; Quispe, I.J.; García-Charton, J.A. Spatial and temporal variations of hydrological conditions, nutrients and chlorophyll a in a Mediterranean coastal lagoon (Mar Menor, Spain). Hydrobiologia 2005, 550, 11–27. [Google Scholar] [CrossRef]
  8. Grigorakis, K.; Rigos, G. Aquaculture effects on environmental and public welfare—The case of Mediterranean mariculture. Chemosphere 2011, 85, 899–919. [Google Scholar] [CrossRef]
  9. Eisenreich, S.J. (Ed.) Climate Change and the European Water Dimension; EU-Report 21553 of the European Commission; Joint Research Centre: Ispra, Italy, 2005; p. 253. [Google Scholar]
  10. Intergovernmental Panel on Climate Change [IPCC]. Climate Change 2014: Impacts, Adaptation and Vulnerability; IPCC Working Group II Contribution to the 5th Assessment Report of the International Panel on Climate Change; Cambridge University Press: Cambridge, UK, 2014; p. 169. [Google Scholar]
  11. Intergovernmental Panel on Climate Change [IPCC]. Summary for Policymakers. In Global Warming of 1.5 °C; An IPCC special report on the impacts of global warming of 1.5 °C above pre-industrial levels and related global greenhouse gas emission pathways, in the context of strengthening the global response to the threat of climate change, sustainable development, and efforts to eradicate poverty; World Meteorological Organization: Geneva, Switzerland, 2018; p. 630. [Google Scholar]
  12. Stefanidou, N.; Genitsaris, S.; Lopez-Bautista, J.; Sommer, U.; Moustaka-Gouni, M. Effects of heat shock and salinity changes on coastal Mediterranean phytoplankton in a mesocosm experiment. Mar. Biol. 2018, 165, 154. [Google Scholar] [CrossRef]
  13. Stefanidou, N.; Genitsaris, S.; Lopez-Bautista, J.; Sommer, U.; Moustaka-Gouni, M. Unicellular eukaryotic community response to temperature and salinity variation in mesocosm experiments. Front. Microbiol. 2018, 9, 2444. [Google Scholar] [CrossRef] [Green Version]
  14. Pérez-Ruzafa, A.; Marcos, C.; Pérez-Ruzafa, I.M. Mediterranean coastal lagoons in an ecosystem and aquatic resources management context. Phys. Chem. Earth Parts A B C 2011, 36, 160–166. [Google Scholar] [CrossRef]
  15. Blanchet, M.; Pringault, O.; Bouvy, M.; Catala, P.; Oriol, L.; Caparros, J.; Ortega-Retuerta, E.; Intertaglia, L.; West, N.; Agis, M.; et al. Changes in bacterial community metabolism and composition during the degradation of dissolved organic matter from the jellyfish Aurelia aurita in a Mediterranean coastal lagoon. Environ. Sci. Pollut. Res. 2015, 22, 13638. [Google Scholar] [CrossRef] [Green Version]
  16. Ghai, R.; Hernandez, C.M.; Picazo, A.; Mizuno, C.M.; Ininbergs, K.; Diez, B.; Valas, R.; DuPont, C.L.; McMahon, K.D.; Camacho, A.; et al. Metagenomes of Mediterranean coastal lagoons. Sci. Rep. 2012, 2, 490. [Google Scholar] [CrossRef] [PubMed]
  17. Riera, R.; Tuset, V.M.; Betancur-R, R.; Lombarte, A.; Marcos, C.; Pérez-Ruzafa, A. Modelling alpha-diversities of coastal lagoon fish assemblages from the Mediterranean Sea. Prog. Oceanogr. 2018, 165, 100–109. [Google Scholar] [CrossRef]
  18. Bellino, A.; Mangano, M.C.; Baldantoni, D.; Russell, B.D.; Mannino, A.M.; Mazzola, A.; Vizzini, A.; Sarà, G. Seasonal patterns of biodiversity in Mediterranean coastal lagoons. Divers. Distrib. 2019, 25, 1512–1526. [Google Scholar] [CrossRef] [Green Version]
  19. Orfanidis, S.; Pinna, M.; Sabetta, L.; Stamatis, N.; Nakou, K. Variation of structural and functional metrics in macrophyte communities within two habitats of eastern Mediterranean coastal lagoons: Natural versus human effects. Aquat. Conserv. Mar. Freshw. Ecosyst. 2008, 18, S45–S61. [Google Scholar] [CrossRef]
  20. Koutrakis, E.T.; Tsikliras, A.C.; Sinis, A.I. Temporal variability of the ichthyofauna in a Northern Aegean coastal lagoon (Greece). Influence of environmental factors. Hydrobiologia 2005, 543, 245. [Google Scholar] [CrossRef]
  21. Carlier, A.; Riera, P.; Amouroux, J.M.; Bodiou, J.Y.; Desmalades, M.; Grémare, A. Food web structure of two Mediterranean lagoons under varying degree of eutrophication. J. Sea Res. 2008, 60, 264–275. [Google Scholar] [CrossRef]
  22. Roselli, L.; Stanca, E.; Ludovisi, A.; Durante, G.; Souza, J.S.D.; Dural, M.; Alp, T.; Bulent, S.; Gjoni, V.; Ghinis, S.; et al. Multi-scale biodiverity patterns in phytoplankton from coastal lagoons: The Eastern Mediterranean. Transit. Waters Bull. 2013, 7, 202–219. [Google Scholar]
  23. Bazin, P.; Jouenne, F.; Deton-Cabanillas, A.F.; Pérez-Ruzafa, A.; Véron, B. Complex patterns in phytoplankton and microeukaryote diversity along the estuarine continuum. Hydrobiologia 2014, 726, 155. [Google Scholar] [CrossRef]
  24. Leruste, A.; Pasqualini, V.; Garrido, M.; Malet, N.; De Wit, R.; Bec, B. Physiological and behavioral responses of phytoplankton communities to nutrient availability in a disturbed Mediterranean coastal lagoon. Estuar. Coast. Shelf Sci. 2019, 219, 176–188. [Google Scholar] [CrossRef] [Green Version]
  25. Trombetta, T.; Vidussi, F.; Mas, S.; Parin, D.; Simier, M.; Mostajir, B. Water temperature drives phytoplankton blooms in coastal waters. PLoS ONE 2019, 14, e0214933. [Google Scholar] [CrossRef] [Green Version]
  26. Pavloudi, C.; Oulas, A.; Vasileiadou, K.; Sarropoulou, E.; Kotoulas, G.; Arvanitidis, C. Salinity is the major factor influencing the sediment bacterial communities in a Mediterranean lagoonal complex (Amvrakikos Gulf, Ionian Sea). Mar. Genom. 2016, 28, 71–81. [Google Scholar] [CrossRef] [PubMed]
  27. Grzebyk, D.; Audic, S.; Lasserre, B.; Abadie, E.; de Vargas, C.; Bec, B. Insights into the harmful algal flora in northwestern Mediterranean coastal lagoons revealed by pyrosequencing metabarcodes of the 28S rRNA gene. Harmful Algae 2017, 68, 1–16. [Google Scholar] [CrossRef] [PubMed]
  28. Aires, T.; Muyzer, G.; Serrão, E.A.; Engelen, A.H. Seaweed Loads Cause Stronger Bacterial Community Shifts in Coastal Lagoon Sediments Than Nutrient Loads. Front. Microbiol. 2019, 9, 3283. [Google Scholar] [CrossRef] [PubMed]
  29. Whittaker, R.J.; Willis, K.J.; Field, R. Scale and species richness: Towards a general, hierarchical theory of species diversity. J. Biogeogr. 2001, 28, 453–470. [Google Scholar] [CrossRef] [Green Version]
  30. Koleff, P.; Gaston, K.J.; Lennon, J.J. Measuring beta diversity for presence–absence data. J. Anim. Ecol. 2003, 72, 367–382. [Google Scholar] [CrossRef] [Green Version]
  31. Baselga, A.; Orme, C.D.L. Betapart: An R package for the study of beta diversity. Methods Ecol. Evol. 2012, 3, 808–812. [Google Scholar] [CrossRef]
  32. Baselga, A. Partitioning the turnover and nestedness components of beta diversity. Glob. Ecol. Biogeogr. 2010, 19, 134–143. [Google Scholar] [CrossRef]
  33. Papadakis, E.M.; Tsaboula, A.; Kotopoulou, A.; Kintzikoglou, K.; Vryzas, Z.; Papadopoulou-Mourkidou, E. Pesticides in the surface waters of Lake Vistonis Basin, Greece: Occurrence and environmental risk assessment. Sci. Total Environ. 2015, 536, 793–802. [Google Scholar] [CrossRef]
  34. Arabatzis, G.D.; Kokkinakis, A.K. Typology of the lagoons of Northern Greece according to their environmental characteristics and fisheries production. Oper. Res. Int. J. 2005, 5, 21–34. [Google Scholar] [CrossRef]
  35. Koutrakis, E. Northern Greece Lagoon Management, Suggestions and Problems; Institute of Plant Breeding and Genetic Resources, Hellenic Agricultural Organization-Inale: Kavala, Greece, 2000; p. 50. [Google Scholar]
  36. Weyl, P.K. On the change in electrical conductance of seawater with temperature. Limnol. Oceanogr. 1964, 9, 75–78. [Google Scholar] [CrossRef] [Green Version]
  37. Mazaris, A.D.; Moustaka-Gouni, M.; Michaloudi, E.; Bobori, D.C. Biogeographical patterns of freshwater micro- and macroorganisms: A comparison between phytoplankton, zooplankton and fish in the eastern Mediterranean. J. Biogeogr. 2010, 37, 1341–1351. [Google Scholar] [CrossRef]
  38. Hillebrand, H.; Dürselen, C.-D.; Kirschtel, D.; Pollingher, U.; Zohary, T. Biovolume calculation for pelagic and benthic microalgae. J. Phycol. 1999, 35, 403–424. [Google Scholar] [CrossRef]
  39. Menden-Deuer, S.; Lessard, E.J. Carbon to volume relationships for dinoflagellates, diatoms, and other protist plankton. Limnol. Oceanogr. 2000, 45, 569–579. [Google Scholar] [CrossRef] [Green Version]
  40. Sommer, U.; Lengfellner, K.; Lewandowska, A. Experimental induction of a coastal spring bloom early in the year by intermittent high-light episodes. Mar. Ecol. Prog. Ser. 2012, 446, 61–71. [Google Scholar] [CrossRef] [Green Version]
  41. Hammer, Ø.; Harper, D.A.T.; Ryan, P.D. Past: Paleontological statistics software package for education and data analysis. Palaeontol. Electron. 2001, 4, 9–10. [Google Scholar]
  42. Baselga, A. Multiplicative partition of true diversity yields independent alpha and beta components; additive partition does not. Ecology 2010, 91, 1974–1981. [Google Scholar] [CrossRef]
  43. R Core Team. R: A Language and Environment for Statistical Computing; R Foundation for Statistical Computing: Vienna, Austria, 2018; Available online: https://www.R-project.org/ (accessed on 20 May 2019).
  44. Benoit, K. Linear Regression Models with Logarithmic Transformations; London Methodology Institute, London School of Economics: London, UK, 2011; p. 25. [Google Scholar]
  45. Hemraj, D.A.; Hossain, M.A.; Ye, Q.; Qin, J.G.; Leterme, S.C. Plankton bioindicators of environmental conditions in coastal lagoons. Estuar. Coast. Shelf Sci. 2017, 184, 102–114. [Google Scholar] [CrossRef]
  46. Yang, J.; Ma, L.A.; Jiang, H.; Wu, G.; Dong, H. Salinity shapes microbial diversity and community structure in surface sediments of the Qinghai-Tibetan Lakes. Sci. Rep. 2016, 6, 25078. [Google Scholar] [CrossRef] [Green Version]
  47. Pérez-Ruzafa, A.; De Pascalis, F.; Ghezzo, M.; Quispe-Becerra, J.L.; Hernández-García, R.; Muñoz, I.; Vergara, C.; Pérez-Ruzafa, I.M.; Umgiesser, G.; Marcos, C. Connectivity between coastal lagoons and sea: Asymmetrical effects on assemblages’ and populations’ structure. Estuar. Coast. Shelf Sci. 2019, 216, 171–186. [Google Scholar] [CrossRef]
  48. Carstensen, J.; Klais, R.; Cloern, J.E. Phytoplankton blooms in estuarine and coastal waters: Seasonal patterns and key species. Estuar. Coast. Shelf Sci. 2015, 162, 98–109. [Google Scholar] [CrossRef] [Green Version]
  49. Bussard, A.; Corre, E.; Hubas, C.; Duvernois-Berthet, E.; Le Corguillé, G.; Jourdren, L.; Coulpier, F.; Claquin, P.; Lopez, P.J. Physiological adjustments and transcriptome reprogramming are involved in the acclimation to salinity gradients in diatoms. Environ. Microbiol. 2017, 19, 909–925. [Google Scholar] [CrossRef] [PubMed]
  50. Michaloudi, E.; Moustaka-Gouni, M.; Gkelis, S.; Pantelidakis, K. Plankton community structure during an ecosystem disruptive algal bloom of Prymnesium parvum. J. Plankton Res. 2009, 31, 301–309. [Google Scholar] [CrossRef] [Green Version]
  51. Adolf, J.E.; Burns, J.; Walker, J.K.; Gamiao, S. Near shore distributions of phytoplankton and bacteria in relation to submarine groundwater discharge-fed fishponds, Kona coast, Hawaii, USA. Estuar. Coast. Shelf Sci. 2019, 219, 341–353. [Google Scholar] [CrossRef]
  52. Draredja, M.A.; Frihi, H.; Boualleg, C.; Gofart, A.; Abadie, E.; Laabir, M. Seasonal variations of phytoplankton community in relation to environmental factors in a protected meso-oligotrophic southern Mediterranean marine ecosystem (Mellah lagoon, Algeria) with an emphasis of HAB species. Environ. Monit. Assess. 2019, 191, 603. [Google Scholar] [CrossRef] [PubMed]
  53. Smith, L.C.; Sheng, Y.; MacDonald, G.M.; Hinzman, L.D. Disappearing Arctic lakes. Science 2005, 308, 1429. [Google Scholar] [CrossRef] [Green Version]
  54. Stachowicz, J.J.; Best, R.J.; Bracken, M.E.S.; Graham, M.H. Complementarity in marine biodiversity manipulations: Reconciling divergent evidence from field and mesocosm experiments. Proc. Natl. Acad. Sci. USA 2008, 105, 18842–18847. [Google Scholar] [CrossRef] [Green Version]
  55. Lewandowska, A.M.; Breithaupt, P.; Hillebrand, H.; Hoppe, H.G.; Jürgens, K.; Sommer, U. Responses of primary productivity to increased temperature and phytoplankton diversity. J. Sea Res. 2012, 72, 87–93. [Google Scholar] [CrossRef]
  56. Török, P.; Krasznai, E.T.; Béres, V.B.; Bácsi, I.; Borics, B.G.; Tóthmérész, B. Functional diversity supports the biomass-diversity humped-back relationship in phytoplankton assemblages. Funct. Ecol. 2016, 30, 1593–1602. [Google Scholar] [CrossRef] [Green Version]
  57. Dodson, S.I.; Arnott, S.E.; Cottingham, K.L. The relationship in lake communities between primary productivity and species richness. Ecology 2000, 81, 2662–2679. [Google Scholar] [CrossRef]
  58. Heil, C.A. Influence of humic, fulvic and hydrophilic acids on the growth, photosynthesis and respiration of the dinoflagellate Prorocentrum minimum (Pavillard) Schiller. Harmful Algae 2005, 4, 603–618. [Google Scholar] [CrossRef]
  59. Anderson, D.M. Bloom dynamics of toxic Alexandrium species in the northeastern US. Limnol. Oceanogr. 1997, 42, 1009–1022. [Google Scholar] [CrossRef]
  60. Genitsaris, S.; Stefanidou, N.; Sommer, U.; Moustaka-Gouni, M. Phytoplankton Blooms, Red Tides and Mucilaginous Aggregates in the Urban Thessaloniki Bay, Eastern Mediterranean. Diversity 2019, 11, 136. [Google Scholar] [CrossRef] [Green Version]
  61. Tonkin, J.D.; Stoll, S.; Jähnig, S.C.; Haase, P. Contrasting metacommunity structure and beta diversity in an aquatic-floodplain system. Oikos 2016, 125, 686–697. [Google Scholar] [CrossRef]
  62. Heino, J.; Soininen, J.; Alahuhta, J.; Lappalainen, J.; Virtanen, R. Metacommunity ecology meets biogeography: Effects of geographical region, spatial dynamics and environmental filtering on community structure in aquatic organisms. Oecologia 2017, 183, 121. [Google Scholar] [CrossRef] [Green Version]
  63. Maloufi, S.; Catherine, A.; Mouillot, D.; Louvard, C.; Couté, A.; Bernard, C.; Troussellier, M. Environmental heterogeneity among lakes promotes hyper β-diversity across phytoplankton communities. Freshw. Biol. 2016, 61, 633–645. [Google Scholar] [CrossRef]
  64. Chaparro, G.; Horváth, Z.; O’Farrell, I.; Ptacnik, R.; Hein, T. Plankton metacommunities in floodplain wetlands under contrasting hydrological conditions. Freshw. Biol. 2018, 63, 380–391. [Google Scholar] [CrossRef] [Green Version]
  65. Zhang, Y.; Peng, C.; Huang, S.; Wang, J.; Xiong, X.; Li, D. The relative role of spatial and environmental processes on seasonal variations of phytoplankton beta diversity along different anthropogenic disturbances of subtropical rivers in China. Environ. Sci. Pollut. Res. 2019, 26, 1422. [Google Scholar] [CrossRef]
  66. Bozelli, R.L.; Thomaz, S.M.; Padial, A.A.; Lopes, P.M.; Bini, L.M. Floods decrease zooplankton beta diversity and environmental heterogeneity in an Amazonian floodplain system. Hydrobiologia 2015, 753, 233–241. [Google Scholar] [CrossRef]
  67. Gao, Y.; Sassenhagen, I.; Richlen, M.L.; Donald, M.; Anderson, D.M.; Martin, J.L.; Erdner, D.L. Spatiotemporal genetic structure of regional-scale Alexandrium catenella dinoflagellate blooms explained by extensive dispersal and environmental selection. Harmful Algae 2019, 86, 46–54. [Google Scholar] [CrossRef]
  68. Katsiapi, M.; Genitsaris, S.; Stefanidou, N.; Tsavdaridou, A.; Giannopoulou, I.; Stamou, G.; Michaloudi, E.; Mazaris, A.; Moustaka-Gouni, M. Ecological connectivity in two ancient lakes: Impact upon planktonic cyanobacteria and water quality. Water 2020, 12, 18. [Google Scholar] [CrossRef] [Green Version]
  69. Soininen, J.; Heino, J.; Wang, J. A meta-analysis of nestedness and turnover components of beta diversity across organisms and ecosystems. Glob. Ecol. Biogeogr. 2018, 27, 96–109. [Google Scholar] [CrossRef] [Green Version]
  70. Moustaka-Gouni, M.; Sommer, U.; Economou-Amilli, A.; Arhonditsis, G.B.; Katsiapi, M.; Papastergiadou, E.; Kormas, A.K.; Vardaka, E.; Karayanni, H.; Papadimitriou, T. Implementation of the Water Framework Directive: Lessons Learned and Future Perspectives for an Ecologically Meaningful Classification Based on Phytoplankton of the Status of Greek Lakes, Mediterranean Region. Environ. Manag. 2019, 64, 675. [Google Scholar] [CrossRef] [PubMed]
  71. Leibold, M.A.; Holyoak, M.; Mouquet, N.; Amarasekare, P.; Chase, J.M.; Hoopes, M.F.; Holt, R.D.; Shurin, J.B.; Law, R.; Tilman, D.; et al. The metacommunity concept: A framework for multi-scale community ecology. Ecol. Lett. 2004, 7, 601–613. [Google Scholar] [CrossRef]
  72. Tunney, T.D.; McCann, K.S.; Lester, N.P.; Brian, J.; Shuter, B.J. Differential warming affects complex communities. Proc. Natl. Acad. Sci. USA 2014, 22, 8077–8082. [Google Scholar] [CrossRef] [Green Version]
Figure 1. Study area and sampling sites in Lafra, Lafrouda, Lagos (Lag), Palaia Koiti (PK) and Vistonis (Vis1, Vis2, Vis3) lagoons. The sampling sites are indicated with a red symbol.
Diversity 12 00038 g001
Figure 2. Total phytoplankton biomass in Lafra, Lafrouda, Lagos, Palaia Koiti and Vistonis lagoons during the period from November 2018 to October 2019.
Diversity 12 00038 g002
Figure 3. Phytoplankton beta diversity according to Sorensen similarity index (bSOR), turnover (bSIM) and nestedness (bNES) components values in Lafra, Lafrouda, Lagos, Palaia Koiti and Vistonis lagoons during the period from November 2018 to October 2019.
Diversity 12 00038 g003
Figure 4. Multidimensional scaling plot of phytoplankton biomass variation in Lafra, Lafrouda, Lagos (Lag), Palaia Koiti (PK) and Vistonis (Vis1, Vis2, Vis3) lagoons according to Jaccard similarity index. Samples with mean annual conductivity lower than 30,000 μS cm−1 are represented with a light blue rhomb and samples with mean annual conductivity higher than 40,000 μS cm−1 are represented with a dark blue triangle. 2D Stress value: 0.16.
Diversity 12 00038 g004
Table 1. Latitude, longitude, mean annual conductivity (μS cm−1) and mean annual salinity (psu) per sampling site.
Sampling SiteLagoonLatitudeLongitudeMean Annual Conductivity (μS cm−1)Mean Annual Salinity (psu)
LafraLafra40°59′32.08″ N25° 2′29.49″ E4,3334.928.2
LafroudaLafrouda40°59′11.98″ N25° 1′51.57″ E4,7201.431.1
LagLagos40°59′36.13″ N25° 8′43.93″ E4,9274.129.8
PKPalaia Koiti40°54′23.90″ N24°52′24.32″ E4,9468.230.7
Vis1Vistonis41°0′3.58″ N25° 9′20.89″ E1,1664.67.3
Vis2Vistonis41°0′27.24″ N25° 8′15.77″ E2,4811.413.9
Vis3Vistonis41°0′19.28″ N25° 8′16.10″ E3,0070.918.2
Table 2. Number of species for each phytoplankton taxonomic group in Lafra, Lafrouda, Lagos (Lag), Palaia Koiti (PK) and Vistonis (Vis1, Vis2, Vis3) lagoons.
LafraLafroudaLagosPalaia KoitiVis1Vis2Vis3
Cyanobacteria5574878
Bacillariophyceae18211628131820
Dinophyceae121015139812
Chlorophyceae4243857
Others98109898
Table 3. Statistics of the constructed non-linear regression models. Significant relationships (p-value < 0.05) are in bold.
Response VariablePredictorMultiple R2F-StatisticdFp-Value
Phytoplankton abundance Conductivity0.40022.80673.810−8
Phytoplankton biomass Conductivity0.2088.80670.0004
Phytoplankton C Conductivity0.26912.30672.764−5
Phytoplankton species richnessConductivity0.1877.70670.943−8
ShannonConductivity0.0391.35670.270
EvennessConductivity0.1003.60670.053
Pair-wise bSORDifference in conductivity0.10073.6924122.210−16

