Article

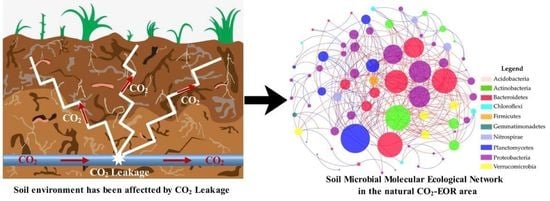
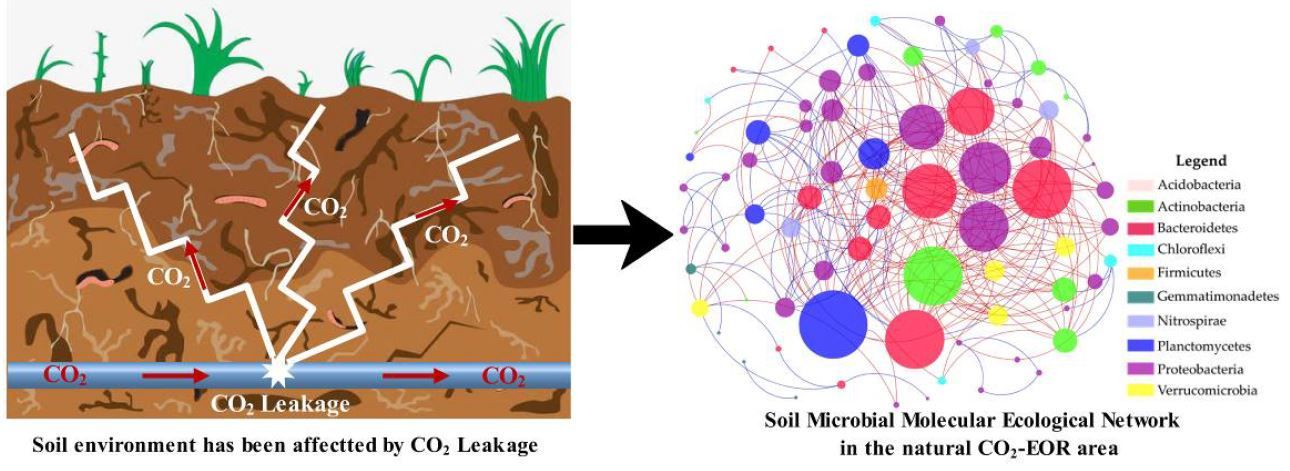
Impacts of Elevated CO2 Levels on the Soil Bacterial Community in a Natural CO2-Enhanced Oil Recovery Area

1
Jiangsu Key Laboratory of Coal-based Greenhouse Gas Control and Utilization, China University of Mining and Technology, Xuzhou 221008, China
2
Low Carbon Energy Institute, China University of Mining and Technology, Xuzhou 221008, China
3
School of Environmental Science and Spatial Informatics, China University of Mining and Technology, Xuzhou 221008, China
*
Author to whom correspondence should be addressed.
These authors contributed equally to this work.
Diversity 2019, 11(5), 77; https://doi.org/10.3390/d11050077
Submission received: 29 March 2019 / Revised: 8 May 2019 / Accepted: 9 May 2019 / Published: 11 May 2019

Abstract

:
Knowledge of the interactions among different microorganisms is important to understand how ecological function transformation is affected by elevated CO2 levels in CO2-enhanced oil recovery (CO2-EOR) sites. Molecular ecological networks were established to reveal the interactions among different microbes of the soil bacterial community with the high-throughput sequencing data of 16S rRNA genes. The results showed that these networks are a powerful tool to identify and explain the interactions and keystone species in the communities under elevated CO2 pressure. The structures of networks under different CO2 leakage concentrations were different as a result of the networks’ topology properties, such as node numbers, topological roles of individual nodes, and network hubs. These indicators imply that the interactions among different groups were obviously changed. Moreover, changes in the network structure were significantly correlated with soil pH value, which might suggest that the large CO2 leakage affected the soil ecosystem functions by changing the network interactions. Additionally, the key microbial populations such as Bacteroidetes and Proteobacteria were distinguished based on network topology to reveal community structure and ecosystem functioning. The work developed in this study could help microbiologists to address some research questions that could not be approached previously, and, hence, might represent a new area of research for microbial ecology.

Graphical Abstract

1. Introduction

Global climate change, mainly caused by the anthropogenic CO2 emissions from the utilization of fossil fuels, has become a critical challenge [1]. To reduce the increased CO2 emissions, a useful technology, called CO2 capture, utilization, and sequestration (CCUS), has been exploited [2,3]. CO2-enhanced oil recovery (CO2-EOR), which involves using CO2 to enhance oil recovery or improve the recovery ratio of oil reservoirs, as a promising technology of CCUS, has been widely applied in oil recovery around the world [4]. At present, there are four CO2-EOR demonstration projects in China, in the Shengli Oilfield, Yanchang Oilfield, Jilin Oilfield, and Shenhua Group [5,6]. Although this technology could improve the recovery ratio of oil reservoirs with low cost and high recoverability, there is still a risk of gas leakage during the CO2-EOR process. CO2 leakage can result from the CO2 transportation process, as well as from CO2 injection wells and oil production. Once the leakage occurs, there may be some negative impacts on the near-surface ecosystem [7,8]. Thus, more attention should be paid to the potential environmental consequences induced by any kind of CO2 leakage [9,10].
Microbial communities play a key role in the soil carbon and nitrogen cycles, since they have tremendously metabolic diversity and versatility [11]. Some researchers have reported that the diversity of microbial communities could affect ecosystem functions via the control and change of above- and below-ground processes [12,13]. The interactions among different species in soil ecosystems form many complex functional networks. Therefore, the soil ecosystem has the ability to accomplish many functions, such as nutrient cycling and organic matter decomposition, that might be the network interactions [14,15]. However, due to the diversity of soil microbial communities, it is difficult to elucidate the soil ecosystem functions, and these functions are impossible for individual species to achieve. Therefore, a detailed explanation of the interactions between species across complicated and diverse communities is useful to define the functional roles occupied by uncultured microbes [15,16,17]. On the other hand, due to their microbial diversity, few studies have investigated the ecological networks of soil microbial communities.
Many studies have been conducted on the impacts of CO2 leakage in recent years [4,18]. Beaubien et al. [19] found that, near the CO2 exhaust port at a natural geological CO2 emission point, the acidic soil environment decreased the soil microbial activity and enzyme activity, thus greatly affecting the activity of the rhizosphere microorganisms. Additionally, Oesterreicher-Cunha et al. [20] studied the effect of CO2 seepage on soil microorganisms in the Atlantic forest zone, South America. Furthermore, Liu et al. showed that the diversity of fungal and bacterial community was consistently positive in short-term responses to CO2 enrichment [21]. Moreover, Beulig et al. [22] found that, in a wetland mofette, the volcanic CO2 could change the geochemistry, and then promote anaerobic and acidophilic organisms in affected soils. However, considering the long periods of CO2 emission from natural seepages, the ecosystem may have already adapted through species substitution [11,23]. How the microorganisms worked together to make themselves fit for the high-CO2 environment is still unknown. Although natural sites can present existing special features, such as soil type and soil temperature, the results from natural sites might not be applicable to the conditions of possible leakage from the CO2-EOR process. A sudden and continuous high CO2 concentration might change the soil biochemical conditions, leading to the variation of the functionality or diversity of local microorganisms.
In recent years, as technology has developed, detailed information about soil microbial communities has become available using high-throughput sequence technology [24,25]. Despite this, it is still a big challenge to explore and analyze interactions among these communities due to the huge amounts of sequence data. The network analysis of interaction patterns can provide new insights into the structures of complex microbial communities. Inter-species associations might help to identify and elucidate the cooperation going on between community members. This knowledge is especially precious in soil ecosystems [26,27]. Exploring the interactions between soil microorganisms would be useful for determining potential biological interactions, environmental bias, or shared physiology. Network analysis has been proposed as a new way to identify and explore the interaction patterns in huge and complicated datasets, which might be more difficult to detect with alpha/beta diversity analysis [28,29]. Nowadays, more and more researchers have started to apply network analysis to explore interaction patterns between microorganisms in complex communities [30,31]. However, this approach still needs to focus more attention on the soil microorganisms to explore their interactions in global change.
To further understand how elevated CO2 emissions affect the composition and abundance of soil bacterial communities at CO2-EOR sites, in this study, we try to use network analyses to explore associations between soil bacterial taxa at a CO2-EOR site. A total of 60 soil samples were collected from three CO2 leakage points at a CO2-EOR project, and their bacterial 16S rRNA gene sequences were then analyzed. This study attempts to examine the following: (1) how bacterial community structure and diversity changed under different CO2 leakage concentrations; (2) which were the key microbial survivors in response to higher CO2 leakage; and (3) whether the abundance of keystone species was associated with soil properties.

2. Materials and Methods

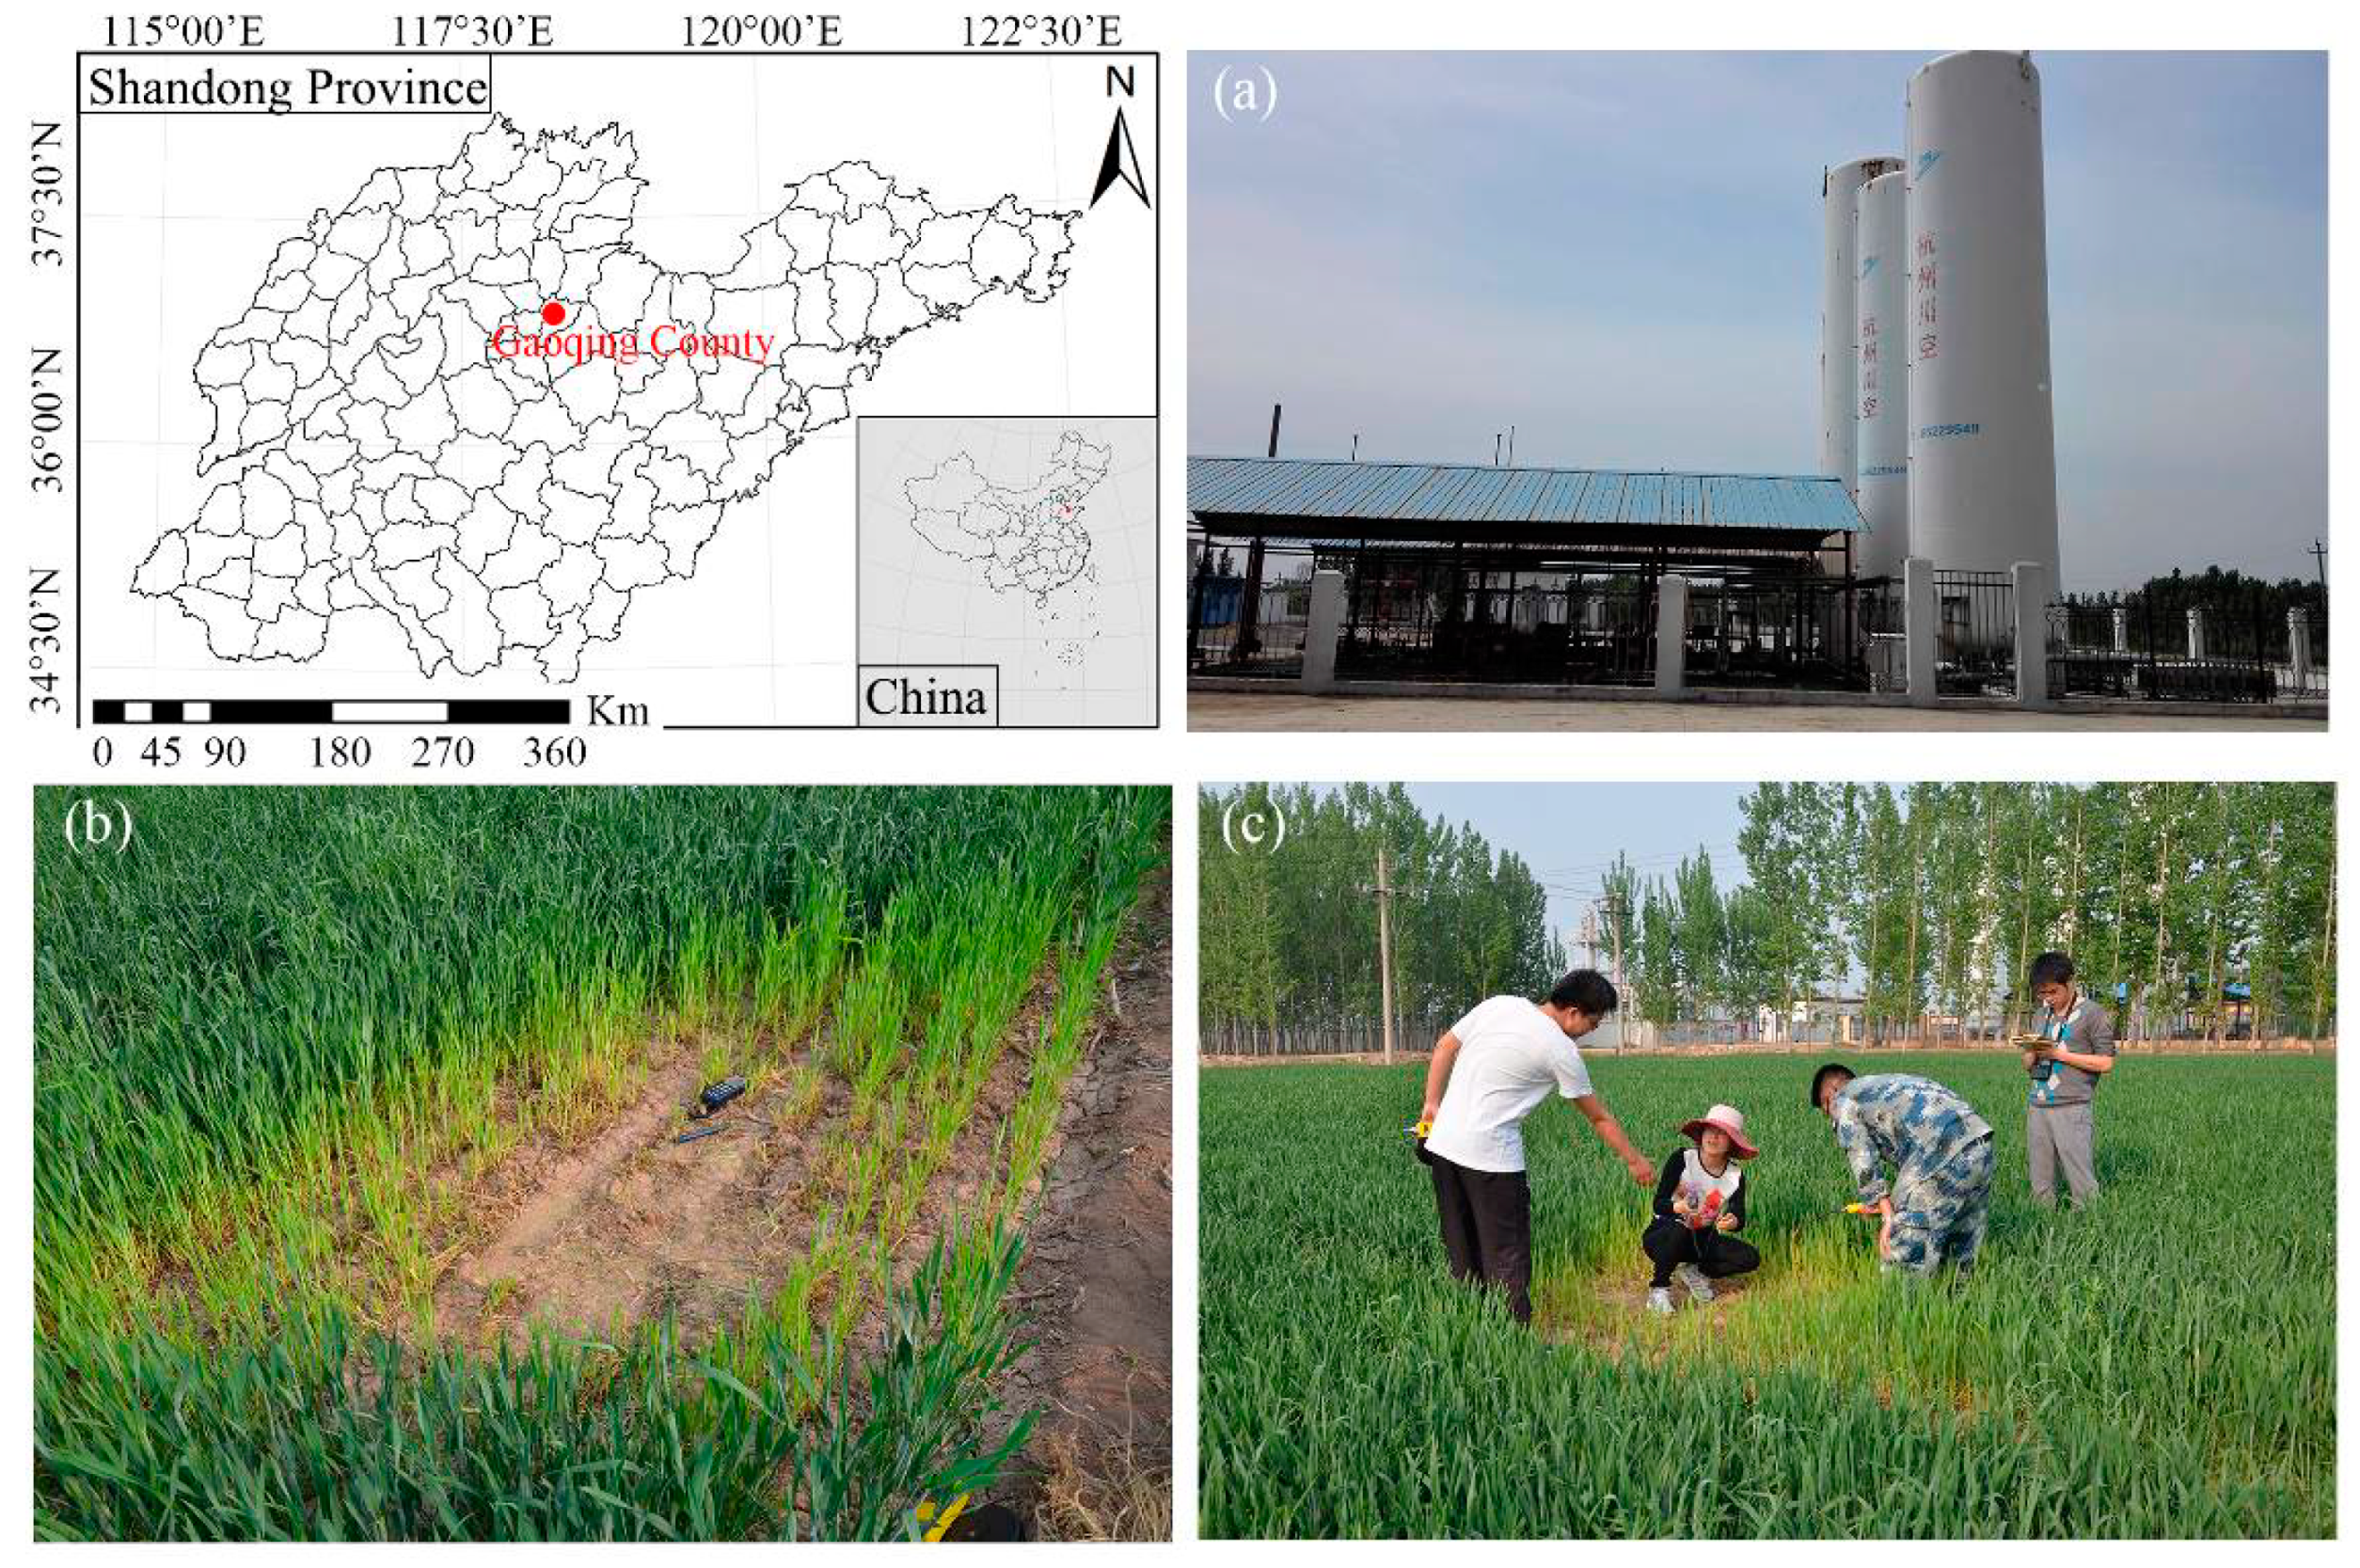
2.1. Study Sites, Soil Sampling, and Measurment

The study was conducted near the High 89 CO2 gas injection station (37°9′25.63″ N, 117°56′28.38″ E), located in Gaoqing County, Shandong Province, China (Figure 1a). The station was constructed by the Shengli oil field around December 2007 to enhance oil recovery. In the surrounding farmland, the locations of CO2 leakage points can be seen by the wheat growth condition, as shown in Figure 1b. The CO2 gas that leaked underground went into the soil. A portable CO2 detector was used to detect the concentration. CO2 gas concentration in soil was also measured using a gas probe (length 40 cm, diameter 2 cm) that was buried at a vertical depth of 20 cm. The bottom was sealed and small holes (3 mm diam.) were uniformly drilled into the probe hall 10 cm from the bottom. The top of the gas probe had a valve seal, which was connected to a modified GT901 portable gas detector (TES, Taiwan) with an automatic data transmission function. The collection areas were divided according to different CO2 leakage concentrations: low (L, 5500–6000 ppm), medium (M, 6600–7500 ppm), high (H, 12,000–14,000 ppm), extreme (E, >30,000 ppm), and the control with extra CO2 leakage (C, 600–900 ppm) (Figure 1c). The sampling time was 01–03 May from 2015 to 2018, which was during the wheat grain filling stage. The average monthly rainfall in May in 2015, 2016, 2017, and 2018 was 50, 34, 28, and 33 mm, respectively. The mean temperature in May during the same years was 13.9, 16, 14.1, and 14.5 °C, respectively.
The soil at the research site is fluvo-aquic soil with a pH of 7.5 and a total C of 1.3%. Since 1980, wheat rotated with corn or beans has been planted annually. Approximately 500 g of surface (0–15 cm) soil was collected from three discrete locations at the leakage sites not far from the injection station. About 20 g of soil was stored at −20 °C for subsequent analysis of microbial diversity. The remaining soil was air-dried and homogenized to pass through a 2 mm sieve. Soil pH value was measured using a pH meter (PHC-3C, Shanghai Leici, Shanghai, China). Soil organic matter (OM) was measured with colorimetrical methods using hydration heat during the oxidation of potassium dichromate. The nitrate-nitrogen (NN) content was measured by dual wavelength spectrometry [4]. The total phosphorus (TP) content was determined by the acid digestion-molybdenum and antimony colorimetric method.

2.2. DNA Extraction, PCR Amplification, and ILLUMINA MiSeq Sequencing

According to the manufacturer’s instruction manual, DNA from 60 soil samples was extracted from 0.5 g of fresh soil sample with the E.Z.N.ATM Mag-Bind Soil DNA Kit (Omega Biotek, Guangzhou, China). These soil samples were marked as 2015/2016/2017/2018-C1/2/3, 2015/2016/2017/2018-L1/2/3, 2015/2016/2017/2018-M1/2/3, 2015/2016/2017/2018-H1/2/3, and 2015/2016/2017/2018-E1/2/3 collected in 2015, 2016, 2017, and 2018, respectively. The V3–V4 region of the bacterial 16S rRNA genes was amplified using the primer sets 341F (CCCTACACGACGCTCTTCCGATCTG-CCTACGGGNGGCWGCAG) and 805R (GACTGGAGTTCCTTGGCACCCGAGAATTCCA-GACTACHVGGGTATCTAATCC). The 50-μL PCR reaction system included 5 μL of 10×PCR buffer, 0.5 μL of each primer (50 μM), 0.5 μL of dNTP (10 mM each), 0.5 μL Platinum Taq (5 U/uL), 42 μL sterilized ultrapure water, and 1 μL of template DNA (10 ng/μL). PCR products were pooled and purified with the DNA Gel Extraction Kit (Axygen Biosciences, Union City, CA, USA) according to the instruction manual. Quantification of the purified PCR products was carried out using Quant-iTPicoGreen dsDNA Assay Kit (Invitrogen, Carlsbad, CA, USA). Purified amplicons were pooled in equimolar amounts and paired-end sequenced (2 × 300) on the Illumina MiSeq platform (Personalbio, Shanghai, China), according to the protocol. The sample sequencing data were distinguished with the barcode sequence, and the sequence of each sample underwent quality control. The non-specific amplification sequences and chimeric were then removed with the USEARCH method (http://www.drive5.com/usearch/). Operational taxonomic units (OTUs) with a 97% similarity cutoff were also clustered using the USEARCH method. Mothur software was used to analyze the alpha diversity (http://www.mothur.org/). The Chao (http://www.mothur.org/wiki/Chao) and Shannon indices (http://www.mothur.org/wiki/Shannon) were conducted to reveal the richness and diversity. A RDP classifier was used to classify the species (http://rdp.cme.msu.edu/misc/resources.jsp) [32,33]. According to the taxonomic results, a species’ abundance diagram and rich infrared images were constructed with Origin 9.1 and R software. The beta diversity analysis was performed using the weighted UniFrac metric algorithmic with R software.

2.3. Network Construction and Analysis

In this study, based on 16S rDNA sequencing data, all the data from the 60 collected soil samples were used for constructing the interaction networks, which were defined as phylogenetic molecular ecological networks (MENs) [27]. For these 60 samples, each CO2 concentration gradient had 12 samples to establish their own networks, for example, 2015-C1/2/3, 2016-C1/2/3, 2017-C1/2/3, and 2018-C1/2/3 from the control sites to make the MEN. Before the network construction, the random matrix theory (RMT) method was used to identify the appropriate similarity threshold. According to Deng et al. [34], there were four steps included in the construction process, which were the data collection, data transformation, pairwise similarity matrix calculation, and the adjacent matrix determination.
During the construction, for each network, only the OTUs (97% sequence identity) occurring in 100% of the total samples were used for the network computation. Moreover, the relative abundances of OTUs were transformed to log10, and the blanks were filled with 0.01 with paired valid values. The Spearman correlation coefficient was recommended to measure the correlation, and a similarity matrix was calculated. Thereafter, the similarity threshold from 0.01 to 0.99 with intervals of 0.01 increased, and an optimal similarity threshold was chosen. Only the similarity values above the chosen threshold were kept for calculating matrix eigenvalues. The significant non-random patterns were determined by evaluating whether the spacing of the eigenvalue distribution followed a Poisson distribution. An indirect network graph could be drawn after the adjacency matrix was defined and subsequently visualized using software. To allow comparison, an identical cut-off of 0.80 was used to construct the interaction networks for each gradient. The network construction and statistical analysis were performed using the existing pipeline available at http://ieg4.rccc.ou.edu/mena. The networks were visualized with Cytoscape 3.7.0 software [35,36].

2.4. Characterization of the Molecular Ecological Networks and Statistical Analysis

First, the network global properties were calculated, including total nodes and links, R square of power-law, average degree (avgK), average clustering coefficient (avgCC), and average path distance (GD). The network indices for an individual node such as degree, stress centrality, and betweenness were then calculated for the pipeline. The greedy modularity optimization was used as the separation method for the setting of module separation. In the network, a group of OTUs with a high number of connections among themselves was defined as a module while there were far fewer connections with other OTUs outside the group. Modularity (M) was very important for system stability [31]. Moreover, the values of the two parameters Zi (within-module connectivity) and Pi (among-module connectivity) of each node were also calculated. Furthermore, according to the values of Zi and Pi, the roles of nodes were classified into four categories: peripherals (Zi ≤ 2.5, Pi ≤ 0.62), connectors (Zi ≤ 2.5, Pi > 0.62), module hubs (Zi > 2.5, Pi ≤ 0.62), and network hubs (Zi > 2.5, Pi > 0.62) [34]. Three power-law models, including regular power-law, exponential law, and truncated power-law were fitted to for the first step of the network statistics. The network connections were then rewired and the network properties were calculated randomly with 100 permutations to evaluate the constructed networks, with the number of nodes and links being constant between random and empirical networks [34].
The relationships between Gene/OTU significances (GS) and environmental traits were calculated, and the Mantel test was used to check the correlations between GS and network connectivity. The GS was calculated and defined as the square of the Pearson correlation coefficient (r2) of the OTU abundance profile with environmental traits. The correlations between GS and nodes’ network indices, such as degree, were used to reveal the internal associations between network topology and environmental traits. During the process, we tried four distance methods, namely Euclidean distance, Bray–Cutis distance, Morisita distance, Jaccard distance, and Euclidean distance was chosen. Finally, the process of module-eigengene analyses was also run on the pipeline. Eigengene analysis is important for revealing higher-order organization and identifying key populations based on network topology. In this analysis, every module was summarized through singular value decomposition analysis with a single representative abundance profile, which was referred to be the module eigengene. Eigengene represented the relative abundance profile of the OTUs within a module. The Pearson correlations have been used to define the eigengene network by some researchers. The relationships among eigengenes can be visualized as a clustering dendrogram through average-linkage hierarchical analysis [27]. As reported, the module eigengene could explain approximately 50% or more of the variance of the OTU abundances in the module.

3. Results

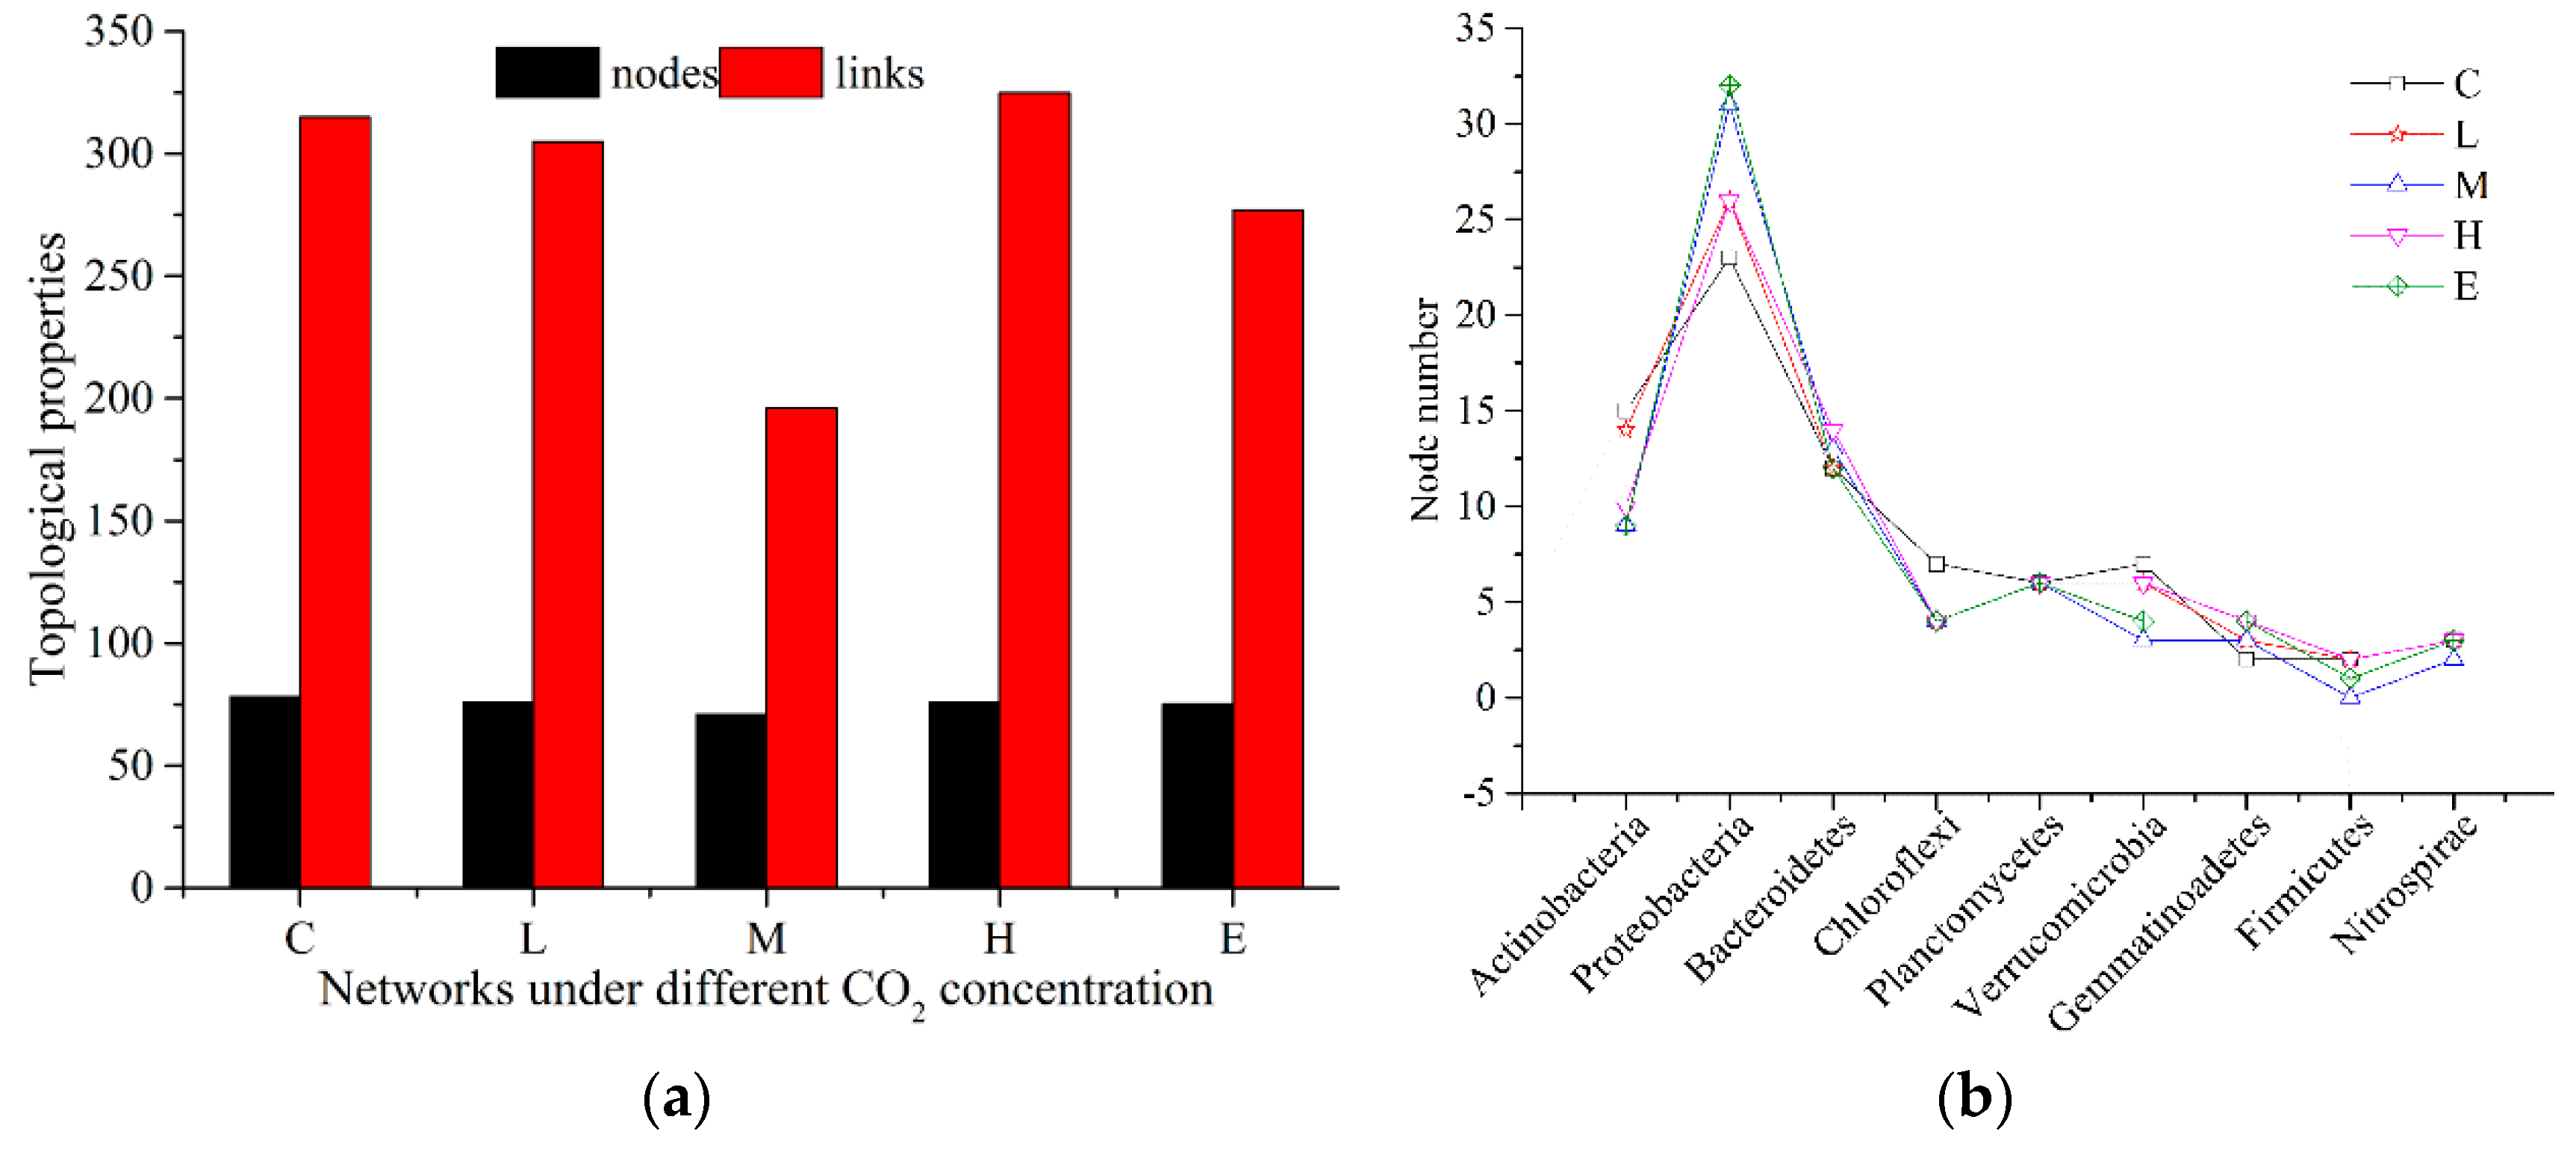
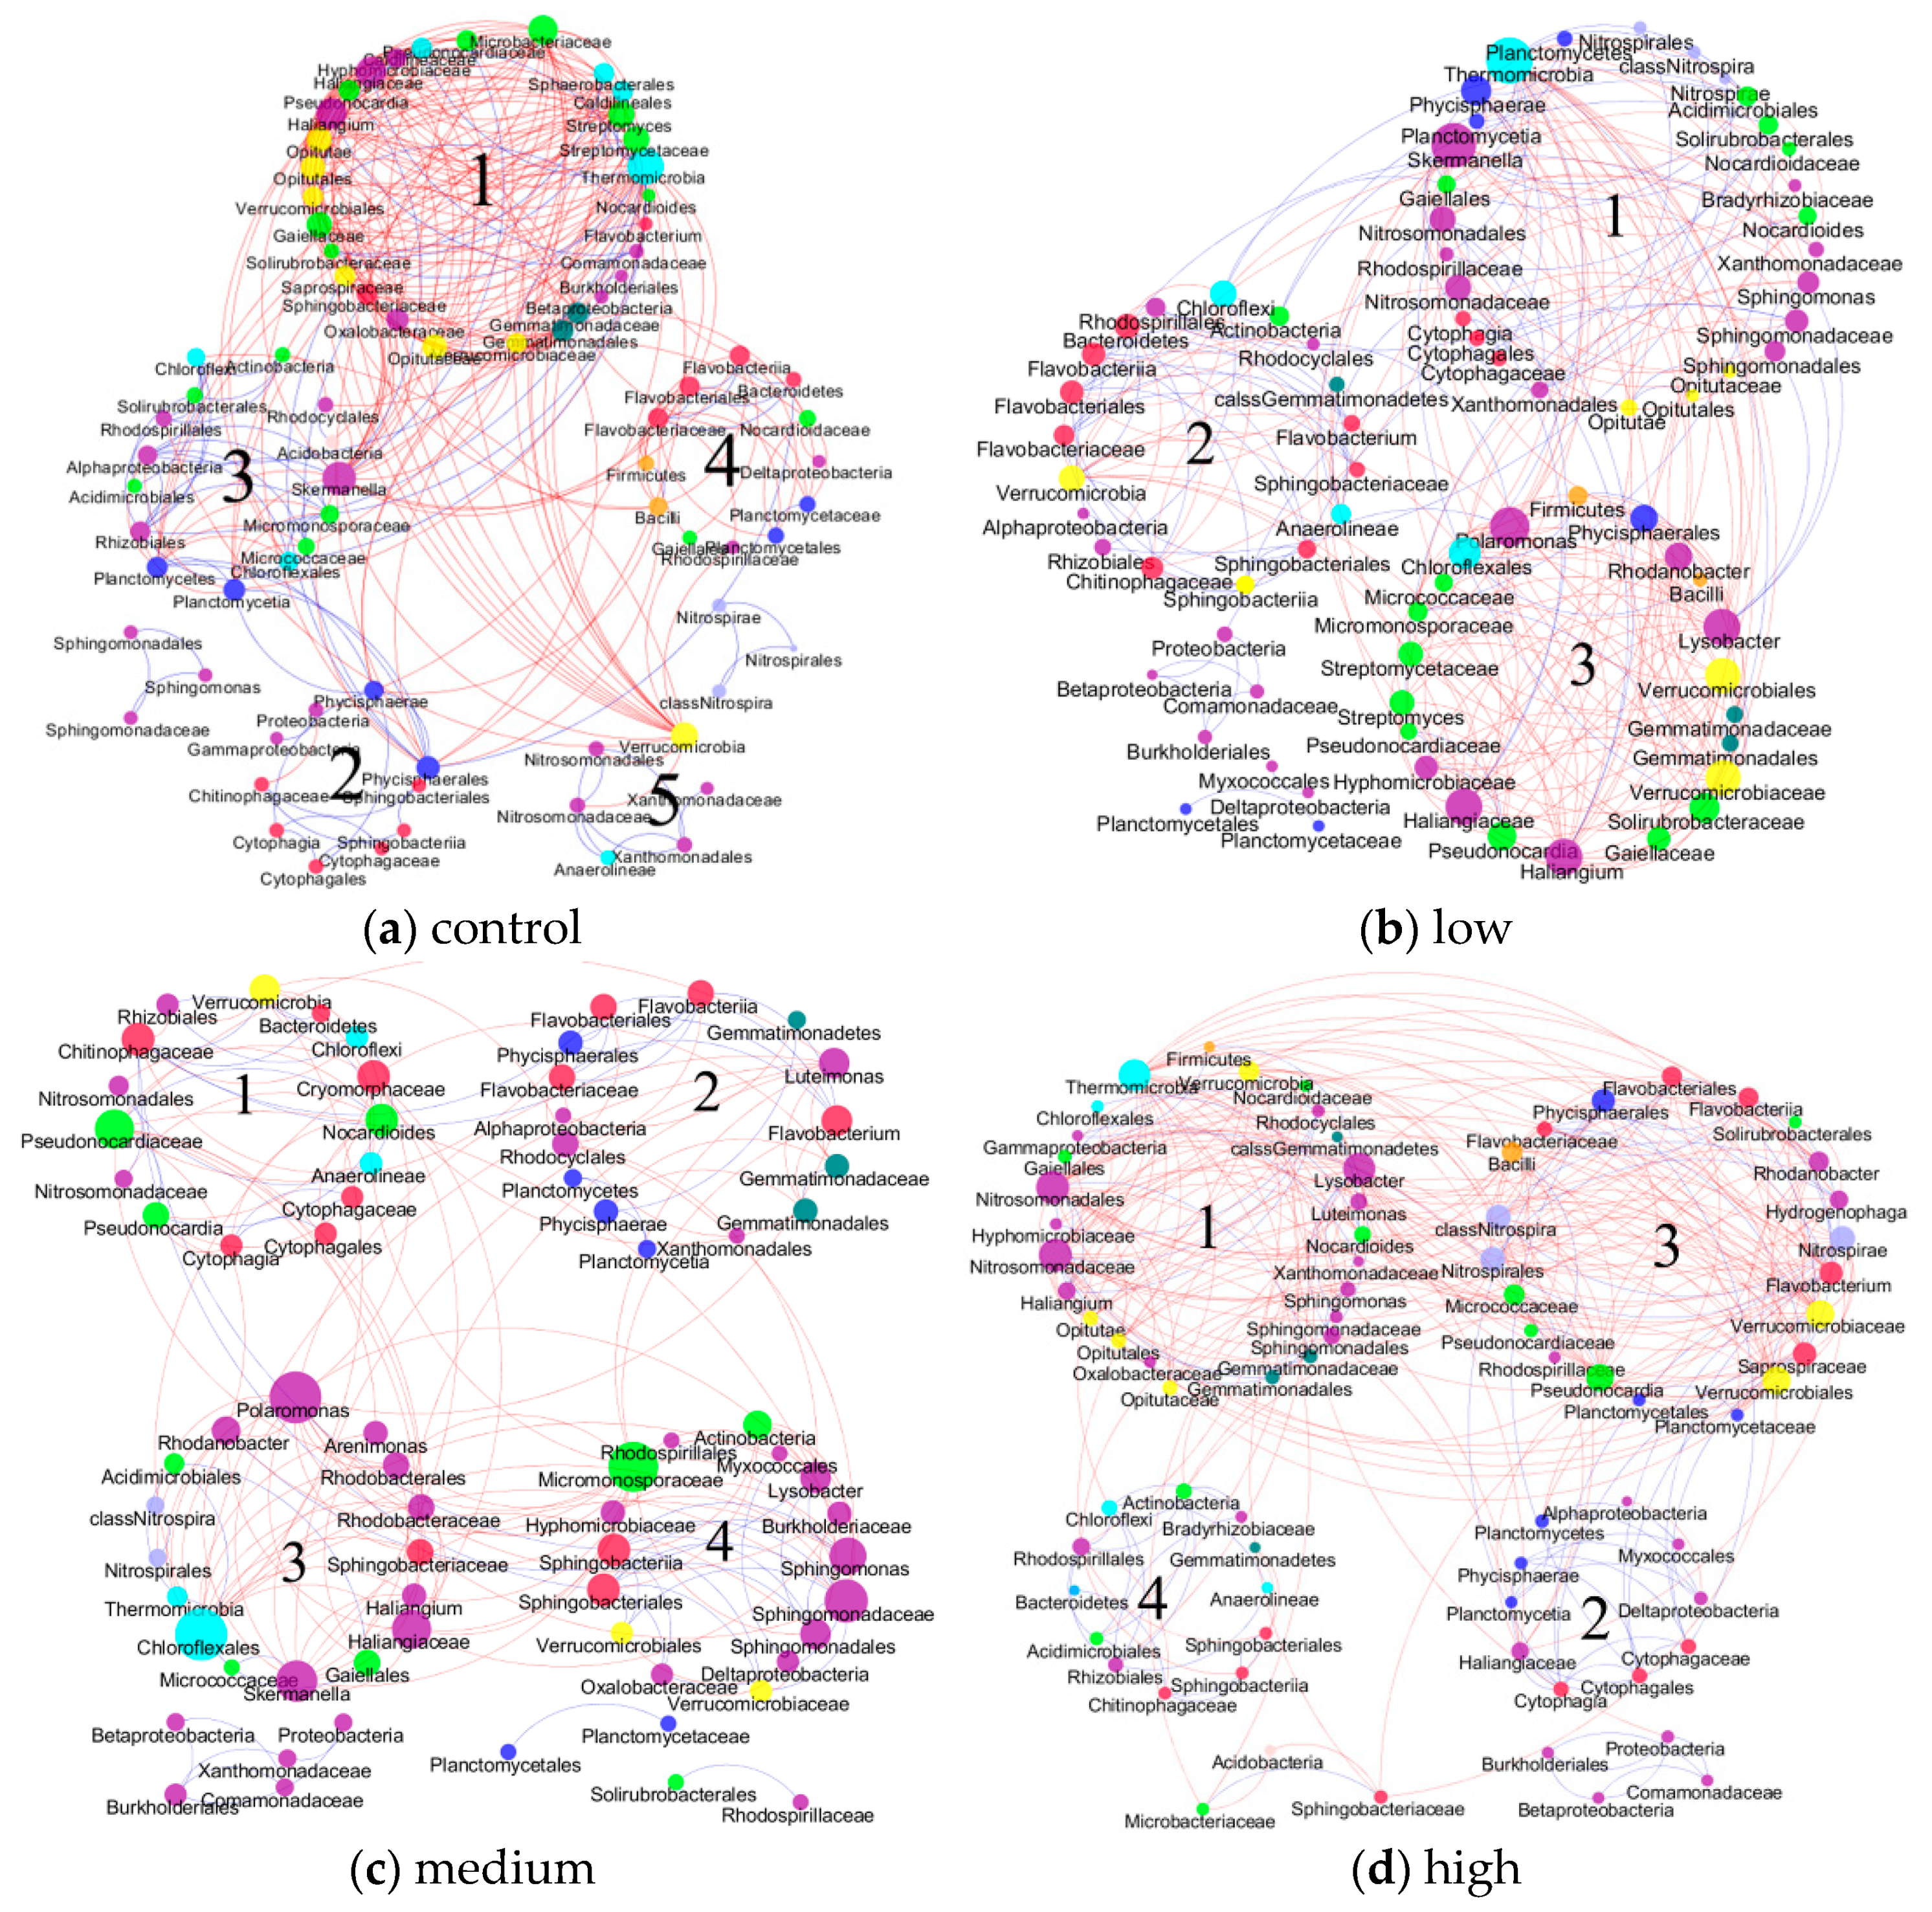
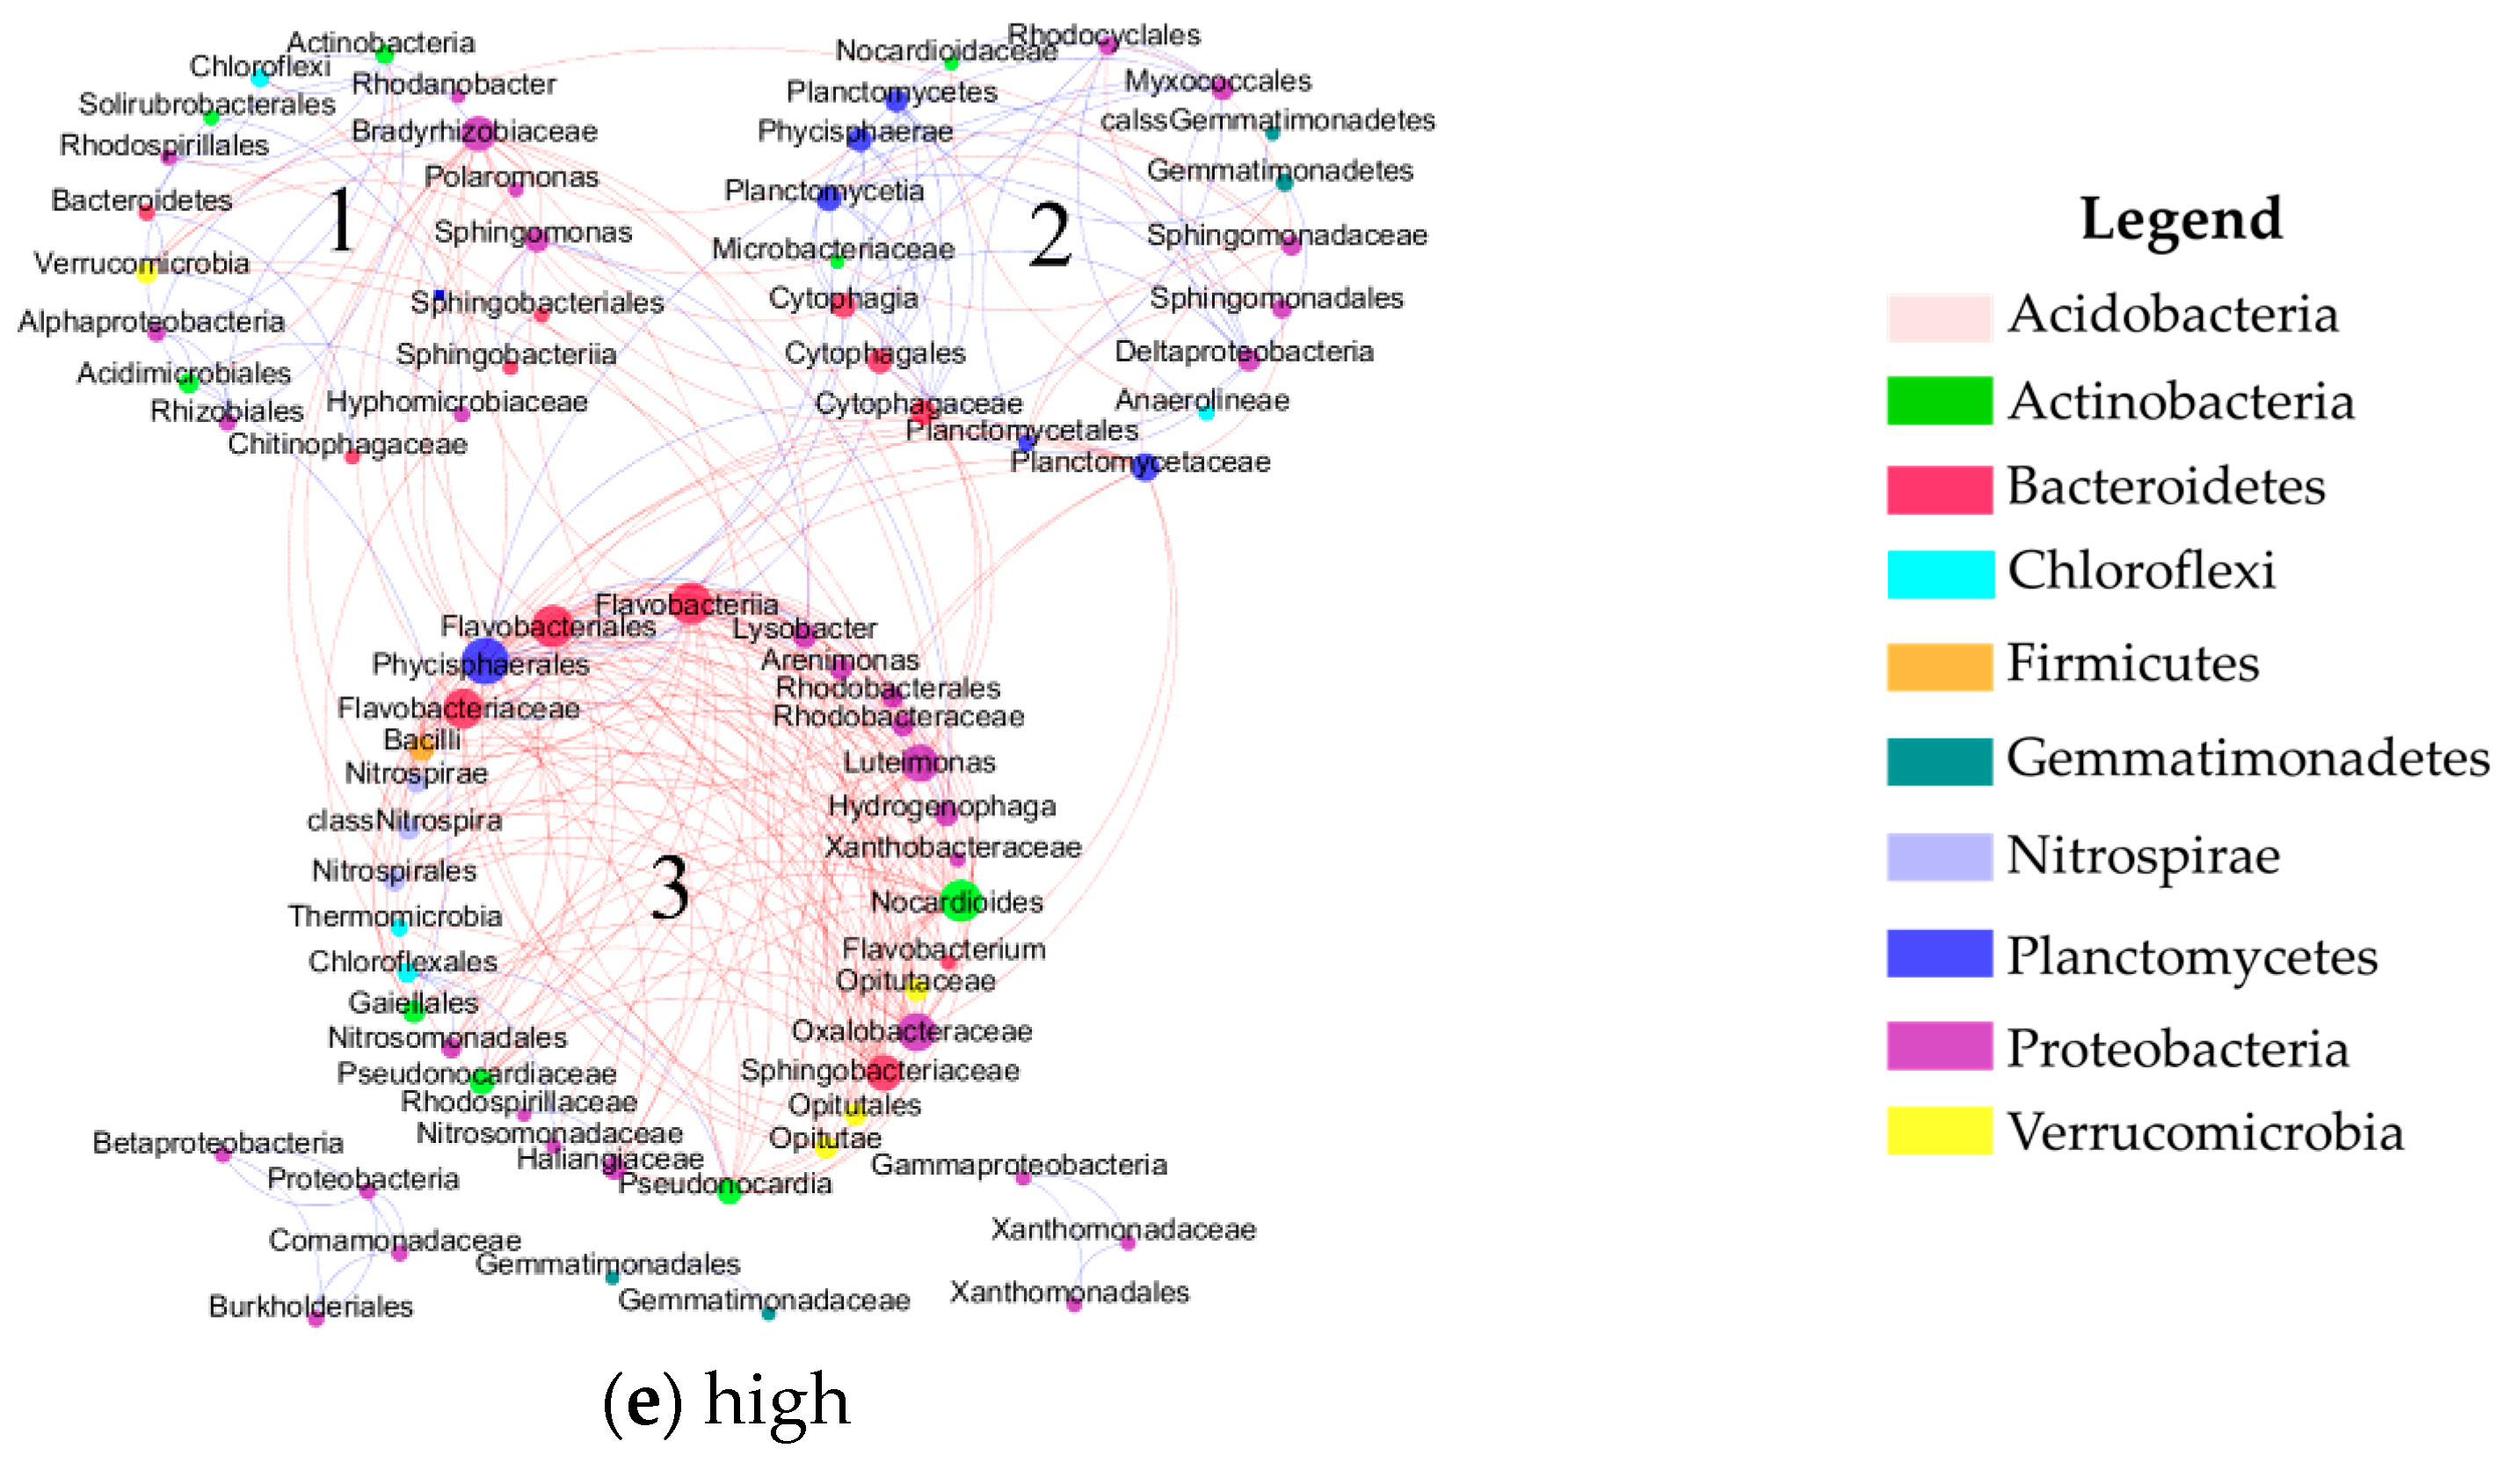
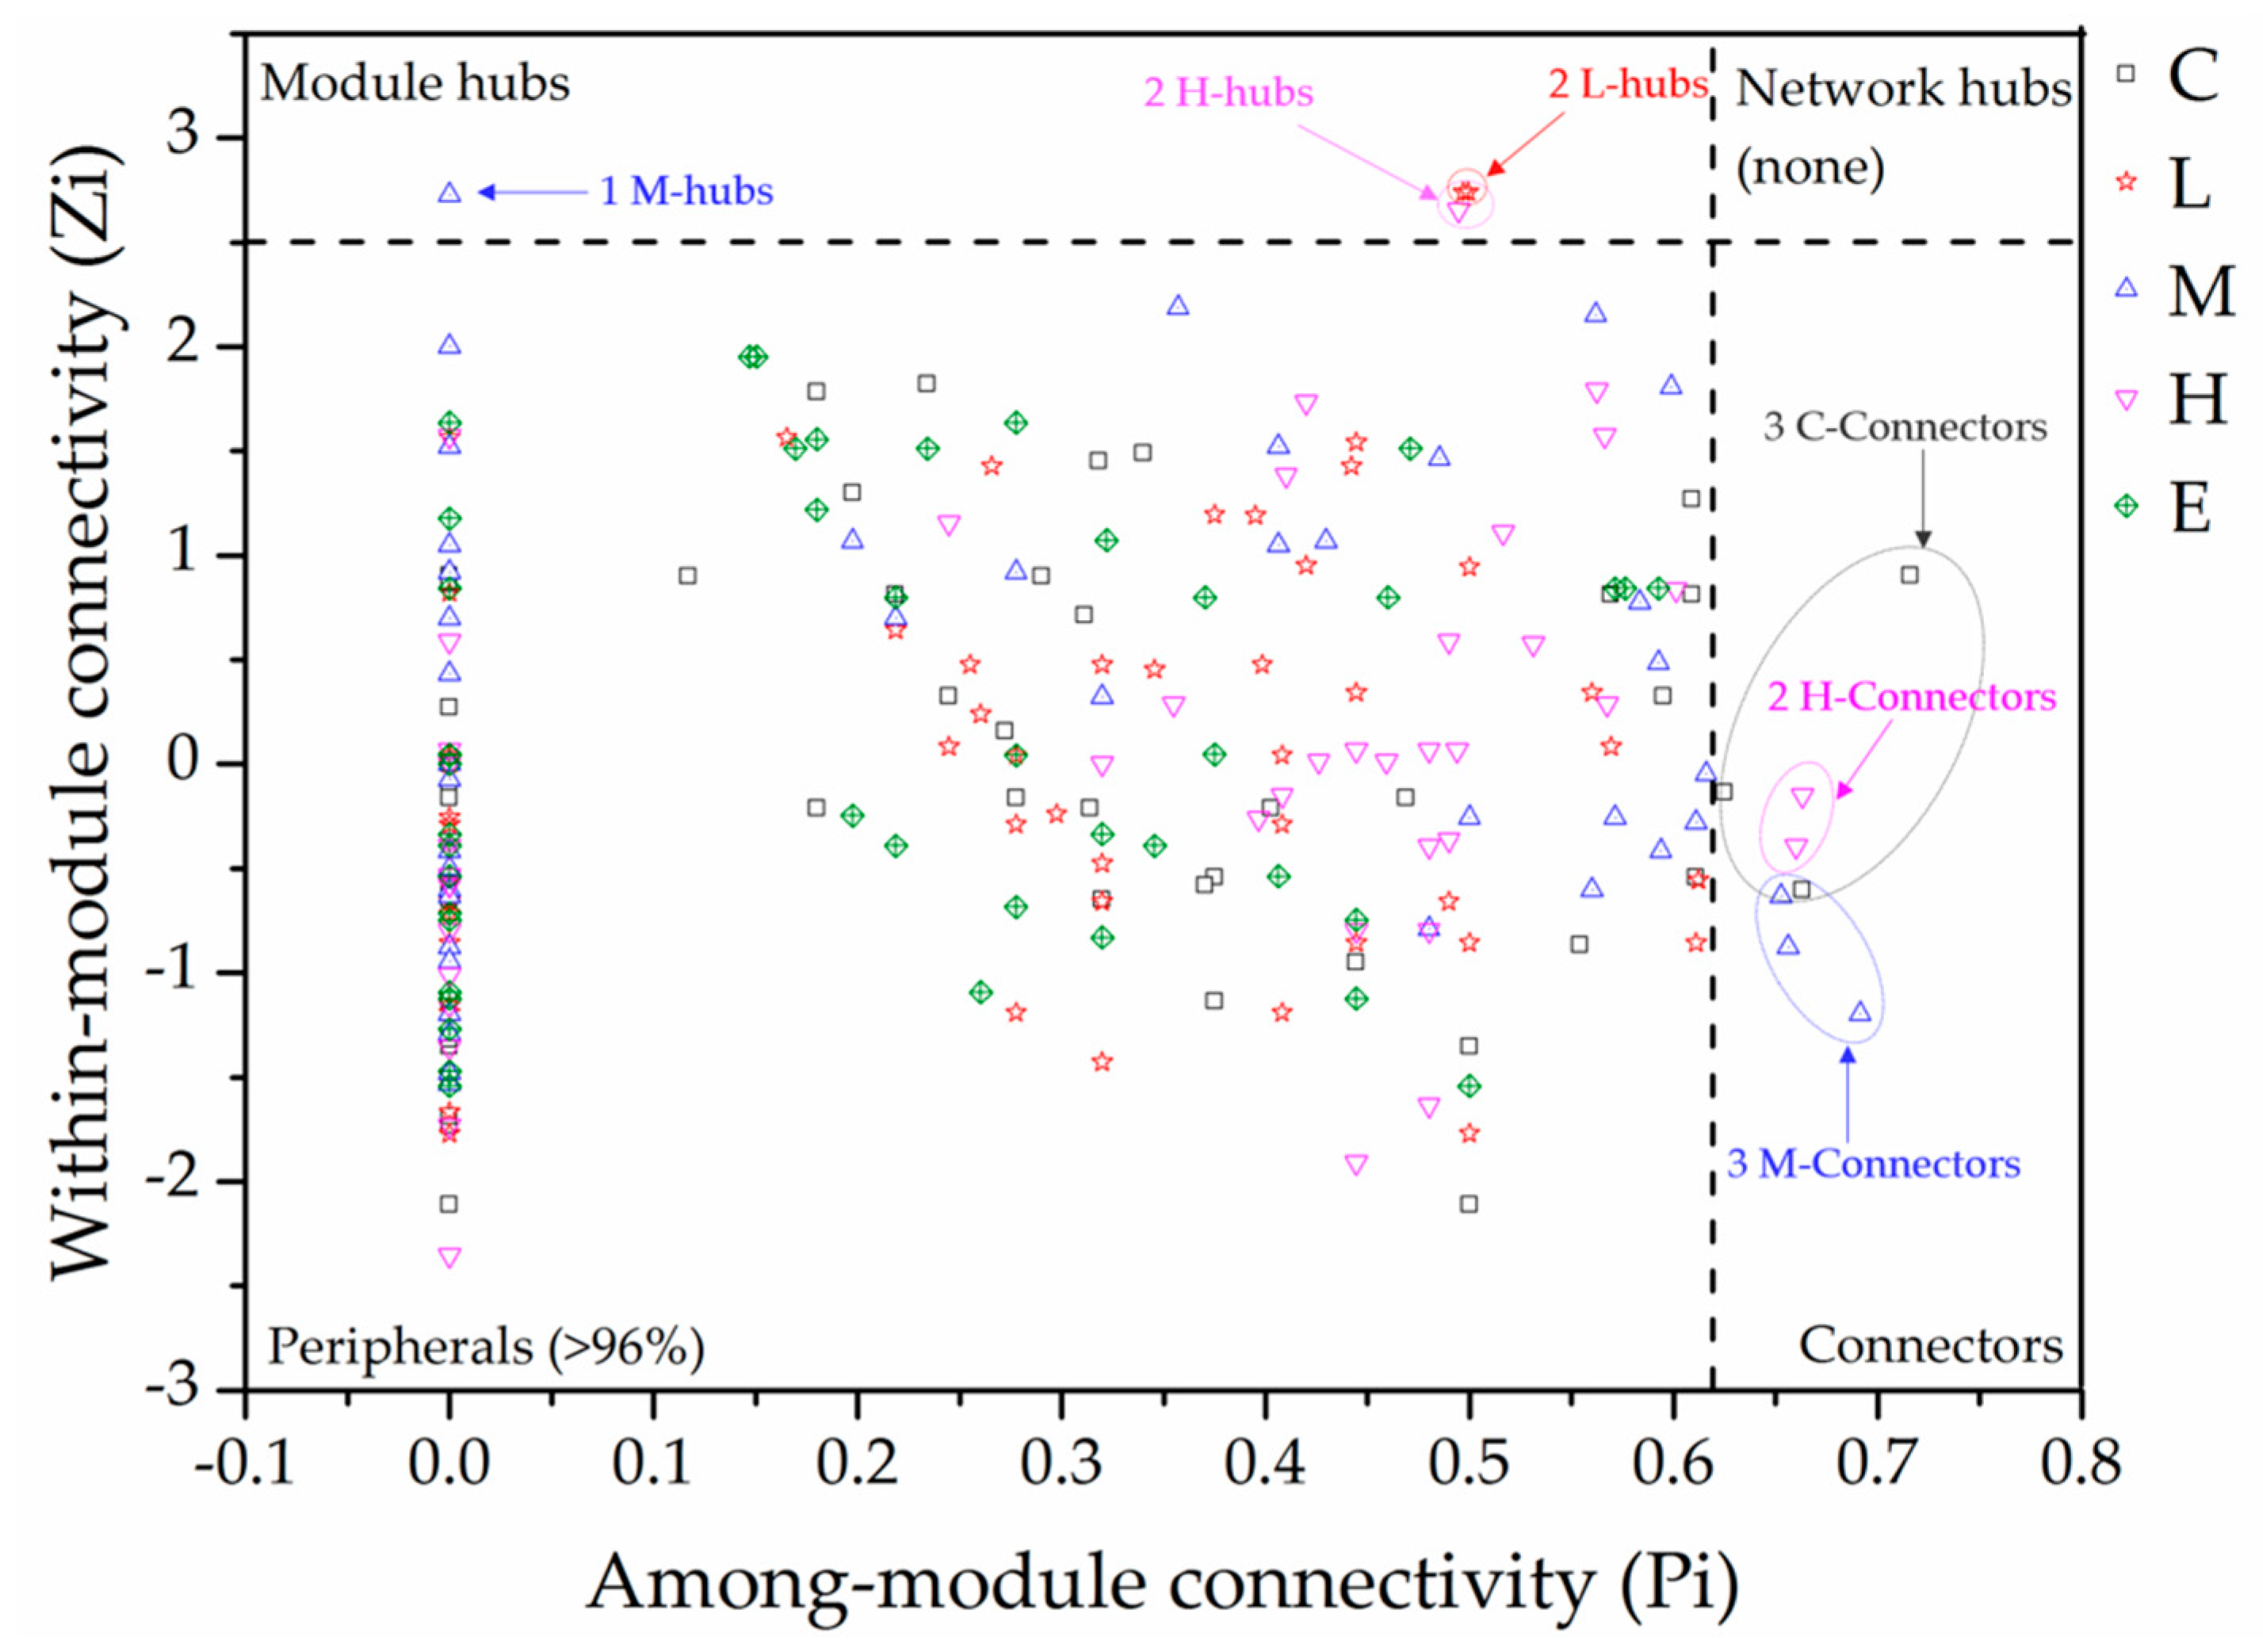
3.1. Topological Properties of Molecular Ecological Networks (MENs) under Different CO2 Leakage Concentrations

A MEN appears to be a representation of some biological interactions in an ecosystem, such as competition or mutualisms, in which a microbe (here mean nodes) is linked by pairwise interactions (here mean links). In this study, five networks under different CO2 leakage concentrations were constructed individually. Some important general network topological characteristics, such as scale-free, small world, or modular, were investigated to understand the differences among these MENs.
Table 1 shows that all five networks were scale-free, i.e., their connectivity follows a power law, i.e., a few nodes in the networks have many connections with other nodes, while most of the nodes have a few connections. The network connectivity (or degree) in the five constructed MENs fitted well with the power law model, with R2 values of 0.5 to 0.636, except for the H network. The results imply that the MENs in these microbial communities behaved approximately scale-free. Furthermore, the average clustering coefficients and path distances were also different from those of the corresponding random networks (Table 1). The value of avgCC was used to measure the extent of the module structure present in the network. Table 1 shows that the avgCC of the L, H, and E networks were 0.570, 0.548 and 0.536, which are bigger than the value of 0.487 in the C network. Deng et al. reported that higher avgK means a more complex network, and a small GD means that nodes in the network are closer [34]. The order of avgK values for the networks was 8.077 (C) > 8.026 (L) > 7.387 (E) > 5.521 (M). The fact that the C network with no CO2 leakage pressure was more complex than other networks with higher CO2 leakage concentration (except the H network) can be identified by the decreased average degree (avgK) and longer path distance (GD) (Table 1). All these results suggest that the MENs in these microbial communities had the small-world property [37].
On the other hand, there are no obvious differences among the sizes of the obtained networks, while the number of links for the five networks is similar, except for the M network (Figure 2a). The composition and structure of the five networks are different. The distribution of the node number of the nine phyla involved in the five networks varied substantially among different phylogenetic groups (Figure 2b). For example, the node number of Actinobacteria, Chloroflexi, and Verrucomicrobia decreased with increasing CO2 concentration, whereas the opposite trend was found for Proteobacteria and Gemmatinoadetes. Interestingly, Bacteroidetes and Firmicutes did not show a significant variation.
Alon has reported that networks in biological systems are always modular [38]. In the constructed networks, the module was defined as a group of microbial genes that are highly connected among themselves but have few connections with the genes belonging to other modules. Modularity is a special ecological concept, and can originate from some special processes, such as ecological niche overlap, natural selection, or phylogenetic relatedness. Moreover, it might be important for ecosystem stability and resilience [39]. Table 1 shows that the five MENs obtained here were modular, with higher modularity in the empirical networks than those from the random networks. On the other hand, in the five networks, we focused on the modules with more than five nodes. As a result, a total of five (one with >20 nodes), three (two with >20 nodes), four (none with >20 nodes), four (two with >20 nodes), and three (one with >30 nodes) modules were detected in the C, L, M, H, and E networks, respectively (Figure 3). The module sizes varied considerably, ranging from 6 to 31 nodes, and the individual modules showed obvious differences.
In Figure 3, some members of Bateroidetes were found to be in the same modules in the C network (module 2 and 4). They were found in the modules of the other four networks, and the interactions among them were significant in these networks (Figure 3). All these results might show that these Bateroidetes have similar ecological niches. On the other hand, it was strange that Proteobacteria and Actinobacteria were not spread over the major modules under different CO2 concentrations (Figure 3), which is contrary to the fact that these two groups have highly diverse physiology and occupy almost all different ecological niches. Furthermore, it was interesting that some species of the phylum Planctomycetes showed a close phylogenetic relationship, which means a good relationship with other microorganisms in the networks of comparable higher CO2 concentrations (Figure 3). This result might imply that these species represent different “ecological species” under higher CO2 concentrations. In the five networks, the negative connections were dominant, whereas the proportions of positive connections were elevated in the networks with higher CO2 concentration. Although the microbial community structures and species interactions were different among the samples with different CO2 concentration, there were still some bacterial species shared in all the networks.

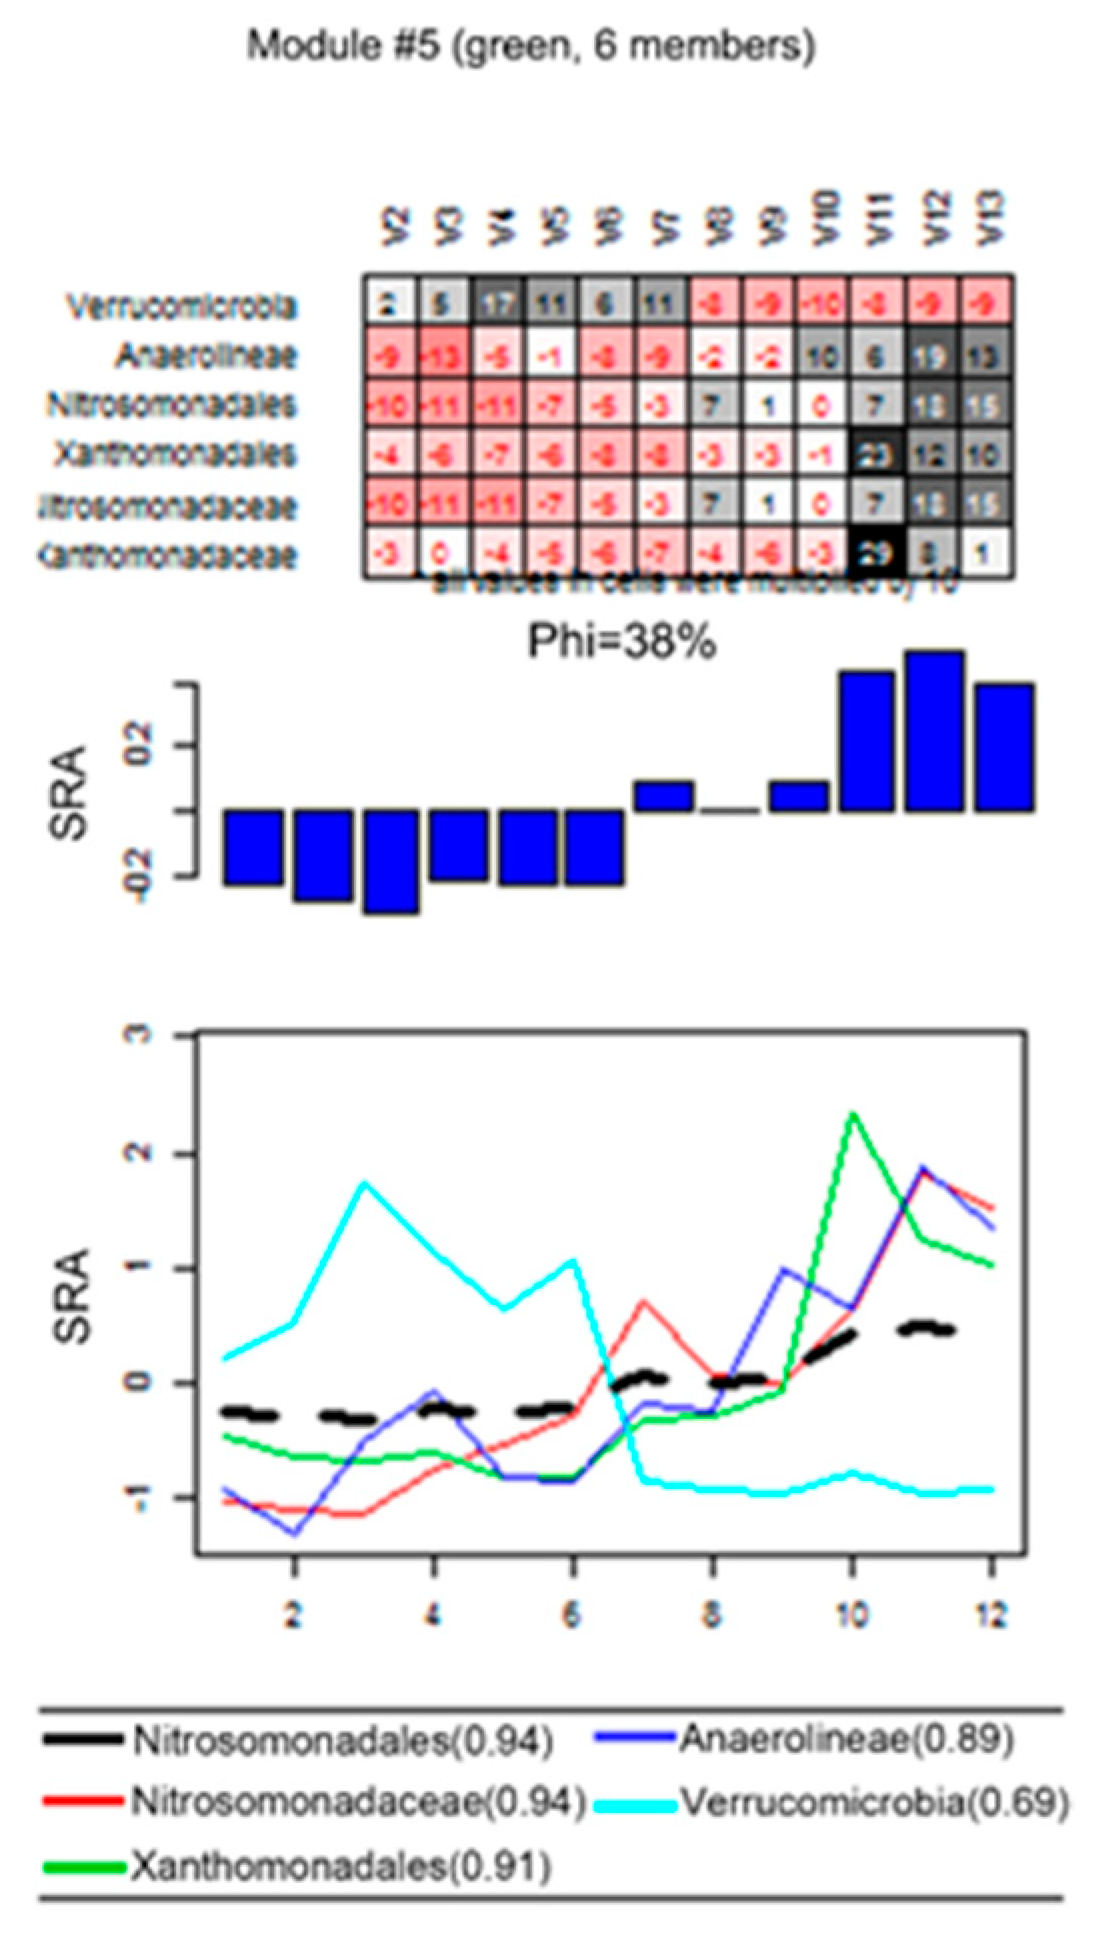
3.2. Dominant Microbial Taxa under Different CO2 Leakage Gradient

Microbial patterns were distinctly different for the five networks under different CO2 concentrations, whereas the networks became simpler and less clustered as the CO2 concentration increased (Figure 4). Figure 4 shows that there were nine phyla in each network with >1 node number, namely Actinobacteria, Proteobacteria, Bacteroidetes, Chloroflexi, Planctomycetes, Verrucomicrobia, Firmicutes, Nitrospirae, and Gemmatinoadetes.
As reported, the nodes with a higher degree can be considered as the central nodes in the network structure [40]. In Figure 4, it can be seen that nodes with high connectivity (degree) varied across the CO2 concentration (Figure 4). For example, in the C network, the top five nodes (node degree >20) which might be the predominant phylum belonged to Actinobacteria (Microbacteriaceae), Proteobacteria (Skermanella, etc.), and Chloroflexi (Thermomicrobia), whereas Bacteroidetes (Flavobacteriaceae, etc.) played an important role in the E network, followed by Planctomycetes (Phycisphaerales), Proteobacteria (Luteimonas, etc.), and Actinobacteria (Nocardioides). In the E network, Phycisphaerales, Flavobacteria, Nocardioides, and Flavobacteriales had the top node degrees of 29, 25, 25, and 25 (Table S1). In the H network, Nitrosomonadales, Nitrosomonadaceae, and Lysobacter belonging to the phylum Proteobacteria had the highest node degrees, with values of 29, 29, and 28. Bacteroidetes (Flavobacterium, etc.) and Actinobacteria (Pseudonocardia, etc) also had high degrees. On the other hand, Verrucomicrobia and Nitrospirae also became the important components with high node degree in the H network (Table S2). Compared to the node size of other networks, the degree values of the medium network were much smaller. Furthermore, the node degree of the dominant bacterial species of the L network did not show a significant change compared to the C network. However, in the medium concentration network, Proteobacteria (Polaromonas), Chloroflexi (Chloroflexales), and Actinobacteria (Micromonosporaceae) were the top three in terms of the largest node degree, with values of 18, 18, and 17, respectively. These results imply that different CO2 leakage concentrations selected for different bacterial communities, which might mean that the interactions among different microbial taxa in the soil bacterial communities were substantially changed by the CO2 concentration. Moreover, these kinds of effects changed significantly among different bacterial groups.
The connectivity within and among modules has been reported to identify the roles of nodes in MENs [31]. Four ecological roles, known as peripherals, connectors, module hubs, or network hubs can be used to assign every node in the networks. In the five networks, peripherals occupied >96% of the total nodes. While there were no module hubs in the C network, some module hubs appeared in the L, M, and H networks, whereas some connectors were observed in the C, M, and H networks (Figure 5). A special phenomenon was that no module hubs were observed in the C and E networks. Compared with the module hubs, more connectors were detected; however, these did not show an obvious trend, ranging from three connectors in the C network to no connectors in the L and E networks (Figure 5). In this study, we did not detect any network hubs. Figure 5 also shows that the module hubs and connectors had a wide distribution in various microbial populations. Of the total of the five module hubs, three belonged to Betaproteobacteria, one to Chloroflexi, and one to Actinobacteria. Three connectors in the C network belonged to the bacterial phyla Planctomycetes and Firmicutes, while in the M networks, Actinobacteria, Bacteroidetes, and Gammaproteobacteria were observed for the connectors. In the H network, there were two connectors which contained the phyla Verrucomicrobia and Deltaproteobacteria. The results also suggest that Proteobacteria occupied a dominant percentage of the module hubs and connectors. Although microbial phyla Bacteroidetes, Planctomycetes, and Chloroflexi might belong to the keystone taxa, their abundances were relatively low. All these results might also imply that CO2 concentration changed the network structure and key bacterial populations.

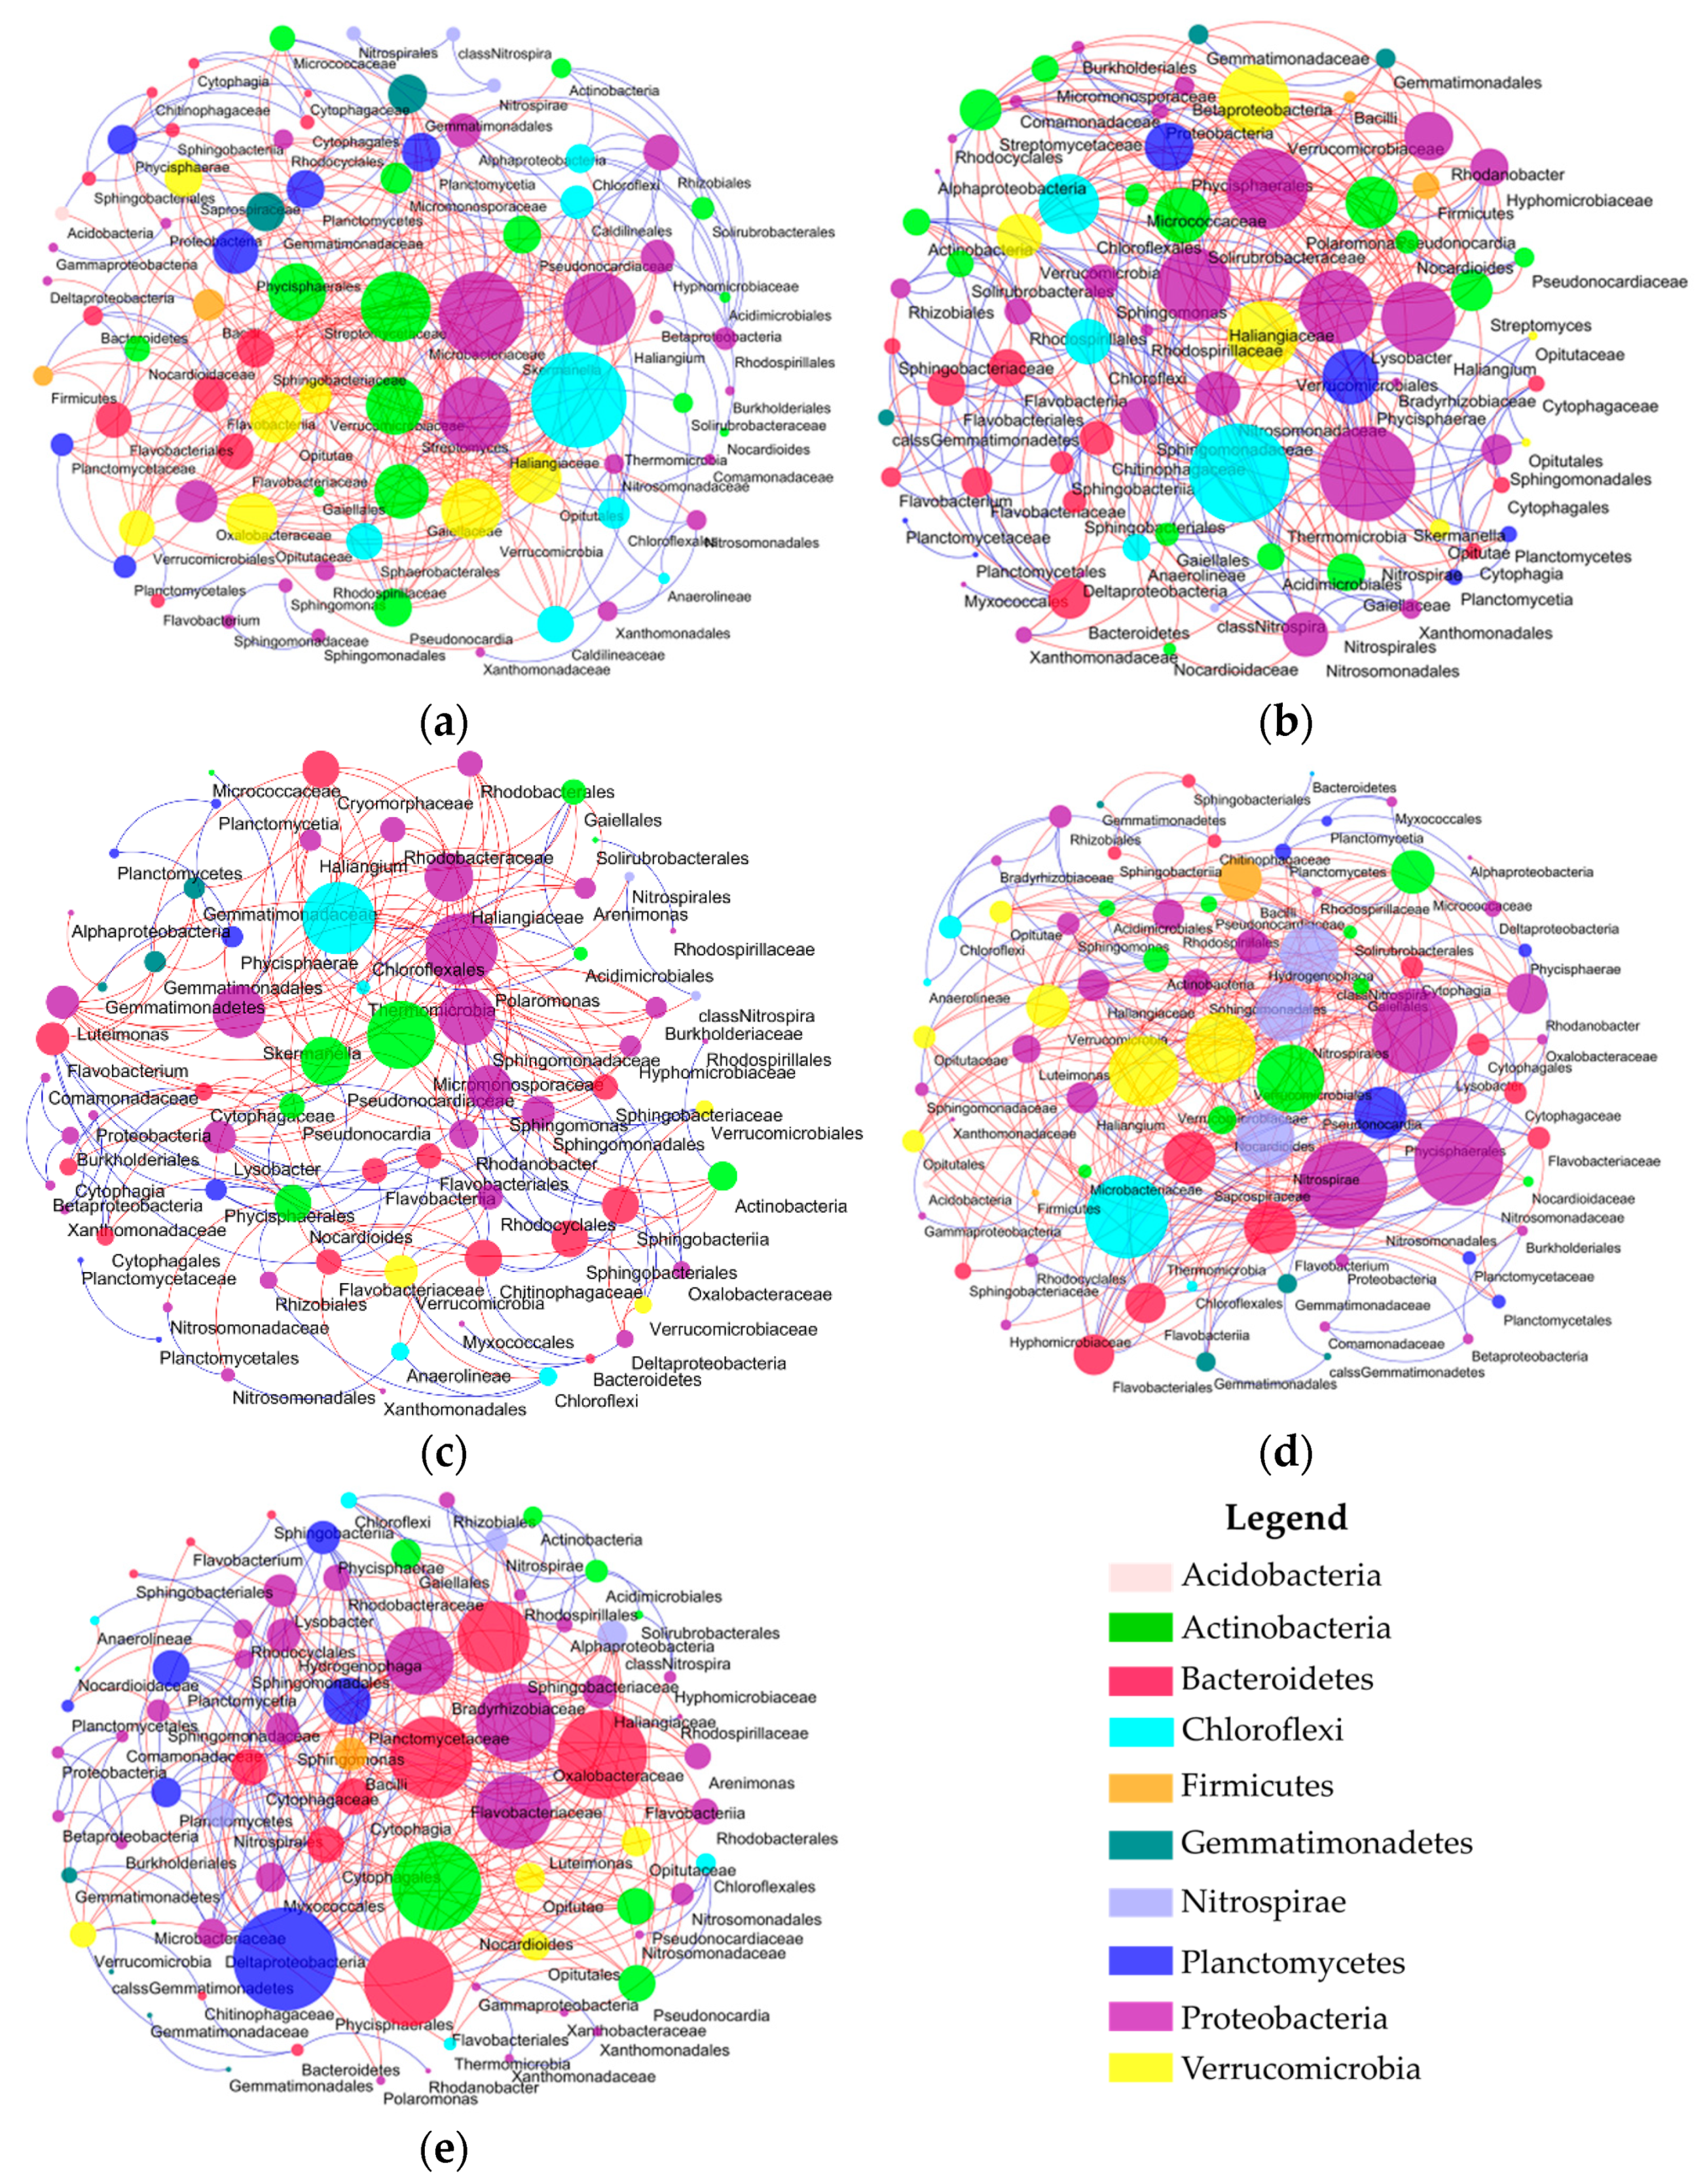
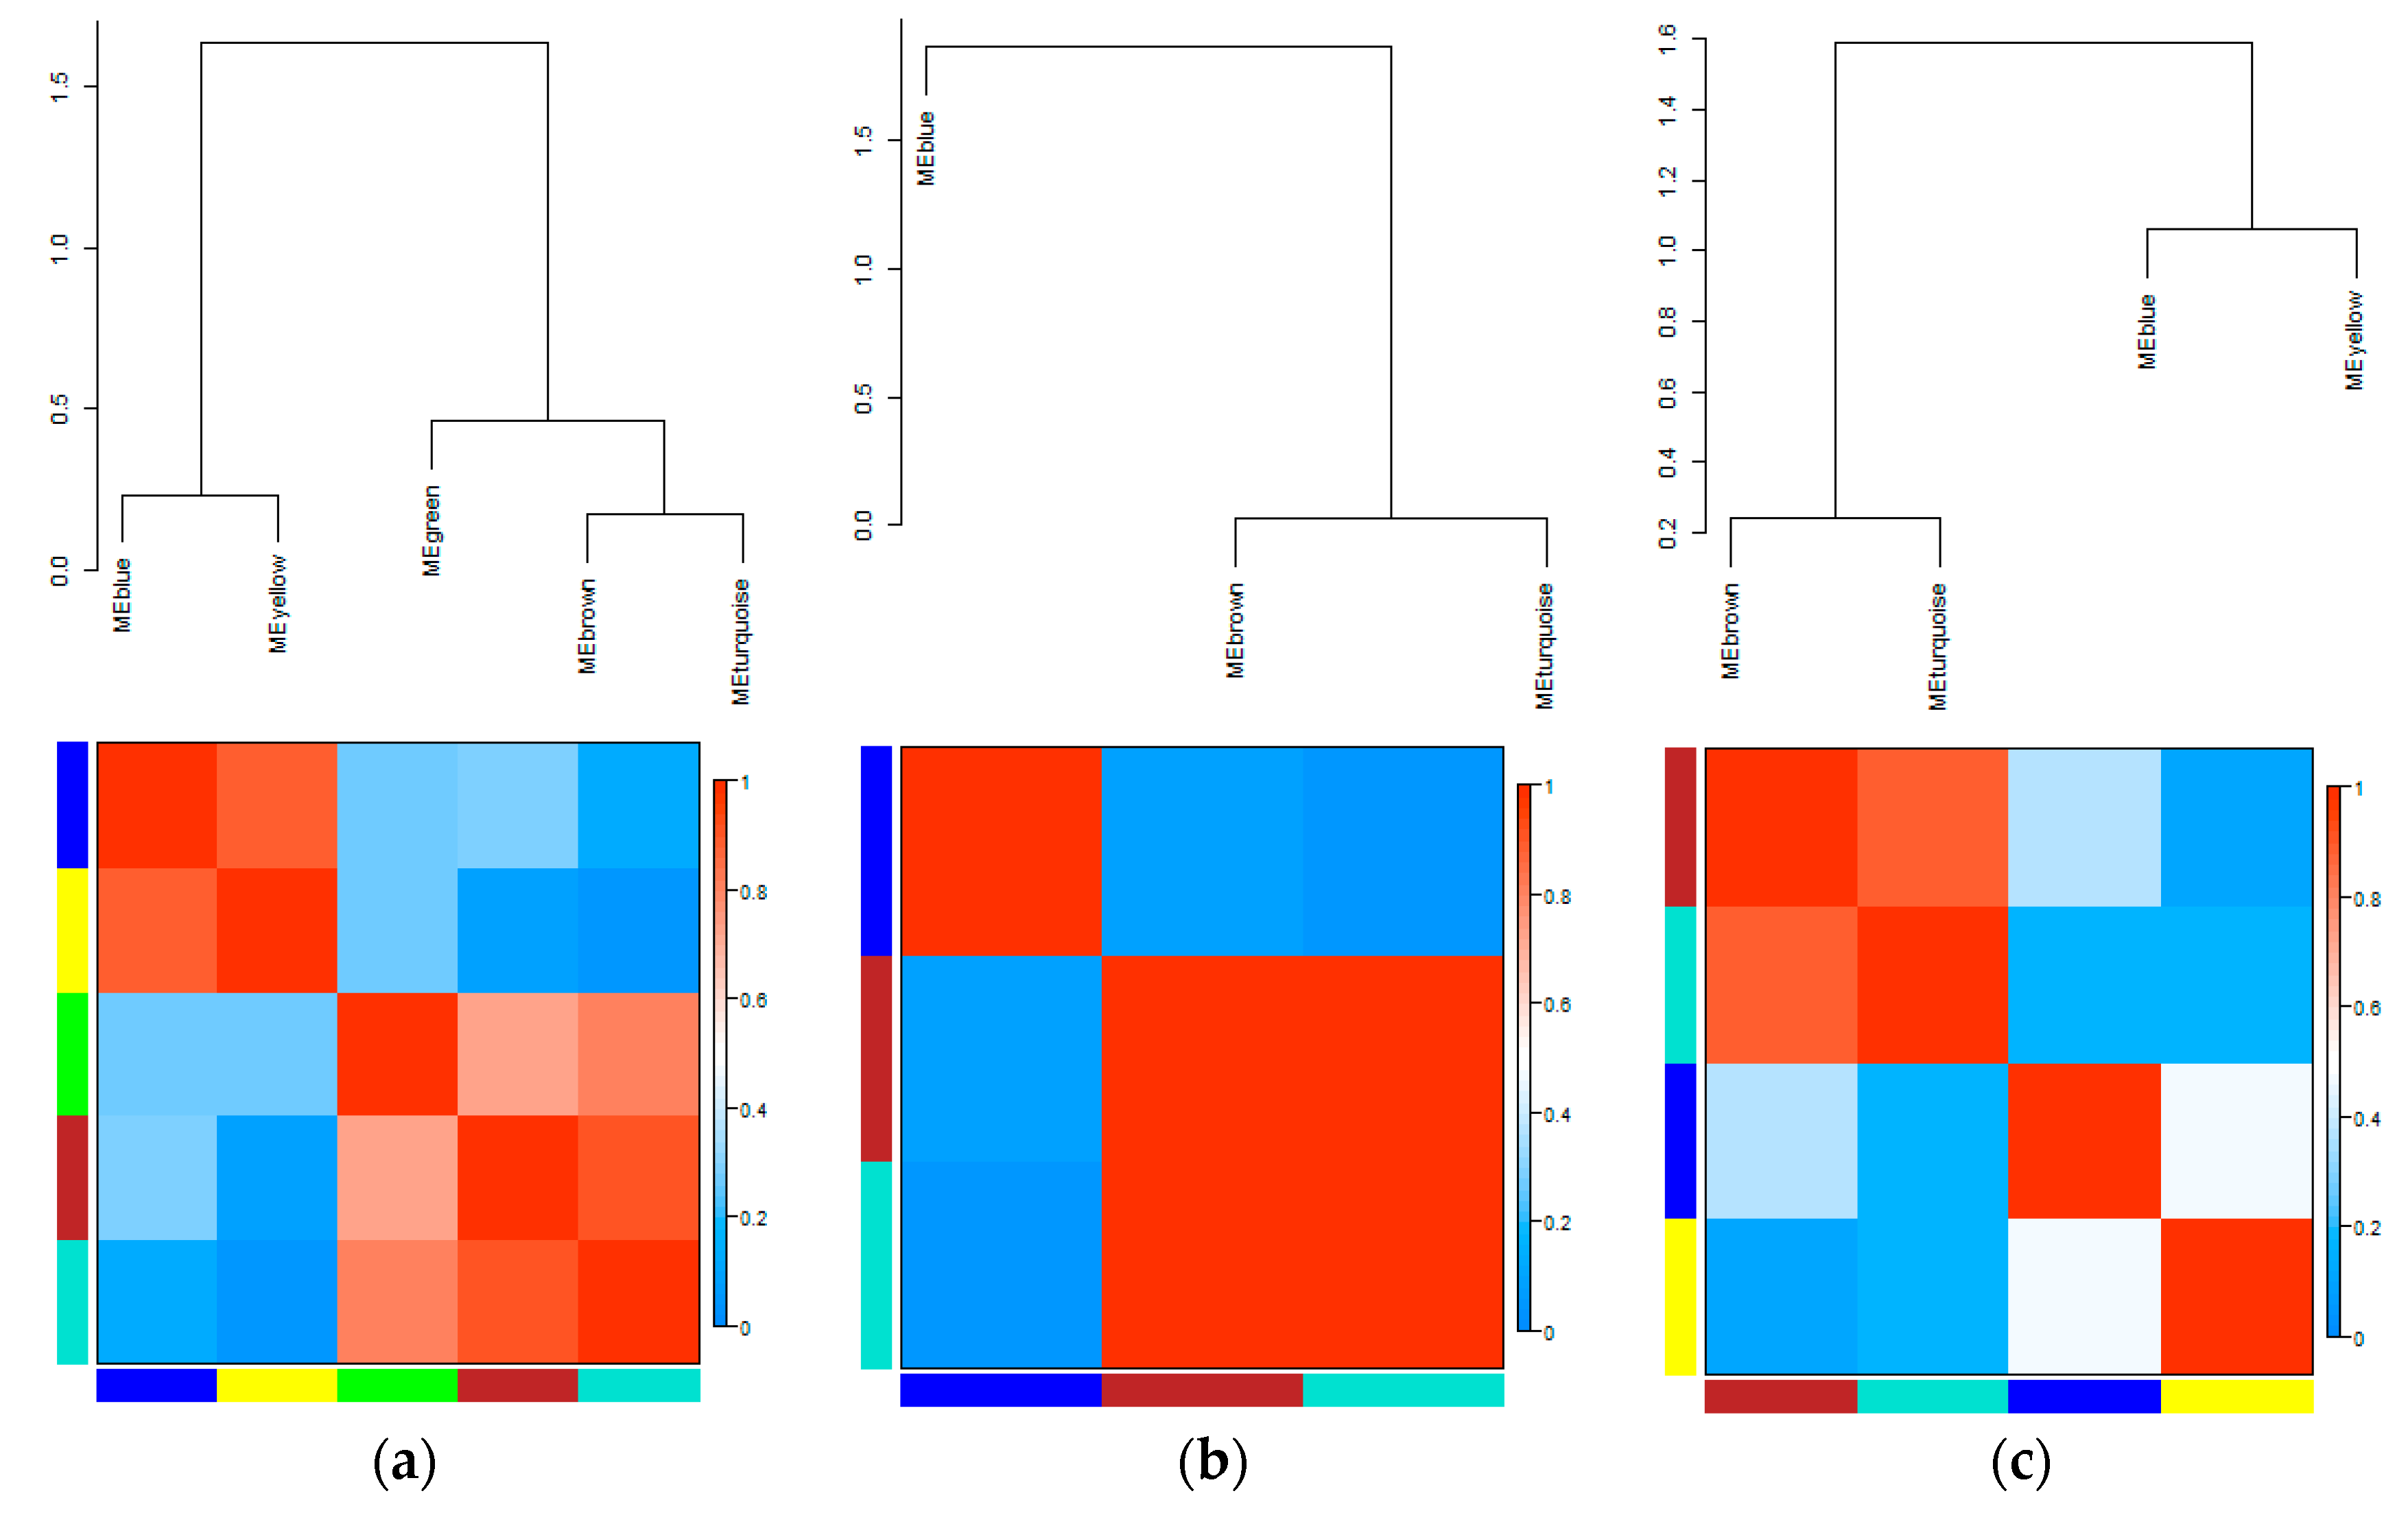
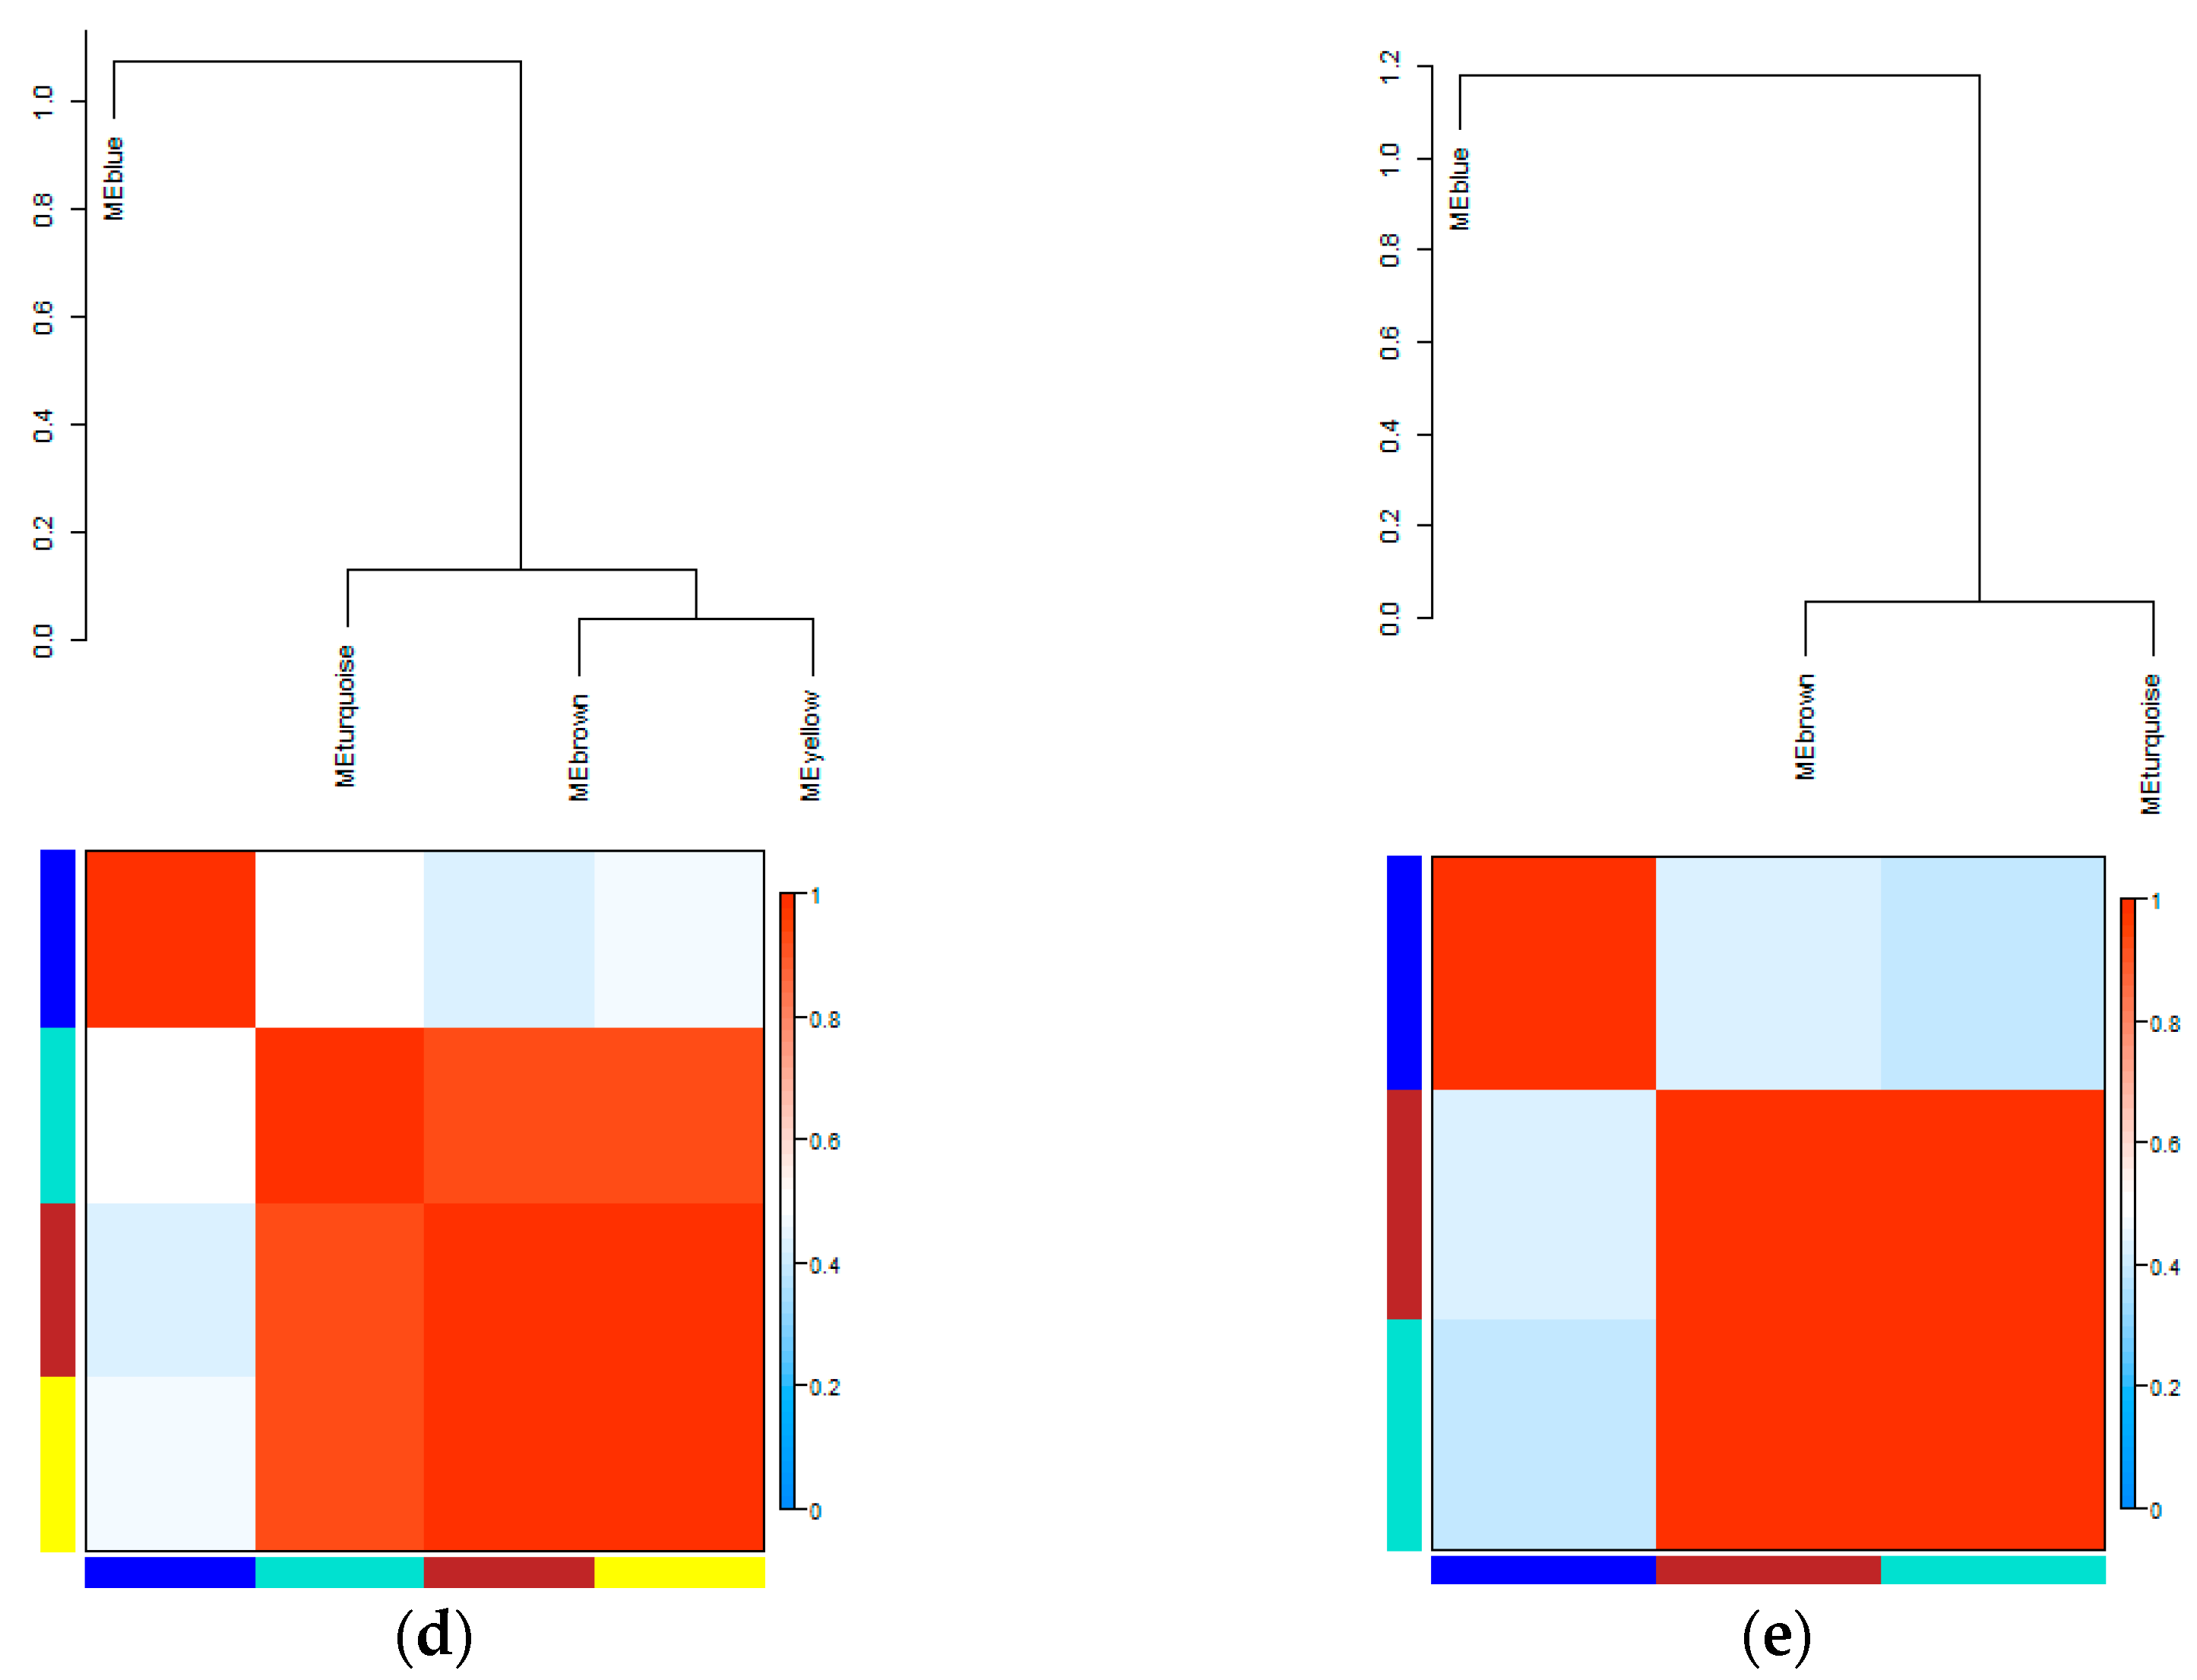
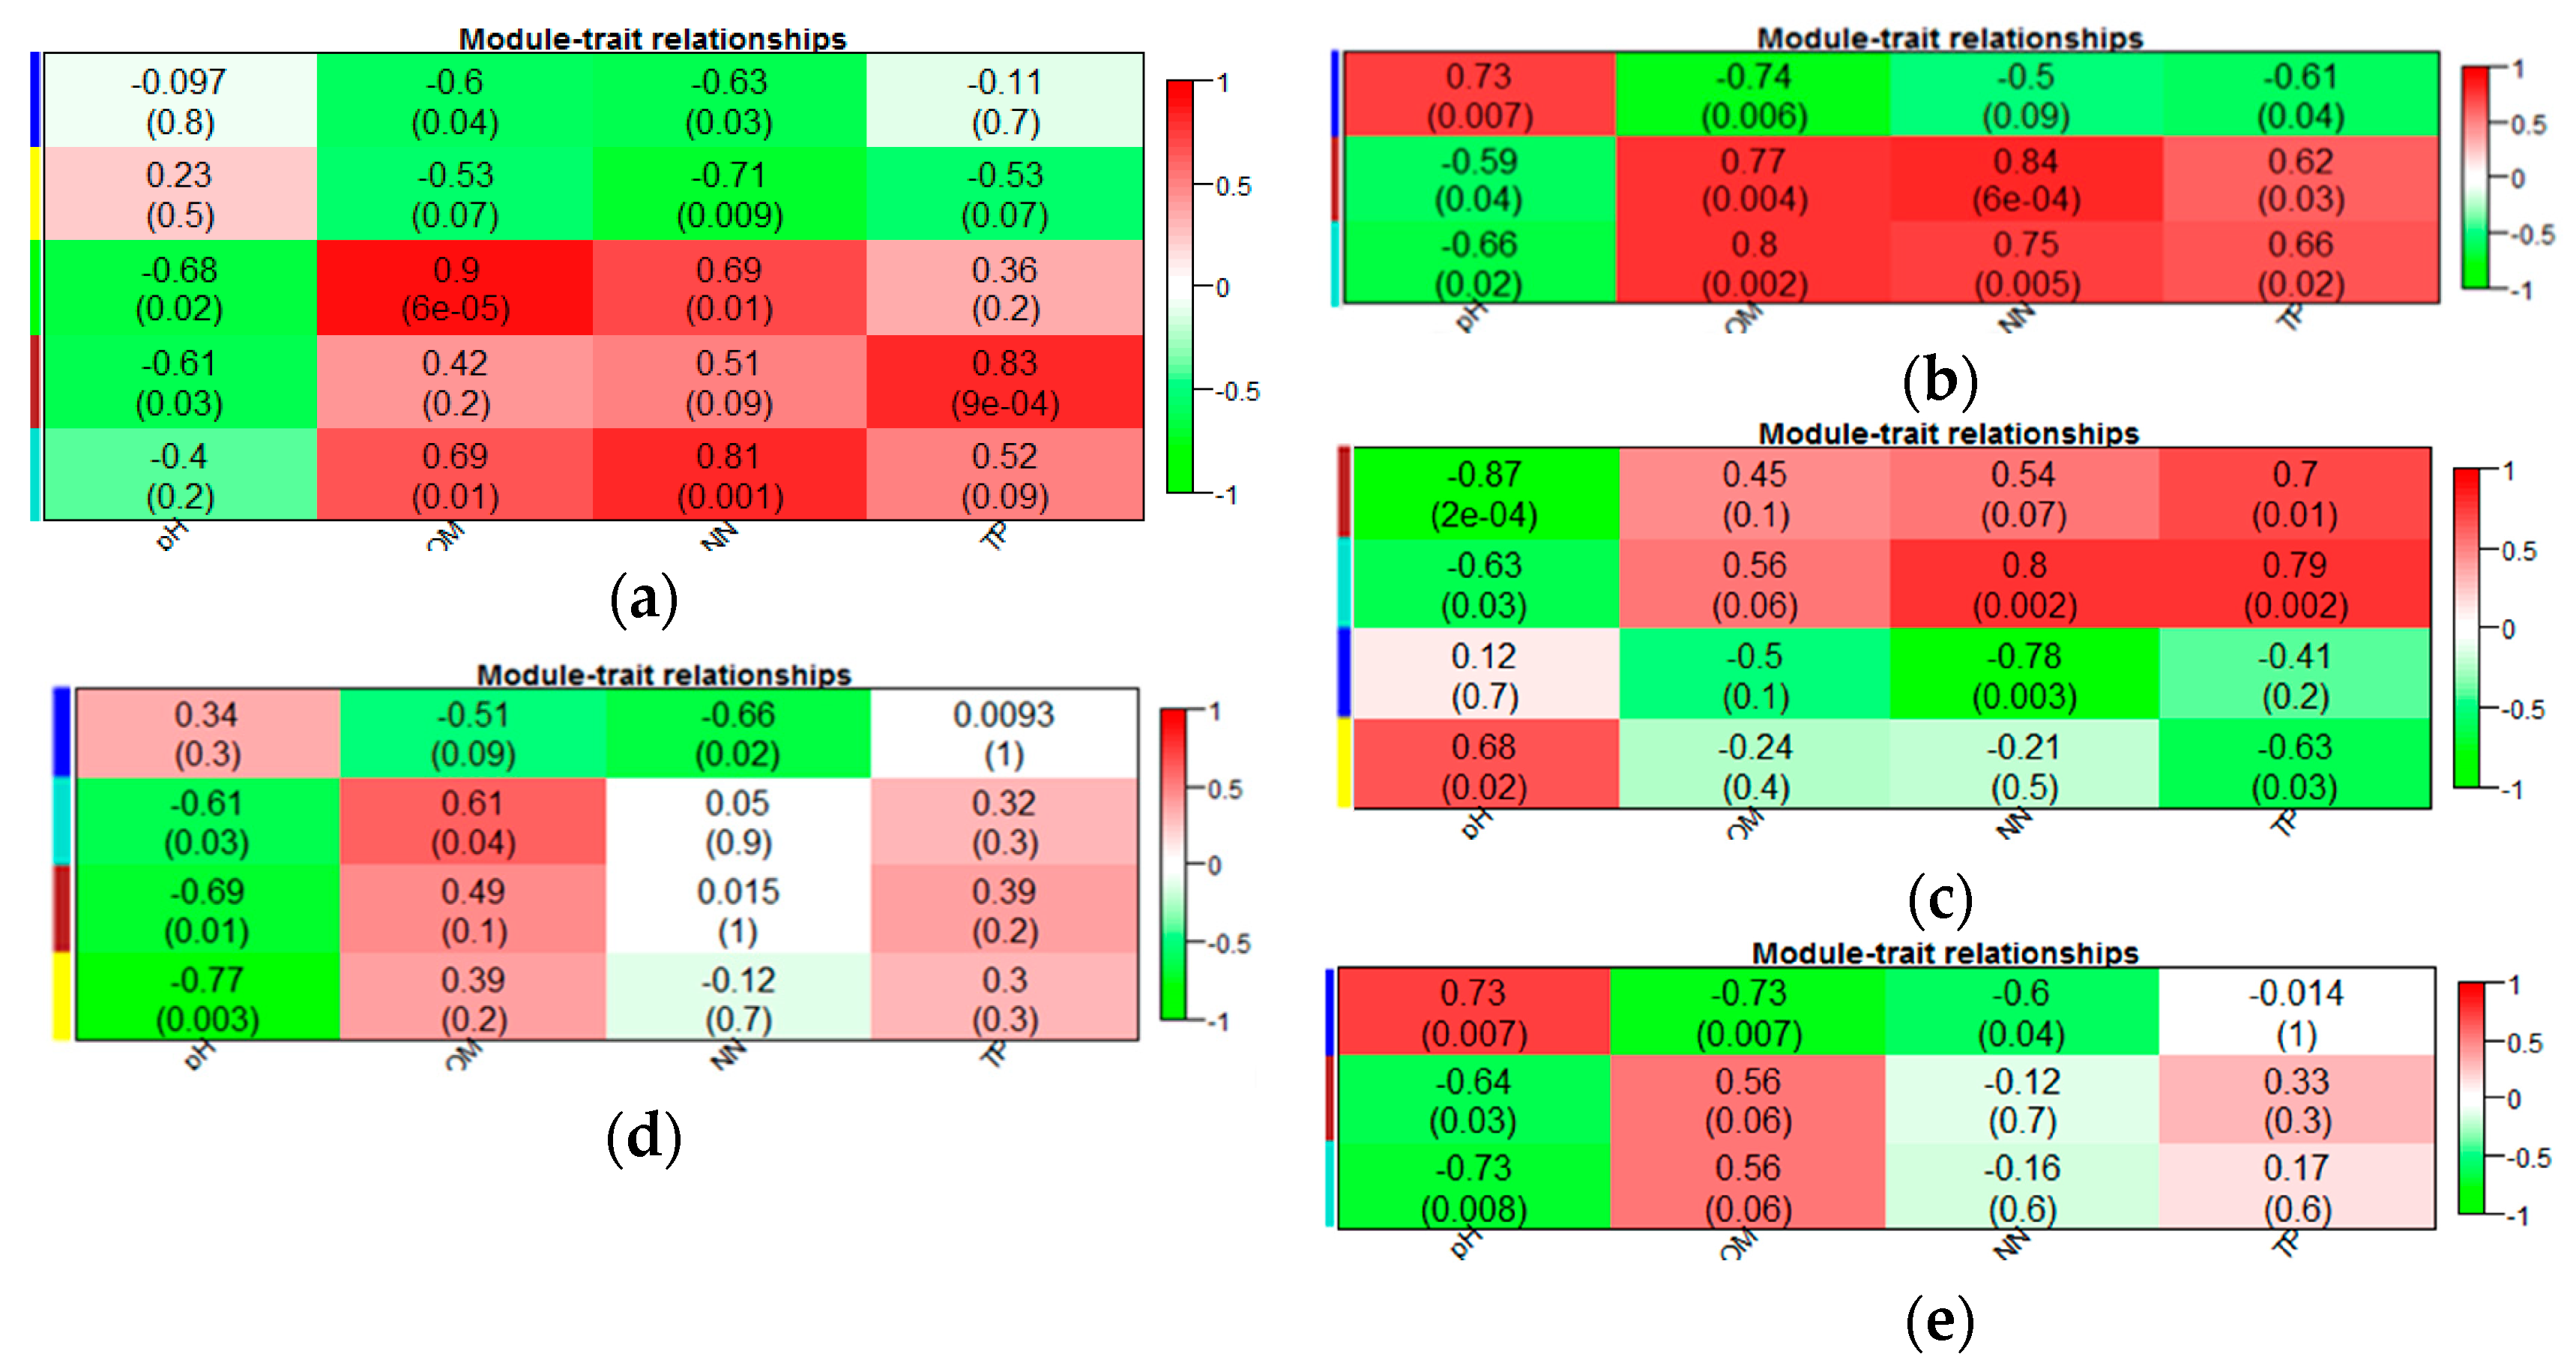
3.3. Eigengene Network Analysis

A conceptual example of eigengene network analysis for a module is illustrated in Figure 6. The eigengene network analysis was composed of various components. For example, a heat map showed the relative abundances of individual bacterial species within a module. Furthermore, the eigengene represented the abundance profile. The module membership included in the analysis referred to the key species within a module. The module visualization can be used to show the interactions among different populations, which are shown in Figure 3.
Taking the C and E networks as examples, in this study, there were five and three modules in the eigengene analysis of the two networks, respectively. The module eigengenes explained 38–75% and 40–61% of the variations in relative species abundance across different samples under C and E CO2 leakage conditions, respectively (Figures S1–S5, see Supplemental Material for the eigengene analysis graphs of the other networks). Most of the eigengenes (5/8) explained more than 50% of the observed variations, similar to observations from OTUs eigengene network analysis. These results imply that these eigengenes could represent species shift across different samples in individual modules.
Groups of eigengenes in this dendrogram are defined as the meta-modules in the eigengene network, which shows the higher-order structure of the constructed network. In our study, the eigengenes from some modules showed significant correlations. Two meta-modules were clustered for C and M networks, whereas only one meta-module was clustered for the L, H, and E networks (Figure 7). The eigengenes from the paired modules were clustered differently in different networks, which implies that the higher-order organization of the paired modules was not retained between different CO2 leakage concentrations. With the aim of determining how the species was associated with a module, module membership was evaluated, and was shown as the square of the Pearson correlation between the given species abundance profile and the module eigengene. Many species had significant module memberships with their respective modules (Files S1–S5, see Supplemental Material). However, for some nodes, module memberships presented different performances among the paired modules (Files S1–S5, see Supplemental Material). These results also indicate that CO2 could significantly change the topological positions of individual species.
With the purpose of checking whether some soil properties were important to network modules, the trait-based module significances were measured, via the square of the correlation between the signal intensity of a module and each soil characteristic (Figure 8). From Figure 8, it can be seen that, for the C network, there were strongly significant or significant correlations between the connectivity of three modules and the selected soil variables, except for the pH value (p ≤ 0.001, 0.001 ≤ p ≤ 0.05). For the L network, the connectivity of one module was very significantly related to the nitrate value (p ≤ 0.001). There were significant correlations between the connectivity of three modules and the selected soil variables of soil pH, soil organic matter (OM), nitrate-nitrogen (NN), and total phosphorus (TP) (0.001 ≤ p ≤ 0.05). However, for the E network, only the connectivity of one module showed a significant correlation with the selected soil variable pH (0.001 ≤ p ≤ 0.05).

4. Discussion

The rapid development of technologies such as high-throughput sequencing technologies provides huge amounts of scientific data, especially in the field of molecular ecology [41]. However, even with advanced technology, microorganisms are still invisible to the naked eye, and, additionally, most cannot be cultivated. Detection work always relies on molecular markers, such as 16S rRNA genes. The structures of microbial communities can be described by the gene richness and abundance. However, there are still some challenges in terms of dealing with these tremendous quantities of data and how to use these data to understand some functional processes at the community level. Furthermore, the relationship between biodiversity and ecosystem functioning is one of the central goals in ecology and environmental sciences. Abundant evidence supports the generally positive effect of biodiversity on ecosystem functioning, increasing ecosystem services and stability, and the resilience and multifunctionality of an ecosystem [42,43,44,45]. However, most biodiversity studies in the field of microbial ecology consider the richness and abundance of microbes, rather than the interactions among different microbes. Otherwise, network interactions play a more important role in the ecosystem processes and functions than diversity. Therefore, this study investigated how determining the response of bacterial communities to CO2 leakage and identifying the key populations is critical for future CO2-EOR projects and climate change. Based on high-throughput sequencing data, some networks were established, and how the CO2 concentration affected the network interactions among the different bacterial groups was investigated. The key microorganisms responding to higher CO2 leakage concentration, and the relationships between network structures and soil properties, were also analyzed.
In this study, the developed network analysis was used to show the microbial interactions under different CO2 concentrations. The obtained results support the hypothesis that microbial interactions vary across CO2 concentrations. The overall network properties changed across the five concentrations (Table 1), and the species involved in microbial interactions changed with leakage concentration, as proved by variations in dominant phyla (high node degree) (Figure 1). In the networks, it was assumed that community stability could be higher with increasing complexity, while the competition could improve as well. The simple network structure (no connectors between modules and more sparsely distributed species) and the extremely low competitive connections in the E network may lead to a negative effect on the biogeochemical function, and indicate an unstable and vulnerable microbial community in the extreme CO2 concentration when other disturbances occur. Microorganisms under this condition might be specialized to local environments and thus sensitive to environmental changes since gas leakage occurred. Furthermore, the results indicate that the network interactions for some microbial groups become more complicated under higher CO2 concentration, which is consistent with our previous studies showing that microbial community structures were significantly changed by higher CO2 concentration [46]. The present results also imply that external CO2 disturbance might have significantly impacted the structure of the microbial communities and their network interactions.
The networks obtained here show the general features of many cellular networks, such as modular, small-world, or scale-free [47]. A small-world pattern contributes to the efficient communication among different members in the community, and so can quickly respond to external environmental changes such as CO2 leakage. At the same time, the short path distance will allow the perturbations to reach the network quickly, and thus the network structure, as well as the microbial functions, might be changed. Furthermore, modularity can help to minimize the effects of perturbations on the community [48], while the organization of different modules in the community makes the communication between modules or network hubs respond quickly. Our results show that molecular ecological networks were modular.
The network connections between two OTUs could describe the co-occurrence of the two OTUs across different samples, which means that the two OTUs might respond to a common environmental parameter instead of interacting directly [49]. It has been reported that the characterization of OTU co-occurrence modules can be used to detect interactions in microbial communities. The changes of OTU abundances with strong module memberships might be motivated by the same underlying factors. Therefore, it can be inferred that OTUs with strong module memberships should have some physical and/or functional relationship in the community. As shown in our study, the modularity, module memberships, topological roles, and phylogenetic relationships of individual OTUs have provided some information to identify the key OTUs. Thus, the interactions and ecological roles of these microbial communities under CO2 leakage might have some implications for future CO2-EOR projects. It can also be speculated that the network interactions among different OTUs are greatly affected by CO2 leakage. This study may be the first one to present changes in network interactions among different OTUs of microbial communities under CO2 leakage in the process of CO2-EOR.
The identification of the keystone microbial populations is very important in ecology; however, it is not easy to achieve, especially considering the complexity, diversity, and uncultivated species in microbial communities [50,51]. As shown in our study, the key microbes can be identified based on the network topology, module memberships, and other information. In this study, there was an interesting result that the keystone taxa belong to the microbial phyla Bacteroidetes, Proteobacteria, Chloroflexi, and Planctomycetes, whereas the abundances of Chloroflexi, and Planctomycetes were not high, which might suggest that there is no relation between the abundance and key functional importance. Bateroidetes, a phylum containing anaerobic bacteria that are widely distributed in the soil environment, and Proteobacteria have highly diverse physiology and are distributed in almost all different ecological environments. Usually, leakage of CO2 might result in an anaerobic environment, and the relative abundance of anaerobic bacteria such as Bacteroidetes and Chloroflexi would show an increasing trend. Sáenz de Miera et al. showed that the abundance of the Proteobacteria phylum varied substantially under an increasing CO2 concentration at a naturally occurring CO2 gas vent [7]. This study also indicated that Proteobacteria is the key phylum at the CO2 leakage environment. Proteobacteria phylum contained lots of microbes such as the aerobic methanol-oxidizing bacterium capable of degrading a variety of nitrogen-containing contaminants, or the bacteria producing several oxidases that oxidize diverse compounds, or some bacteria which could produce CO2 in an anoxic environment [11]. It can then be speculated that increasing soil CO2 concentration could result in a more suitable environment for some microbes belonging to Proteobacteria, and making Proteobacteria the keystone bacteria. Chen et al. have reported that Chloroflexi increased with the increasing CO2 leakage, which indicated that this phylum might be potentially important indicators for the detection and resolution of gas leakage. Although the ecological function of this group was not clear, this phylum was still the keystone microbe, indicating that further study of the group’s metabolisms and diversity is needed [2]. Tait et al. have reported that Planctomycetacia presented a notable increase after two weeks of CO2 exposure from a controlled CO2 sub-seabed leak in Ardmucknish Bay [25]. This might suggest that Planctomycetes could be significantly influenced by CO2. On the other hand, the presence of microbes in the same modules might imply that these microbial populations compartmentalize with each other for ecological niches. Additionally, in Figure 4, Bacteroidetes and Proteobacteria were shown as the predominant phyla in the modules of different networks, which implies that these two phyla might be useful in the future for forecasting CO2 leak monitoring. This might also imply that CO2 concentration changed the network structure and key bacterial populations. Furthermore, this result might provide important information about candidate genes which are important to some ecosystem processes and functioning.
Understanding how microbial communities respond to environmental change, especially for anthropogenic change, is critical in ecology [52]. The networks presented in this study may provide an appropriate method to explore how environmental changes affect the structure of microbial communities. Our previous studies have shown that the composition and structure of microbial communities were significantly altered when the CO2 concentration increased, which might be due to the increased input of C into the soil and associated chemical effect [2,4,11]. In this study, there were strong correlations between the node connectivity and the selected soil variables such as soil OM or nitrate content for the C network, while the pH value was significantly related with some modules in the L, M, H, and E networks. On the other hand, based on the relationships between microbial network interactions and soil properties, some network studies have been established. For the control site, pH was not presented as a node, while it was a node in other leakage networks. This result implies that the pH value played an important role in the network structure. In the E network, pH node showed a positive relationship with the phyla Verrucomicrobia and Bacteroidetes; however, presented a negative relationship with the phylum Proteobacteria (Figures S6–S10, see Supplemental Material). This result might indicate that the high CO2 concentration affected the network interactions among different microbial groups, and such changes might correlate with some soil properties, such as pH value. Chen et al. have expressed that the Bacteroidetes was the most affected phylum in response to CO2 variation. Furthermore, a negative concentration between pH value and the CO2 flux appeared [4]. Fernández-Montiel et al. showed that soil pH could change the slightly acidic environment to the acidic condition under higher CO2 flux pressure [23]. Sáenz de Miera et al. concluded that CO2 injection introduced a decreasing pH value relative to a zero CO2-addition control [24]. The results in this study also implied that both pH value and CO2 leakage concentration affected the microbial and network structures. Soil organic matter represents an important index to estimate the soil carbon storage and to evaluate soil fertility and quality. In the current study, there was no significant correlation between organic matter and network modules under higher CO2 concentrations. Furthermore, an increased CO2 concentration in the soil can influence nitrogen content through affecting nitrogen fixation, nitrification, denitrification, anaerobic ammonium oxidation, and other biochemical processes. However, there is no relationship between the nitrate-nitrogen content and network modules.
However, information about the presence of bacteria related to keystone microbes such as Bacteroidetes, Chloroflexi, and Planctomycetes phyla are still not sufficiently available for the networks. The high-throughput 16S RNA gene sequencing only provided extensive information about the taxa present in bacterial communities under different CO2 leakage concentrations, and gave few insights into the functional roles of these phyla in this study. The ecological function network analysis of these microorganisms, and more extensive research of their metabolism and diversity might be investigated in the near future with the technology of Geochip.

5. Conclusions

In summary, this study demonstrated microbial interactions and their relationships under different CO2 leakage concentrations. Understanding how the microbial communities responded to the elevated CO2 concentration is critical for ecologists. Moreover, the results presented here might be important for studies on ecology and microbiology. This study demonstrated that the network interactions for most of the microbial groups became less complex under higher CO2 concentration. To our knowledge, this is the first study to demonstrate changes in the network interactions of microbial communities in a CO2-EOR project. These results of keystone species also suggest that different CO2 leakage concentrations selected for different bacterial communities and that the interactions among different microbial taxa in the soil bacterial communities were greatly changed by CO2 concentration. Moreover, the results of eigengene network analysis and trait-based module significances showed that the soil properties were significantly correlated with some OTUs. This study provides a novel conceptual framework for studying network interactions among different microbial populations, which is an essential component of biodiversity studies. Future work should focus on functional network analysis at CO2 leakage areas to understand the mechanisms involved.

Supplementary Materials

The following are available online at https://www.mdpi.com/1424-2818/11/5/77/s1, Figure S1: Eigengenes network analysis with modules 1–4 under control CO2 concentration, Figure S2: Eigengenes network analysis with modules under low CO2 concentration, Figure S3: Eigengenes network analysis with modules under medium CO2 concentration, Figure S4: Eigengenes network analysis with modules under high CO2 concentration, Figure S5: Eigengenes network analysis with modules under extreme CO2 concentration, Figure S6: C_environment network, Figure S7: L_environment network, Figure S8: M_environment network, Figure S9: H_environment network, Figure S10: E_environment network, Figure S11: C_RDA analysis between bacterial community and environmental factors, Figure S12: L_RDA analysis between bacterial community and environmental factors, Figure S13: M_RDA analysis between bacterial community and environmental factors, Figure S14: H_RDA analysis between bacterial community and environmental factors, Figure S15: E_RDA analysis between bacterial community and environmental factors, File S1: Module Membership for C network, File S2: Module Membership for L network, File S3: Module Membership for M network, File S4: Module Membership for H network, File S5: Module Membership for E network.

Author Contributions

Conceptualization, J.M. and Z.L.; methodology, J.M., Z.L., F.C. and S.Z.; software, J.M., Z.L., R.C. and Q.Z.; validation, J.M., Z.L., F.C., R.C., Q.Z. and S.Z.; formal analysis, J.M., F.C., R.C., Q.Z. and S.Z.; investigation, J.M., Z.L., F.C., R.C., Q.Z. and S.Z.; resources, F.C.; data curation, Z.L.; writing—original draft, J.M., Z.L. and F.C.; writing—review & editing, J.M., Z.L. and F.C.; visualization, J.M. and Z.L.; supervision, F.C. and S.Z.; project administration, F.C.; funding acquisition, F.C.

Funding

This research was funded by the Grand Funds of Key Laboratory of Coal-based CO2 Capture and Geological Storage (CUMT), Jiangsu Province, grant number 2017A03.

Acknowledgments

The authors would like to thank MDPI English Service for providing linguistic assistance during the preparation of this manuscript.

Conflicts of Interest

The authors declare no conflict of interest. The funders had no role in the design of the study; in the collection, analyses, or interpretation of data; in the writing of the manuscript, or in the decision to publish the results.

References

  1. IPCC. Mitigation of Climate Change. Contribution of Working Group III to the Fifth Assessment Report of the Intergovernmental Panel on Climate Change; Cambridge University Press: Cambridge, UK; New York, NY, USA, 2014; pp. 18–28. [Google Scholar]
  2. Chen, F.; Zhang, W.; Ma, J.; Yang, Y.; Zhang, S.; Chen, R. Experimental study on the effects of underground CO2 leakage on soil microbial consortia. Int. J. Greenh. Gas Control 2017, 63, 241–248. [Google Scholar] [CrossRef]
  3. Zhou, X.; Apple, M.E.; Dobeck, L.M.; Cunningham, A.B.; Spangler, L.H. Observed response of soil O2 concentration to leaked CO2 from an engineered CO2 leakage experiment. Int. J. Greenh. Gas Control 2013, 16, 116–128. [Google Scholar] [CrossRef]
  4. Chen, F.; Yang, Y.; Ma, Y.; Hou, H.; Zhang, S.; Ma, J. Effects of CO2 leakage on soil bacterial communities from simulated CO2-EOR areas. Environ. Sci. Process. Impacts 2016, 18, 547–554. [Google Scholar] [CrossRef]
  5. Herbert, E.R.; Boon, P.; Burgin, A.J.; Neubauer, S.C.; Franklin, R.B.; Hopfensperger, K.N.; Lamers, L.P.M.; Gell, P.; Ardón, M. A global perspective on wetland salinization: Ecological consequences of a growing threat to freshwater wetlands. Ecosphere 2016, 6, 1–43. [Google Scholar] [CrossRef]
  6. Li, Q.; Song, R.; Liu, X.; Liu, G.; Sun, Y. Monitoring of Carbon Dioxide Geological Utilization and Storage in China: A Review. Acid Gas Extr. Dispos. Relat. Top. 2016, 33, 1–358. [Google Scholar] [CrossRef]
  7. Sáenz de Miera, L.E.; Arroyo, P.; de Luis Calabuig, E.; Falagán, J.; Ansola, G. High-throughput sequencing of 16S RNA genes of soil bacterial communities from a naturally occurring CO2 gas vent. Int. J. Greenh. Gas Control 2014, 29, 176–184. [Google Scholar] [CrossRef]
  8. Ko, D.; Yoo, G.; Yun, S.-T.; Chung, H. Impacts of CO2 leakage on plants and microorganisms: A review of results from CO2 release experiments and storage sites. Greenh. Gases Sci. Technol. 2016, 6, 319–338. [Google Scholar] [CrossRef]
  9. Li, Q.; Liu, G. Risk Assessment of the Geological Storage of CO2: A Review. In Geologic Carbon Sequestration: Understanding Reservoir Behavior; Vishal, V., Singh, T.N., Eds.; Springer International Publishing: Cham, Switzerland, 2016; pp. 249–284. [Google Scholar]
  10. Li, Q.; Liu, G.; Cai, B.; Leamon, G.; Liu, L.-C.; Chen, Z.-A.; Li, X. Public awareness of the environmental impact and management of carbon dioxide capture, utilization and storage technology: The views of educated people in China. Clean Technol. Environ. Policy 2017, 19, 2041–2056. [Google Scholar] [CrossRef]
  11. Ma, J.; Zhang, W.; Zhang, S.; Zhu, Q.; Feng, Q.; Chen, F. Short-term effects of CO2 leakage on the soil bacterial community in a simulated gas leakage scenario. PeerJ 2017, 5, e4024. [Google Scholar] [CrossRef]
  12. Drigo, B.; Kowalchuk, G.A.; van Veen, J.A. Climate change goes underground: Effects of elevated atmospheric CO2 on microbial community structure and activities in the rhizosphere. Biol. Fertil. Soils 2008, 44, 667–679. [Google Scholar] [CrossRef]
  13. Eisenhauer, N.; Cesarz, S.; Koller, R.; Worm, K.; Reich, P.B. Global change belowground: Impacts of elevated CO2, nitrogen, and summer drought on soil food webs and biodiversity. Glob. Chang. Biol. 2012, 18, 435–447. [Google Scholar] [CrossRef]
  14. Banerjee, S.; Kirkby, C.A.; Schmutter, D.; Bissett, A.; Kirkegaard, J.A.; Richardson, A.E. Network analysis reveals functional redundancy and keystone taxa amongst bacterial and fungal communities during organic matter decomposition in an arable soil. Soil Biol. Biochem. 2016, 97, 188–198. [Google Scholar] [CrossRef]
  15. Fuhrman, J.A. Microbial community structure and its functional implications. Nature 2009, 459, 193–199. [Google Scholar] [CrossRef]
  16. Ruan, Q.; Dutta, D.; Sun, F.; Fuhrman, J.A.; Steele, J.A.; Schwalbach, M.S. Local similarity analysis reveals unique associations among marine bacterioplankton species and environmental factors. Bioinformatics 2006, 22, 2532–2538. [Google Scholar] [CrossRef] [Green Version]
  17. Zhou, J.; Deng, Y.; Luo, F.; He, Z.; Tu, Q.; Zhi, X. Functional Molecular Ecological Networks. mBio 2010, 1, e00169-10. [Google Scholar] [CrossRef]
  18. Krueger, M.; Jones, D.; Frerichs, J.; Oppermann, B.I.; West, J.; Coombs, P.; Green, K.; Barlow, T.; Lister, R.; Shaw, R.; et al. Effects of elevated CO2 concentrations on the vegetation and microbial populations at a terrestrial CO2 vent at Laacher See, Germany. Int. J. Greenh. Gas Control 2011, 5, 1093–1098. [Google Scholar] [CrossRef]
  19. Beaubien, S.E.; Ciotoli, G.; Coombs, P.; Dictor, M.C.; Krueger, M.; Lombardi, S.; Pearce, J.M.; West, J.M. The impact of a naturally occurring CO2 gas vent on the shallow ecosystem and soil chemistry of a Mediterranean pasture (Latera, Italy). Int. J. Greenh. Gas Control 2008, 2, 373–387. [Google Scholar] [CrossRef]
  20. Oesterreicher-Cunha, P.; Molinaro, B.S.; Feijo, I.V.A.; Vargas, E.A., Jr.; Guimaraes, J.R.D. Experimental evaluation of CO2 percolation effects on subsurface soil microbiota. Int. J. Greenh. Gas Control 2015, 32, 135–146. [Google Scholar] [CrossRef]
  21. Liu, Y.; Zhou, H.; Wang, J.; Liu, X.; Cheng, K.; Li, L.; Zheng, J.; Zhang, X.; Zheng, J.; Pan, G. Short-term response of nitrifier communities and potential nitrification activity to elevated CO2 and temperature interaction in a Chinese paddy field. Appl. Soil Ecol. 2015, 96, 88–98. [Google Scholar] [CrossRef]
  22. Beulig, F.; Urich, T.; Nowak, M.; Trumbore, S.E.; Gleixner, G.; Gilfillan, G.D.; Fjelland, K.E.; Küsel, K. Altered carbon turnover processes and microbiomes in soils under long-term extremely high CO2 exposure. Nat. Microbiol. 2016, 1, 15025. [Google Scholar] [CrossRef]
  23. Fernández-Montiel, I.; Touceda, M.; Pedescoll, A.; Gabilondo, R.; Prieto-Fernández, A.; Bécares, E. Short-term effects of simulated below-ground carbon dioxide leakage on a soil microbial community. Int. J. Greenh. Gas Control 2015, 36, 51–59. [Google Scholar] [CrossRef]
  24. Sáenz de Miera, L.E.; Arroyo, P.; de Luis Calabuig, E.; Ansola, G. Effects of varying CO2 flows on bacterial communities in mesocosms created from two soils. Int. J. Greenh. Gas Control 2016, 46, 205–214. [Google Scholar] [CrossRef]
  25. Tait, K.; Stahl, H.; Taylor, P.; Widdicombe, S. Rapid response of the active microbial community to CO2 exposure from a controlled sub-seabed CO2 leak in Ardmucknish Bay (Oban, Scotland). Int. J. Greenh. Gas Control 2015, 38, 171–181. [Google Scholar] [CrossRef]
  26. Barberán, A.; Bates, S.T.; Casamayor, E.O.; Fierer, N. Using network analysis to explore co-occurrence patterns in soil microbial communities. ISME J. 2011, 6, 343–351. [Google Scholar] [CrossRef] [Green Version]
  27. Zhou, J.; Deng, Y.; Luo, F.; He, Z.; Yang, Y. Phylogenetic Molecular Ecological Network of Soil Microbial Communities in Response to Elevated CO2. MBio 2011, 2, e00122-11. [Google Scholar] [CrossRef] [PubMed]
  28. Hunt, D.E.; Ward, C.S. A network-based approach to disturbance transmission through microbial interactions. Front. Microbiol. 2015, 6, 1182. [Google Scholar] [CrossRef]
  29. Morriën, E.; Hannula, S.E.; Snoek, L.B.; Helmsing, N.R.; Zweers, H.; de Hollander, M.; Soto, R.L.; Bouffaud, M.-L.; Buée, M.; Dimmers, W.; et al. Soil networks become more connected and take up more carbon as nature restoration progresses. Nat. Commun. 2017, 8, 14349. [Google Scholar] [CrossRef] [PubMed] [Green Version]
  30. Deng, Y.; Zhang, P.; Qin, Y.; Tu, Q.; Yang, Y.; He, Z.; Schadt, C.W.; Zhou, J. Network succession reveals the importance of competition in response to emulsified vegetable oil amendment for uranium bioremediation. Environ. Microbiol. 2016, 18, 205–218. [Google Scholar] [CrossRef] [PubMed]
  31. Wang, S.; Wang, X.; Han, X.; Deng, Y. Higher precipitation strengthens the microbial interactions in semi-arid grassland soils. Glob. Ecol. Biogeogr. 2018, 27, 570–580. [Google Scholar] [CrossRef]
  32. Jiang, X.; Takacs-Vesbach, C.D. Microbial community analysis of pH 4 thermal springs in Yellowstone National Park. Extremophiles 2017, 21, 135–152. [Google Scholar] [CrossRef]
  33. Van Horn, D.J.; Wolf, C.R.; Colman, D.R.; Jiang, X.; Kohler, T.J.; McKnight, D.M.; Stanish, L.F.; Yazzie, T.; Takacs-Vesbach, C.D. Patterns of bacterial biodiversity in the glacial meltwater streams of the McMurdo Dry Valleys, Antarctica. FEMS Microbiol. Ecol. 2016, 92, fiw148. [Google Scholar] [CrossRef]
  34. Deng, Y.; Jiang, Y.-H.; Yang, Y.; He, Z.; Luo, F.; Zhou, J. Molecular ecological network analyses. BMC Bioinform. 2012, 13, 113. [Google Scholar] [CrossRef]
  35. Killcoyne, S.; Carter, G.W.; Smith, J.; Boyle, J. Cytoscape: A community-based framework for network modeling. Methods Mol. Biol. (Clifton N.J.) 2009, 563, 219–239. [Google Scholar] [CrossRef]
  36. Doncheva, N.T.; Morris, J.H.; Gorodkin, J.; Jensen, L.J. Cytoscape StringApp: Network Analysis and Visualization of Proteomics Data. J. Proteome Res. 2019, 18, 623–632. [Google Scholar] [CrossRef] [PubMed]
  37. Watts, D.J.; Strogatz, S.H. Collective dynamics of ‘small-world’ networks. Nature 1998, 393, 440–442. [Google Scholar] [CrossRef]
  38. Alon, U. Biological Networks: The Tinkerer as an Engineer. Science 2003, 301, 1866–1867. [Google Scholar] [CrossRef]
  39. Olesen, J.M.; Bascompte, J.; Dupont, Y.L.; Jordano, P. The modularity of pollination networks. Proc. Natl. Acad. Sci. USA 2007, 104, 19891–19896. [Google Scholar] [CrossRef] [PubMed] [Green Version]
  40. Layeghifard, M.; Hwang, D.M.; Guttman, D.S. Disentangling Interactions in the Microbiome: A Network Perspective. Trends Microbiol. 2017, 25, 217–228. [Google Scholar] [CrossRef]
  41. Shendure, J.; Balasubramanian, S.; Church, G.M.; Gilbert, W.; Rogers, J.; Schloss, J.A.; Waterston, R.H. DNA sequencing at 40: Past, present and future. Nature 2017, 550, 345–353. [Google Scholar] [CrossRef] [PubMed]
  42. Lei, P.; Scherer-Lorenzen, M.; Bauhus, J. Belowground facilitation and competition in young tree species mixtures. For. Ecol. Manag. 2012, 265, 191–200. [Google Scholar] [CrossRef]
  43. Oliver, T.H.; Heard, M.S.; Isaac, N.J.B.; Roy, D.B.; Procter, D.; Eigenbrod, F.; Freckleton, R.; Hector, A.; Orme, C.D.L.; Petchey, O.L.; et al. Biodiversity and Resilience of Ecosystem Functions. Trends Ecol. Evol. 2015, 30, 673–684. [Google Scholar] [CrossRef] [Green Version]
  44. van der Plas, F.; Manning, P.; Allan, E.; Scherer-Lorenzen, M.; Verheyen, K.; Wirth, C.; Zavala, M.A.; Hector, A.; Ampoorter, E.; Baeten, L.; et al. Jack-of-all-trades effects drive biodiversity–ecosystem multifunctionality relationships in European forests. Nat. Commun. 2016, 7, 11109. [Google Scholar] [CrossRef] [PubMed] [Green Version]
  45. Wang, S.; Brose, U. Biodiversity and ecosystem functioning in food webs: The vertical diversity hypothesis. Ecol. Lett. 2018, 21, 9–20. [Google Scholar] [CrossRef] [PubMed]
  46. Fernández-Montiel, I.; Pedescoll, A.; Bécares, E. Microbial communities in a range of carbon dioxide fluxes from a natural volcanic vent in Campo de Calatrava, Spain. Int. J. Greenh. Gas Control 2016, 50, 70–79. [Google Scholar] [CrossRef]
  47. Xiao Fan, W.; Guanrong, C. Complex networks: Small-world, scale-free and beyond. IEEE Circuits Syst. Mag. 2003, 3, 6–20. [Google Scholar] [CrossRef] [Green Version]
  48. Kitano, H. Biological robustness. Nat. Rev. Genet. 2004, 5, 826–837. [Google Scholar] [CrossRef] [PubMed]
  49. Chaffron, S.; Rehrauer, H.; Pernthaler, J.; von Mering, C. A global network of coexisting microbes from environmental and whole-genome sequence data. Genome Res. 2010, 20, 947–959. [Google Scholar] [CrossRef] [Green Version]
  50. Delgado-Baquerizo, M.; Oliverio, A.M.; Brewer, T.E.; Benavent-Gonzalez, A.; Eldridge, D.J.; Bardgett, R.D.; Maestre, F.T.; Singh, B.K.; Fierer, N. A global atlas of the dominant bacteria found in soil. Science 2018, 359, 320–325. [Google Scholar] [CrossRef]
  51. Fierer, N. Embracing the unknown: Disentangling the complexities of the soil microbiome. Nat. Rev. Microbiol. 2017, 15, 579–590. [Google Scholar] [CrossRef]
  52. Harris, J. Soil Microbial Communities and Restoration Ecology: Facilitators or Followers? Science 2009, 325, 573–574. [Google Scholar] [CrossRef]
Figure 1. Location of the study area and research photos. (a) The High 89 CO2 gas injection station; (b) affected wheat growth; (c) soil sample collection.
Diversity 11 00077 g001
Figure 2. The node and link number for the five networks (a), and the node number of each phylum for the five networks (b). (C, control; L, low CO2 concentration; M, medium CO2 concentration; H, high CO2 concentration; E, extreme CO2 concentration).
Diversity 11 00077 g002
Figure 3. Network graph with module structure produced by the fast greedy modularity optimization method. Each node corresponds to a microbial population: (a) network C; (b) network L; (c) network M; (d) network H; (e) network E. 1, 2, 3 and 4 stand for the module number. A red link indicates a negative correlation and a blue link positive correlation.
Diversity 11 00077 g003aDiversity 11 00077 g003b
Figure 4. Profiles of the networks under five different CO2 concentrations, with the node size proportional to node degree: (a) network C; (b) network L; (c) network M; (d) network H; (e) network E. A red link indicates negative correlation and a blue link positive correlation.
Diversity 11 00077 g004
Figure 5. Z-P plot showing the keystone species in the different CO2 concentration networks. Different symbols with special colors represent different networks showing as follows: black squares for control, red stars for the low CO2 concentration, blue up-triangles for medium CO2 concentration, rose red down-triangles for high CO2 concentration and green diamonds for the extreme CO2 concentration. The module hubs and connectors are labeled with phylogenetic affiliations. (C, control; L, low CO2 concentration; M, medium CO2 concentration; H, high CO2 concentration; E, extreme CO2 concentration).
Diversity 11 00077 g005
Figure 6. Conceptual example of eigengene network analysis with module 5 under control CO2 concentration.
Diversity 11 00077 g006
Figure 7. Correlations and heatmap of module eigengenes of the five networks: (a) network C; (b) network L; (c) network M; (d) network H; (e) network E.
Diversity 11 00077 g007aDiversity 11 00077 g007b
Figure 8. Correlations between the signal intensity of a module and each soil characteristic for the five networks: (a) network C; (b) network L; (c) network M; (d) network H; (e) network E.
Diversity 11 00077 g008
Table 1. Topological properties of the empirical molecular ecological networks of microbial communities and their random networks under five CO2 concentrations. (C, control; L, low CO2 concentration; M, medium CO2 concentration; H, high CO2 concentration; E, extreme CO2 concentration).
NetworkIndexCLMHE
Empirical networksSimilarity threshold0.80.80.80.80.8
R2 of power law0.50.5940.5680.3520.636
avgK8.0778.0265.5218.5537.387
avgCC0.4870.5700.4520.5480.536
GD2.9152.8413.0682.9422.773
Modularity0.3930.4370.4940.3370.383
Random networksavgCC0.235 ± 0.020.223 ± 0.0200.130 ± 0.0210.299 ± 0.0210.266 ± 0.024
GD2.410 ± 0.0462.346 ± 0.0362.655 ± 0.0442.287 ± 0.0272.408 ± 0.049
Modularity0.237 ± 0.0090.244 ± 0.0100.327 ± 0.0120.224 ± 0.0080.247 ± 0.010

