Article

Spatial and Temporal Variation in Fecundity of Acropora spp. in the Northern Great Barrier Reef

1
ARC Centre of Excellence for Coral Reef Studies, James Cook University, Townsville, QLD 4811, Australia
2
School of Marine and Environmental Sciences, Universiti Malaysia Terengganu, Kuala Nerus 21030, Terengganu, Malaysia
3
Biodiversity Research Center, Academia Sinica, Nangang, Taipei 115, Taiwan
4
Experimental Marine Ecology Laboratory, Department of Biological Sciences, National University of Singapore, Singapore 117543, Singapore
5
Summer Research Program for Science Teachers, Columbia University, New York, NY 10032, USA
*
Author to whom correspondence should be addressed.
Diversity 2019, 11(4), 60; https://doi.org/10.3390/d11040060
Submission received: 21 January 2019 / Revised: 4 April 2019 / Accepted: 9 April 2019 / Published: 16 April 2019

Abstract

:
The amount of energy invested in sexual reproduction by scleractinian corals depends on their life history strategies (i.e., allocation of energy between growth, reproduction, and maintenance). However, energy allocated to reproduction will also be affected by the amount of energy acquired and prevailing environmental conditions. Coral fecundity is therefore likely to vary spatially, especially along marked gradients in environmental conditions. One of the foremost gradients in reef structure and environmental conditions occurs with distance from the coast, whereby inner-shelf or near shore reefs are generally subject to higher levels of nutrients, sediments and pollutants, which often adversely affect reef-building corals. This study quantified fecundity (oocytes per polyp) for three species, Acropora nasuta, A. spathulata, and A. hyacinthus, at six locations in the northern Great Barrier Reef (GBR), encompassing inner-, mid- and outer-shelf reefs. Replicate colonies were sampled at each location prior to the predicted date of spawning in 2013 and 2014. Both shelf position and year were important factors explaining variation in fecundity for each of the three coral species. Most notably, there were clear and consistent declines in the number of oocytes between 2013 and 2014, coinciding with the incidence of category 4 Cylone Ita in early 2014. Contrary to expectations, polyp-level fecundity was no lower (and in some cases substantially higher) on inner-shelf reefs, compared to conspecifics growing on mid-shelf or outer-shelf reefs. The observed patterns are much more complicated than anticipated, necessitating further research to understand differential population dynamics of corals on inner-shelf versus mid- and outer-shelf reefs.

1. Introduction

Sexual reproduction by scleractinian (hard) corals is fundamental to population replenishment and persistence, genetic connectivity, and reef resilience [1]. Reproductive output is often reduced following disturbance, such as bleaching [2], or when the health of individuals is compromised [3]. The amount of energy invested in gamete production is also expected to vary with life history strategy. For example, slow growing massive coral species mature later than rapidly growing branching species [4]. There is however, limited understanding of how fecundity varies spatially and temporally within species.
Differential investment in sexual reproduction by scleractinian corals may be manifested at the level of populations, colonies, polyps, or oocytes, all of which influence overall reproductive output and population replenishment. Among populations, the proportion of colonies that are reproductive varies spatially [5] and temporally [2], with variation in temperature and other environmental conditions. Among colonies, fecundity varies with colony size [6,7], microhabitat [8], and/or competition [9]. Within colonies, fecundity varies among polyps due to age or the position of the polyp [10]. Oocytes also vary naturally in size and quality, which can reflect the health and condition of the colony and exposure to environmental stress [11,12].
Given sensitivity to environmental stress, coral reproductive output might be expected to be constrained in near shore environments where anthropogenic transformation of coastal environments (e.g., land clearing, coastal development, and dredging) is leading to increased inputs of sediments, nutrients, and other pollutants [13,14]. Sustained declines in the abundance of corals on Australia’s Great Barrier Reef (GBR) are also most pronounced in near shore environments, and are linked to long-term deterioration of environmental conditions [15,16]. While some coral species are capable of withstanding increased exposure to sedimentation by actively feeding on particulate matter [17,18], sedimentation is often deleterious for coral species that are predominantly autotrophic, such as the ecologically dominant Acropora [19], leading to reduced growth and reproduction [20]. Higher turbidity also means less light for photosynthesis.
Degraded near shore (or inshore) reef habitats also tend to support a higher abundance of fleshy macroalgae [21,22,23,24]), which may further constrain the reproductive output of scleractinain corals [9,25]. Foster et al. [25] showed that colonies of Orbicella (formerly Montastraea) annularis had greatly reduced fecundity when subject to direct contact by macroalgae (especially Dictyota spp.), attributed to increased energetic allocation by coral polyps and colonies to defense and repair [26,27,28]. Inshore reefs generally have lower water flow, which can affect respiration and therefore energy production [29].
The purpose of this study was to explore cross-shelf variation in fecundity (specifically, the number of oocytes per polyp) for three coral species: A. nasuta, A. spathulata, and A. hyacinthus. Given likely constraints on energy acquisition in near shore environments [14], as well as the sensitivity of branching corals to sedimentation [30,31], we expected to find increased fecundity with increasing distance from shore. Reduced levels of coral fecundity in near shore environments might also contribute to cross-shelf differences in levels of coral recruitment [32]. This study was conducted in the northern GBR, where there are pronounced and well-documented cross-shelf gradients in the structure of reef habitats [21,22], related to varying environmental conditions.

2. Materials and Methods
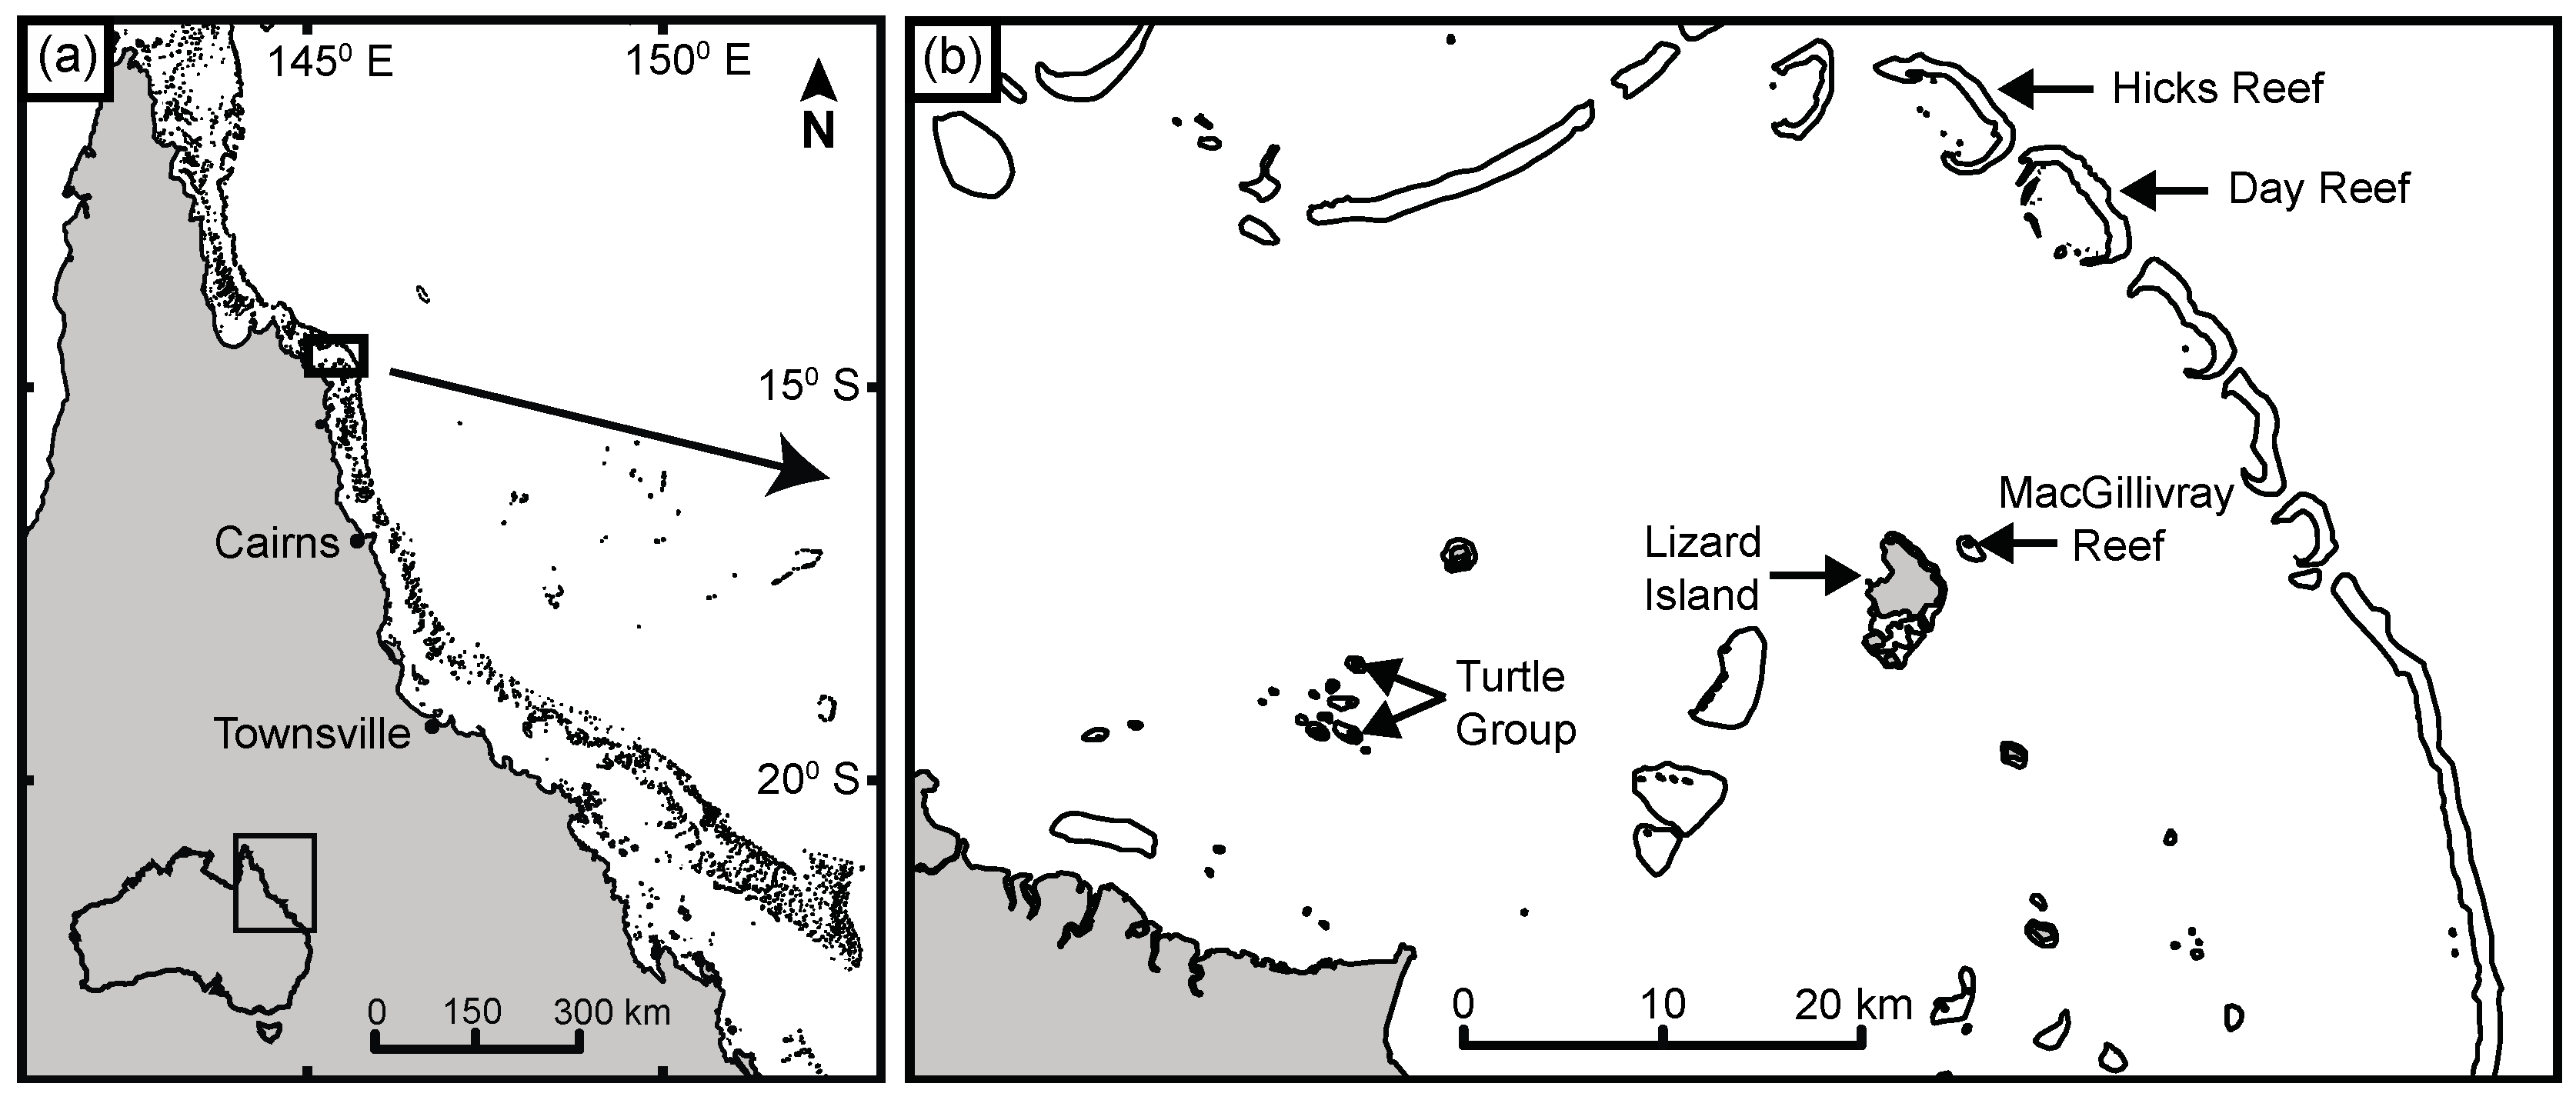
2.1. Field Sampling

Fecundity of three coral species (Acropora nasuta, A. spathulata, and A. hyacinthus) was quantified among reefs with increasing distance from the Australian coastline, in the northern GBR. More specifically, sampling was conducted at: (i) two inner-shelf reefs within the Turtle Group (both north and south) located 11–15 km from the mainland, (ii) Lizard Island and MacGillivray Reef, located on the mid-shelf 28–35 km offshore, and (iii) Hicks Reef and Day Reef, located on the outer-shelf 48–53 km from the Australian coastline (Figure 1). At all locations, sampling was conducted within shallow (<4 m) back reef habitats on the leeward side of the reefs or islands.
Sampling was conducted over two consecutive years, in 2013 and 2014. In each year, sampling was conducted in November approximately 1-week prior to the predicted dates of spawning, following Tan et al. [8]. Only colonies where there were visible (pigmented) oocytes within the polyps from freshly broken branches or fragments were sampled. Where possible, we sampled 5 colonies of each species, from each location in each year (Table 1). For A. nasuta and A. spathulata, one entire branch was taken from the middle portion of each colony. For A. hyacinthus, which has only small vertical branchlets growing along horizontal radial branches, we removed sections of the colony necessary to obtain a fragment (from the inner portion of the colony, at least 5cm from the edge of the colony).
After collection, branches and fragments were individually fixed in 10% seawater formalin for a minimum of two months, before being decalcified using serial increasing concentrations (5–10%) of formic acid. Once decalcified, replicate (n = 6) polyps were selected and carefully dissected from each branch or fragment to quantify the number of oocytes. Only mature (larger) polyps, located outside the sterile zones (Wallace 1985), were selected, following Tan et al. [8]

2.2. Data Analyses

To explore spatial and temporal variation in fecundity (number of oocytes per polyp, which ranged from 1 to 17), we fitted General Linear Mixed Models (GLMM) using the nlme package (v. 3.1-128) in R (v. 3.3.2., [33]). Separate analyses were conducted for each species (A. hyacinthus, A. nasuta and A. spathulata). The full model included fixed effects of year (2 levels; 2013 and 2014) and shelf position (3 levels; inner-, mid- and outer-shelf). We compared between three alternative models; (i) Fecundity ~ Shelf, (ii) Fecundity ~ Year, and (iii) Fecundity ~ Shelf*Year), using second-order Akaike Information Criterion (AIC). In all cases, we included colony as a random effect (~1|Colony) to account for intra-colony differences in polyp-level fecundity.

3. Results

Reproductive colonies of all three species (Acropora hyacinthus, A. nasuta, and A. spathulata) were recorded from every shelf position (inner-, mid-, and outer-shelf) in both 2013 and 2014. In all, 6308 oocytes were counted across 1013 polyps, corresponding to a mean fecundity of 6.23 (±0.07 SE) oocytes per polyp across all species. All polyps sampled contained at least one oocyte. Average fecundity was higher for A. nasuta (7.94 oocytes per polyp ±0.15 SE), compared to A. hyacinthus (5.29 oocytes per polyp ±0.07 SE) and A. spathulata (5.33 oocytes per polyp ±0.07 SE).

3.1. Acropora Hyacinthus

For A. hyacinthus, fecundity ranged from 2–10 oocytes per polyp, though the mode was five and the majority of polyps (>83%) had 4–6 oocytes (Figure 2). The best fitting model (GLMM) to account for variation in fecundity of A. hyacinthus was a full model that included shelf and year (AICc = 1083.59, df = 8), as opposed to year (AICc = 1093.91, df = 4) or shelf (AICc = 1118.43, df = 5) alone. Fecundity was significantly lower in 2014 compared to 2013, but there was also significant variation with respect to shelf position (Table 2), though the pattern varied between years.
Inter-annual variation in fecundity of A. hyacinthus was most apparent at inner- and outer-shelf reefs (Figure 2). At inner-shelf reefs (in the Turtle Group), fecundity declined 18.66% from 5.80 (±0.19 SE) oocytes per polyp in 2013 to 4.71 (±0.17 SE) oocytes per polyp in 2014. Similarly, at offshore reefs (Hicks Reef and Day Reef), fecundity declined 17.41% from 5.80 (±0.21 SE) oocytes per polyp in 2013 to 4.71 (±0.12 SE) oocytes per polyp in 2014, whereas fecundity recorded at mid-shelf reefs (Lizard Island and MacGillivray Reef) was the same in 2013 (5.37 oocytes per polyp ±0.11 SE) and 2014 (5.37 oocytes per polyp ±0.17 SE).

3.2. Acropora Nasuta

The modal number of oocytes recorded for A. nasuta was six per polyp, though fecundity varied considerably more than the other two species, ranging from 1–17 oocytes per polyp (Figure 3), and most polyps (73%) had more than six oocytes. As for A. hyacinthus, the best fitting model (GLMM) to account for variation in fecundity of A. nasuta was the full model that included shelf and year (AICc = 1682.58, df = 8), as opposed to year (AICc = 1737.84, df = 4) or shelf (AICc = 1713.17, df = 5) alone. Overall fecundity was significantly lower in 2014 compared to 2013, but differences among shelf positions varied with year (Table 3).
In 2013, there was marked cross-shelf variation in fecundity of A. nasuta, where colonies sampled on inner shelf reefs (in the Turtle Group) had >40% higher fecundity (10.48 oocytes per polyp ±0.34 SE) compared to mid-shelf (7.32 oocytes per polyp ±0.32 SE) and outer-shelf reefs (7.20 oocytes per polyp ±0.27 SE). Between 2013 and 2014, overall fecundity of A. nasuta declined from 8.33 (±0.21 SE) oocytes per polyp in 2013 down to 7.53 (±0.21 SE) oocytes per polyp, with this decline being most pronounced on inner shelf reefs (Figure 3). The variance in fecundity recorded in 2014 was also higher than recorded in 2013, especially at mid-shelf reefs (Figure 3). In 2014, cross-shelf variation in fecundity of A. nasuta was much less pronounced though there were still significant differences fecundity between inner- and mid-, as well as between inner- and outer-shelf reefs (Table 3).

3.3. Acropora Spathulata

The modal number of oocytes recorded for A. spathulata was six per polyp (as for A. nasuta), though most polyps (79%) had 4–6 oocytes and very few polyps had >8 oocytes per polyp (Figure 4). As for other species (A. hyacinthus and A. nasuta), the best fitting model (GLMM) to account for variation in fecundity of A. spathulata was the full model that included shelf and year (AICc = 1026.09, df = 8), as opposed to year (AICc = 1059.29, df = 4) or shelf (AICc = 1064.64, df = 5) alone. Most notably, fecundity was significantly different between years, but was also significantly lower at mid-shelf and outer-shelf reefs, compared to the inner-shelf reefs (Table 4).
Fecundity of A. spathulata tended to be higher on inner-shelf reefs and decline with increasing distance offshore, however, these differences were not significant (Figure 4). Variability in fecundity was also generally higher on inner-shelf reefs. More apparent, however, were interannual declines in fecundity that occurred across all shelf positions. On the inner-shelf reef (Turtle Group) fecundity declined from 6.52 (±0.84 SE) oocytes per polyp in 2013 down to 5.10 (±0.93 SE) oocytes per polyp in 2014. This coincided with marked declines in the abundance of A. spathulata on inner shelf reefs, whereby we could not find any colonies of reproductive size at South Turtle Island in 2014. On mid-shelf reefs (Lizard Island and MacGillivray Reef) fecundity of A. spathulata declined from 5.40 (±0.70 SE) oocytes per polyp in 2013 down to 4.80 (±0.65 SE) oocytes per polyp in 2014. Similarly, on outer-shelf reefs (Hicks Reef and Day Reef) fecundity of A. spathulata declined from 5.33 (±0.69 SE) oocytes per polyp in 2013 down to 4.67 (±0.60 SE) oocytes per polyp in 2014.

4. Discussion

Although there were important inter-annual differences in patterns and rates of coral fecundity (discussed later), this study shows that fecundity of widespread branching coral species does vary with respect to the cross-shelf position of reefs. Contrary to expectations, the fecundity of all three species tended to decline with distance from shore. This was most obvious for A. nasuta in 2013, where fecundity of was >40% higher on inner-shelf reefs compared to mid-shelf or outer-shelf reefs (Figure 3). These findings are counter to widely held views that coral health and reef condition increases with increasing distance from shore. Similarly, Burn et al. [34] found that growth of corals was similar, if not higher, on inner-shelf reefs compared to mid-shelf and outer-shelf reefs in the central GBR. As such, increased levels of sedimentation, eutrophication and pollution, generally recorded on inner-shelf reefs [13,14], do not necessarily undermine the fitness (growth or fecundity) of established coral colonies [35]. There is nonetheless, generally lower cover of reef-building corals recorded on inner-shelf reefs compared to mid-shelf and outer-shelf reefs in the northern and central GBR [21]. It is possible therefore, that there are differential rates of coral survivorship (for recruits, juveniles, or adults) at inner-shelf versus mid-shelf or outer-shelf reefs, that drive observed differences in assemblage structure. Deterioration of environmental conditions at inner-shelf reefs might also restrict the range of habitats in which certain corals can persist [36,37], such that demographic comparisons among sites where focal coral species currently exist belie environmental constraints on the population viability and dynamics of corals in near shore environments.
In addition to cross-shelf differences in coral fecundity, this study also revealed inter-annual differences whereby fecundity was consistently and significantly lower in November 2014 compared to November 2013. While declines in coral fecundity recorded across the entire cross-shelf gradient might reflect inter-annual differences in environmental conditions (e.g., temperature), the occurrence of Tropical Cyclone Ita in April 2014 is the major event that distinguishes 2014 and 2013. Severe tropical storms (cyclones) have a major effect on the structure and dynamics of coral reef ecosystems [12,38,39]. Most notably, hydrodynamic forces generated by cyclones dislodge or destroy large erect coral colonies [40], leading to declines coral cover as well as corresponding loss of structural complexity. Even corals that withstand dislodgement can be injured or adversely affected by the deterioration of environmental conditions (e.g., extensive resuspension of sediments), leading to declines in growth or reproduction [12]. Baird et al. [12] recorded further declines in fecundity for three (out of four) coral species, including A. hyacinthus, at Lizard island between 2014 and 2015, coinciding with Cyclone Nathan (category 4) in 2015. Even more importantly, the carbon content of eggs collected from both Goniastrea retiformis and G. pectinia after Cyclone Nathan were 58–64% lower compared to eggs collected in 2014 [12], which was attributed to increased energetic allocation to tissue repair, thereby detracting from energy investment in reproduction [26,41]. Successive years of severe cyclones have had a profound effect on coral cover and composition, as well as subsequent coral recruitment, at Lizard Island [42,43], and are likely to have had similar effects at other nearby reefs. Cyclones typically remove the larger colonies in a population [12]. As larger colonies typically have higher fecundity [7], the differential loss of these colonies may have influenced reproductive output. Our study suggests that there might also be reductions in the fecundity of surviving colonies, which would further suppress reproductive output and recruitment [43].
Spatial and temporal variation in the fecundity of Acropora species, though significant, was relatively constrained. Most notably the modal number of oocytes per polyp was ≤6 across all three species, though A. nasuta exhibited much greater variation in fecundity than A. hyacinthus or A. spathulata. Similarly, Hall and Hughes [7] found limited interspecific variation in fecundity among Acropora species, where all four species (A. gemmifera, A. hyacinthus, A. millepora, and A. nana) had mean fecundity of 4.5–6.4 oocytes per polyp, compared to 2.6 (±0.2SE) oocytes per polyp for Stylophora pistillata and 46.0 (± 2.0SE) oocytes per polyp for Goniastrea retiformes. Tan et al. [8] sampled 164 colonies of A. millepora across inshore reefs on the GBR separated by hundreds of kilometers, and also found that the mean number of oocytes per polyp for reproductive colonies varied very little around the mean of 6 oocytes per polyp. These data suggest that fecundity of Acropora corals is evolutionarily or morphologically constrained, potentially limited by the small size of Acropora polyps [7] and/or the large size of Acropora eggs. Moreover, extensive intraspecific comparisons of polyp-level fecundity [5,8] reveal high levels of variability among sympatric colonies. Polyp level fecundity might not, therefore, be the best measure to test for spatial and temporal variation in the reproductive condition and fitness of Acropora corals, and measures of egg quality (e.g., carbon content of eggs) might give better insights into cross-shelf variation in the reproduction and population replenishment of these corals [12].

5. Conclusions

This study explored cross-shelf variation in the fecundity of three species of Acropora in the northern GBR. Contrary to expectations, coral fecundity was similar, if not higher, on inner-shelf reefs compared to mid-shelf or outer-shelf reefs. As such, low cover of scleractinian corals on inner-shelf reefs in the northern GBR, compared to mid-shelf and outer-shelf reefs [21] cannot be attributed to lower fecundity of individual coral colonies on near shore reefs, though there may be other constraints to reproductive output and settlement at these locations. Low cover of corals, and especially branching corals, on near shore reefs of the GBR might also be attributable to increased incidence of disturbances [44] or higher levels of chronic stress [45] that reduce survivorship of specific corals in these environments. Marked changes in structure and composition of coral and benthic assemblages along cross-shelf gradients are irrefutable [46], though further comparative studies on demographic processes and population dynamics are needed to understand such differences.

Author Contributions

Conceptualization and implementation, M.S.P., A.H.B. and A.S.H.; Data collection, M.S.P., A.S.H. and A.G.B.; Laboratory procedures, C.-H.T., C.-Y.K. and R.K.; Analyses, M.S.P.; Resources, M.S.P., A.H.B. and A.S.H.; Writing-Original Draft Preparation, M.S.P.; Writing-Review & Editing, A.G.B., A.S.H. and A.H.B.

Funding

This research was funded through the Australian Research Council award to the ARC Centre of Excellence for Coral Reef Studies [CE14010002], and an Australian Research Council Discovery Early Career Researcher Award to A.S.H. [DE130100688]. R.K. and the Summer Research Program for Science Teachers was supported by the Ambrose Monell Foundation, New York, NY, USA.

Acknowledgments

The authors acknowledge the staff at Lizard Island Research Station for ongoing and exceptional logistical support.

Conflicts of Interest

The authors declare no conflict of interest.

References

  1. Hughes, T.P. Recruitment limitation, mortality, and population regulation in open systems: A case study. Ecology 1990, 71, 12–20. [Google Scholar] [CrossRef]
  2. Baird, A.H.; Marshall, P.A. Mortality, growth and reproduction in scleractinian corals following bleaching on the Great Barrier Reef. Mar. Ecol. Prog. Ser. 2002, 237, 133–141. [Google Scholar] [CrossRef] [Green Version]
  3. Palmer, C.V.; Baird, A.H. Tumor-like growths induce an immune response and reduce fitness in a common reef-building coral. Dis. Aquat. Org. 2018, 130, 77–81. [Google Scholar] [CrossRef] [PubMed]
  4. Babcock, R.C. Comparative demography of three species of scleractinian corals using age-and size-dependent classifications. Ecol. Monogr. 1991, 61, 225–244. [Google Scholar] [CrossRef]
  5. Hughes, T.P.; Baird, A.H.; Dinsdale, E.A.; Moltschaniwskyj, N.A.; Pratchett, M.S.; Tanner, J.E.; Willis, B.L. Supply-side ecology works both ways: The link between benthic adults, fecundity, and larval recruits. Ecology 2000, 81, 2241–2249. [Google Scholar] [CrossRef]
  6. Hall, V.R.; Hughes, T.P. Reproductive strategies of modular organisms: Comparative studies of reef-building corals. Ecology 1996, 77, 950–963. [Google Scholar] [CrossRef]
  7. Alvarez-Noriega, M.; Baird, A.H.; Dornelas, M.; Madin, J.S.; Cumbo, V.R.; Connolly, S.R. Fecundity and the demographic strategies of coral morphologies. Ecology 2016, 97, 3485–3493. [Google Scholar] [CrossRef] [Green Version]
  8. Tan, C.H.; Pratchett, M.S.; Bay, L.K.; Graham, E.M.; Baird, A.H. Spatial and temporal variation in fecundity among populations of Acropora millepora on the Great Barrier Reef. Mar. Ecol. Prog. Ser. 2016, 561, 147–153. [Google Scholar] [CrossRef]
  9. Tanner, J.E. Interspecific competition reduces fitness in scleractinian corals. J. Exp. Mar. Biol. Ecol. 1997, 214, 19–34. [Google Scholar] [CrossRef]
  10. Wallace, C.C. Reproduction, recruitment and fragmentation in nine sympatric species of the coral genus Acropora. Mar. Biol. 1985, 88, 217–233. [Google Scholar] [CrossRef]
  11. Michalek-Wagner, K.; Willis, B.L. Impacts of bleaching on the soft coral Lobophytum compactum. II. Biochemical changes in adults and their eggs. Coral Reefs 2001, 19, 240–246. [Google Scholar] [CrossRef]
  12. Baird, A.H.; Álvarez-Noriega, M.; Cumbo, V.R.; Connolly, S.R.; Dornelas, M.; Madin, J.S. Effects of tropical storms on the demography of reef corals. Mar. Ecol. Prog. Ser. 2018, 606, 29–38. [Google Scholar] [CrossRef]
  13. Hughes, T.P.; Day, J.C.; Brodie, J. Securing the future of the Great Barrier Reef. Nat. Clim. Chang. 2015, 5, 508–511. [Google Scholar] [CrossRef]
  14. Kroon, F.J.; Thorburn, P.; Schaffelke, B.; Whitten, S. Towards protecting the Great Barrier Reef from land-based pollution. Glob. Chang. Biol. 2016, 22, 1985–2002. [Google Scholar] [CrossRef] [Green Version]
  15. Roff, G.; Clark, T.R.; Reymond, C.E.; Zhao, J.X.; Feng, Y.; McCook, L.J.; Done, T.J.; Pandolfi, J.M. Palaeoecological evidence of a historical collapse of corals at Pelorus Island, inshore Great Barrier Reef, following European settlement. Proc. R. Soc. B 2013, 280, 20122100. [Google Scholar] [CrossRef] [PubMed]
  16. Pratchett, M.S.; Bridge, T.C.; Brodie, J.; Cameron, D.S.; Day, J.C.; Emslie, M.J.; Grech, A.; Hamann, M.; Heron, S.F.; Hoey, A.S.; et al. Australia’s Great Barrier Reef. In World Seas: An Environmental Evaluation; Academic Press: Cambridge, MA, USA, 2013; pp. 333–362. [Google Scholar]
  17. Anthony, K.R.; Fabricius, K.E. Shifting roles of heterotrophy and autotrophy in coral energetics under varying turbidity. J. Exp. Mar. Biol. Ecol. 2000, 252, 221–253. [Google Scholar] [CrossRef]
  18. Anthony, K.R. Enhanced energy status of corals on coastal, high-turbidity reefs. Mar. Ecol. Prog. Ser. 2006, 319, 111–116. [Google Scholar] [CrossRef] [Green Version]
  19. Dodge, R.E.; Vaisnys, J.R. Coral populations and growth patterns: Responses to sedimentation and turbidity associated with dredging. J. Mar. Sci. 1977, 35, 715–730. [Google Scholar]
  20. Kojis, B.L.; Quinn, N.J. Seasonal and depth variation in fecundity of Acropora palifera at two reefs in Papua New Guinea. Coral Reefs 1984, 3, 165–172. [Google Scholar] [CrossRef]
  21. Wismer, S.; Hoey, A.S.; Bellwood, D.R. Cross-shelf benthic community structure on the Great Barrier Reef: Relationships between macroalgal cover and herbivore biomass. Mar. Ecol. Prog. Ser. 2009, 376, 45–54. [Google Scholar] [CrossRef]
  22. Hoey, A.S.; Bellwood, D.R. Cross-shelf variation in browsing intensity on the Great Barrier Reef. Coral Reefs 2010, 29, 499–508. [Google Scholar] [CrossRef]
  23. Dikou, A.; Van Woesik, R. Survival under chronic stress from sediment load: Spatial patterns of hard coral communities in the southern islands of Singapore. Mar. Pollut. Bull. 2006, 52, 1340–1354. [Google Scholar] [CrossRef] [PubMed]
  24. Bauman, A.G.; Hoey, A.S.; Dunshea, G.; Feary, D.A.; Low, J.; Todd, P.A. Macroalgal browsing on a heavily degraded, urbanized equatorial reef system. Sci. Rep. 2017, 7, 8352. [Google Scholar] [CrossRef] [Green Version]
  25. Foster, N.L.; Box, S.J.; Mumby, P.J. Competitive effects of macroalgae on the fecundity of the reef-building coral Montastraea annularis. Mar. Ecol. Prog. Ser. 2008, 367, 143–152. [Google Scholar] [CrossRef]
  26. Tanner, J.E. Competition between scleractinian corals and macroalgae: An experimental investigation of coral growth, survival and reproduction. J. Exp. Mar. Biol. Ecol. 1995, 190, 151–168. [Google Scholar] [CrossRef]
  27. Rasher, D.B.; Hay, M.E. Chemically rich seaweeds poison corals when not controlled by herbivores. Proc. Natl. Acad. Sci. USA 2010, 107, 9683–9688. [Google Scholar] [CrossRef] [PubMed] [Green Version]
  28. Clements, C.S.; Rasher, D.B.; Hoey, A.S.; Bonito, V.E.; Hay, M.E. Spatial and temporal limits of coral-macroalgal competition: The negative impacts of macroalgal density, proximity, and history of contact. Mar. Ecol. Prog. Ser. 2018, 586, 11–20. [Google Scholar] [CrossRef] [PubMed]
  29. Hoogenboom, M.O.; Connolly, S.R. Defining fundamental niche dimensions of corals: Synergistic effects of colony size, light, and flow. Ecology 2009, 90, 767–780. [Google Scholar] [CrossRef]
  30. Fabricius, K.E. Effects of terrestrial runoff on the ecology of corals and coral reefs: Review and synthesis. Mar. Pol. Bull. 2005, 50, 125–146. [Google Scholar] [CrossRef] [PubMed]
  31. Weber, M.; De Beer, D.; Lott, C.; Polerecky, L.; Kohls, K.; Abed, R.M.; Ferdelman, T.G.; Fabricius, K.E. Mechanisms of damage to corals exposed to sedimentation. Proc. Natl. Acad. Sci. USA 2012, 109, E1558–E1567. [Google Scholar] [CrossRef] [Green Version]
  32. Sammarco, P.W. Geographically specific recruitment and postsettlement mortality as influences on coral communities: The cross-continental shelf transplant experiment. Limnol. Oceanogr. 1991, 36, 496–514. [Google Scholar] [CrossRef]
  33. R Core Team. R: A Language and Environment for Statistical Computing; R Foundation for Statistical Computing: Vienna, Austria, 2014. [Google Scholar]
  34. Burn, D.; Pratchett, M.; Heron, S.; Thompson, C.; Pratchett, D.; Hoey, A. Limited Cross-Shelf Variation in the Growth of Three Branching Corals on Australia’s Great Barrier Reef. Diversity 2018, 10, 122. [Google Scholar] [CrossRef]
  35. Morgan, K.M.; Perry, C.T.; Smithers, S.G.; Johnson, J.A.; Daniell, J.J. Evidence of extensive reef development and high coral cover in nearshore environments: Implications for understanding coral adaptation in turbid settings. Sci. Rep. 2016, 6, 29616. [Google Scholar] [CrossRef] [PubMed]
  36. Browne, N.K.; Smithers, S.G.; Perry, C.T. Spatial and temporal variations in turbidity on two inshore turbid reefs on the Great Barrier Reef, Australia. Coral Reefs 2013, 32, 195–210. [Google Scholar] [CrossRef]
  37. Johns, K.A.; Emslie, M.J.; Hoey, A.S.; Osborne, K.; Jonker, M.J.; Cheal, A.J. Macroalgal feedbacks and substrate properties maintain a coral reef regime shift. Ecosphere 2018, 9, e02349. [Google Scholar] [CrossRef]
  38. Halford, A.; Cheal, A.J.; Ryan, D.; Williams, D.M. Resilience to large-scale disturbance in coral and fish assemblages on the Great Barrier Reef. Ecology 2004, 85, 1892–1905. [Google Scholar] [CrossRef]
  39. Torda, G.; Sambrook, K.; Cross, P.; Sato, Y.; Bourne, D.G.; Lukoschek, V.; Hill, T.; Jorda, G.T.; Moya, A.; Willis, B.L. Decadal erosion of coral assemblages by multiple disturbances in the Palm Islands, central Great Barrier Reef. Sci. Rep. 2018, 8, 11885. [Google Scholar] [CrossRef]
  40. Madin, J.S.; Connolly, S.R. Ecological consequences of major hydrodynamic disturbances on coral reefs. Nature 2006, 444, 477–480. [Google Scholar] [CrossRef]
  41. Rinkevich, B.; Loya, Y. Intraspecific competition in a reef coral: Effects on growth and reproduction. Oecologia 1985, 66, 100–105. [Google Scholar] [CrossRef] [PubMed]
  42. Madin, J.S.; Baird, A.H.; Bridge, T.C.; Connolly, S.R.; Zawada, K.J.; Dornelas, M. Cumulative effects of cyclones and bleaching on coral cover and species richness at Lizard Island. Mar. Ecol. Prog. Ser. 2018, 604, 263–268. [Google Scholar] [CrossRef]
  43. Hughes, T.P.; Kerry, J.T.; Baird, A.H.; Connolly, S.R.; Chase, T.J.; Dietzel, A.; Hill, T.; Hoey, A.S.; Hoogenboom, M.O.; Jacobson, M.; et al. Global warming impairs stock-recruitment dynamics of corals. Nature 2019. [Google Scholar] [CrossRef] [PubMed]
  44. Thompson, A.A.; Dolman, A.M. Coral bleaching: One disturbance too many for near-shore reefs of the Great Barrier Reef. Coral Reefs 2010, 29, 637–648. [Google Scholar] [CrossRef]
  45. Thompson, A.; Schroeder, T.; Brando, V.E.; Schaffelke, B. Coral community responses to declining water quality: Whitsunday Islands, Great Barrier Reef, Australia. Coral Reefs 2014, 33, 923–938. [Google Scholar] [CrossRef] [Green Version]
  46. Doszpot, N.E.; McWilliam, M.J.; Pratchett, M.S.; Hoey, A.S.; Figueira, W.F. Plasticity in three-dimensional geometry of branching corals along a cross-shelf cradient. Diversity 2019, 11, 44. [Google Scholar] [CrossRef]
Figure 1. Reefs in the central section of Australia’s Great Barrier Reef used to explore cross-shelf variation in the growth of three species of branching corals. (a) Sampling location; (b) specific locations of three species of branching corals.
Diversity 11 00060 g001
Figure 2. Fecundity (no. oocytes per polyp) for Acropora hyacinthus, showing (a) overall frequency distribution of number of oocytes per polyp and (b) variation between years and among shelf positions.
Diversity 11 00060 g002
Figure 3. Fecundity (no. oocytes per polyp) for Acropora nasuta, showing (a) overall frequency distribution of number of oocytes per polyp and (b) variation between years and among shelf positions.
Diversity 11 00060 g003
Figure 4. Fecundity (no. oocytes per polyp) for Acropora spathulata, showing (a) overall frequency distribution of number of oocytes per polyp and (b) variation between years and among shelf positions.
Diversity 11 00060 g004
Table 1. Number of colonies sampled at each location in each year, and the relative position of locations used to assess cross-shelf variation in coral fecundity.
LocationDistance OffshoreA. hyacinthusA. nasutaA. spathulataTotal
201320142013201420132014
Turtle South12 km55555025
Turtle North15 km42555526
Lizard30 km55555429
MacGillivray34 km55545529
Day50 km55555530
Hicks51 km55555530
TOTAL 292730293024169
Table 2. General Linear Mixed Models (GLMM) summary for Acropora hyacinthus, based on best fitting model: Fecundity ~ Shelf * Year. Significant effects (p < 0.05) shown in bold.
CoefficientEstimateSEp
Intercept (inner-shelf 2013)2351.37494.96<0.01
Shelf (mid-shelf)−2419.19660.58<0.01
Shelf (outer-shelf)−366.27659.490.57
Year (2014)−1.650.25<0.01
Shelf (mid-shelf): Year (2014)1.210.32<0.01
Shelf (outer-shelf): Year (2104)0.180.320.57
Table 3. GLMM summary for Acropora nasuta, based on best fitting model: Fecundity ~ Shelf * Year. Significant effects (p < 0.05) shown in bold.
CoefficientEstimateSEp
Intercept (inner-shelf 2013)5646.88932.03<0.01
Shelf (mid-shelf)−6788.741337.45<0.01
Shelf (outer-shelf−5270.631318.10<0.01
Year (2014)−2.8100.46<0.01
Shelf (mid-shelf): Year (2014)3.370.66<0.01
Shelf (outer-shelf): Year (2104)2.620.65<0.01
Table 4. GLMM summary for Acropora spathulata, based on best fitting model: Fecundity ~ Shelf * Year. Significant effects (p < 0.05) shown in bold.
CoefficientEstimateSEp
Intercept (inner-shelf 2013)2858.27191.99<0.01
Shelf (mid-shelf)−1770.71255.02<0.01
Shelf (outer-shelf−1510.93252.990.02
Year (2014)−1.420.26<0.01
Shelf (mid-shelf): Year (2014)0.880.33<0.01
Shelf (outer-shelf): Year (2104)0.750.330.02

