Article

Predicting Leaf Trait Variability as a Functional Descriptor of the Effect of Climate Change in Three Perennial Grasses

Laboratory of Ecosystems and Biodiversity in Arid Land of Tunisia (LEBIOMAT), University of Sfax, Faculty of Sciences, Sfax 3000, Tunisia
*
Author to whom correspondence should be addressed.
Diversity 2019, 11(12), 233; https://doi.org/10.3390/d11120233
Submission received: 21 September 2019 / Revised: 24 October 2019 / Accepted: 8 November 2019 / Published: 6 December 2019
(This article belongs to the Section Plant Diversity)

Abstract

:
Aims of the study: The most important trends of the current climate variability is the scarcity of rains that affects arid ecosystems. The aim of this study was to explore the variability of leaf functional traits by which grassland species survive and resist drought and to investigate the potential link between resource use efficiency and water scarcity resistance strategies of species. Methods: Three grasses (Cenchrus ciliaris (C4), Stipa parviflora and Stipa lagascae (C3)) were established in a randomized block consisting of eleven replications. The seedlings were kept under increasing levels of water stress. In addition to their functional leaf traits, the rate of water loss and dimensional shrinkage were also measured. Key Results: Thicker and denser leaves, with higher dry matter contents, low specific leaf area and great capacity of water retention are considered among the grasses’ strategies of dehydration avoidance. Significant differences between the means of the functional traits were obtained. Furthermore, strong correlations among leaf traits were also detected (Spearman’s r exceeding 0.8). Conclusions: The results provide evidence that the studied grasses respond differently to drought by exhibiting a range of interspecific functional strategies that may ameliorate the resilience of grassland species communities under extreme drought events.

1. Introduction

Arid land species communities are deeply dependent on soil hydrological balance and likely influenced by climate variability. The probable changes in forage species community’s composition and distribution are the results of the enhanced drying out and the extended water shortage of the arid lands. Thus, drought, being a major limiting resource, has become a serious environmental threat that makes the conservation and the protection of arid lands a serious challenge [1]. The impact of water deficiency on arid ecosystem components depends essentially on species composition, their ability to resist, to cope and to survive, and their interspecific competitiveness [2]. Grass species develop deep modifications of their morphological and physiological functional traits that may be helpful to establish the proxies for reconstructing paleoclimates or predicting climate variability [3]. In fact, 87% of studied species have revealed deep shifts in leaf phenology and a total vanishing in their initial morphological characteristics [4]. Thereby, the changes of the grassland species traits according to severity and duration of exposure to drought may be crucial to their survival and productivity [5]. Grass species are often the most abundant in arid and semi-arid regions due to high-stress tolerance efficiency, superior intra-specific competitiveness, and great plant community stability [6,7].
These species exposed to drought have developed a series of morpho-structural adaptations strategies, which confer great efficiency and tolerance. A low water status may cause reductions in physiological and morphological grasses functional traits, such as specific leaf area, length, width, number of leaves, and the relative water content, and accelerate leaf senescence [3]. The shrinking of the grass leaf area is a consequence of decreasing the size of the younger leaves and the inhibition of the expansion of foliage [8]. Thereby, leaf characteristics play a key role in grassland species resistance and survival by determining the transpiration and photosynthesis rates [9]. Leaves are the most suitable indicator of plant water status, due to their significant contribution in species growth and yield. Consequently, focusing attention on leaf characteristics for the knowledge of the resistance strategies seems to be very important for selecting the species that may sustain during drought periods [10]. Thus, a deep understanding of the relationship between drought and grass leaf traits is a key to the selection and the utilization of the most suitable drought-resistant species. In this context, research allied to grass response to drought is becoming increasingly important to understand the functioning of the whole grass steppes, which are in regression [11]. It is now well known that the extent of drought resistance differs among species in almost all arid land species. Further, it could be a good tool to set up a restoration program in order to prevent the degradation and regression of these ecosystems, which are the principal factor behind the desertification of arid lands.
In North Africa, grass species constitute an essential element to fight against desertification [12]. The choice of species was based on a good representation of species to chamaephytic steppes. Le Houérou [13] found that chamaephytic steppes are dominated by palatable perennial grasses such as Stipa lagascae, Stipa parviflora, Stipagrostis ciliata, and Cenchrus ciliaris. In this study, we select three Poaceae species: Cenchrus ciliaris L., Stipa parviflora Desf. and Stipa lagascae R. & Sch. (C3 and C4) for a comparative investigation of drought tolerance strategies using a comprehensive analysis of leaf traits under controlled environmental conditions. Understanding these species functional traits expression helps to discover plant resources use strategies in arid steppes face to drought condition and their chance to survive under the future climate change. Hence, we addressed the following questions: (i) Which of the three grasses have the capacity for drought tolerance under different water stress levels? (ii) What are the possible different responses of the C3 and the C4 species and what is the magnitude of their aptitude of adaptation to different levels of water availability? (iii) To what extent can these species survive the future climate conditions?

2. Materials and Methods

2.1. Approach to Field Study & Sample Collection

The study experiment was carried out in a common garden in the forest nursery of Sfax, located in the Southern cost of Tunisia. The GPS coordinates are: 34°43′40″ N, 10°43′40″ E). The climate in this area is lower arid Mediterranean with a mean annual temperature of 19.0 °C and mean annual rainfall of 212 mm. The average minimum temperature of the coldest month (January) is 6 °C, and the average maximum temperature of the hottest month (August) is 35 °C.
Field measurements were taken in stands of three species belonging to Poaceae family: Stipa parviflora Desf., Stipa lagascae Roem. & Sch. and Cenchrus ciliaris L. in an experimental plot at the research station. Seeds of the three species used in this study were collected from different regions in Tunisian South (Table 1) and were randomly selected from different mother plants.
After harvesting, only intact and mature seeds were selected to be planted in plastic pots (32 cm high, 15 cm diameter), 44 pots per species obtaining in total 132 pots. The soil contained 3/4 sand, 1/4 peat and it was well watered until saturation. Five seeds were sown per pot at the beginning of October 2016, as the germination success is relatively low for Stipa species [14,15]. The experiment was factorial in the base of complete randomized design with eleven replications per water stress treatment (Table 2). After emergence, only one seedling was selected for the experimental design. The experiment was carried out during October 2017.
Eleven one-year old seedlings were sampled per water stress treatment from the experimental plot (Table 2); 5 leaves were taken from each pot for leaf functional trait measurements (55 leaves for each treatment and 220 leaves for each species, in total 660 leaves). Leaves were taken from the top of the plant to avoid self-shading. For excised leaf water loss (ELWL), a total of seven seedlings per treatment with three leaves in each seedling were used (Ntotal = 21 leaves). Five seedlings per treatment with three leaves in each seedling (Ntotal = 15 leaves) were measured for dimensional leaf shrinkage.

2.2. Watering Regimes & Morphological Measurements

After an acclimation period, which lasted for 6 months enabling the necessary root growth, the seedlings were subjected to water stress treatments (eleven pots per stress type). Drought stress was achieved by irrigation by determined quantities for the three grasses (Table 2). The seedlings were divided into four groups according to a north-south rainfall gradient of species occurrence.
The water stress treatments were defined by a differential water supply selected according to the environmental condition in arid and Saharan steppes where precipitation is well below 200 mm/year [13]. Thereafter, seedlings were irrigated at weekly intervals according to the water stress treatment applied (Table 2).
Seedlings were selected and grouped (almost the same seedlings size) for the application of the same water stress treatment, in order to eliminate the morphological variations. Leaf area was measured with the image J software. Linear measurements were taken with a digital caliper. Leaf traits were determined according to Pérez-Harguindeguy, et al. [16]. After getting the fresh weight of the leaves which were put in plastic bags just after excision to prevent the loss of water, they were dipped in distilled water for 24 h at 4 °C in order to obtain the maximum fresh weight. The leaf dry matter contents (LDMC) were calculated as the ratio between leaf dry mass and maximum fresh mass. Samples were oven-dried at 60 °C for at least two days, and their dry weights were determined. The Specific leaf area (SLA) was expressed as the ratio of leaf area to leaf dry mass. Leaf thickness (Lth) was estimated according to Vile, et al. [17]. Detailed information on the morphological parameters is given in Table 3.

2.3. Statistical Analysis

A one-way analysis of variance (ANOVA test) was used to test the differences among different water availability treatments in each trait, and a Tukey test at p < 0.05 was applied to check for differences among the different groups. Two-way analyses of variance were made to determine the effects of water stress treatments, species and their interactions for the different functional traits, on the one hand, and to test species and leaf moisture content (LMC) differences and their interaction for shrinkage lengthwise, shrinkage widthwise, shrinkage thicknesswise and area shrinkage, on the other hand. A mixed-model multivariate analysis of variance (MANOVA) was used to examine patterns of species differences in relation with water treatments and different hours post-excision and their interactions. We used a Sperman correlation analysis to establish the relationships among the different measured leaf traits. Sperman rank correlation was also sought to test the relationship between leaf area and thickness shrinkage and the different leaf functional traits. Only correlations that are significant at p < 0.05 were considered. Data were log- transformed to improve homoscedasticity and normality when necessary. All statistical analyses were done with the XLSTAT software 2016 (Addinsoft SARL, New York, NY, USA) in Microsoft Excel™ 2013.

3. Results

3.1. Species-specific Variability
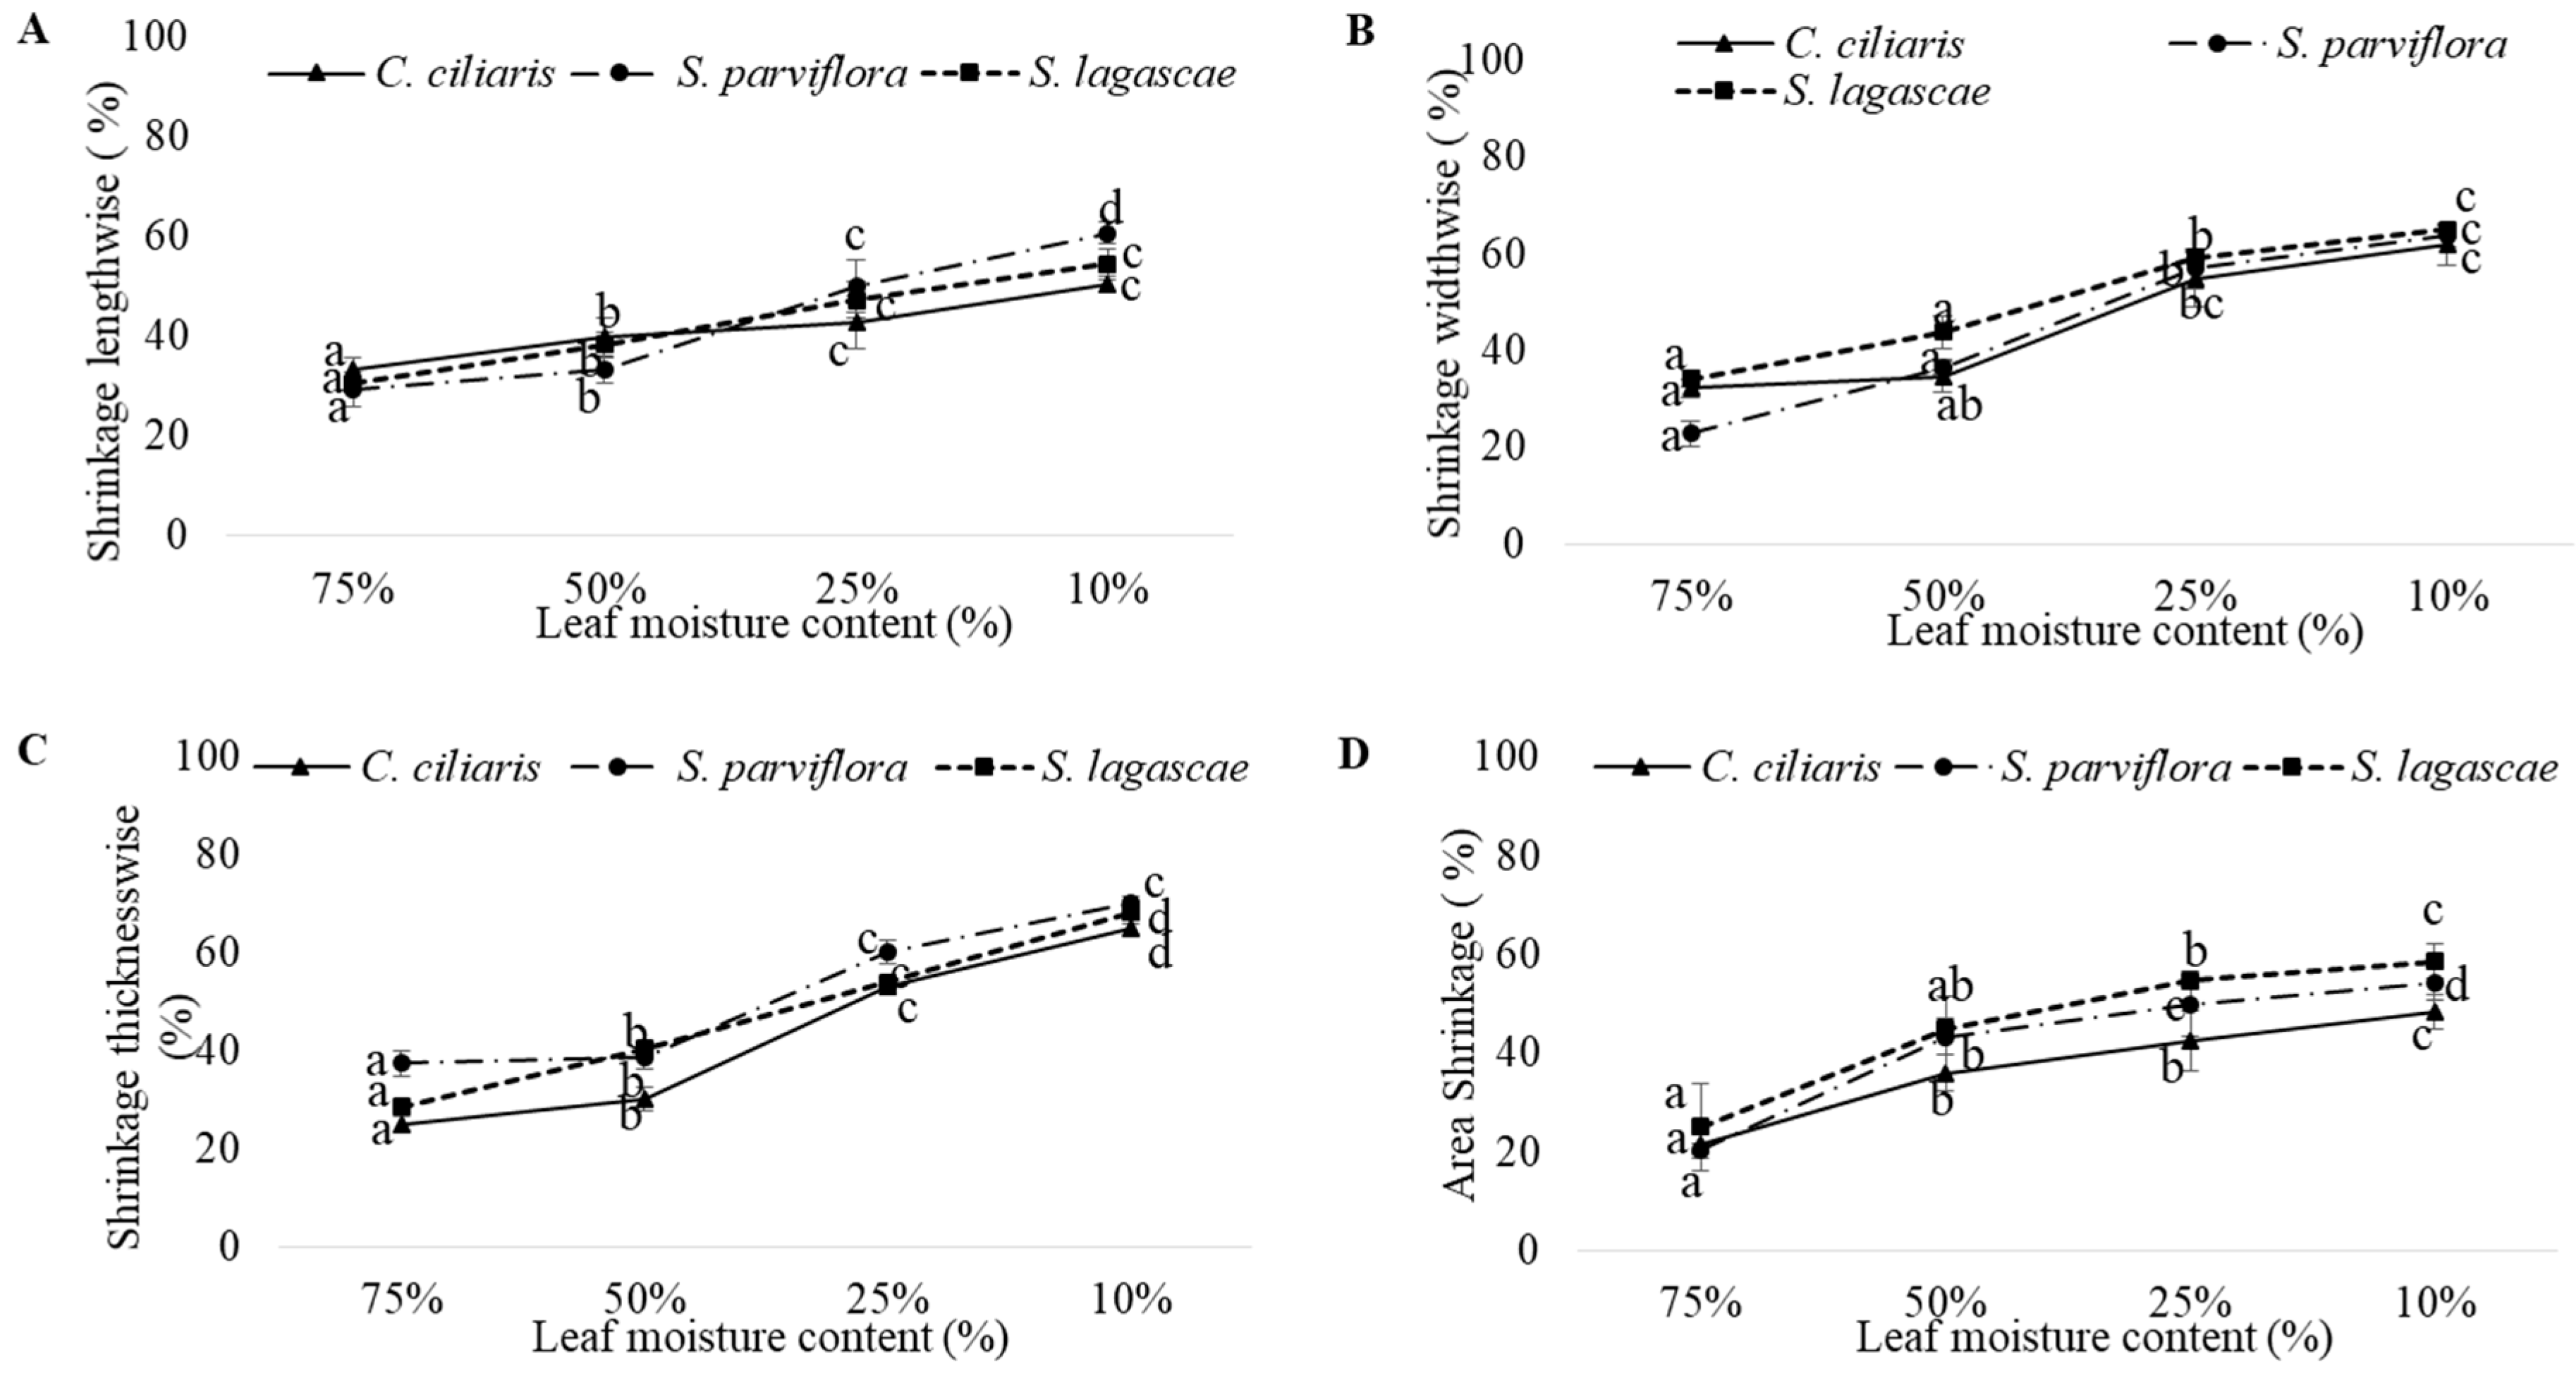
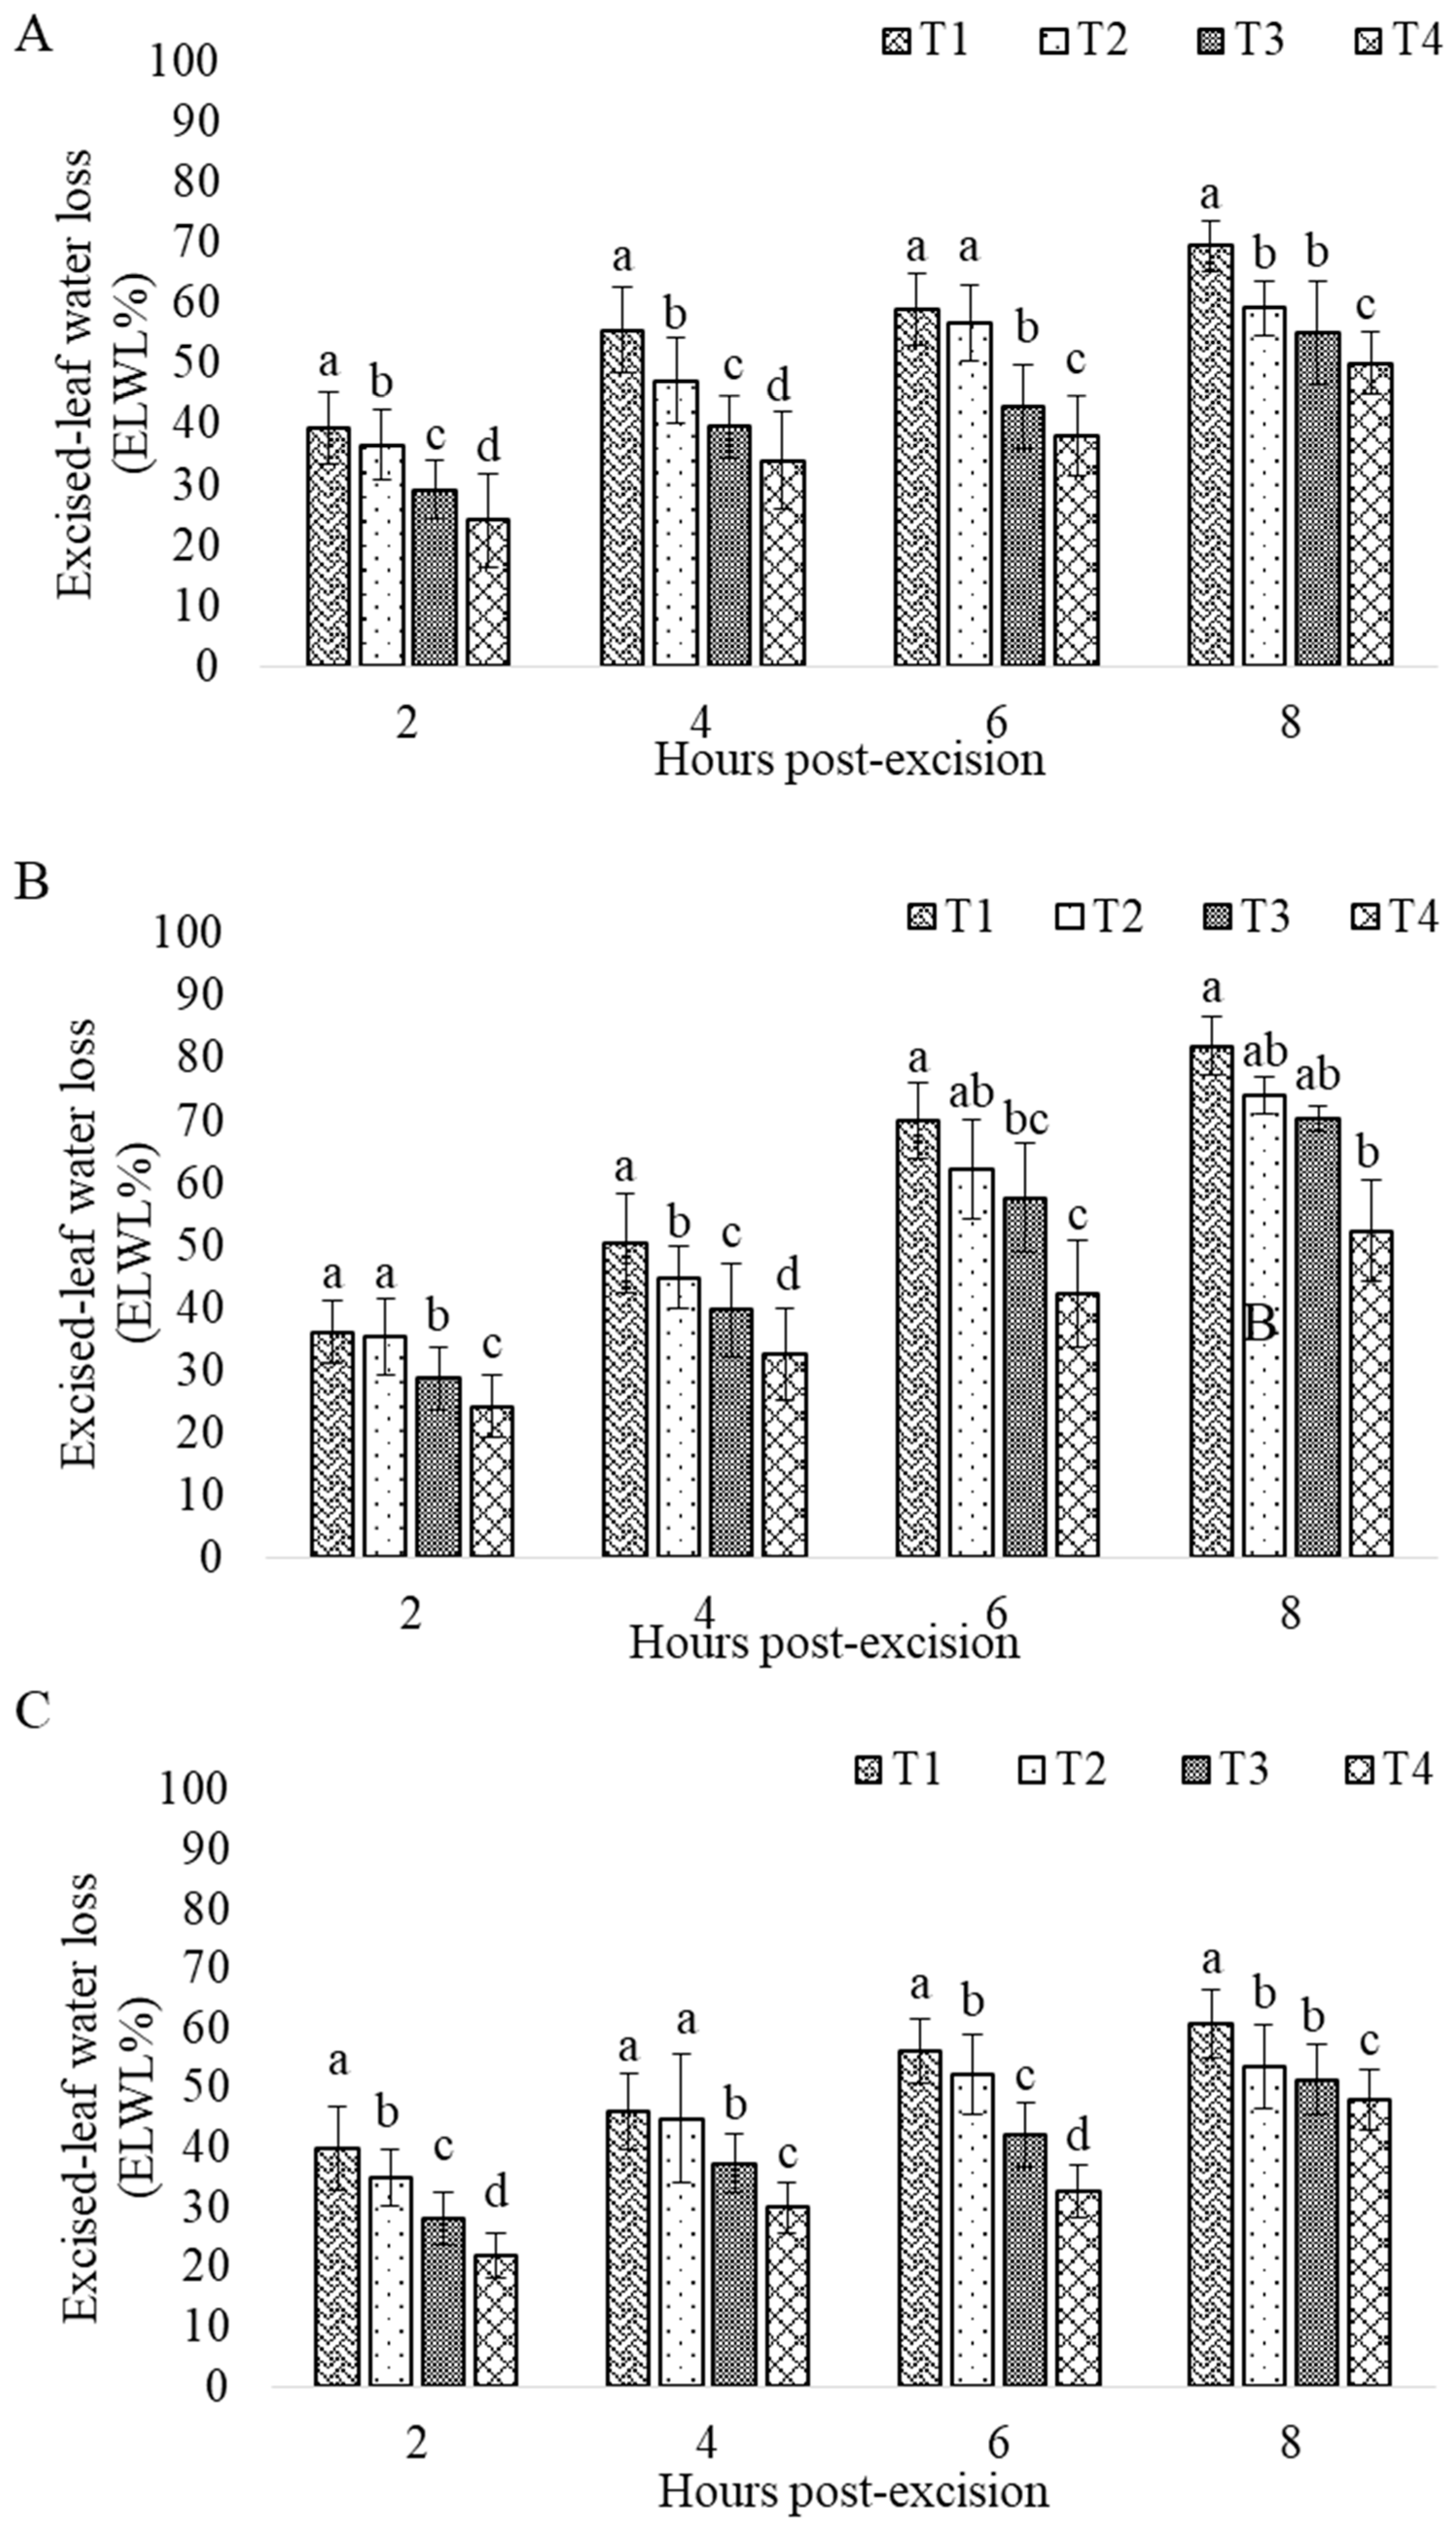
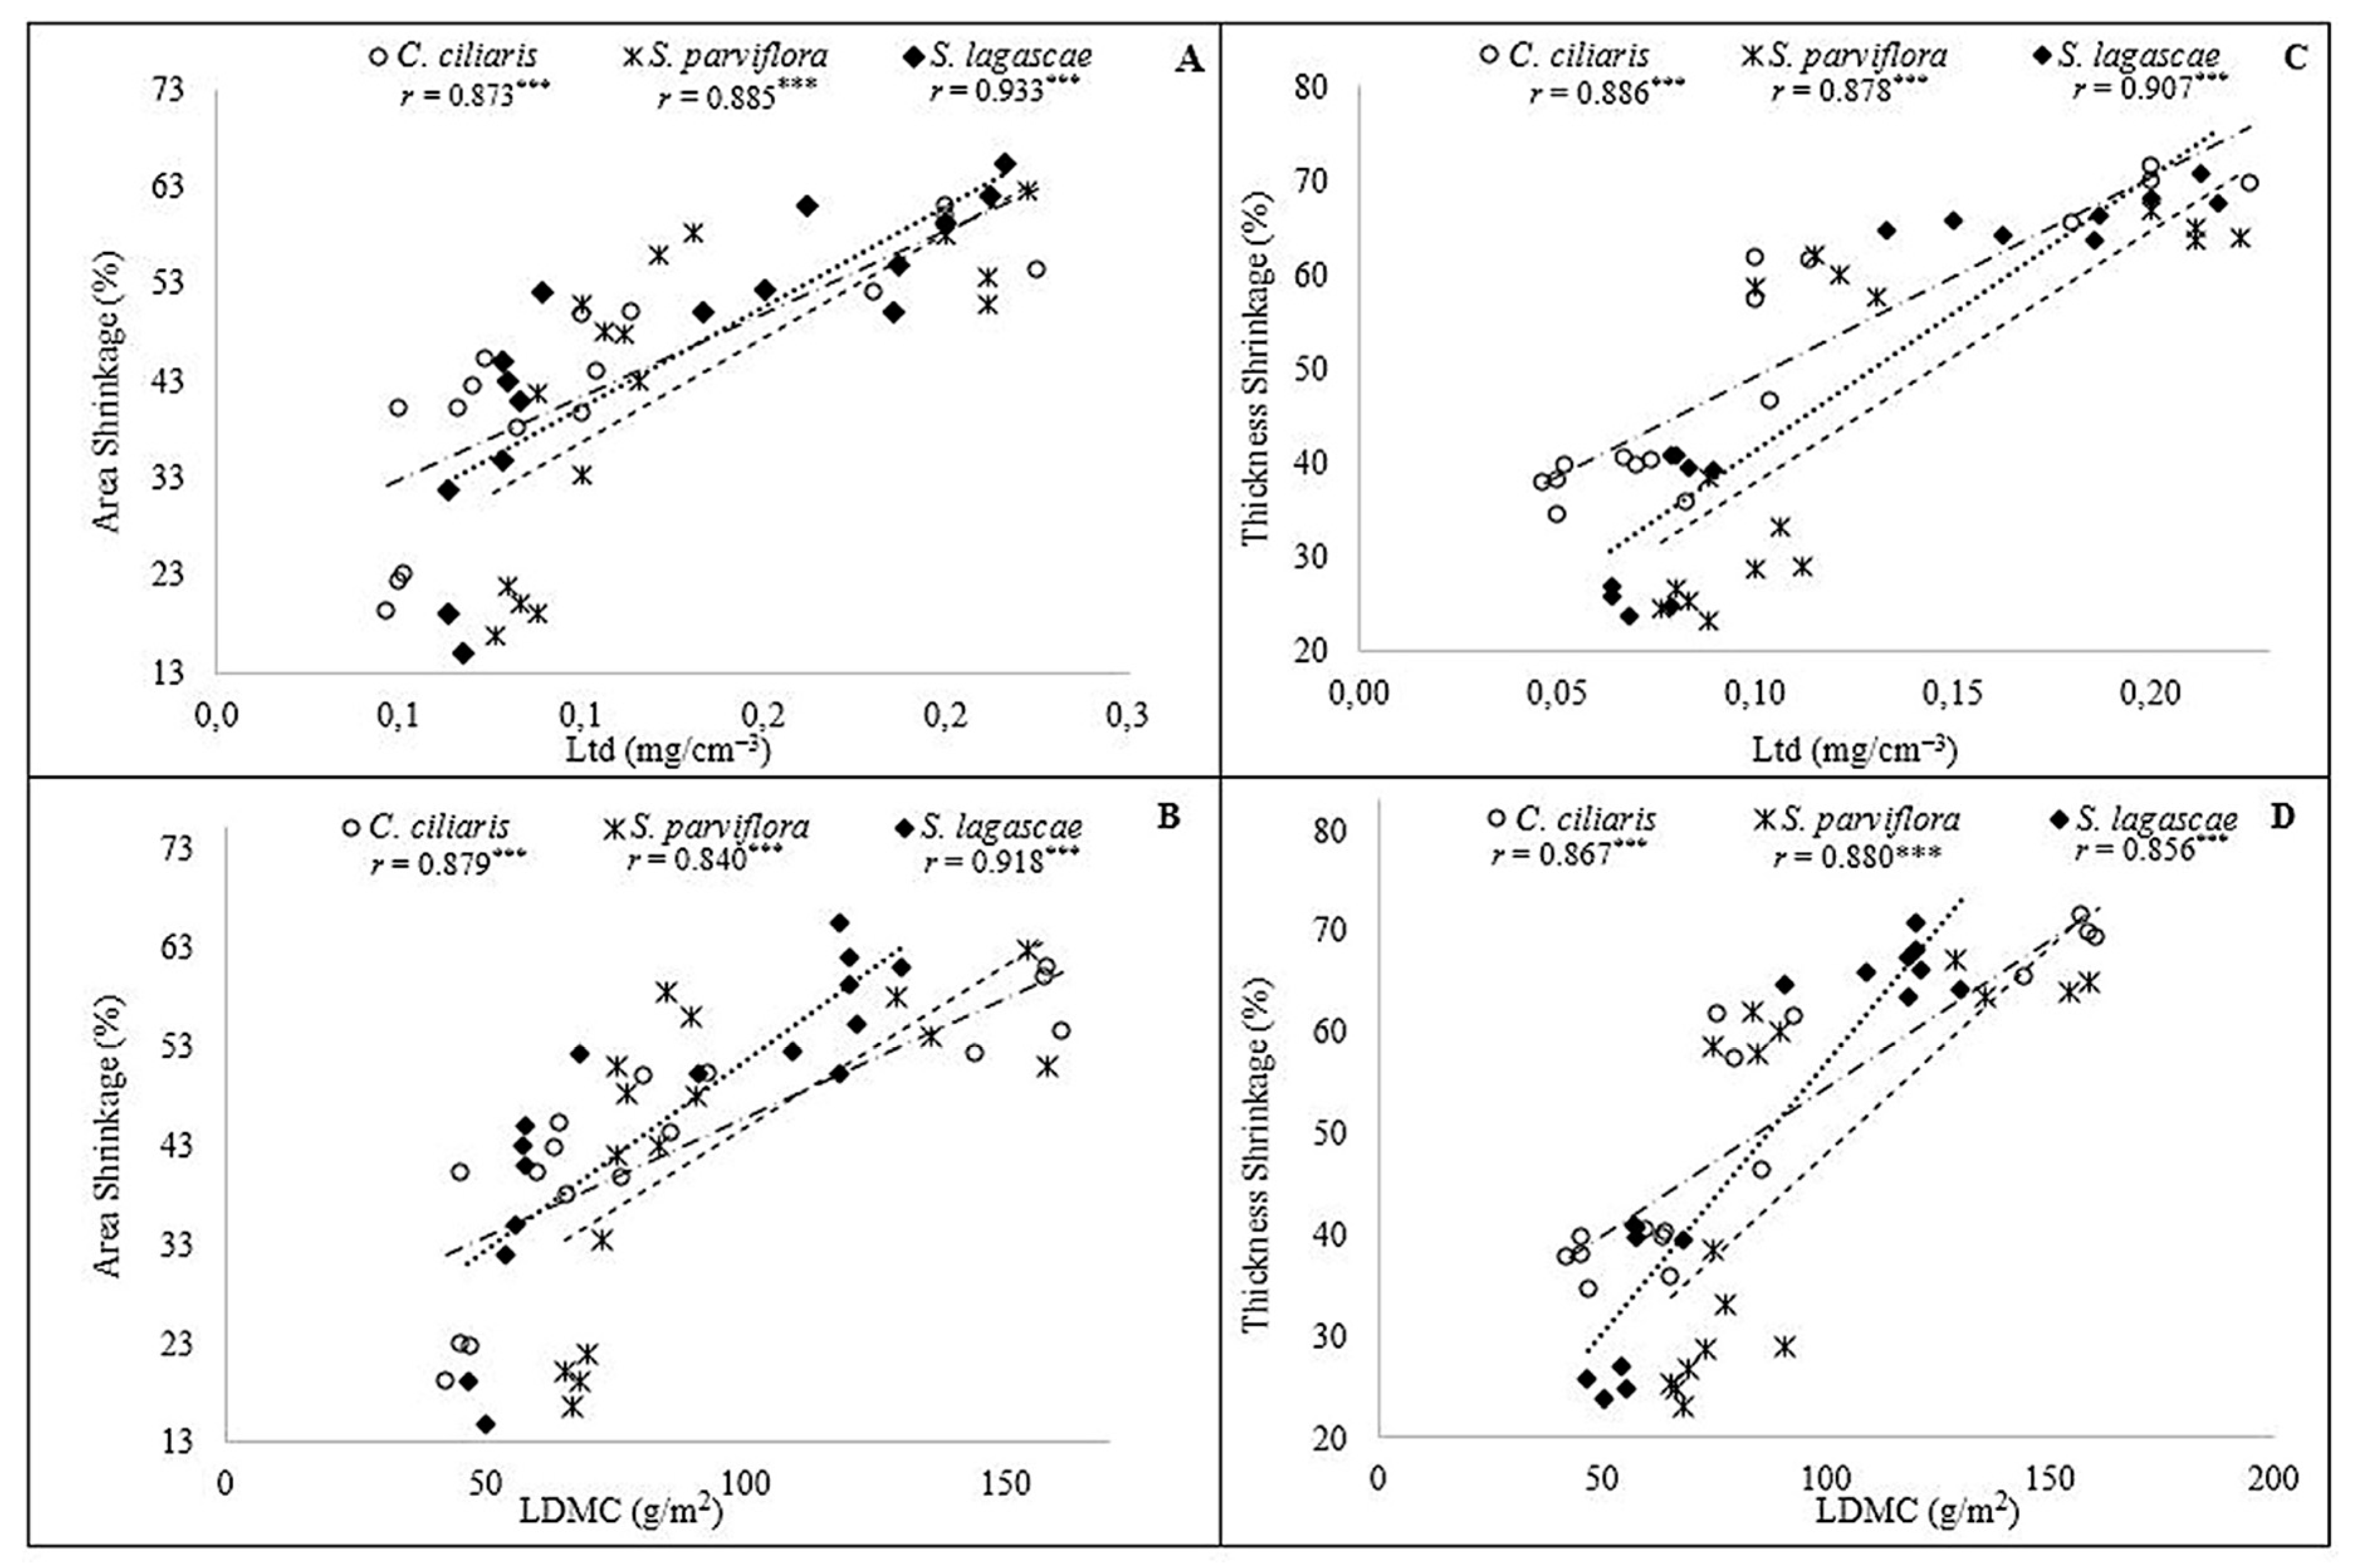
The analysis of all the parameters of the three kinds of grass showed a high variability in their responses to water deficit and exhibited different degrees of leaf trait changes (Table 4). The characteristics of the leaf structure showed wide-ranging values which were already confirmed by the results of the Two-way ANOVA analysis (Table 5).
Compared to S. lagascae and S. parviflora, C. ciliaris demonstrated great drought stress resistance via high leaf thickness (Lth = 164 µm), high leaf dry matter content (LDMC = 155 g/m2) and high leaf tissue density (Ltd = 0.25 mg/cm−3). The idea of the species variability was also confirmed by the leaf relative water content (RWC) data of S. parviflora and S. lagascae, which were constantly about 62% and 53%, respectively, compared to C. ciliaris, which maintained a great leaf moisture content (73%) in the most limiting water resource conditions (T4). Furthermore, among all water availability treatments (T1, T2 and T3), C. ciliaris maintained the best leaf relative water content (RWC). C. ciliaris also revealed a great specific leaf area (SLA = 30 cm2/g1) compared to the two Stipa species. The analysis of these functional traits of the studied species revealed variable adaptive capacities and different drought resistance strategies.
The results proved an interesting relationship between the functional leaf traits of the three grasses (Table 6). The specific leaf area revealed a highly significant negative correlation with the LDMC, especially C. ciliaris with Spearman’s coefficient equal to −0.99 and p-values < 0.0001 compared to S. parviflora and S. lagascae with Spearman’s coefficients equal to −0.91, −0.92 and p-values < 0.0001, respectively. Positive correlations between the SLA, Ltd and RWC were also unveiled with Spearman’s coefficients exceeding 0.8 and p-values < 0.0001. For C. ciliaris, S. parviflora and S. lagascae, the LDMC and the Lth disclosed significant negative correlations with the RWC and the leaf tissue density Ltd (p-values < 0.01, for the three species).
The excised-leaf water loss (ELWL %) varied strongly across the three grasses (p < 0.0001) (Figure 1 and Table 7). Likewise, significant discrepancies were observed between the different water stress treatments and the different hours post-excision (Figure 1). The interaction between species, water stress treatments and hours post-excision also showed significant differences (p < 0.05). Only species and treatment interaction did not represent significant effect (Table 7; p > 0.05).
The evolution of leaf dimensional shrinkage in the direction of length (A), width (B), thickness (C) and area (D) according to leaf moisture content is shown in Figure 2. Overall, leaves became more shrunk in response to water loss. The leaf moisture content (LMC) exhibited a higher effect in leaf dimensional shrinkage (Table 8; p < 0.0001). In the three grasses, the leaf shrinkage was globally more visible thicknesswise than in the other directions. In fact, the three species adopt the same behavior for leaf dimensional shrinkage as no significant differences were found among species except for shrinkage thicknesswise (Table 8). The highest thickness shrinkage values were recorded in S. parviflora (70.33%). Otherwise, the lowest values belonged to C. ciliaris (65.11%) and S. lagascae (68.33%). Shrinkages widthwise were almost equal in the three grasses but did not exceed 66%. In the lengthwise, the leaves of C. ciliaris (50.5%) and S. lagascae (54.5%) retracted least, whilst generally S. parviflora leaves shrunk most (66.77%). Area Shrinkage was almost equal in S. lagascae (58.6%) and S. parviflora (54.2%) except in C. ciliaris (48.4%).
In order to assess how well the relationship between leaf shrinkage and leaf functional traits can be described using a monotonic function, we resorted to Spearman correlations. The results were similar in magnitude, revealing a strong relationship between the three grasses leaf shrinkage and their functional traits especially those are related to water storage and that are related the most to drought tolerance (Figure 3). This was especially true for the Area Shrinkage correlations with the Ltd (Figure 3A), and LDMC (Figure 3B) which was highly significant with Spearman’s coefficients exceeding 0.8 and p-values < 0.0001 for the three grasses. In the same context, the three species also disclosed a strong correlation between the Thickness Shrinkage, Ltd (Figure 3C) and LDMC (Figure 3D) with Spearman’s coefficients exceeding 0.85 and p-values < 0.0001.
The highest correlation values between Ltd, Area and thickness shrinkage were recorded in S. lagascae with Spearman’s coefficients exceeding 0.9. In the same context, the highest Spearman’s coefficients were recorded in S. lagascae revealing perfect correlation between LDMC and area shrinkage. In contrast, thickness shrinkage revealed a strong correlation with LDMC in S. parviflora with Spearman’s coefficients equal to 0.88. Over all, Correlations linking leaf size and function revealed strong dependency relationships.

3.2. Drought Impact

At any watering level, water deficiency led to a significant change in the number of green and senescent leaves (p < 0.0001) (Table 4). Thus, drought negatively affected the rate of leaves RWC (p < 0.0001) and the highest values were recorded in the most irrigated C. ciliaris seedlings (T1). In other words, the lowest RWC were recorded in the most stressed seedlings (T4) recording 27%; 36% to 38%, respectively for C. ciliaris, S. parviflora and S. lagascae. In the same context, grasses responded significantly negatively to drought by decreasing their SLA. The lowest values were recorded in the fourth treatment for the three grasses and dropped below 30 cm2/g−1 for the two C3 grasses except for C. ciliaris (SLA = 35 cm2/g−1) (Table 4). The depressive effect of drought on the different functional traits were significant for the three species (Table 5). The LDMC, Lth, and Ltd of the three grasses were perfectly negatively correlated with the water supply (Table 4). We noticed that, in C. ciliaris, the thickest leaves were remarkable in the most stressed seedlings (164.62 µm at T4) compared to those of S. lagasce (139.13 µm at T4) and S. parviflora (152.85 µm at T4).
The same pattern was highlighted in C. ciliaris Ltd which increased markedly by about 0.251 mg/cm−3 in the stressed seedlings compared to the well-watered plants. In contrast, The Ltd in S. lagascae and S. parviflora did not exceed (0.21 mg/cm3 at T4). Furthermore, LDMC increased rapidly and was always greater in water-stressed than in well-watered seedlings. The highest LDMC was recorded in C. ciliaris water-stressed seedlings by about 155.04 g/m2 at T4 compared with the values already recorded in S. lagascae and S. parviflora that did not exceed 146 g/m2. The same tendency of water supply dependence was clearly noticeable on the ELWL. The excited leaves of the well-watered seedlings (T1) of C. ciliaris started to lose their moisture slightly faster (40% 2 h post-excision) than the C3 S. lagascae (39% 2 h post-excision) and S. parviflora (36% 2 h post-excision). But the rate of leaf moisture loss became slower at C. ciliaris by about 60.7% compared to S. lagascae and S. parviflora leaves that respectively exceeded 80% and 69% at 8 h post-excision (Figure 1). Contrarily, the excised leaves of the most stressed seedlings (T4) showed a significant capacity of water retention particularly in C. ciliaris excised leaves which decreased their water loss by about 47.97% comparing to S. lagascae and S. parviflora that exceeded 50% 8 h post-excision.
As feedback to the water loss, the grass leaves shrunk. This shrinkage was more visible in leaf thickness than in the other parameters (Figure 2). The lowest thickness shrinkage values were recorded in C. ciliaris. However, higher values were recorded in S. parviflora and S. lagascae leaves. In addition, the shrinkages lengthwise in C. ciliaris, S. lagascae and S. parviflora leaves (at 10% moisture content: 50.5%, 54.53% and 60%, respectively) was affected by shrinking slightly less than shrinkages widthwise for the three species (at 10% moisture content: 61.8%, 65.10% and 63.9% respectively). In the area shrinkage, the leaves of C. ciliaris were the samples that retracted the least compared to S. lagascae and S. parviflora leaves.

4. Discussion

Species functional traits are often used to discern the intraspecific variability in growth, resources allocation, and resistance strategies under arduous environmental conditions to reflect plant economics and competitiveness. Thus, based on our results, grassland species functional traits can be used to discern the adaptation strategies and the variance of the species responses to drought. C. ciliaris, S. parviflora and S. lagascae biological link connecting their ecophysiology and the environmental factors helps to draw several important estimations about how grassland species will react to climatic changes.
Large variations were found to occur in several leaf traits in three Poaceae from arid steppe in North Africa. The different Poaceae showed different leaf trait expressions in relation with water availability. Species showed significant differences among all the analyzed parameters. This result highlights the different plant strategies to resist the drought stress in arid regions. In fact, species reacted differently in response to increasing water stress conditions (Table 3). All the species changed their traits expression and decreased activity to adapt with low water availability. Previous studies in these three species showed similar trait variations and activity decrease under imposed drought stress [20,21,22,23]. The decrease of activity was clearly observed by the decrease of above-ground biomass of these three species with increasing drought intensity. In fact, a significant reduction in the leaf length (LL), width (LW), number of green leaves per tiller (NGL/T) and per seedling (NGL/S) and increase in the number of senescent leaves per tiller (NSL/T) and per seedling (NSL/S) confirm our hypothesis. The inhibition of leaf growth was the first response to water deficit, resulting from the high sensitivity of foliar expansion to water stress [24]. Our findings are consistent with Xu, et al. [25] who reported that growth inhibition eventually results in a reduction in aboveground biomass and plants allocate more biomass to roots to increase water uptake after soil drying. According to the optimal allocation theory, plants should allocate resources to the organ that acquires the most resource, and often limits growth [26]. Hence, the three Poaceae probably limit above ground biomass and allocate resources in the underground biomass to increase their survival chances by seeking water. Further, the reduction in above-ground biomass production under drought might be due to various factors such as decreased rate of photosynthesis [27], disturbed assimilate partitioning [28], or poor flag leaf development [29]. For Stipa species, Krichen, et al. [30] found that below and above-ground functional traits in S. tenacissima seedlings showed an interesting relationship which reinforces the relevance of trait co-variations. These authors, [30], discovered that Stipa followed the ‘optimal allocation theory’ as a strategy of resource management. However, C. ciliaris maintained better leaf traits expression during stress. This advantage was explained by [31,32] who asserted that partial closure of stomata to conserve water in arid and saline soils or dry atmospheric conditions has been hypothesized to select for the C4 pathway via indirect effects on photosynthetic efficiency.
ELWL and RWC are commonly used to measure plant drought tolerance [33]. In the current study, ELWL and RWC served to measure the drought tolerance of three Poaceae species. Maximum ELWL was very fast during the first 2 h of excision and then water was slowly lost to 8 h. The ELWL ranged between 21.6–60.7% in C. ciliaris, 24.18–82 % in S. parviflora, and 24.08–69.52% for T4 and T1, respectively. Several studies, [34,35], combined the reduction in leaf water loss by leaf rolling in a range of 46–83% for xerophytic grasses. The first treatment showed the highest ELWL in comparison with the other treatments. The difference between water loss treatments was different because of the differential rate in stomatal closure [36]. The ELWL of C. ciliaris after 8 h (60.7%) was lower than that of S. lagascae and S. parviflora (Figure 1), with mean values of 69.52% and 82%, respectively. This result may be due in part to a better control of C4 species to water loss as their stomata are more responsive to environmental changes than are the stomata of C3 [37]. C. ciliaris also showed better control of ELWL in relation with treatment and time. In this regard, Pirasteh-Anosheh, et al. [38] discovered that the major factor of leaf water loss is the diffusion of water as vapor via the micro pores of the stomatal complex. Hence, species that adapt a high diffusive resistance under stress have better resistance to drought conditions in arid lands. Best-adapted species transpire more than others when moisture stress is least but inhibit moisture loss more when stress is severe [35].
Leaf relative water content (RWC) is considered as a major indicator of water status than other water potential parameters under drought conditions, as it is a reliable parameter for quantifying the plant-drought response [39]. The study of the RWC proved that plants under stress have a lower capacity to maintain their moister content. We note that RWC varied markedly as a function of applied irrigation water (T1–T4, Table 3). A decrease in RWC in response to water deficit had been reported in several studies [22,40,41,42]. As a practical proof, Siddiqui, et al. [42] observed that the RWC of Halopyrum mucronatum and Cenchrus ciliaris reduced under drought conditions. Additionally, Stipa purpurea and Stipa lagascae showed lower leaf water retention and rehydration capacity in drought conditions [22,41]. The reduction of RWC in S. lagascae was higher (21%) than in C. ciliaris (17%) and S. parviflora (17.5%). Accordingly, Boughalleb, et al. [22] found that drought considerably reduced RWC in S. lagascae to about 28%. Hence, it can be suggested that C. ciliaris has a better drought tolerance through the maintenance of higher water content in leaf under drought. The study of several plants proved that the RWC and the tolerance of the plants to stress are directly related [43,44,45]. Furthermore, our study showed an interesting relationship of RWC with leaf traits (SLA, LDMC and Lth) in the three Poaceae species (Table 6, p < 0.01).
The analysis of leaf functional traits determines the accumulation of plant biomass, choice of growth strategy and ability to capture and utilize resources [43,46]. Variation in SLA depends on changes in leaf tissue density, RWC and leaf dry matter content (LDMC) [47,48,49]. This relationship is significantly proved for the three Poaceae (p < 0.001). Furthermore, SLA and RWC decreased in relation with increasing aridity. In this regard, Cunningham, et al. [50] discovered that along nutrient and water availability gradients in south-east Australia, SLA and RWC decreased and Lth increased with decreasing resource availability. Canavar, et al. [51] found that higher leaf thickness is mainly due to a highly negative relationship with RWC, under drought stress condition. Further, the high SLA and low LDMC observed in the three species depict a low resource utilization rate in arid environment [52,53]. C. ciliaris has different ways of adapting to environment compared to the other two measured species as it displayed better SLA and LDMC values and correlations. SLA fluctuation reflects plant sensibility to change in habitat condition as it reflects a plant nutrition uptake strategy and represents its ability to replay the resources that plants obtain [9,49]. Moreover, the LDMC represents the plants’ ability to use particular environmental resources and reflects how much material is used to build up leaves [49]. Hence, the leaf traits, especially LDMC and SLA, reflect the plant resource utilization efficiency and show the integrated utilization ability of plants [49]. In this regard, Krichen, et al. [30] found that SLA in Stipa tenacissima is related to plant productivity and plant development under mild environmental conditions which means low sclerophylly index and less resistance to drought.
Leaf shrinkage provides insights into the potential variation of foliar surface area-to-volume ratio, within the same species, when leaf moisture content is changed in response to water deficit [54]. Tang and Boyer [55] defined shrinkage as a natural occurrence resulting from water loss that diminishes cell size. In our study, leaf shrinkage undertakes a combination of dimensional shrinkages following four dimensions of the leaf (thickness, width, length and area). The result reveals that leaf shrinkage in their four-dimension declines with increasing moister rate in all the studied species. Also, the three Poaceae species showed almost the same shrinkage dimensional response in all the moister content values. Kadioglu and Terzi [56] explained that the bulliform cells, which are located in the upper epidermis of the leaf near the midrib, cause rolling in some Poaceae species that shrink in response to drought and then the leaves roll. In addition, some grasses, such as Stipa tenacissima, reduce transpiration as much as 46% to 63% by rolling [56,57,58]. Stipa tenacissima leaf is tightly folded and gas exchange is restricted when the RWC reaches 73 % [58]. Fast leaf rolling decreases the effective leaf area and transpiration, which may be a reliable plant strategy for drought-avoidance in arid areas [35].
The analysis of the correlation between the area and thickness shrinkage and leaf traits revealed important results. The Ltd increased with increasing area and thickness shrinkage. Nawazish, et al. [20] found that the leaf water contents were strongly and negatively correlated with leaf density variations in the thickness of leaf laminas. The association between leaf density and area shrinkage may be explained as denser leaves have thinner laminas and smaller cells in all the tissues [20,59]. The variations in the thickness of leaf laminas were related with volumes per leaf area of all the tissue layers, mainly those of both parenchymata [20,59]. This relationship is also proved by the correlation observed in LDMC, considered as a surrogate of leaf density [48], with area and thickness shrinkage. In fact, higher LDMC is associated with higher area and thickness shrinkage.
In conclusion, we analyzed the leaf functional traits variability of C. ciliaris, S. lagascae and S. parviflora. The three grasses showed a wide range of leaf morphological variation partly due to the drought stress. The three Poaceae proved a higher adaptation to drought through the leaf trait expression. In fact, leaves become denser, thicker, and smaller and rolled in response to low water availability. Further, they tend to limit above ground biomass and probably allocate resources in the underground biomass to increase their survival chances by seeking water. C. ciliaris showed a great tolerance to environmental stress by its capacity to maintain relative water content and its higher leaf traits expression. However, the leaf traits varied according to water availability level. This species was proved still not ready yet to endure the fast and brutal change expected in the future climate scenario. Future hypotheses should elucidate intraspecific functional leaf traits variability and the magnitude of plastic responses in order to evaluate precisely the ecological behavior of the grassland species under the effect of climate change.
Finally, in response to our study aims, C. ciliaris, as a C4 species, has a better resistance to drought condition and represents a higher aptitude of response to the soil water stress in comparison with C3 species (S. lagascae and S. parviflora). Despite the better adaptation capacity of C. ciliaris, the studied species could be subjected to harsh climatic conditions that affect their productivity and survival chances to the predicted climate change, especially in the arid and Saharan regions.

Author Contributions

Conceptualization, M.C.; Investigation, M.H. and K.K.

Funding

This research received no external funding.

Conflicts of Interest

The authors declare no conflicts of interest.

References

  1. Hooke, J.; Sandercock, P. (Eds.) Combating Desertification and Land Degradation; Springer: Cham, Switzerland, 2017. [Google Scholar]
  2. Shinoda, M.; Nachinshonhor, G.U.; Nemoto, M. Impact of drought on vegetation dynamics of the Mongolian steppe: A field experiment. J. Arid Environ. 2010, 74, 63–69. [Google Scholar] [CrossRef]
  3. Wellstein, C.; Poschlod, P.; Gohlke, A.; Chelli, S.; Campetella, G.; Rosbakh, S.; Canullo, R.; Kreyling, J.; Jentsch, A.; Beierkuhnlein, C. Effects of extreme drought on specific leaf area of grassland species: A meta-analysis of experimental studies in temperate and sub-Mediterranean systems. Glob. Chang. Biol. 2017, 23, 2473–2481. [Google Scholar] [CrossRef] [PubMed]
  4. Morin, X.; Lechowicz, M.J.; Augspurger, C.; O’keefe, J.; Viner, D.; Chuine, I. Leaf phenology in 22 North American tree species during the 21st century. Glob. Chang. Biol. 2009, 15, 961–975. [Google Scholar] [CrossRef]
  5. Tucker, S.S.; Craine, J.M.; Nippert, J.B. Physiological drought tolerance and the structuring of tallgrass prairie assemblages. Ecosphere 2011, 2, 1–19. [Google Scholar] [CrossRef]
  6. McGlone, C.M.; Sieg, C.H.; Kolb, T.E.; Nietupsky, T. Established native perennial grasses out-compete an invasive annual grass regardless of soil water and nutrient availability. Plant Ecol. 2012, 213, 445–457. [Google Scholar] [CrossRef]
  7. Norton, M.R.; Malinowski, D.P.; Volaire, F. Plant drought survival under climate change and strategies to improve perennial grasses. A review. Agron. Sustain. Dev. 2016, 36, 29. [Google Scholar] [CrossRef] [Green Version]
  8. Fazlioglu, F.; Bonser, S.P. Phenotypic plasticity and specialization in clonal versus non-clonal plants: A data synthesis. Acta Oecologica 2016, 77, 193–200. [Google Scholar] [CrossRef]
  9. Cornelissen, J.H.C.; Lavorel, S.; Garnier, E.; Díaz, S.; Buchmann, N.; Gurvich, D.E.; Reich, P.B.; Ter Steege, H.; Morgan, H.D.; Van Der Heijden, M.G.A.; et al. A handbook of protocols for standardised and easy measurement of plant functional traits worldwide. Aust. J. Bot. 2003, 51, 335–380. [Google Scholar] [CrossRef] [Green Version]
  10. Dengler, N.G.; Taylor, W.C. Developmental Aspects of C4 Photosynthesis; Springer: Dordrecht, The Netherlands, 2000; pp. 471–495. [Google Scholar]
  11. Petit, J.R.; Mourner, L.; Jouzel, J.; Korotkevich, Y.S.; Kotlyakov, V.I.; Lorius, C. Palaeoclimatological and chronological implications of the Vostok core dust record. Nature 1990, 343, 56–58. [Google Scholar] [CrossRef]
  12. Benaouda, Z.; Mehdadi, Z.; Bouchaour, I. Influence pédoclimatique sur l’évolution des formations forestières en zone semi-aride (cas de la forêt de Tenira, Ouest algérien). Sécheresse 2005, 16, 115–120. [Google Scholar]
  13. Le Houérou, H. La végétation de la Tunisie steppique: Structure, écologie, sociologie, répartition, évolution, utilisation, biomasse, productivité (avec référence aux végétations analogues d’Algérie, de Libye et du Maroc). Ann. Inst. Nat. Rech. Agro. Tu. 1969, 42, 622. [Google Scholar]
  14. Krichen, K.; Ben Mariem, H.; Chaieb, M. Ecophysiological requirements on seed germination of a Mediterranean perennial grass (Stipa tenacissima L.) under controlled temperatures and water stress. S. Afr. J. Bot. 2014, 94, 210–217. [Google Scholar] [CrossRef] [Green Version]
  15. Krichen, K.; Vilagrosa, A.; Chaieb, M. Environmental factors that limit Stipa tenacissima L. germination and establishment in Mediterranean arid ecosystems in a climate variability context. Acta Physiol. Plant. 2017, 39. [Google Scholar] [CrossRef]
  16. Pérez-Harguindeguy, N.; Díaz, S.; Garnier, E.; Lavorel, S.; Poorter, H.; Jaureguiberry, P.; Bret-Harte, A.; Cornwell, W.K.; Craine, J.M.; Gurvich, D.E.; et al. New handbook for standardised measurement of plant functional traits worldwide. Aust. J. Bot. 2013, 167–234. [Google Scholar] [CrossRef]
  17. Vile, D.; Garnier, E.; Shipley, B.; Laurent, G.; Navas, M.-L.; Roumet, C.; Lavorel, S.; Díaz, S.; Hodgson, J.G.; Lloret, F.; et al. Specific leaf area and dry matter content estimate thickness in laminar leaves. Ann. Bot. 2005, 96, 1129–1136. [Google Scholar] [CrossRef] [PubMed]
  18. Hiziroglu, S. Dimensional Changes in Wood; Oklahoma State University: Stillwater, OK, USA, 2007. [Google Scholar] [CrossRef]
  19. Westoby, M.; Falster, D.S.; Moles, A.T.; Vesk, P.A.; Wright, I.J. Plant Ecological Strategies: Some Leading Dimensions of Variation between Species. Annu. Rev. Ecol. Syst. 2002, 33, 125–159. [Google Scholar] [CrossRef] [Green Version]
  20. Nawazish, S.; Hameed, M.; Naurin, S. Leaf anatomical adaptations of Cenchrus ciliaris L. from the salt range, Pakistan against drought stress. Pakistan J. Bot. 2006, 38, 1723–1730. [Google Scholar]
  21. Jorge, M.; Wouw, M.; Hanson, J. Characterisation of a collection of buffel grass. Trop. Grassl. 2008, 42, 27–39. [Google Scholar]
  22. Boughalleb, F.; Abdellaoui, R.; Hadded, Z.; Neffati, M. Anatomical adaptations of the desert species Stipa lagascae against drought stress. Biologia 2015, 70, 1042–1052. [Google Scholar] [CrossRef]
  23. Abdellaoui, R.; Boughalleb, F.; Hadded, Z. Etude de quelques critères adaptatifs de Stipa lagascae vis-à-vis du déficit hydrique. J. New Sci. 2016, 15, 1350–1359. [Google Scholar]
  24. Du, N.; Guo, W.; Zhang, X.; Wang, R. Morphological and physiological responses of Vitex negundo L. var. heterophylla (Franch.) Rehd. to drought stress. Acta Physiol. Plant. 2010, 32, 839–848. [Google Scholar] [CrossRef]
  25. Xu, B.; Li, F.; Shan, L.; Ma, Y.; Ichizen, N.; Huang, J. Gas exchange, biomass partition, and water relationships of three grass seedlings under water stress. Weed Biol. Manag. 2006, 6, 79–88. [Google Scholar] [CrossRef]
  26. Bloom, A.J.; Chapin, F.S.; Mooney, H.A. Resource Limitation in Plants-An Economic Analogy. Annu. Rev. Ecol. Syst. 1985, 16, 363–392. [Google Scholar] [CrossRef]
  27. Flexas, J.; Bota, J.; Loreto, F.; Cornic, G.; Sharkey, T.D. Diffusive and Metabolic Limitations to Photosynthesis under Drought and Salinity in C3 Plants. Plant Biol. 2004, 6, 269–279. [Google Scholar] [CrossRef] [PubMed]
  28. Farooq, M.; Wahid, A.; Kobayashi, N.; Fujita, D.; Basra, S.M.A. Plant drought stress: Effects, mechanisms and management. Agron. Sustain. Dev. 2009, 29, 185–212. [Google Scholar] [CrossRef] [Green Version]
  29. Rucker, K.S.; Kvien, C.K.; Holbrook, C.C.; Hook, J.E. Identification of Peanut Genotypes with Improved Drought Avoidance Traits. Peanut Sci. 1995, 22, 14–18. [Google Scholar] [CrossRef] [Green Version]
  30. Krichen, K.; Vilagrosa, A.; Chaieb, M. Divergence of functional traits at early stages of development in Stipa tenacissima populations distributed along an environmental gradient of the Mediterranean. Plant Ecol. 2019, 220, 995–1008. [Google Scholar] [CrossRef]
  31. Ehleringer, J.R.; Monson, R.K. Evolutionary and Ecological Aspects of Photosynthetic Pathway Variation. Annu. Rev. Ecol. Syst. 1993, 24, 411–439. [Google Scholar] [CrossRef]
  32. Osborne, C.P.; Sack, L. Evolution of C4 plants: A new hypothesis for an interaction of CO2 and water relations mediated by plant hydraulics. Philos. Trans. R. Soc. B Biol. Sci. 2012, 367, 583–600. [Google Scholar] [CrossRef] [PubMed] [Green Version]
  33. Guo, J.; Xu, W.; Yu, X.; Shen, H.; Li, H.; Cheng, D.; Liu, A.; Liu, J.; Liu, C.; Zhao, S.; et al. Cuticular Wax Accumulation Is Associated with Drought Tolerance in Wheat Near-Isogenic Lines. Front. Plant Sci. 2016, 7, 1809. [Google Scholar] [CrossRef] [PubMed] [Green Version]
  34. Oppenheimer, H.R. Adaptation to drought: Xerophytism. In Plant Water Relationships in Arid and Semi-Arid Conditions; UNESCO: Paris, France, 1960; p. 105. [Google Scholar]
  35. Clarke, J.M. Effect of leaf rolling on leaf water loss in Triticum spp. Can. J. Plant Sci. 1986, 66, 885–891. [Google Scholar] [CrossRef] [Green Version]
  36. Kaur, V.; Pulivendula, P.; Kumari, A. Excised leaf water loss in wheat (Triticum aestivum L.) as affected by short periods of heat and water-deficit treatment followed by recovery. Wheat Inf. Serv. 2016, 122, 1–6. [Google Scholar]
  37. Akita, S.; Moss, D.N. Differential Stomatal Response between C3 and C4 Species to Atmospheric CO2 Concentration and Light. Crop Sci. 2010, 12, 789. [Google Scholar] [CrossRef]
  38. Pirasteh-Anosheh, H.; Saed-Moucheshi, A.; Pakniyat, H.; Pessarakli, M. Stomatal responses to drought stress. In Water Stress and Crop Plants; John Wiley & Sons, Ltd.: Chichester, UK, 2016; pp. 24–40. [Google Scholar]
  39. Rahbarian, R.; Khavari-Nejad, R.; Ganjeali, A.; Bagheri, A.; Najafi, F. Drought Stress Effects on Photosynthesis, Chlorophyll Fluorescence and Water Relations in Tolerant and Susceptible Chickpea (Cicer arietinum L.) Genotypes. Acta Biol. Cracoviensia Ser. Bot. 2011, 53, 47–56. [Google Scholar] [CrossRef]
  40. Kalapos, T. Leaf water potential-leaf water deficit relationship for ten species of a semiarid grassland community. Plant Soil 1994, 160, 105–112. [Google Scholar] [CrossRef]
  41. Li, X.; Yang, Y.; Yang, S.; Sun, X.; Yin, X.; Zhao, Y.; Yang, Y. Comparative proteomics analyses of intraspecific differences in the response of Stipa purpurea to drought. Plant Divers. 2016, 38, 101–117. [Google Scholar] [CrossRef] [PubMed] [Green Version]
  42. Siddiqui, Z.S.; Shahid, H.; Cho, J.-I.; Park, S.-H.; Ryu, T.-H.; Park, S.-C. Physiological responses of two halophytic grass species under drought stress environment. Acta Bot. Croat. 2016, 75, 31–38. [Google Scholar] [CrossRef]
  43. Schonfeld, M.A.; Johnson, R.C.; Carver, B.F.; Mornhinweg, D.W. Water Relations in Winter Wheat as Drought Resistance Indicators. Crop Sci. 1988, 28, 526. [Google Scholar] [CrossRef]
  44. Merah, O. Potential importance of water status traits for durum wheat improvement under Mediterranean conditions. J. Agric. Sci. 2001, 137, 139–145. [Google Scholar] [CrossRef]
  45. Siddiqui, Z.S.; Cho, J.-I.; Kwon, T.-R.; Ahn, B.-O.; Lee, K.-S.; Jeong, M.-J.; Ryu, T.-H.; Lee, S.-K.; Park, S.-C.; Park, S.-H. Physiological mechanism of drought tolerance in transgenic rice plants expressing Capsicum annuum methionine sulfoxide reductase B2 (CaMsrB2) gene. Acta Physiol. Plant. 2014, 36, 1143–1153. [Google Scholar] [CrossRef]
  46. Vendramini, F.; Díaz, S.; Gurvich, D.E.; Wilson, P.J.; Thompson, K.; Hodgson, J.G. Leaf traits as indicators of resource-use strategy in floras with succulent species. New Phytol. 2002, 154, 147–157. [Google Scholar] [CrossRef]
  47. Bao, L.; Liu, Y.H. Comparison of leaf functional traits in different forest communities in Mt. Dongling of Beijing. Acta Ecol. Sin. 2009, 29, 3692–3703. [Google Scholar]
  48. Garnier, E.; Laurent, G. Leaf anatomy, specific mass and water content in congeneric annual and perennial grass species. New Phytol. 1994, 128, 725–736. [Google Scholar] [CrossRef]
  49. Zhong, M.; Wang, J.; Liu, K.; Wu, R.; Liu, Y.; Wei, X.; Pan, D.; Shao, X. Leaf Morphology Shift of Three Dominant Species along Altitudinal Gradient in an Alpine Meadow of the Qinghai-Tibetan Plateau. Pol. J. Ecol. 2014, 62, 639–648. [Google Scholar] [CrossRef]
  50. Cunningham, S.A.; Summerhayes, B.; Westoby, M. Evolutionary Divergences in Leaf Structure and Chemistry, Comparing Rainfall and Soil Nutrient Gradients. Ecol. Monogr. 1999, 69, 569. [Google Scholar] [CrossRef]
  51. Canavar, Ö.; Götz, K.-P.; Ellmer, F.; Chmielewski, F.-M.; Kaynak, M.A. Determination of the relationship between water use efficiency, carbon isotope discrimination and proline in sunflower genotypes under drought stress. Aust. J. Crop Sci. 2014, 8, 232–242. [Google Scholar]
  52. Zhang, H.; Ma, J.; Sun, W.; Chen, F. Altitudinal variation in functional traits of Picea schrenkiana var. tianschanica and their relationship to soil factors in Tianshan Mountains, Northwest China. Acta Ecol. Sin. 2010, 30, 5747–5758, (In Chinese, English summary). [Google Scholar]
  53. Hong, T.; Wu, C.Z.; Chen, C. Elevational resource niche of SLA of 5 dominant trees in Fujian coastal hilly region. J. Fujian Coll. For. 2013, 8–11. [Google Scholar]
  54. Essaghi, S.; Hachmi, M.; Yessef, M.; Dehhaoui, M. Leaf shrinkage: A predictive indicator of the potential variation of the surface area-to-volume ratio according to the leaf moisture content. SpringerPlus 2016, 5, 1229. [Google Scholar] [CrossRef] [PubMed] [Green Version]
  55. Tang, A.-C.; Boyer, J.S. Leaf shrinkage decreases porosity at low water potentials in sunflower. Funct. Plant Biol. 2007, 34, 24. [Google Scholar] [CrossRef]
  56. Kadioglu, A.; Terzi, R. A Dehydration Avoidance Mechanism: Leaf Rolling. Bot. Rev. 2007, 73, 290–302. [Google Scholar] [CrossRef]
  57. Pugnaire, F.I.; Haase, P. Comparative physiology and growth of two perennial tussock grass species in a semi-arid environment. Ann. Bot. 1996, 77, 81–86. [Google Scholar] [CrossRef] [Green Version]
  58. Pugnaire, F.I.; Haase, P.; Incoll, L.; Clark, S.C. Response of the tussock grass Stipa tenacissima to watering in a semi-arid environment. Funct. Ecol. 1996, 10, 265–274. [Google Scholar] [CrossRef]
  59. Castro-Díez, P.; Puyravaud, J.P.; Cornelissen, J.H.C. Leaf structure and anatomy as related to leaf mass per area variation in seedlings of a wide range of woody plant species and types. Oecologia 2000, 124, 476–486. [Google Scholar] [CrossRef] [PubMed]
Figure 1. Effect of water stress on excised leaves water loss (ELWL %) after two to eight hours post-excision of C. ciliaris (A), S. parviflora (B) and S. lagascae (C). Boxes represent means and error bars represent the SD of the means. Seven seedlings were taken per treatment with three leaves in each seedling (Ntotal = 21 leaves). Different letters on the bars indicate significant difference between treatments (p < 0.05); (T1, T2, T3, T4: Treatments (the four water irrigation quantities)).
Diversity 11 00233 g001
Figure 2. Shrinkage lengthwise (A) (%), Shrinkage widthwise (B) (%), Shrinkage thicknesswise (C) (%) & Area Shrinkage (D) (%) as a function of leaf moisture content (%) of C. ciliaris, S. parviflora and S. lagascae. The error bars represent the SD of the means. Five seedlings per treatment with three leaves in each seedling (Ntotal = 15 leaves). Values with different letters differ significantly at p < 0.05.
Diversity 11 00233 g002
Figure 3. Rank correlation between leaf area shrinkage (A,B) and thickness shrinkage (C,D) and leaf functional traits. (LDMC: Leaf Dry Matter Content; Ltd: Leaf Tissue Density) Note: * p < 0.05, ** p < 0.01, *** p < 0.001.
Diversity 11 00233 g003
Table 1. Geographical coordinates and climatic characteristics of the seed collection sites. T max (maximum temperature), T min (minimum temperature) and T Average (Average temperature).
SpeciesCenchrus ciliaris L.Stipa parviflora Desf.Stipa lagascae R. & Sch.
Harvesting mediumBou Hedma national parkBéjaDjerba island
GPS CoordinatesLatitude34°28′46,60°38°0′55.094″33,53′26°
Longitude9°40′04,47°7°51′45.832″10°47′22″
Climate (1)ArideSemi-aridArid
Temperature (°C) (1)T min18.89.311.3
T Average17.91819.9
Annual
T max2327.327.9
Precipitation (mm) (1)223662200
(1) The climate data in each location were obtained from the Climate-org database (© Climate-Data.org).
Table 2. Water irrigation quantities during the stress period.
TreatmentsNumber of Pots/TreatmentWater Irrigation QuantitiesAnnual Irrigation Quantities
(mm/Month)(mm/Year)
Treatment 111 pots15180
Treatment 211 pots8.33 100
Treatment 311 pots4.1650
Treatment 411 potsAt dryAt dry
Table 3. Abbreviations and units used for the different traits and tissues.
AbbreviationsExplanationUnits
LLLeaf LengthCm
LWLeaf WidthCm
FWFresh WeightG
DWDry WeightG
RWCRelative Water Content
RWC = ((FW − DW)/(MFW − DW)) × 100
%
FAFresh Area cm2
SLASpecific Leaf Area
SLA = FA / DW
cm2/g−1
LDMCLeaf Dry Mater Content LDMC = DW / MFW g/m2
Dimensional ShrinkageDimensional Shrinkage = ((Size difference/initial size) × 100) [18]%
LthLeaf Thickness Index Lth = 1 / SLA × LDMC µm
LtdLeaf Tissue Density Ltd = LMA / Lth
Leaf Mass Per Area LMA = DW / FA [19]
mg/cm−3
mg/cm−2
NGL/TNumber of Green leaves/Tiller
NGL/SNumber of Green leaves/Seedling
NSL/TNumber of Senescent leaves/Tiller
NSL/SNumber of Senescent leaves/Seedling
ELWLExcised Leaf Water Loss ELWL ( % ) = ( ( W 1 W 2 ) / W 1 )
W1: Initial Weight
W2: weight after water loss after x time X interval: 2 to 8
%
h
Table 4. Means of the studied leaf traits of the considered species under high (T1). Intermediate (T2). Low (T3) and without (T4) water availability (by one-way ANOVA).
SpeciesTLLLWRWCSLALDMCLthLtdNGL/TNGL/SNSL/TLNSL/S
C. ciliaris L.T16.00 ± 0.60 a0.45 ± 0.05 a90.00 ± 2.00 a187.00 ± 6.00 a45.00 ± 1.90 d107.00 ± 2.90 c0.04 ± 0.002 d32.00 ± 1.00 a139.00 ± 11.00 a9.00 ± 1.00 c15.00 ± 1.00 c
T25.60 ± 0.80 a0.42 ± 0.05 a85.70 ± 3.00 ab96.00 ± 7.00 b63.00 ± 9.30 c141.00 ± 21.00 b0.07 ± 0.01 c21.00 ± 5.00 b120.00 ± 10.00 a13.00 ± 2.00 b22.00 ± 3.00 b
T35.30 ± 0.80 a0.40 ± 0.08 a78.00 ± 2.00 bc62.00 ± 3.00 c83.00 ± 7.20 b153.00 ± 11.50 bc0.10 ± 0.006 b13.00 ± 1.00 c81.00 ± 5.00 b22.00 ± 1.00 a24.00 ± 1.20 b
T43.20 ± 0.90 b0.30 ± 0.07 a73.10 ± 4.00 c30.00 ± 4.00 d155.00 ± 7.50 a164.00 ± 7.50 a0.25 ± 0.01 a10.00 ± 0.80 d37.00 ± 4.00 c27.00 ± 1.00 a34.00 ± 2.00 a
F-value9.201.3313.02284.41327.5027.31254.21139.04185.6374.6399.49
p-value0.0020.31<0.0001<0.0001<0.0001<0.0001<0.0001<0.0001<0.0001<0.0001<0.0001
S. parviflora Desf.T15.00 ± 0.20 a0.28 ± 0.05 a79.50 ± 8.00 a130.00 ± 9.00 a67.00 ± 2.9 c115.00 ± 4.30 b0.06 ± 0.006 d20.00 ± 2.00 a71.00 ± 9.00 a4.00 ± 1.20 c10.00 ± 1.00 c
T23.00 ± 0.20 b0.20 ± 0.06 a75.00 ± 9.60 a93.00 ± 18.00 b78.00 ± 3.30 b127.00 ± 7.10 ab0.08 ± 0.009 c15.00 ± 3.00 ab50.00 ± 13.00 b7.00 ± 2.00 b12.00 ± 2.00 b
T32.40 ± 0.40 c0.17 ± 0.02 ab68.00 ± 4.90 b60.00 ± 12.00 c83.00 ± 6.05 bc146.00 ± 19.90 ab0.11 ± 0.013 b10.00 ± 3.00 bc33.00 ± 5.00 c11.00 ± 2.00 bc16.00 ± 2.00 bc
T41.30 ± 0.10 d0.11 ± 0.05 b62.00 ± 6.70 c27.00 ± 1.00 d144.00 ± 14.20 a152.00 ± 7.10 a0.21 ± 0.008 a7.00 ± 1.70 c20.00 ± 4.00 d15.00 ± 2.90 a20.00 ± 1.00 a
F-value89.738.1028.0864.8857.403.72107.6017.4350.3117.9125.65
p-value<0.0001<0.0001<0.0001<0.0001<0.0001<0.0001<0.0001<0.0001<0.0001<0.0001<0.0001
S. lagascae R.& Sch.T15.00 ± 0.80 a0.40 ± 0.10 a74.00 ± 6.60 a134.00 ± 13.00 a51.00 ± 3.90 b109.00 ± 5.00 b0.06 ± 0.007 c18.00 ± 3.00 a65.00 ± 3.00 a3.00 ± 0.90 c10.00 ± 1.00 c
T23.80 ± 0.5 ab0.30 ± 0.09 ab70.00 ± 5.60 a100.00 ± 22.00 b60.00 ± 4.70 b121.00 ± 10.20 b0.08 ± 0.009 c13.00 ± 4.30 a46.00 ± 10.00 b6.00 ± 1.70 c14.00 ± 2.00 b
T33.20 ± 0.20 b0.30 ± 0.07 ab67.00 ± 5.40 ab51.00 ± 9.00 c112.00 ± 14.40 a130.00 ± 8.70 a0.15 ± 0.019 b9.00 ± 1.80 b32.00 ± 3.00 c10.00 ± 1.70 b17.00 ± 1.00 b
T42.00 ± 0.40 c0.20 ± 0.04 b53.00 ± 4.10 b22.00 ± 1.00 c119.00 ± 8.50 a139.00 ± 9.90 a0.20 ± 0.01 a6.00 ± 0.90 b19.00 ± 3.00 d14.00 ± 1.20 a21.00 ± 1.00 a
F-value20.154.756.4880.9891.9261.37116.7328.0985.0833.0343.35
p-value<0.00010.02<0.0001<0.0001<0.0001<0.0001<0.0001<0.0001<0.0001<0.0001<0.0001
Values are Mean (±SE) of n = 11 seedlings per water stress treatment. Different letters indicate significant differences among drought treatments (post hoc Tukey test at p < 0.05). (LL: Leaf Length; LW: Leaf Width; RWC: Relative Water Content; SLA: Specific Leaf Area; LDMC: Leaf Dry Matter Content; Lth: Leaf Thickness; Ltd: Leaf Tissue Density; NGL/T: Number of Green Leaves per Tiller; NGL/S: Number of Green Leaves per Seedling; NSL/T: Number of Senescent Leaves per Tiller; NSL/S: Number of Senescent Leaves per Seedling).
Table 5. Analysis of variance for species, water treatment effects on leaf morphology parameters and their interactions for C. ciliaris, S. parviflora and S. lagascae seedlings.
Parameters SSDFMSF-Valuesp-Values
LLTreatment5.7731.92572.36<0.0001
Species2.7821.39152.31<0.0001
Treatment X Species0.5560.0923.440<0.0001
LWTreatment2.3230.77413.93<0.0001
Species5.2322.61747.11<0.0001
Treatment X Species0.5760.0961.730<0.0001
RWCTreatment4.3931.46634.05<0.0001
Species13.8926.94931.88<0.0001
Treatment X Species4.5060.7501.21<0.0001
SLATreatment19.4636.488337.04<0.0001
Species0.3420.1747.03<0.0001
Treatment X Species0.3160.0524.00<0.0001
LDMCTreatment6.0832.028323.50<0.0001
Species0.1620.08213.00<0.0001
Treatment X Species0.7060.11718.650<0.0001
LthTreatment2.0430.68225.79<0.0001
Species0.0820.04311.47<0.0001
Treatment X Species0.3960.0664.51<0.0001
LtdTreatment8.9032.969426.33<0.0001
Species0.5720.28944.32<0.0001
Treatment X Species0.5160.08511.00<0.0001
NGL/TTreatment7.9332.64698.85<0.0001
Species1.6920.84831.68<0.0001
Treatment X Species0.0760.0120.44<0.0001
NGL/STreatment10.8933.631250.33<0.0001
Species6.7923.398234.23<0.0001
Treatment X Species0.1660.0271.85<0.0001
NSL/TLTreatment13.1534.38678.38<0.0001
Species6.7123.35759.98<0.0001
Treatment X Species0.3660.0611.08<0.0001
NSL/STreatment4.1731.392121.61<0.0001
Species2.2221.11297.16<0.0001
Treatment X Species0.0460.0070.57<0.0001
At p < 0.05. SS: Sum of Squares; DF: Degree of freedom; MS: Mean Square. (LL: Leaf Length; LW: Leaf Width; RWC: Relative Water Content; SLA: Specific Leaf Area; LDMC: Leaf Dry Matter Content; Lth: Leaf Thickness; Ltd: Leaf Tissue Density; NGL/T: Number of Green Leaves per Tiller; NGL/S: Number of Green Leaves per Seedling; NSL/T: Number of Senescent Leaves per Tiller; NSL/S: Number of Senescent Leaves per Seedling).
Table 6. Spearman’s rho for the effects of water stress treatments on leaf morphological parameters of C. ciliaris. S. parviflora and S. lagascae seedlings.
TraitsC. ciliarisS. parvifloraS. lagascae
rp-Valuesrp-Valuesrp-Values
SLA
RWC0.87<0.00010.806<0.00010.885<0.0001
LDMC−0.990<0.0001−0.914<0.0001−0.920<0.0001
Ltd0.990<0.00010.943<0.00010.981<0.0001
LDMC
RWC−0.868<0.0001−0.7090.002−0.8680.001
Ltd−0.996<0.0001−0.948<0.0001−0.910<0.0001
Lth
RWC−0.987<0.0001−0.7170.002−0.7810.001
Ltd−0.837<0.0001−0.837<0.0001−0.7630.001
(RWC: Relative Water Content; SLA: Specific Leaf Area; LDMC: Leaf Dry Matter Content; Ltd: Leaf Tissue Density).
Table 7. Multivariate analysis of variance (Manova) for species, water stress treatments, hours post-excision effects on excised leaf water loss (ELWL) and their interactions for C. ciliaris, S. parviflora and S. lagascae seedlings.
Parameters SSDFMSF-Valuesp-Values
Species2195.6421097.827.21<0.0001
Treatment46,804.52315,601.51102.51<0.0001
Hours95,350.50331,783.50208.83<0.0001
Species X Treatment1319.956219.991.450.1
Species X Hours3066.846511.143.360.003
Treatment X Hours3303.479367.052.410.01
Species X Treatment X Hours4575.5218254.201.670.03
SS: Sum of Squares; DF: Degree of freedom; MS: Mean Square.
Table 8. Two-way analysis of variance for species, leaf moisture content (LMC) effects on dimensional Shrinkage parameters and their interactions for C. ciliaris, S. parviflora and S. lagascae seedlings.
ParametersSSDFMSF-Valuesp-Values
Shrinkage lengthwiseSpecies89.774244.8870.6320.534
LMC21,827.08837275.696102.403<0.0001
Species X LMC128.025621.3380.3000.935
Shrinkage widthwiseSpecies497.3672248.68327170.071
LMC22,297.77537432.59281.208<0.0001
Species X LMC465.642677.6070.8480.536
Shrinkage thicknesswiseSpecies1036.7922518.39643.274<0.0001
LMC31,127.459310,375.820866.137<0.0001
Species X LMC969.7296161.62113.492<0.0001
Area ShrinkageSpecies89.774244.8870.6320.534
LMC21,827.08837275.696102.403<0.0001
Species X LMC128.025621.3380.3000.935
SS: Sum of squares; DF: Degree of freedom; MS: Mean Square.

