Abstract
Bats play a fundamental role in ecosystem functioning since they are responsible for several ecological services such as seed dispersal and pollination. Therefore, assessing the effects of habitat structure at different scales on the bat assemblage is extremely important for supporting conservation strategies. The objective of the present study was to investigate the effects of habitat structure at multiple spatial scales on the bat assemblages and their variation along a gradient of secondary succession in a Brazilian tropical dry forest. Our results suggest that bat abundance is higher in areas close to mature forests, which shows the important role of those habitats as refuges for the regional bat fauna (in a fragmented landscape) and for the maintenance of ecosystem services provided by this group in tropical dry forests in a landscape context. In addition, bat abundance was lower in protected areas whose surroundings were better preserved (greater forest extension). This unexpected finding could result from an altered behavior in areas under a strong influence of a fruit crop matrix. Finally, we showed that the effects of the surroundings depend on the successional stage of the area under analysis. Late forests are more susceptible to variations in the forest cover in their surroundings, which show the higher fragility of these environments.
1. Introduction
Bats are very important to ecosystem functioning and regeneration after disturbance because they play several key ecological roles. In general, frugivorous bats are excellent seed dispersers and may influence the pool of plant species that will potentially colonize a given region [1]. In addition, bats directly suppress insect abundance and influence herbivory rates [2]. Bats may also affect the reproductive success of plants since they are pollinators of several species [3]. Therefore, changes in the bat assemblage may result in changes in the ecological services delivered by these animals. As a result, these changes may influence the course of ecological succession in a degraded environment.
Secondary succession pathways can be affected by bat activity, but the resulting changes in habitat conditions reciprocally influence the structure of the regenerating bat assemblage. Forests at different successional stages usually have contrasting vegetation structure, which frequently becomes more complex as succession proceeds [4]. Increases in plant density and richness, canopy cover, number of vertical strata, and basal area along forest regeneration [5,6] may affect the animal communities associated with different successional stages. However, the majority of knowledge about secondary succession in the tropics comes from studies in rainforests and should be extrapolated with caution to tropical dry forests [7].
In a broad context, we can state that the bat assemblage tends to be more diverse in preserved habitats and in environments with higher structural complexity [8,9,10]. However, little is known about habitat structure variables that cause those differences. In general, composition attributes (e.g., forest cover) and landscape configuration (e.g., size and distance among fragments) are satisfactory predictors of bat assemblage structure, but responses vary among groups and species. Studies conducted in rainforests suggest that the abundance of frugivorous bats is more strongly correlated with the composition than with the configuration of the landscape [11,12]. There are much fewer studies on this topic for tropical dry forests in comparison with rainforests especially in Brazil. Nevertheless, a study conducted in a dry forest in Mexico found a negative relationship between the abundance of nectarivorous bats and the size of dry forest fragments and found a positive relationship between the abundance of frugivorous bats and the percentage of riparian forests [13]. Understanding the effects of habitat structure on the bat assemblage is extremely important for interpreting the observed patterns and supporting management plans [14,15]. This is particularly true in poorly known and unique areas such as Brazilian tropical dry forests.
Bat responses to changes in habitat structure may occur at multiple scales and vary among species [16]. For example, the nectarivorous Glossophaga soricina occurs at a greater abundance in sites with a high diversity of forest types when considering a 500 m buffer in radius. On the other hand, Leptonycteris yerbabuenae, which is also a nectarivorous species, was influenced by this variable at a scale of 1000 m in a tropical dry forest in Mexico [13]. In contrast, a study carried out in the Amazon showed that bat responses to the landscape varied among species regardless of the analyzed scale [17]. Therefore, the responses of different bat species to habitat changes should be investigated at multiple spatial scales [16].
The objective of the present study was to test the following hypotheses at two different spatial scales including the local scale (sampling site) and the landscape scale (protected area). The vegetation structure (tree richness, density, and canopy height) positively affects bat richness and abundance. The greater the distance from protected forest fragments, the lower the bat richness and abundance of the local assemblage. The higher the percentage of surrounding forests in sampling sites and protected areas, the higher the bat richness and abundance of the local assemblage. In addition, the response of bat richness and abundance to differences in the characteristics of the surrounding forests varies according to the successional stage where the bat assemblage is situated. In this context, we showed that late forest patches are very important for the maintenance of bat diversity in a regional context. Additionally, late stages have higher fragility when compared with early stages of succession.
2. Materials and Methods
2.1. Sampling Sites
The present study was carried out in four protected areas of integral protection located in the northern region of Minas Gerais State, which is located in Southeastern Brazil (Mata Seca State Park, Lagoa do Cajueiro State Park, Biological Reserve of Jaíba, and Biological Reserve of Serra Azul) (see Figure 1). This region harbors different vegetation types with a dominance of tropical dry forests (sensu [18]) inserted within an ecotone between Cerrado, Caatinga, and Atlantic Rain forests. The predominant climate is classified as Aw in the Köppen system with a well-defined dry season from April to September [19] when most plants lose more than 90% of their leaves [20]. The mean annual rainfall is 871 mm and the mean annual temperature is 24 °C.
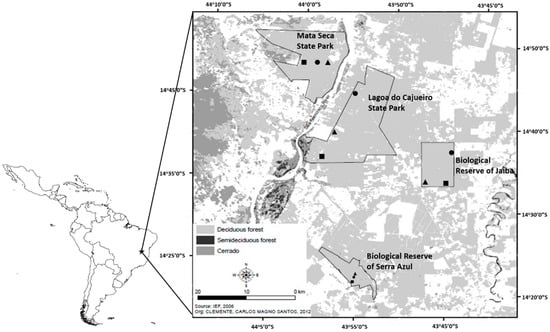
Figure 1.
Location and limits of the four protected areas studied in southeastern Brazil as well as the 12 sampling sites. Different shades of gray and black areas represent natural vegetation types (deciduous forests = tropical dry forest) while white areas represent other land cover classes (exposed soil, water, crops, and pasturelands). Squares represent areas in early successional stages, circle intermediate, and triangle late areas.
The study sites were used for ranching before the protected areas were created so their vegetation is composed of forest mosaics at different stages of secondary succession. Currently, these areas are inserted in an anthropogenic matrix under strong agricultural influence such as fruit production since the region bears the largest irrigation perimeter of Latin America—the Jaíba Project (see Reference [21]). In each protected area, we chose three sites at different successional stages (early, intermediate, and late), totaling twelve sampling sites (four at each stage, Figure 1). Differentiation of the three successional stages was based on forest vertical (i.e., canopy height and the number of tree crown layers in the vertical profile of the forest) and horizontal (i.e., tree density and basal area) structure of the study sites. Early successional areas were used for pasture for at least 20 years and abandoned when the protected areas were created between 1998 and 2000. These forests have a discontinuous canopy with vegetation composed mainly of scattered patches of short trees and shrubs. Forests at the intermediate stage have two vertical layers including the first layer being composed of fast-growth deciduous trees that form a closed canopy. The second layer consists of lianas, mature shade tolerant tree species, and juvenile trees. These areas were also used as a pasture for an indefinite period and abandoned in the middle of the 1980s (1970s in the case of the Mata Seca State Park). The late successional stage consists of three vertical layers. The first layer consists of large trees that form a relatively closed canopy. The second layer consists of juvenile trees of different ages and sizes. The third layer contains typical understory herbaceous and shrub species. In these areas, there are no records of clear-cutting for the last 50 years [8]. In each successional site, we measured tree richness, density, and height, which are attributes that change when the succession proceeds [6]. The average distance between sites at the same successional stage was 31 km (minimum 10, maximum 50).
To estimate the amount of forests surrounding each sampling site, we established buffers with 250 m, 500 m, 1000 m, and 2000 m in diameter starting at the center of the site where the bats were captured. We estimated forest cover for each buffer based on land use and cover maps of the region. We also estimated the forest cover for each PA and surroundings in two buffers at 1 km and 5 km apart from the borders of the protected areas. Lastly, we calculated the distance of each plot to the nearest old-growth forest fragment in the study region. All calculations were made in the software ArcMaps (Esri, California, CA, USA).
2.2. Bat Captures
We carried out six sampling nights per plot (three in the dry and three in the rainy season every two months) from 2007 to 2009 in the Mata Seca State Park and from 2012 to 2013 in the other protected areas in a total of 72 nights. In each sampling night, we set up 10 mist nets at the ground level (12 m × 2.5 m, polyester, mesh: 16 mm) in potential flight routes inside the forest. The nets were opened at the sunset and remained open for 5 h. We checked the nets every 30 min and placed the bats in cotton bags for 30 min before analysis. All individual bats were marked with lipped metal rings (Anilhas Capri™, São Paulo, Brazil) and released at the same site of capture.
2.3. Statistical Analysis
We calculated the sampling effort by multiplying the nights of sampling by the exposure time and the number of nets opened (net*hours). To test for sampling completeness, we built a species accumulation curve based on 100 randomizations without replacement and calculated completeness by dividing the observed richness by the estimated richness (Jackknife 1) and multiplying the product by 100. We performed the analyses in the software EstimateS 9.
In the present study, we considered two spatial scales, which are the local and landscape scales. We classified local variables related to the sampling site (12 sites) including plant richness, density, canopy height, distance to a late successional forest, and percentage of forest cover in the surroundings. Landscape variables were related to the protected areas (four areas): plant richness, density, canopy height (averaged per plot), and percentage of forest cover in the surroundings of each PA. We used generalized linear models (GLM) to test the effects of plant richness, density, canopy height, and distance to late successional forest fragments (explanatory variables) on bat diversity at the local and landscape scales. Bat richness and abundance were considered response variables. We tested the relationship between bat richness and abundance and forest cover on multiple scales (250 m, 500 m, 1000 m, and 2000 m) using GLMs with a model for each scale. In addition, to test whether the effects of surrounding forest cover depend on the successional stage of a site, we built GLMs with the interaction factor “forest cover*successional stage” as an explanatory variable for bat richness and abundance at each scale. To determine the most important scale, we used the dispersal parameter of the models and calculated the proportion of variance (deviance) explained by each model using the formula Pdev = 1 − (Devsc/Devtot) where: Pdev = proportion of deviance explained by the model, Devsc = deviance explained by forest cover at the scale analyzed, and Devtot = total deviance of the model. Therefore, we could test for a relationship between variables (p-value) and the relative importance of each variable (Pdev-value). All models were submitted to a residual analysis to determine the adequacy of error distribution and, whenever necessary, to a contrast analysis for clustering of non-significant categorical variables [22]. All analyses were performed in the software R version 3.4.2 [23].
3. Results
We captured 461 bats from 17 species. All bats were within the family Phyllostomidae, which represents 89% of the estimated richness for the study area (see Figure 2) with a sampling effort of 3600 net*hours. Artibeus planirostris, Carollia perspicillata, and Desmodus rotundus were the most abundant species with 204, 149, and 34 captures, respectively (see Table 1).
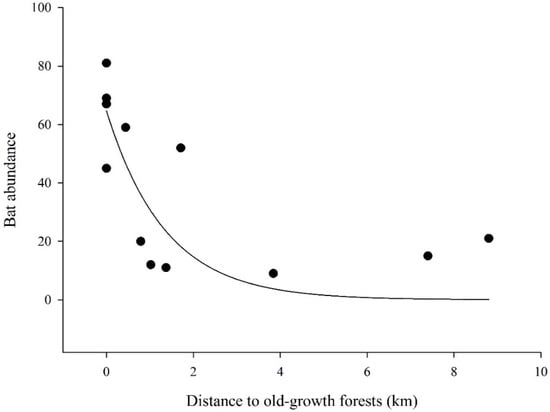
Figure 2.
Relationship between the bat abundance and the distance to the nearest old-growth tropical dry forest fragment.

Table 1.
Abundance of bats from different feeding ensembles captured at three successional stages of tropical dry forests in four protected areas in Southeastern Brazil.
We did not observe a relationship between bat richness, abundance, plant richness, density, and canopy height (habitat structure variables at the local scale, Table 2). However, bat abundance showed a positive relationship with the distance from late successional forests (see Table 2). Therefore, sites closer to an undisturbed forest had higher bat abundance (see Figure 3). This pattern was not observed for bat richness, which was not related to the distance from late successional forests.

Table 2.
Complete generalized linear models built to test the effects of tree richness, height, and density on bat richness and abundance at the local (site) and landscape (PA) scales. At the local scale, models also included the distance to a PA. At the landscape scale, forest cover in the surroundings (1 km to 5 km) of the PA borders was inserted into the models (see text for details). All models followed quasi-Poisson error distributions. * The signal between parentheses indicates whether a significant relationship between variables was negative or positive.
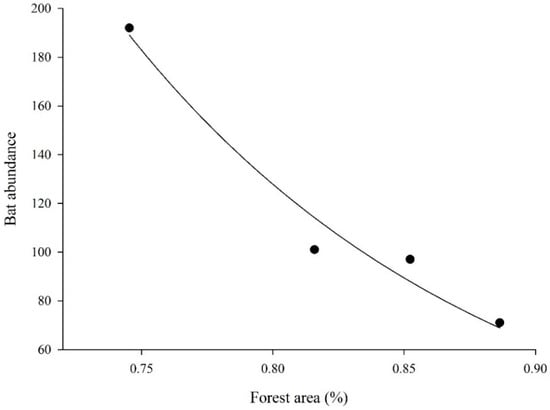
Figure 3.
Relationship between bat abundance and the surrounding forest cover in the four protected areas considered in the present study.
Bat abundance also varied as a function of the percentage of forest cover in the surroundings of the PA at a distance of 1000 m (see Table 2). In this case, the lower the forest cover in the surroundings, the higher the bat abundance inside the PA (see Figure 4). However, we did not find a significant relationship between bat richness and forest cover in the PA or its surroundings (see Table 2).
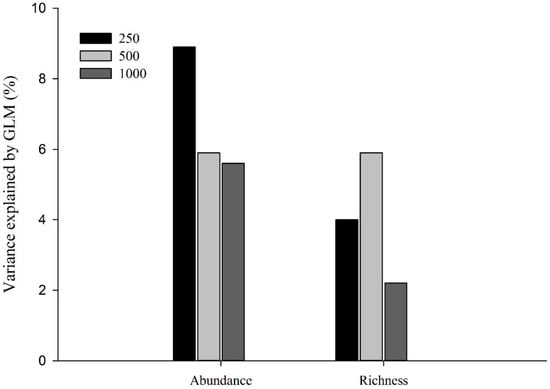
Figure 4.
Percentage of the variation in bat richness and abundance explained by the percentage of surrounding forest cover across four buffer diameters. Values for the 2000 m buffer were too low and are not represented in the figure.
When analyzed together, the percentage of surrounding forest cover had little influence (low Pdev) on bat richness and abundance (see Figure 4). However, the successional stage of the sampling site affected the explanatory power of this variable. In general, areas at a late successional stage were more susceptible to differences in the percentage of surrounding forest cover (higher values of Pdev) than areas at early or intermediate successional stages regardless of the scale (see Figure 5A,B).
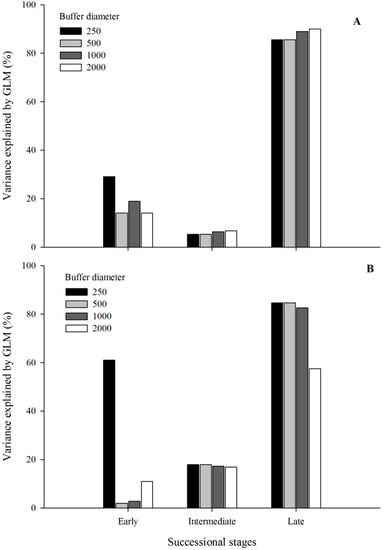
Figure 5.
Percentage of the variation in bat (A) abundance and (B) richness explained by the percentage of surrounding forest cover across four buffer diameters for each successional stage.
The forest cover in the surroundings of a site is explained. On average, 87% of the variation in bat abundance for areas at late successional stages contrast with 19% and 5% for areas at early and intermediate successional stages, respectively (see Figure 5A). The scale analyzed had little influence on bat abundance in areas at intermediate and late successional stages. This result indicated that, regardless of the buffer size, the percentage of the variation explained by the forest cover did not vary significantly. However, for areas at early successional stages, the smallest scale studied (250 m) showed a higher explanatory power than the larger scales (see Figure 5A). We observed the same pattern for bat richness. The average explanatory power of the models was 77% for areas at late successional stages, 17% for areas at intermediate successional stages, and 19% for areas at early successional stages (see Figure 5B). The forest cover at the smallest scale (250 m) showed the highest explanatory power for areas at early successional stages (61%). The explanatory power did not vary much between scales for areas at intermediate successional stages (between 16% and 17%) and decreased at the largest scale studied for areas at late successional stages (57%).
4. Discussion
The higher abundance of bats in areas close to old-growth forests show the importance of undisturbed habitats for the maintenance of the bat assemblages and associated ecosystem services. In tropical dry forests, sites at late successional stages have higher bat richness and abundance [10,24], which is also observed for abundance in our study (Figure S1 and Table S1) as a consequence of their relatively high structural complexity. When those sites are analyzed at a landscape scale (i.e., as part of a heterogeneous landscape), they may play the role of refuges for the bat fauna, which makes the assemblage more homogeneous on a regional scale. In general, some bat species can cross open environments in search for resources and disperse among patches of different vegetation types [25]. Therefore, bats can help keep gene flow among plant populations at the landscape scale (sensu [26]) by carrying seeds and pollen from one habitat to the other as long as it precludes genetic differentiation across successional stages. In regions under strong anthropogenic pressure, with a predominance of pastures and crops, bats can be key agents of natural regeneration since those environments usually have low intrinsic regeneration capacity (e.g., reduced seed and seedling banks) [26,27]. Therefore, the maintenance of late successional forests even as sparse patches in a disturbed matrix is extremely important for the maintenance of environmental integrity.
The negative relationship observed between bat abundance and the percentage of forest cover surrounding protected areas contradicted our prediction. Although some studies suggest that more heterogeneous environments can harbor a higher bat diversity due to greater habitat complementarity [28,29], this does not seem to be the best explanation for our results. Most of the matrix classified as non-forest in the study region is composed of fruit plantations including banana crops. Therefore, these regions can be opportunistically used by generalist frugivores such as A. planirostris and C. perspicillata, which are the most abundant species in the present study. Once bat foraging activity is concentrated in areas adjacent to protected areas, bat captures decrease inside them (where mist netting was done). Therefore, the abundance of bats in protected areas under the influence of fruit plantations is lower than in other areas due to the lower surrounding forest cover. This result shows the strong influence of the matrix on bat foraging patterns and we suppose this pattern might be even more marked in areas with strong seasonal variation such as tropical dry forests where food availability is low during the prolonged dry period.
The lack of a relationship between bat richness, landscape composition, and configuration can be related to the use of the matrix by bats. In general, the bat fauna of a given site is composed of species that not only effectively use a specific site (e.g., for foraging or roosting), but also of species that pass by that site. Bats tend to use structurally simpler areas as flight routes since they reduce the energy costs required for movement and injury risks [25,30]. On the other hand, bats may concentrate their foraging activity in environments with higher resource availability (e.g., [31]). Therefore, finding relationships between species richness and habitat structure for an animal group that uses the environment so heterogeneously is a difficult task. This is especially true for tropical dry forests, which high variation in vegetation structure over the year is reflected in the bat assemblage [10,24].
The negative influence of surrounding forests on bat abundance in late successional forests is possibly correlated to the occurrence of rare species in these areas. In general, these species have more specific ecological requirements and are naturally less abundant. Therefore, the variation in habitat structure tends to affect rare species more than common species. In our study, only late successional areas had exclusive species (5) including three species of the subfamily Phyllostominae. This group is considered an indicator of habitat quality [8,9] and usually has higher abundance in areas with high forest cover [11,17,32]. Therefore, because bat species that are more susceptible to habitat variations occur in larger numbers in late successional areas, the entire bat assemblage of those sites tends to be more susceptible to variations in habitat structure.
5. Conclusions
Our results show that bat abundance decreases with distance from late successional forests, which indicates that these areas serve as refuges for bats in complex matrices with patches of tropical dry forest at different successional stages. Therefore, the protection of late successional forests is extremely important for maintaining the bat assemblage and associated ecosystem services (i.e., seed dispersal and pollination) at the landscape level. In addition, higher bat abundance was observed in protected areas with lower surrounding forest cover. In this case, we emphasize the important role of the matrix to bat ecology (especially their foraging patterns) in tropical dry forests. Lastly, the response of bat richness and abundance to variations in surrounding forest cover depends on the successional stage of the study area. Late successional areas tend to be more susceptible to the configuration of the surrounding vegetation since they have a larger number of rare species with specialized ecological requirements.
Supplementary Materials
The following are available online at http://www.mdpi.com/1424-2818/10/2/41/s1, Figure S1. Abundance and richness of bats among three successional stages in a tropical dry forest in southeastern Brazil, Table S1. Abundance of bats captured at three successional stages of tropical dry forests in four protected areas in southeastern Brazil.
Author Contributions
L.A.D.F., M.M.E.S., G.W.F. and A.P.P. conceived and designed the experiments. L.A.D.F. performed the fieldwork. L.A.D.F. and A.P.P. analyzed the data. L.A.D.F., M.M.E.S., G.W.F. and A.P.P. wrote the paper.
Acknowledgments
The authors thank F.S. Neves and V.C. Tavares for their comments in the early drafts of this manuscript, P. Vasconcelos and M.F. Fonseca for help during fieldwork, and K.E. Stoner and L.D. Avila-Cabadilla for help in sampling design and fieldwork in the Mata Seca State Park. We gratefully acknowledge the staff of the Instituto Estadual de Florestas (IEF-MG) for logistical support. This research was funded by Conselho Nacional de Desenvolvimento Científico e Tecnológico (CNPq—563304/2010-3), Fundação de Amparo à Pesquisa do Estado de Minas Gerais (FAPEMIG CRA—APQ-00001-11) and the Inter-American Institute for Global Change Research (IAI-CRN II-021). L.A.D.F. and M.M.E.S. acknowledge scholarships from the Coordenação de Aperfeiçoamento de Pessoal de Nível Superior (CAPES) and CNPq, respectively. G.W.F. and A.P.P. acknowledge CAPES and CNPq. This study was in partial fulfillment of requirements for the Ph.D. degree of L.A.D.F. at the Universidade Federal de Minas Gerais.
Conflicts of Interest
The authors declare no conflict of interest.
References
- Henry, M.; Jouard, S. Effect of bat exclusion on patterns of seed rain in tropical rain forest in French Guiana. Biotropica 2007, 39, 510–518. [Google Scholar] [CrossRef]
- Kalka, M.B.; Smith, A.R.; Kalko, E.K.V. Bats limit arthropods and herbivory in a tropical forest. Science 2008, 320, 71. [Google Scholar] [CrossRef] [PubMed]
- Quesada, M.; Stoner, K.E.; Rosas-Guerrero, V.; Palacios-Guevara, C.; Lobo, J.A. Effects of habitat disruption on the activity of nectarivorous bats (Chiroptera: Phyllostomidae) in a dry tropical forest: Implications for the reproductive success of the neotropical tree Ceiba grandiflora. Oecologia 2003, 135, 400–406. [Google Scholar] [CrossRef] [PubMed]
- Brown, S.L.; Lugo, A. Tropical secondary forests. J. Trop. Ecol. 1990, 6, 1–32. [Google Scholar] [CrossRef]
- Kalacska, M.; Sanchez-azofeifa, G.A.; Calvo-alvarado, J.C.; Quesada, M.; Rivard, B.; Janzen, D.H. Species composition, similarity and diversity in three successional stages of a seasonally dry tropical forest. For. Ecol. Manag. 2004, 200, 227–247. [Google Scholar] [CrossRef]
- Madeira, B.G.; Espírito-Santo, M.M.; Neto, S.D.; Nunes, Y.R.F.; Azofeifa, G.A.S.; Fernandes, G.W.; Quesada, M. Changes in tree and liana communities along a successional gradient in a tropical dry forest in south-eastern Brazil. Plant Ecol. 2009, 201, 291–304. [Google Scholar] [CrossRef]
- Vieira, D.L.M.; Scariot, A. Principles of natural regeneration of tropical dry forests for restoration. Restor. Ecol. 2006, 14, 11–20. [Google Scholar] [CrossRef]
- Fenton, M.; Acharya, L.; Audet, D.; Hickey, M.; Merriman, C.; Obrist, M.; Syme, D.; Adkins, B. Phyllostomid bats (Chiroptera: Phyllostomidae) as indicators of habitat disruption in the Neotropics. Biotropica 1992, 24, 440–446. [Google Scholar] [CrossRef]
- Medellin, R.A.; Equihua, M.; Amin, M.A. Bat diversity and abundance as indicators of disturbance in neotropical rainforests. Conserv. Biol. 2000, 14, 1666–1675. [Google Scholar] [CrossRef]
- Falcão, L.A.D.; do Espírito-Santo, M.M.; Leite, L.O.; Garro, R.N.S.L.; Avila-Cabadilla, L.D.; Stoner, K.E. Spatiotemporal variation in phyllostomid bat assemblages over a successional gradient in a tropical dry forest in southeastern Brazil. J. Trop. Ecol. 2014, 30, 123–132. [Google Scholar] [CrossRef]
- Klingbeil, B.T.; Willig, M.R. Guild-specific responses of bats to landscape composition and configuration in fragmented Amazonian rainforest. J. Appl. Ecol. 2009, 46, 203–213. [Google Scholar] [CrossRef]
- Henry, M.; Cosson, J.F.; Pons, J.M. Modelling multi-scale spatial variation in species richness from abundance data in a complex neotropical bat assemblage. Ecol. Model. 2010, 221, 2018–2027. [Google Scholar] [CrossRef]
- Avila-Cabadilla, L.D.; Sanchez-Azofeifa, G.A.; Stoner, K.E.; Alvarez-Añorve, M.Y.; Quesada, M.; Portillo-Quintero, C.A. Local and landscape factors determining occurrence of phyllostomid bats in tropical secondary forests. PLoS ONE 2012, 7, e35228. [Google Scholar] [CrossRef] [PubMed]
- Kalda, O.; Kalda, R.; Liira, J. Multi-scale ecology of insectivorous bats in agricultural landscapes. Agric. Ecosyst. Environ. 2015, 199, 105–113. [Google Scholar] [CrossRef]
- Cisneros, L.M.; Fagan, M.E.; Willig, M.R. Effects of human-modified landscapes on taxonomic, functional and phylogenetic dimensions of bat biodiversity. Divers. Distrib. 2015, 21, 523–533. [Google Scholar] [CrossRef]
- Gorresen, P.M.M.; Willig, M.R.M.R.; Strauss, R.E. Multivariate analysis of scale-dependent associations between bats and landscape structure. Ecol. Appl. 2005, 15, 2126–2136. [Google Scholar] [CrossRef]
- Gorresen, P.M.; Willig, M.R. Landscape responses of bats to habitat fragmentation in Atlantic forest of Paraguay. J. Mammal. 2004, 85, 688–697. [Google Scholar] [CrossRef]
- Sanchez-Azofeifa, G.A.; Quesada, M.; Rodriguez, J.P.; Nassar, J.M.; Stoner, K.E.; Castillo, A.; Garvin, T.; Zent, E.L.; Calvo-Alvarado, J.C.; Kalacska, M.E.R.; et al. Research priorities for neotropical dry forests. Biotropica 2005, 37, 477–485. [Google Scholar] [CrossRef]
- Peel, M.C.; Finlayson, B.L.; McMahon, T.A. Updated world map of the Köppen-Geiger climate classification. Hydrol. Earth Syst. Sci. Discuss. 2007, 4, 439–473. [Google Scholar] [CrossRef]
- Pezzini, F.F.; Ranieri, B.D.; Brandão, D.O.; Fernandes, G.W.; Quesada, M.; Espírito-Santo, M.M.; Jacobi, C.M. Changes in tree phenology along natural regeneration in a seasonally dry tropical forest. Plant Biosyst. 2014, 148, 965–974. [Google Scholar] [CrossRef]
- Espírito-Santo, M.M.; Sevilha, A.C.; Anaya, F.C.; Barbosa, R.; Fernandes, G.W.; Sanchez-Azofeifa, G.A.; Scariot, A.; De Noronha, S.E.; Sampaio, C.A. Sustainability of tropical dry forests: Two case studies in southeastern and central Brazil. For. Ecol. Manag. 2009, 258, 922–930. [Google Scholar] [CrossRef]
- Crawley, M. The R Book; Wiley: Hoboken, NJ, USA, 2007; ISBN 978-0-47-051024-7. [Google Scholar]
- R Development Team. R: A Language and Environment for Statistical Computing; R Development Team: Vienna, Austria, 2015. [Google Scholar]
- Avila-Cabadilla, L.D.; Stoner, K.E.; Henry, M.; Añorve, M.Y.A. Composition, structure and diversity of phyllostomid bat assemblages in different successional stages of a tropical dry forest. For. Ecol. Manag. 2009, 258, 986–996. [Google Scholar] [CrossRef]
- Bernard, E.; Fenton, M.B. Bat mobility and roosts in a fragmented landscape in Central Amazonia, Brazil. Biotropica 2003, 35, 262–277. [Google Scholar] [CrossRef]
- Lundberg, J.; Moberg, F. Mobile link organisms and ecosystem functioning: Implications for ecosystem resilience and management. Ecosystems 2003, 6, 0087–0098. [Google Scholar] [CrossRef]
- Duncan, R.S.; Chapman, C.A. Seed dispersal and potential forest succession in abandoned agriculture in Tropical Africa. Ecol. Appl. 1999, 9, 998–1008. [Google Scholar] [CrossRef]
- Castro-Luna, A.A.; Sosa, V.J.; Castillo-Campos, G. Bat diversity and abundance associated with the degree of secondary succession in a tropical forest mosaic in south-eastern Mexico. Anim. Conserv. 2007, 10, 219–228. [Google Scholar] [CrossRef]
- Ethier, K.; Fahrig, L. Positive effects of forest fragmentation, independent of forest amount, on bat abundance in eastern Ontario, Canada. Landsc. Ecol. 2011, 26, 865–876. [Google Scholar] [CrossRef]
- Caras, T.; Korine, C. Effect of vegetation density on the use of trails by bats in a secondary tropical rain forest. J. Trop. Ecol. 2009, 25, 97–101. [Google Scholar] [CrossRef]
- Falcão, L.A.D.; Alfaro, L.D.; Fernandes, G.W.; Leite, L.O.; Neves, F.S.; Reyes, P.C. Comunidad de murciélagos filostómidos asociada a Caryocar brasiliense. Brenesia 2010, 73–74, 150–153. [Google Scholar]
- Castro, I.; Michalski, F. Effects of logging on bats in tropical forests. Nat. Conserv. 2014, 2, 99–105. [Google Scholar] [CrossRef]
© 2018 by the authors. Licensee MDPI, Basel, Switzerland. This article is an open access article distributed under the terms and conditions of the Creative Commons Attribution (CC BY) license (http://creativecommons.org/licenses/by/4.0/).