


Abstract
The industrial application of starter cultures requires stable physiological and genetic performance. In this study, Streptococcus salivarius subsp. thermophilus and Lactobacillus delbrueckii subsp. bulgaricus were continuously subcultured. Physiological stability was assessed through colony morphology, fermentation activity, and growth profiling. Genetic stability was evaluated through comparative genomics of carbohydrate metabolism networks and single-nucleotide polymorphism (SNP) analysis. The results showed that after 2000 generations, the cellular morphology of the strains remained intact. Additionally, the strains exhibited enhanced growth performance and fermentation capability. The Gompertz model revealed that adapted S. thermophilus A37 and L. bulgaricus B29 exhibited shortened lag phases, increased maximum specific growth rates, and high stationary-phase cell densities. Phenotypic microarray and comparative genomics revealed that S. thermophilus mainly used mono- and disaccharides, with impaired ribose metabolism due to the absence of the rbsk gene in the pentose phosphate pathway. In contrast, L. bulgaricus metabolized diverse oligosaccharides, sugar alcohols, and plant-derived substrates. Additionally, it effectively catabolized ribose through the phosphoketolase pathway and possessed a trehalose degradation cluster. All strains exhibited genomic stability, with SNPs revealing fewer than 21 variations per isolate. This study provides an important theoretical foundation for evaluating the stability of fermentation starter cultures.
1. Introduction
Yogurt, a traditional fermented dairy product with a long history of consumption, has become a staple in the human diet owing to its distinctive flavor, smooth texture, and health benefits [1,2]. Yogurt is traditionally produced through the symbiotic fermentation of milk by Streptococcus salivarius subsp. thermophilus (S. thermophilus) and Lactobacillus delbrueckii subsp. bulgaricus (L. bulgaricus) [3]. In industrial applications, starter cultures are routinely subjected to prolonged preservation and repeated subculturing. During these processes, strains may accumulate genetic variations, undergo metabolic remodeling, and exhibit phenotypic changes, all of which can influence their fermentation performance. Furthermore, during production, strains encounter various environmental stresses, such as temperature fluctuations, osmotic shock, and pH variations [4]. These stresses act as selective pressures that can enrich for pre-existing genomic variations and induce adaptive regulatory responses, leading to altered metabolic regulation and phenotypic outcomes in lactic acid bacteria, thereby affecting their fermentation performance [5,6,7]. Therefore, developing an effective and stable evaluation system is crucial for the selection and application of fermentation starter strains.
Current methods for evaluating the stability of lactic acid bacteria strains are as follows: (1) cultivation under variable environmental conditions (e.g., temperature, pH, or nutrient composition) [8,9]; (2) exposure to extreme stress conditions, such as acidic, thermal, oxidative, or dehydrated environments [10]; and (3) continuous subculturing. Among these methods, continuous subculturing is widely used for assessing the physiological and genetic stability of lactic acid bacteria [11]. During long-term serial passage, strains accumulate genomic mutations and undergo transcriptional regulatory remodeling, thereby driving adaptive changes in metabolic pathways, carbon utilization efficiency, and environmental fitness [12]. Compared with short-term stress treatments, continuous subculturing under relatively stable growth conditions minimizes the interference of the confounding effects of transient environmental fluctuations [13]. This strategy facilitates a systematic evaluation of genetic architecture and physiological traits over long-term continuous subculturing [14]. However, most existing studies on the stability of lactic acid bacteria (LAB) have mainly focused on short-term stress responses, while the metabolic dynamics and genetic evolution of LAB under long-term serial passage remain unclear.
In this study, we systematically assessed the physiological and genetic stability of starter cultures under long-term serial passage conditions. Five S. thermophilus strains and three L. bulgaricus strains were continuously subcultured for 2000 generations. Morphological changes were first examined using scanning electron microscopy (SEM). In parallel, fermentation activity, growth kinetics, and metabolic capacity were assessed to comprehensively investigate the effects of prolonged cultivation on strain physiology. Subsequently, whole-genome sequencing was performed, followed by comparative genomic analyses to analyze characteristic carbon source metabolic networks and SNP variations, thereby revealing potential genetic changes. Overall, this study aimed to elucidate the stability patterns of S. thermophilus and L. bulgaricus under long-term passage conditions, providing theoretical insights to support their industrial application as fermentation starter cultures.
2. Results and Discussion
2.1. Morphological Changes in Fermentation Strains During Continuous Subculture
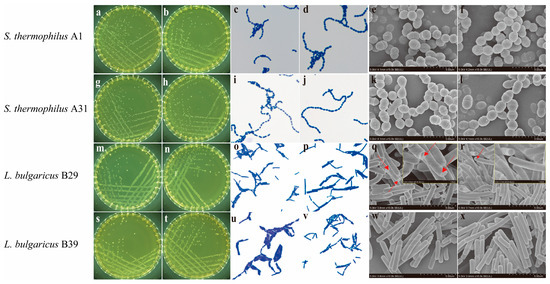
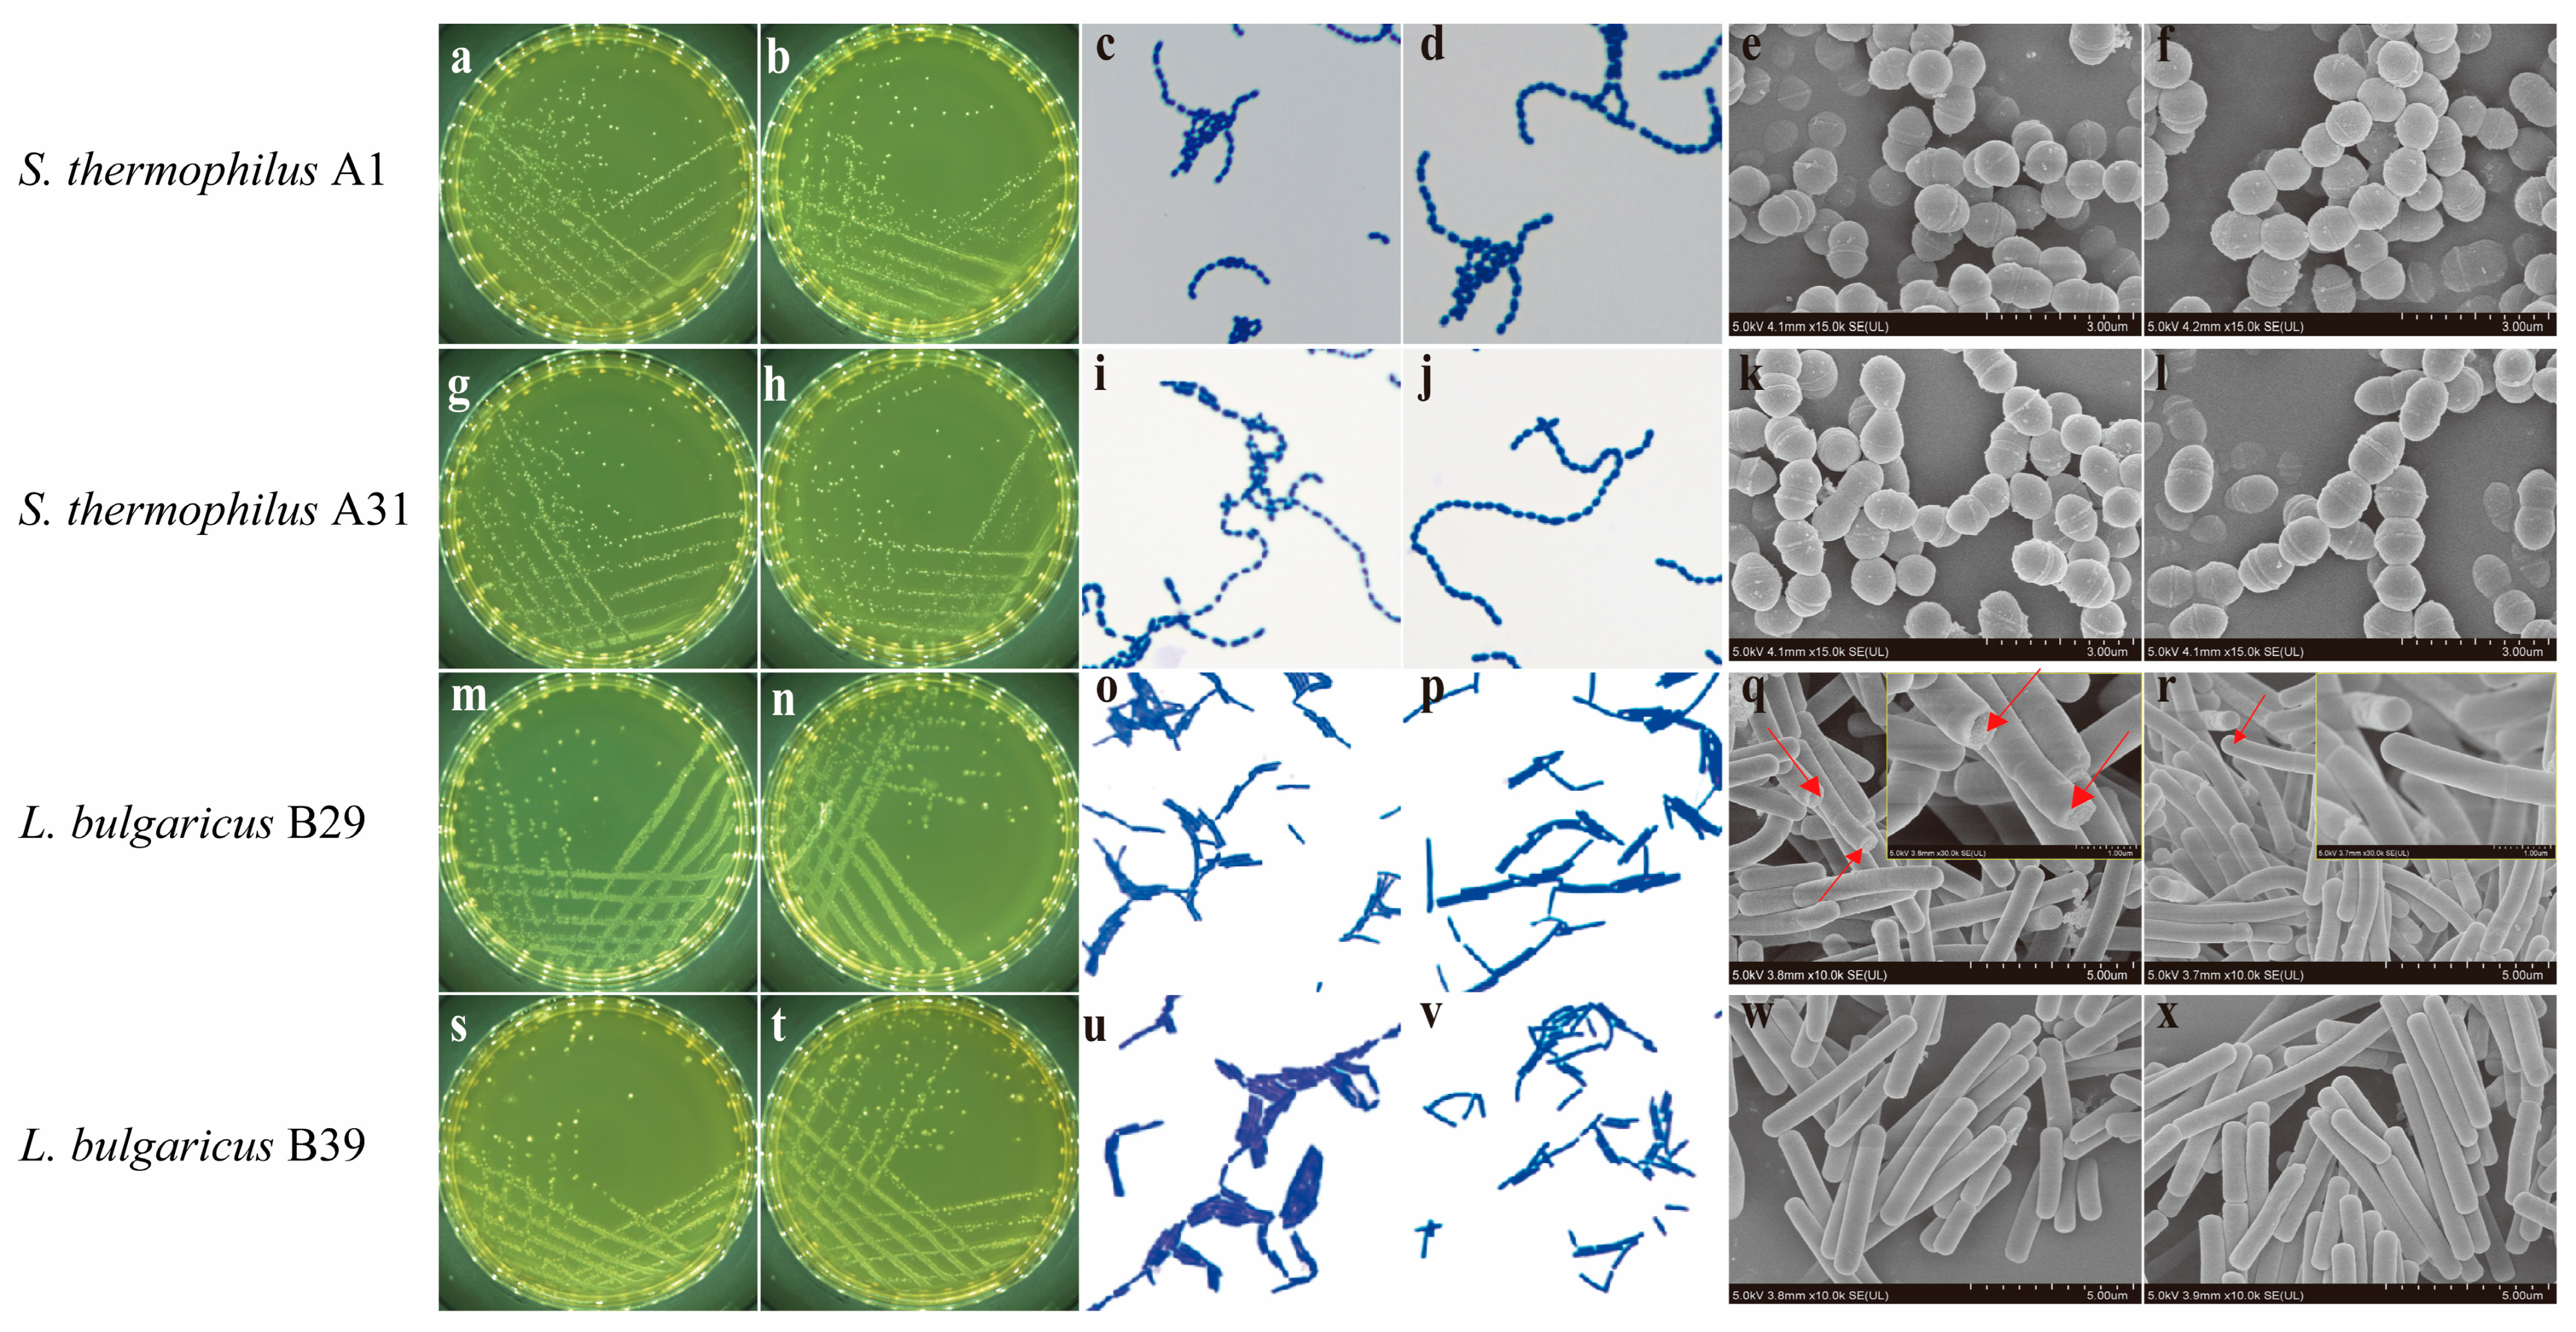
The colony and cell morphology of S. thermophilus and L. bulgaricus were monitored throughout serial subculturing. Colonies of wild-type S. thermophilus displayed a milky-white to grayish-white appearance, with diameters ranging from 0.5 to 2 mm. They appeared round, convex, and well-defined and exhibited smooth and moist surfaces (Figure 1a,g and Figure S1). The diameter of colonies of wild-type L. bulgaricus was 1–3 mm, appearing as round, convex, milky-white colonies with smooth and moist surfaces (Figure 1m,s and Figure S1). Regarding cellular morphology, S. thermophilus mainly formed short- to medium-length chains (Figure 1c,i and Figure S1), whereas L. bulgaricus predominantly occurred in pairs, clusters, or short chains (Figure 1o,u and Figure S1). After 2000 generations of continuous subculturing, both the colony and cellular morphology of the strains remained unchanged. S. thermophilus colonies retained their milky-white to grayish-white color, diameter (0.5–2 mm), and smooth, convex, well-defined structure (Figure 1b,h and Figure S1), while the cells continued to form short- to medium-length chains (Figure 1d,j and Figure S1), showing no significant differences compared with the wild-type strains. Similarly, L. bulgaricus colonies remained round, convex, milky-white, and 1–3 mm in diameter, with smooth and moist surfaces (Figure 1n,t and Figure S1). Cells still occurred predominantly in pairs, clusters, or short chains (Figure 1p,v and Figure S1), consistent with the wild-type strains.
Figure 1.
Colony and cellular morphology of S. thermophilus and L. bulgaricus: (a) colony morphology of wild-type S. thermophilus A1; (b) colony morphology after 2000 generations of continuous subculturing; (c) light microscopy image of wild-type S. thermophilus A1; (d) light microscopy after 2000 generations; (e) SEM image of wild-type S. thermophilus A1; (f) SEM image after 2000 generations. (g–l) S. thermophilus A4; (m–r) L. bulgaricus B29; (s–x) L. bulgaricus B39. For each strain group, the panel sequence is identical: colony morphology, light microscopy, and SEM image of the wild-type strain, followed by the corresponding image of the strain after 2000 generations of continuous subculture. Colony morphology images were photographed at a 1:1 scale without magnification. Light microscopy images were obtained using a 10× eyepiece and a 100× oil-immersion objective. SEM images were captured at 15,000× magnification for S. thermophilus and 10,000× magnification for L. bulgaricus. The red arrows in (q) indicate cell wall defects and fracture zones observable in the wild-type strain of L. bulgaricus B29. These defects have recovered after 2000 generations, as shown in (r).
Morphological alterations during prolonged serial subculturing were further examined using SEM. After 2000 generations, the wild-type S. thermophilus A1 shifted from short chains composed of 2–5 cellular units to medium-long chains comprising 10–15 units (Figure 1e,f). In contrast, S. thermophilus A4, A31, A37, and A72 remained stable, retaining their original chain-length architecture (Figure 1k,l and Figure S1). Previous reports have shown that chain length in streptococci may be regulated by extracellular polysaccharides or autolysins. For example, Shibata et al. [15] identified the atlA gene in Streptococcus mutans, which encoded the major autolysin AtlA. The disruption of AtlA significantly reduced autolytic activity and resulted in impaired daughter cell separation, thus elongating cellular chains. SEM results for L. bulgaricus revealed that cells generally displayed smooth, well-defined surfaces and occurred primarily as single cells or short chains. However, a morphological change was observed in the specific wild-type strain L. bulgaricus B29. Initially, this strain exhibited visible cell wall defects and fractures (Figure 1q). Remarkably, after 2000 generations of serial subculture, its cellular morphology appeared more intact, with previously fractured surfaces showing signs of restoration, resulting in smoother and more defined structures (Figure 1r). This phenomenon indicates that prolonged subculturing under stable conditions contributed to enhanced cell wall integrity in this particular strain. In contrast, no such morphological deterioration or recovery was observed in the wild-type strains L. bulgaricus B39 and B43; these strains retained intact cellular morphology throughout 2000 passages (Figure 1w,x and Figure S1). The distinct morphological trajectory observed in strain B29 may be attributed to adaptive modifications in cell wall constituents, such as peptidoglycan, teichoic acids, and surface-associated proteins, which are known to modulate structural integrity [16]. This adaptive response is consistent with findings in other lactic acid bacteria, such as Lactiplantibacillus plantarum, which can upregulate the biosynthesis of structural cell wall components to mitigate cellular damage under stress [17].
2.2. Assessment of Growth Characteristics and Fermentation Activity After Continuous Subculture
After S. thermophilus and L. bulgaricus were continuously subcultured, the growth characteristics and fermentation performance of the strains were evaluated by measuring the pH of the culture medium and OD600 values. In wild-type S. thermophilus strains (A1, A4, A31, A37, and A72), the pH values ranged from 4.71 to 4.81, with OD600 values between 1.39 and 1.50 (Table 1). After 2000 generations of subculturing, the pH value ranged from 4.64 to 4.74, and OD600 values were between 1.39 and 1.55 (Table 1). Notably, the pH of S. thermophilus A37 significantly decreased from 4.81 to 4.64, while its OD600 significantly increased from 1.48 to 1.53 (p < 0.05) compared with the wild-type strain.
Table 1.
Growth characteristics of S. thermophilus and L. bulgaricus in the wild-type strain and generation 2000 during continuous subculturing. One viability unit (U) is defined as 1 μmol of lactic acid per 1 × 10⁷ CFU of bacterial cells during the fermentation of 1 mL of milk under the above conditions. All assays were performed in triplicate, and data are expressed as mean ± standard deviation (SD). Values in the same row that share a lowercase letter (a, b) are not significantly different; different letters indicate statistically significant differences (p < 0.05) between 0 generations and after 2000 generations of the same strain, as determined by one-way ANOVA followed by Tukey’s multiple comparison test.
In contrast, the wild-type L. bulgaricus strains (B29, B39, and B43) showed lower medium pH values, ranging from 4.30 to 4.48, and higher OD600 readings between 1.99 and 2.10 (Table 1). After 2000 generations of subculturing, these strains demonstrated a further decrease in medium pH (4.07–4.33) and an increase in OD600 (2.06–2.19), indicating enhanced growth and acidification capacity relative to the S. thermophilus group. Among them, L. bulgaricus B29 exhibited a pH decrease of 0.23 and an increase in OD600 (0.09). Although the absolute pH difference may appear numerically small, a shift of 0.23 units corresponds to a substantial change in proton concentration, reflecting a physiologically meaningful enhancement in acid production. Collectively, the results indicate that long-term subculturing improved both acidification capacity and biomass accumulation in the evaluated strains.
Fermentation activity significantly increased in both species after 2000 generations (Table 1) (p < 0.05). Notably, after 2000 passages, the fermentation activity of S. thermophilus (A4 and A36) exceeded 60 U, while that of L. bulgaricus B29 and B43 was approximately 62.41 U and 61.9 U, respectively, indicating excellent fermentation performance. Prolonged adaptation of wild-type starter cultures in lactose-containing media can change key enzyme activities related to metabolic regulation and energy utilization efficiency, thereby enhancing environmental adaptability. For example, Yu et al. reported that elevated β-galactosidase and urease activities enhanced lactose metabolism in different S. thermophilus strains, improving fermentation performance [18].
2.3. Carbohydrate Metabolic Profiling
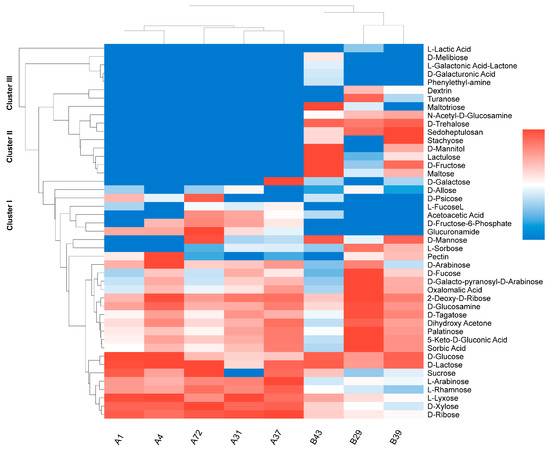
Phenotypic MicroArray (PM) technology, a high-throughput platform that enables systematic assessment of cellular phenotypes such as carbon source utilization and metabolic activity, was used on the OmniLog™ system to comparatively analyze the carbon utilization profiles of L. bulgaricus across 46 distinct carbon sources. By analyzing the carbon utilization profiles of 2000 generations of strains, it was found that S. thermophilus utilized 28 carbon sources, while L. bulgaricus metabolized 43 carbon sources (Figure 2). The utilization profiles were clearly segregated into three distinct metabolic clusters (Clusters I–III).
Figure 2.
Heatmap and hierarchical cluster analysis of carbon source utilization by S. thermophilus and L. bulgaricus strains. The heatmap displays the phenotypic profiles of 46 carbon sources obtained using phenotype microarray (PM) technology. Color intensity represents relative utilization levels: red, high; white, moderate; blue, low or no utilization. Hierarchical clustering was performed using the UPGMA algorithm with Euclidean distance matrices, revealing three distinct metabolic clusters (Clusters I–III) that illustrate species- and strain-specific differences in carbohydrate metabolism between the two LAB.
Cluster I, co-driven by S. thermophilus and L. bulgaricus, consisted of monosaccharides, disaccharides, and metabolic intermediates. Monosaccharides in Cluster I included fundamental hexoses, such as D-glucose, D-galactose, and D-mannose, and pentoses, such as D-xylose, D-ribose, L-arabinose, and L-lyxose (Figure 2). In addition, Cluster I contained monosaccharide epimers, including epimers of glucose or fructose (e.g., D-allose, D-psicose, and D-tagatose) and 6-deoxy rare hexoses (e.g., L-fucose, D-fucose, and L-rhamnose) (Figure 2). Notably, S. thermophilus effectively metabolized L-arabinose, L-rhamnose, L-lyxose, and D-xylose, whereas L. bulgaricus weakly utilized these sugars (Figure 2). This difference might be attributed to the distinct ecological adaptations and genomic metabolic potentials of the two species. Cluster I contained some metabolic intermediates, such as D-fructose-6-phosphate and dihydroxyacetone. Dihydroxyacetone can be phosphorylated by dihydroxyacetone kinase and subsequently enter the EMP pathway for further metabolism [19].
Cluster II is mainly driven by L. bulgaricus and comprises oligosaccharides (e.g., dextrin, stachyose, maltotriose), functional disaccharides (e.g., maltose, turanose, lactulose), and sugar alcohols (Figure 2). The carbon sources in Cluster II are predominantly derived from plant or starch sources, and their utilization typically depends on starch hydrolysis systems involving key enzymes, including α-glucosidase [20,21] and trehalose-6-phosphate hydrolase [22]. Notably, D-trehalose serves as a carbon source and significantly enhances bacterial tolerance to processing stress, dehydration, and freezing conditions [23,24]. The carbon source utilization profile of Cluster II highlights the significant advantage of L. bulgaricus strains in metabolizing sugar alcohols and oligosaccharides, reflecting their adaptive capacity to complex environmental substrates.
Cluster III, distinct from clusters I and II, represents strains with specialized substrate-utilization capabilities, such as L. bulgaricus B43. This strain can utilize D-melibiose, L-galactonic acid-δ-lactone, D-galacturonic acid, and phenylethylamine (Figure 2). L-galactonic acid-δ-lactone is a characteristic intermediate produced during pectin decomposition, while D-galacturonic acid is a primary component of plant cell wall pectin. In prokaryotes, D-galacturonic acid is catabolized through two principal pathways: an oxidative route and an isomerization pathway [25,26]. Additionally, we observed that the carbohydrate utilization profiles of S. thermophilus and L. bulgaricus remained stable between wild-type strains and 2000 generations, indicating that their carbohydrate metabolic capabilities remained consistent.
2.4. Analysis of Microbial Growth Kinetics
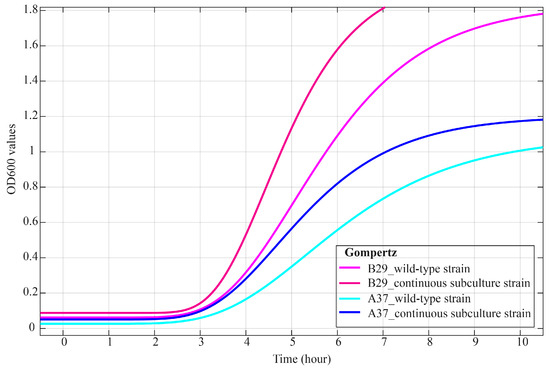
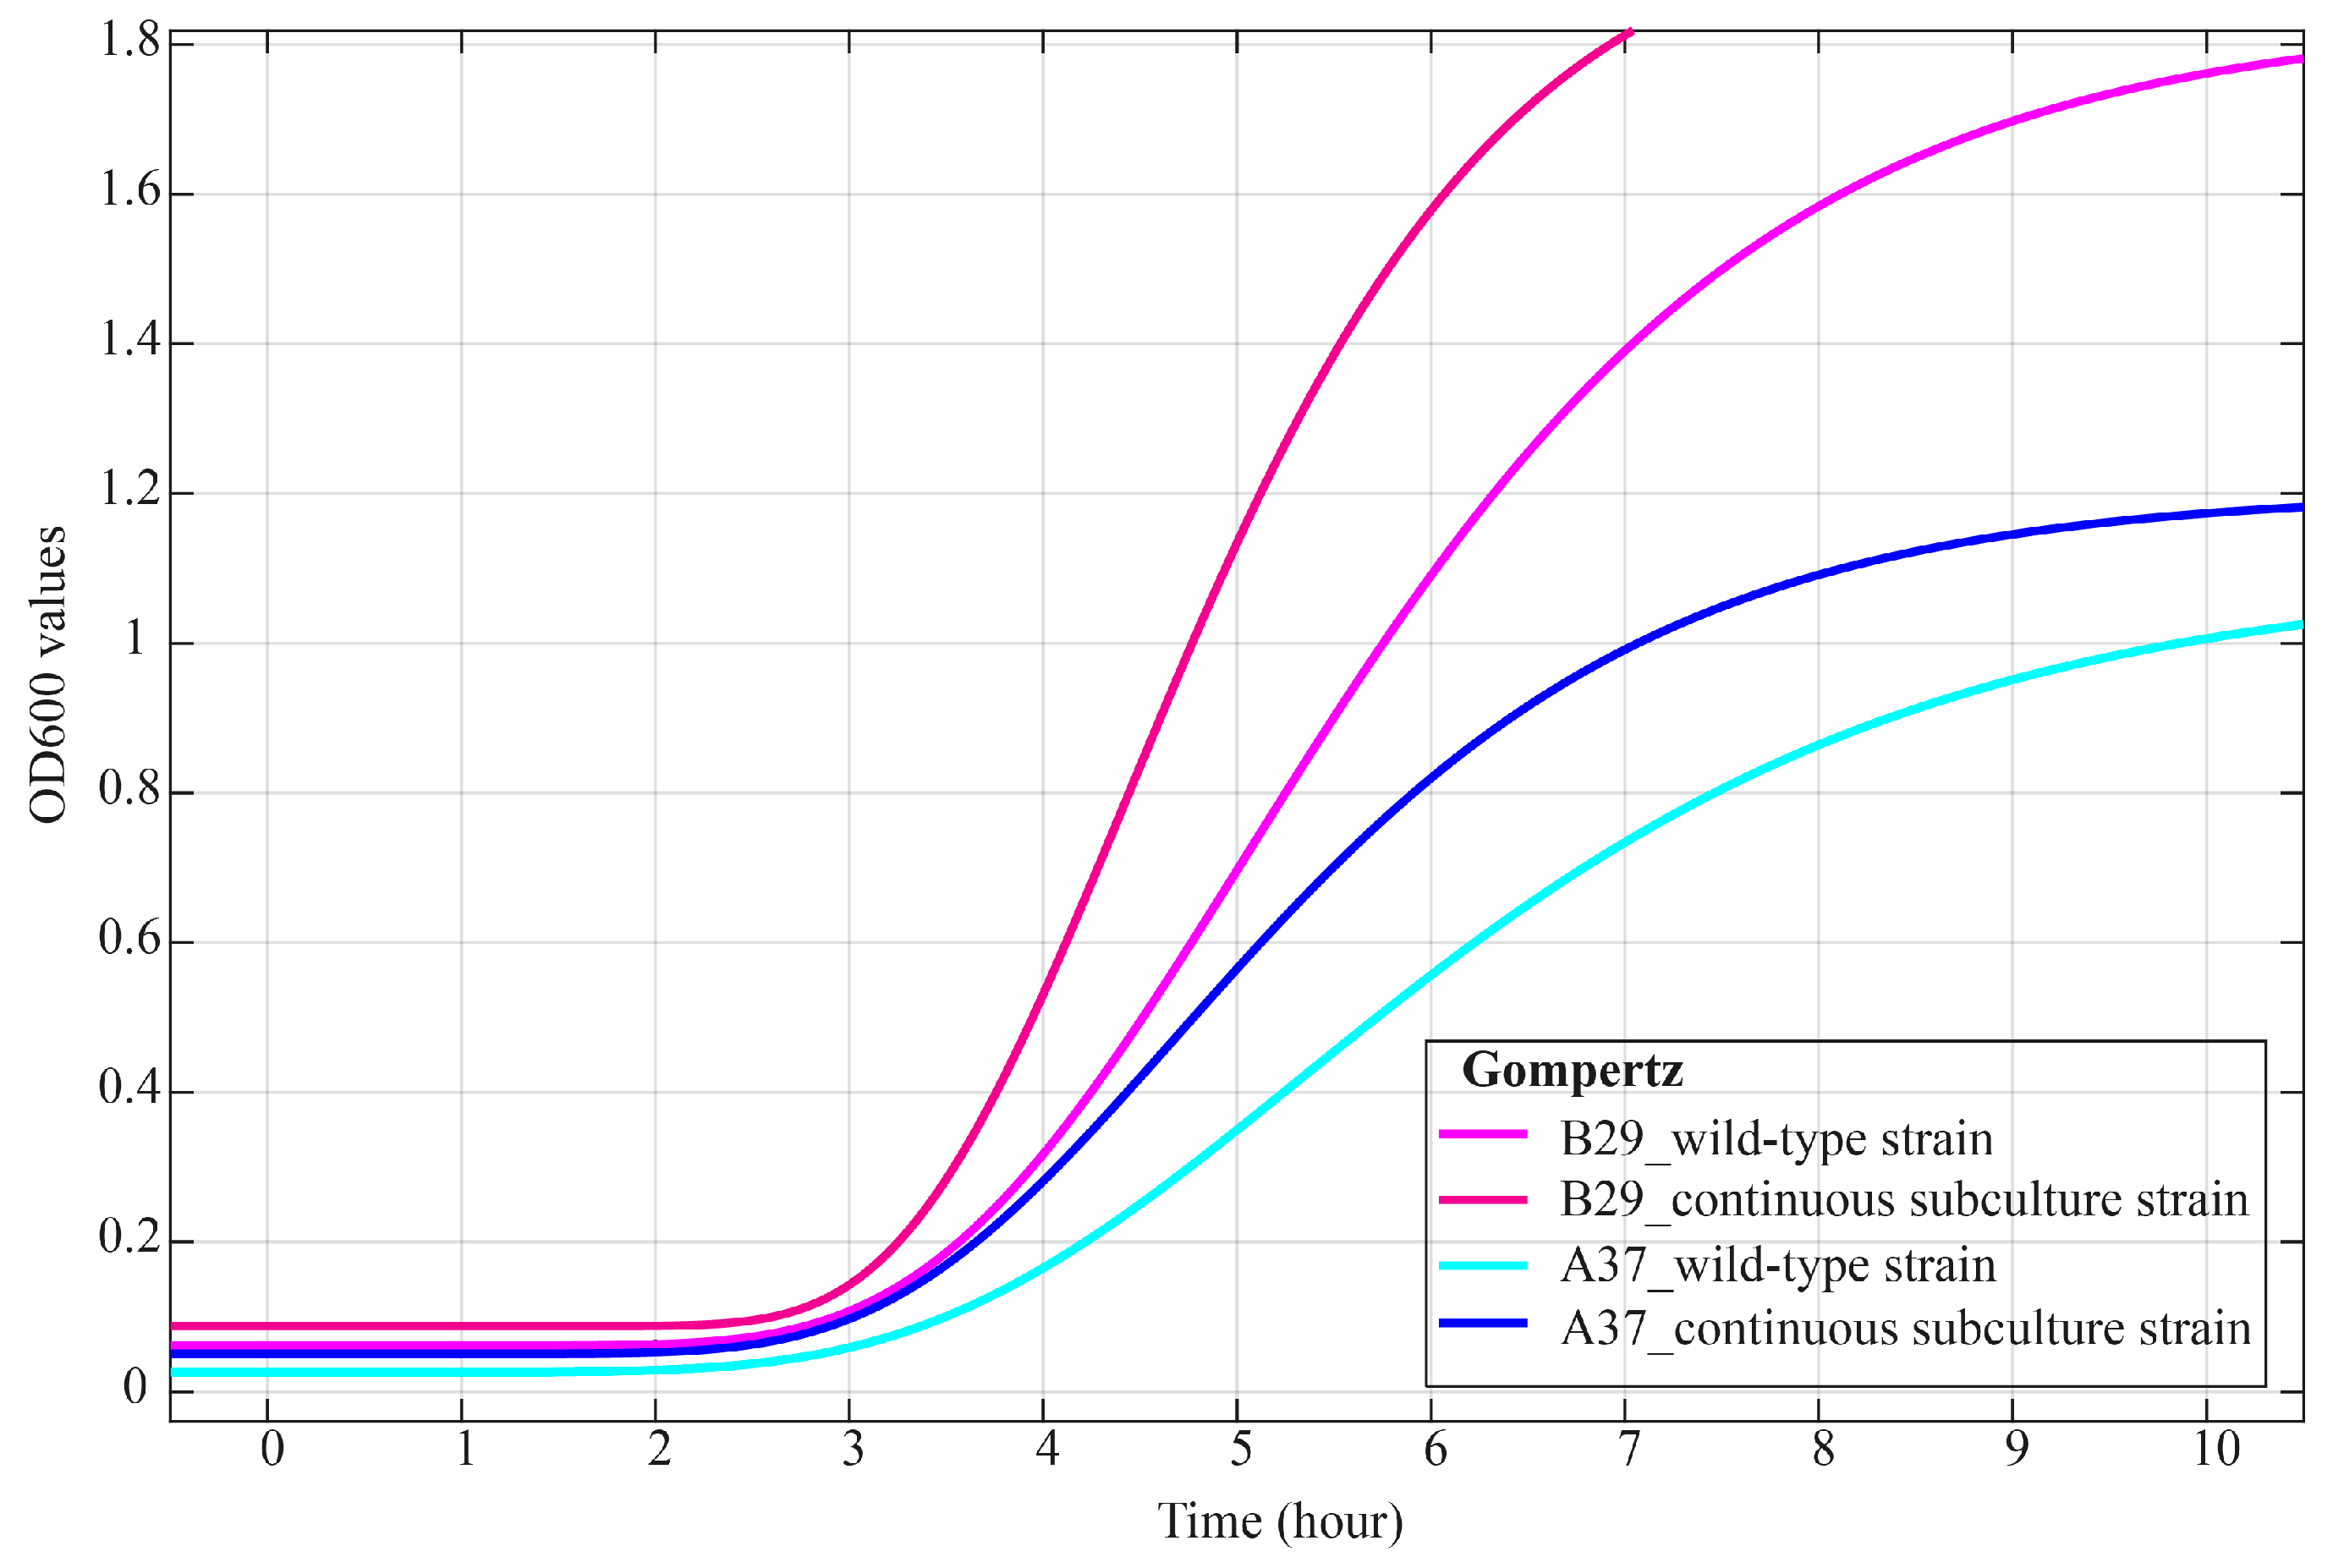
Based on morphological observations, growth performance, fermentation activity, and carbohydrate metabolism profiling, S. thermophilus A37 and L. bulgaricus B29 were selected for microbial growth kinetics analysis. Both strains exhibited adaptive changes after long-term serial passage. The OD600 values of both wild-type (generation 0) and 2000-generation passaged strains were monitored at 1 h intervals to assess their growth curves. The Gompertz model was used to fit the growth curves of wild-type and 2000-generation passaged strains of S. thermophilus A37 and L. bulgaricus B29. The adjusted coefficient of determination (adjusted R2) and the root mean square error (RMSE) were used to assess the model performance. As shown in Table 2, all strains exhibited a high goodness of fit, with adjusted R2 values exceeding 0.995 (ranging from 0.996 to 0.997) and consistently low RMSE values ranging from 0.025 to 0.047. These results show that the Gompertz model accurately captures the growth dynamics of both species under the tested conditions and can be reliably used to compare kinetic parameters between wild-type and long-term subcultured strains. Growth curves of S. thermophilus A37 and L. bulgaricus B29, both in their wild-type and after 2000 generations of continuous subculturing, were obtained during monoculture in MRS medium with lactose substituted for glucose. The growth curves of both strains exhibited a characteristic asymmetric sigmoidal shape, with clearly distinguishable lag, exponential, and stationary phases (Figure 3 and Figure S1). For S. thermophilus A37, the lag phase duration (λ) decreased from 5.323 h in the wild-type strain to 4.688 h in the passaged strain. The corresponding viable counts at 3 h were 7.32 log10 CFU/mL in the passaged strain, compared with 7.20 log10 CFU/mL in the wild-type strain (Table 2). After entering the exponential phase, the maximum specific growth rate (Rm) of the subcultured strain increased from 0.536 to 0.691, indicating accelerated growth (Table 2). Viable counts of the passaged strain were 8.38 log10 CFU/mL, significantly higher than that of the wild-type strain (7.90 log10 CFU/mL; p < 0.05) (Table 2). In the stationary phase, the maximum cell density (Nmax) was 1.203, with peak viable counts observed at 8 h (8.70 log10 CFU/mL for the passaged strain vs. 8.50 log10 CFU/mL for the wild-type).
Table 2.
Growth kinetic parameters of S. thermophilus A37 and L. bulgaricus B29 were determined in both wild-type strains and after 2000 generations of continuous subculturing. Growth dynamics were modeled using the Gompertz equation. The analyzed parameters included Nmax (maximum cell density, corresponding to OD600), Rm (maximum specific growth rate), λ (lag phase duration, h), N0 (initial cell density), root mean square error (RMSE), and adjusted R2 (adjusted coefficient of determination). Bacterial counts were measured at different cultivation times (0, 2, 3, 5, and 8 h). All experiments measuring viable cell counts were performed in triplicate, and data are expressed as mean ± standard deviation (SD). Within the same row, different lowercase letters (a, b) indicate significant differences in viable cell counts at different time points for the same strain (p < 0.05).
Figure 3.
Gompertz model fitting of S. thermophilus A37 and L. bulgaricus B29 in wild-type strains and after 2000 generations of continuous subculturing. Growth curves were modeled using OD600 values.
The growth of L. bulgaricus B29 was more pronounced after long-term subculture. Compared with the wild-type strain, the lag phase duration (λ) of the 2000 generation strain reduced from 5.043 h to 4.427 h, and the Rm during the exponential phase increased from 0.634 to 0.887, representing a 28.8% increase. This phenomenon was further confirmed by microbial population dynamics. Although initial inoculum levels were similar, at the end of the lag phase (3 h), the viable counts of the passaged strain (6.78 log10 CFU/mL) exceeded those of the wild-type strain (6.24 log10 CFU/mL). During the exponential phase (approximately 5 h), viable counts of the passaged strain were 7.64 log10 CFU/mL, which were significantly higher than the 7.15 log10 CFU/mL recorded for the wild-type strain (p < 0.05). After the stationary phase (8 h), the viable counts of the passaged strain became 7.89 log10 CFU/mL. These results show that long-term continuous subculturing significantly enhances the growth performance of both S. thermophilus A37 and L. bulgaricus B29.
2.5. S. thermophilus and L. bulgaricus Genome Sequences
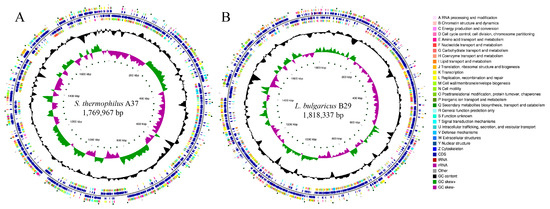
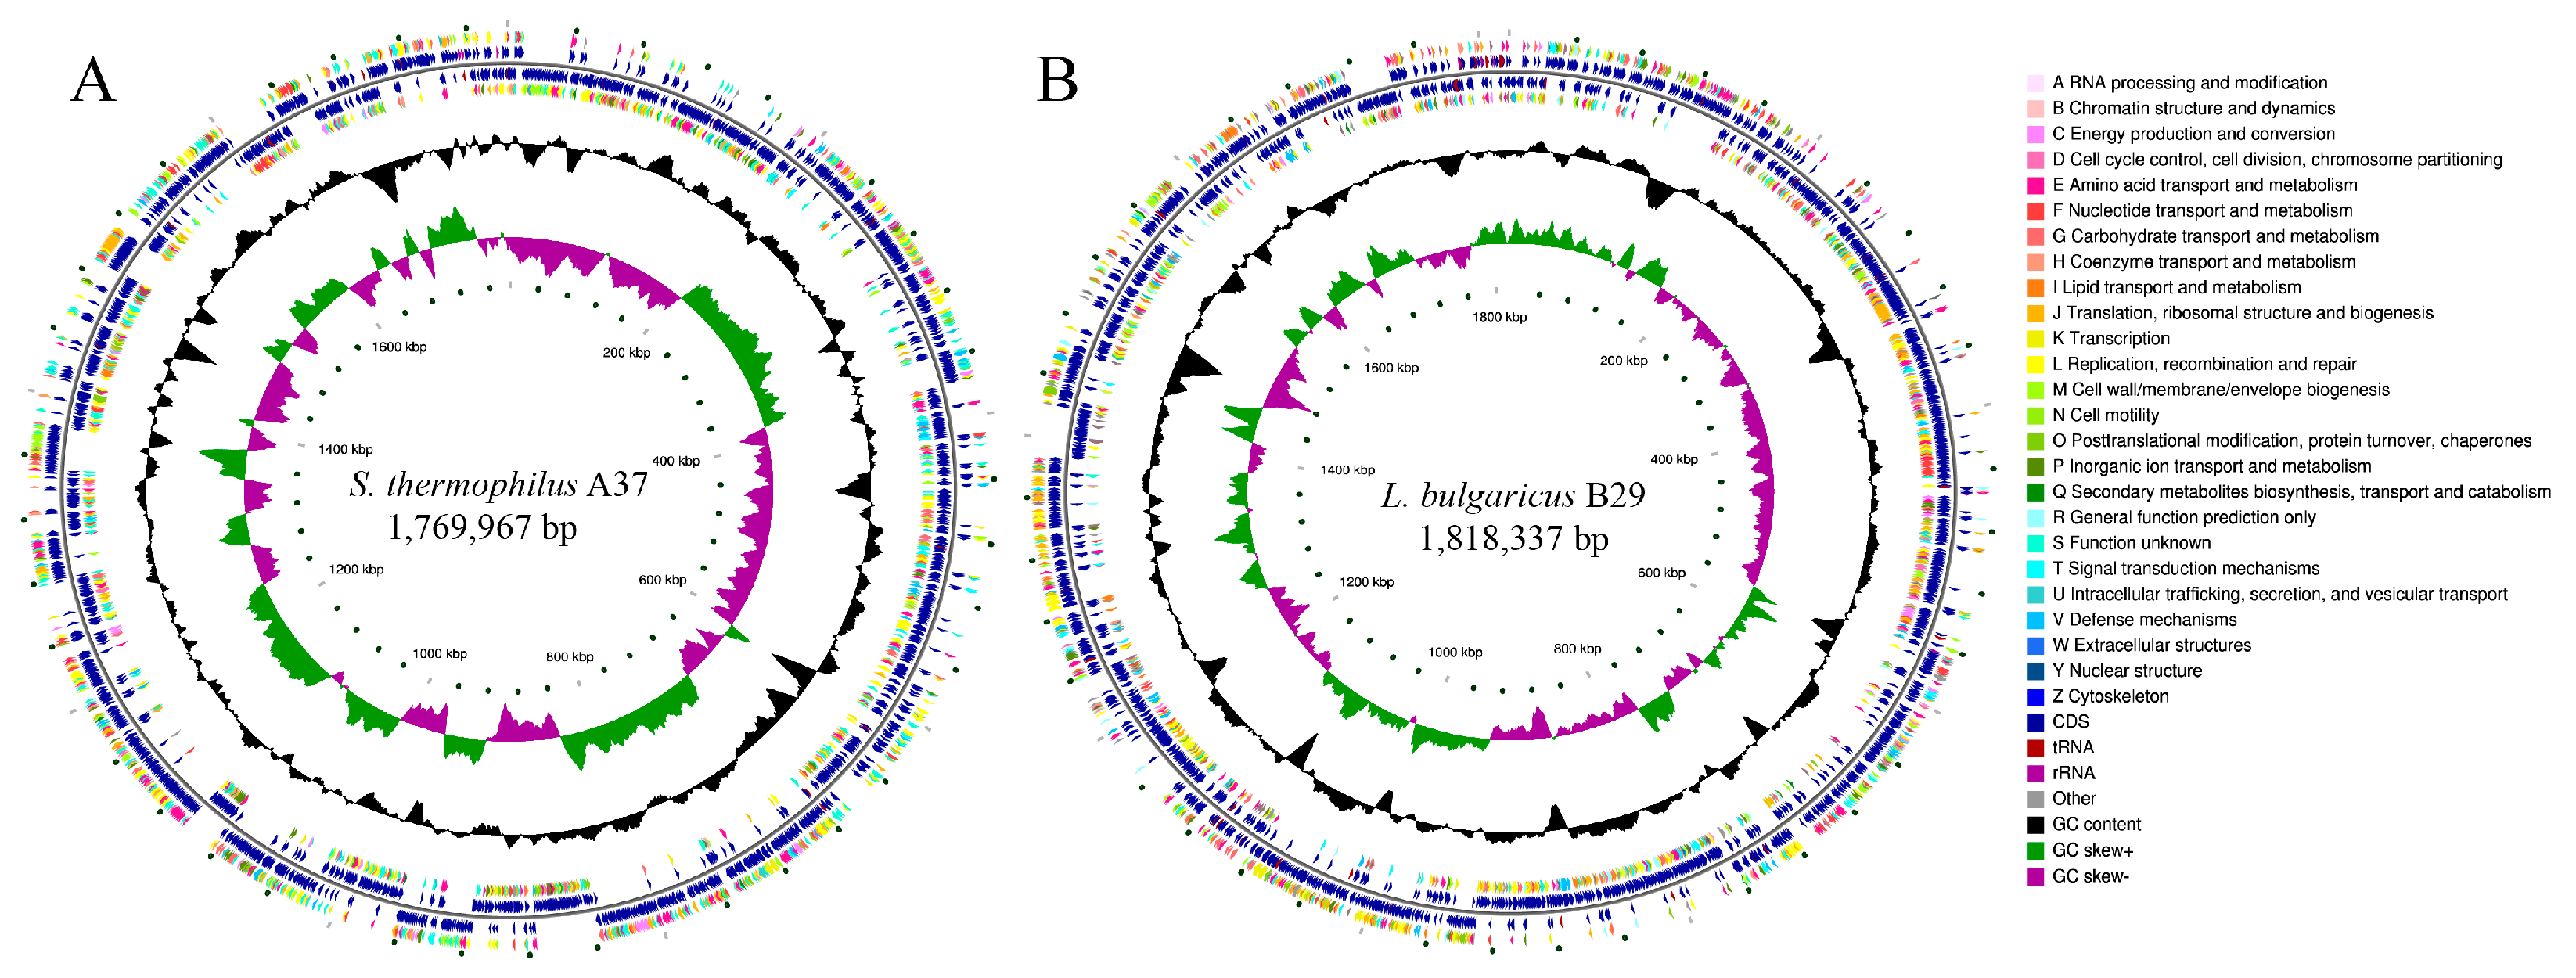
Genome sequencing of S. thermophilus and L. bulgaricus strains after 2000 generations of continuous subculturing revealed that the genome sizes of S. thermophilus isolates ranged from 1,769,967 to 1,789,462 bp, with GC contents between 38.93% and 38.95% (Figure 4A). In comparison, the genomes of L. bulgaricus strains ranged from 1,776,843 to 1,818,337 bp, with GC contents ranging from 49.81% to 49.85% (Figure 4B). These genomic characteristics are consistent with those reported for other commonly used starter strains. The genomic analysis revealed that S. thermophilus strains contained between 1882 and 1900 predicted coding sequences (CDSs) and 31–43 structural RNAs, including rRNA and tRNA (Table 3). Compared with S. thermophilus, L. bulgaricus strains possessed 1843–1877 CDSs and 81–90 structural RNAs (Table 3). No active prophages were detected within the genomic sequences of either S. thermophilus or L. bulgaricus using PHAST. GC content variation is widely believed to be a mutational bias. The genomic GC content of S. thermophilus was significantly lower than that of L. bulgaricus. The genome sequencing results of S. thermophilus were consistent with previous studies. For example, Kapse et al. reported that S. thermophilus MCC0200 possesses a circular chromosome of 1,855,815 bp with an average GC content of 39.1% [27]. Similarly, Alexandraki et al. analyzed 23 fully sequenced S. thermophilus genomes, which ranged from 1.73 to 2.10 Mb with an average GC content of 39.0% [28]. In contrast, L. bulgaricus strains generally have larger and more GC-rich genomes. Shehata et al. reported genome sizes of 1,752,493 bp and 1,759,908 bp with GC contents of 49.80% and 49.90% for strains L. bulgaricus CBC-LB69 and L. bulgaricus CBC-LB8 [29], respectively. Hao et al. found that L. bulgaricus 2038 has a genome length of approximately 1,872,907 bp and an average GC content of 49.68% [30]. Overall, the genomes of L. bulgaricus strains are larger and have higher GC content than those of S. thermophilus.
Figure 4.
The circular map of S. thermophilus A37 and L. bulgaricus B29. (A) circular map of S. thermophilus A37; (B) circular map of L. bulgaricus B29. This circular genome visualization comprises six concentric rings. The first and fourth rings depict coding sequences (CDS) on the positive and negative strands, colored by COG category. The second and third rings show the positions of CDS, tRNA, and rRNA. The fifth ring displays GC content, with red peaks (outward) indicating values above the genome average and blue peaks (inward) below it; peak height reflects the magnitude of deviation. The sixth ring represents GC skew, which helps distinguish the leading from the lagging strand and locate the replication origin in circular genomes. The innermost ring indicates the genome size.
Table 3.
The general genomic characteristics of five S. thermophilus and three L. bulgaricus strains. The table includes assembly statistics and functional annotations based on COG and KEGG subsystems. Functional comparison of metabolic genes across these strains was performed using Diamond, with an E-value cutoff set at ≤1 × 10⁻⁵.
2.6. Differences in Carbon Source Metabolism Between S. thermophilus and L. bulgaricus
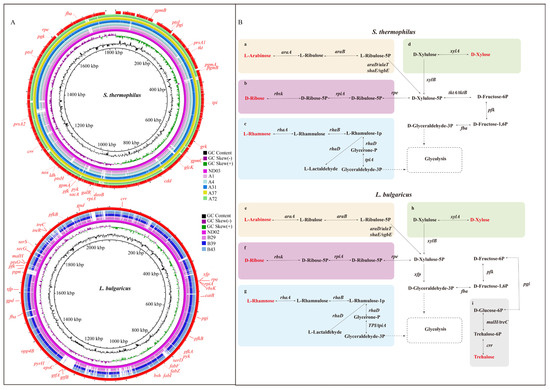
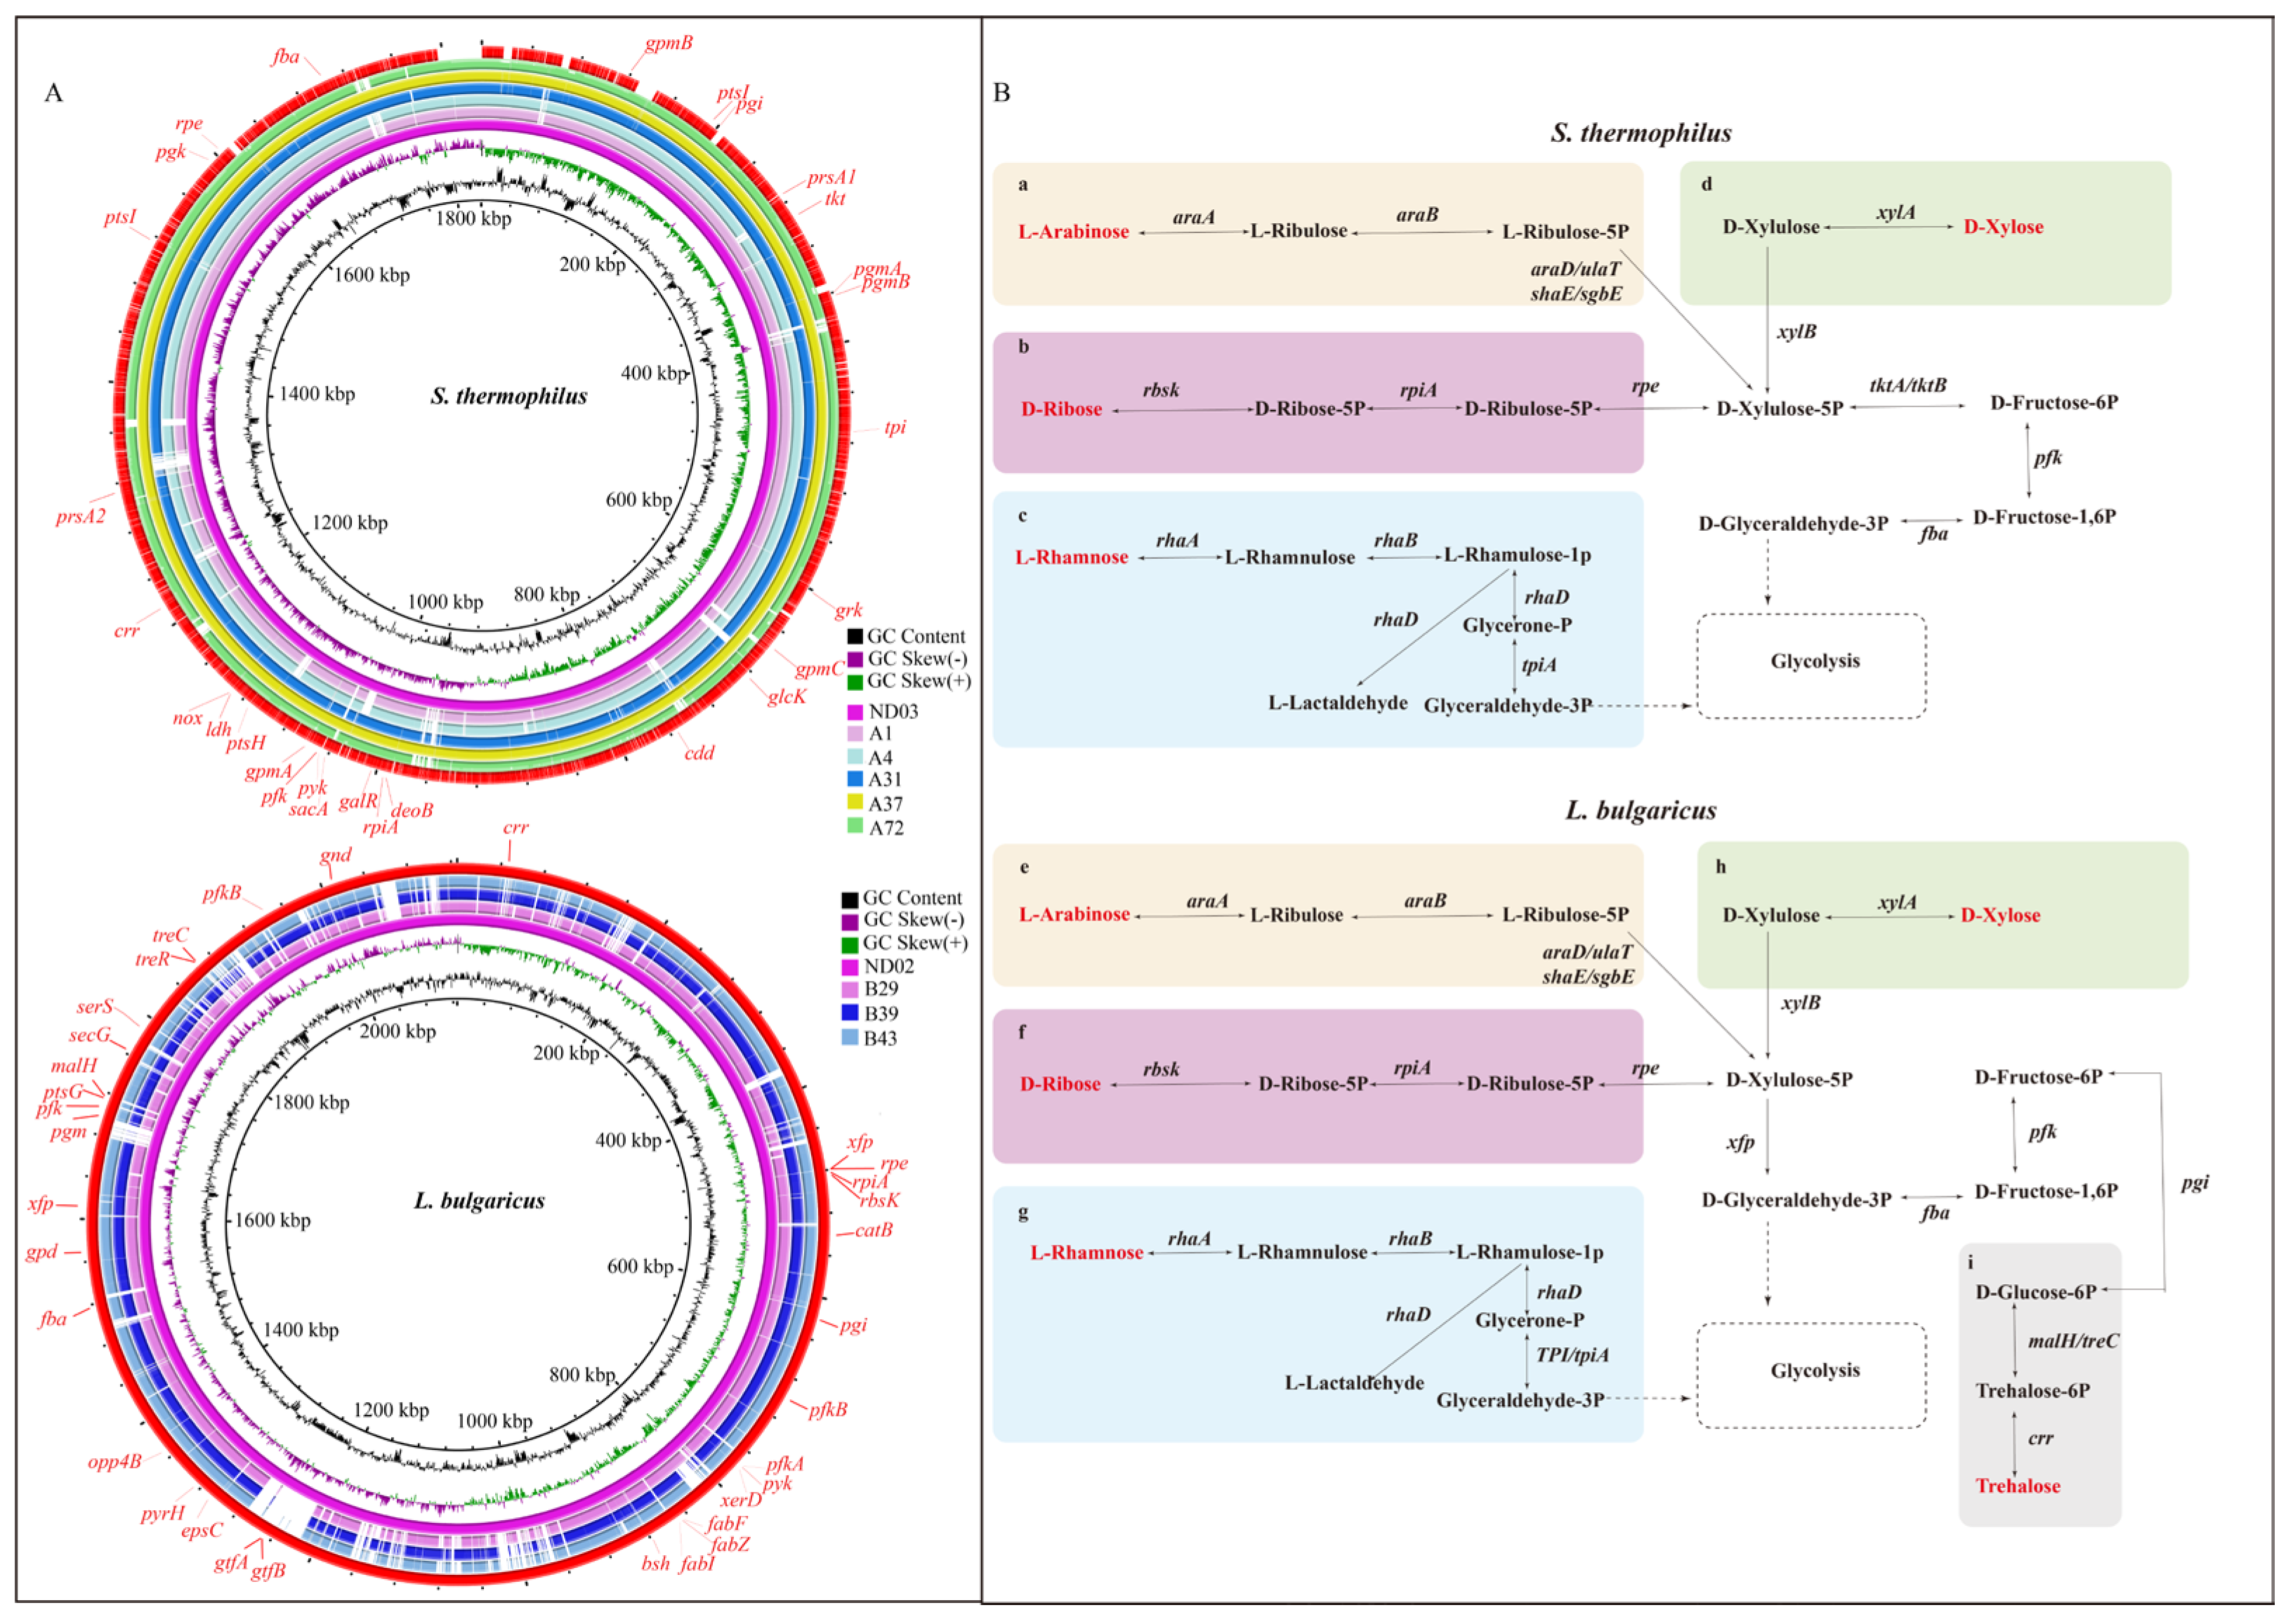
After continuous subculturing of S. thermophilus and L. bulgaricus strains, a comparative genomic analysis was conducted on five S. thermophilus strains (A1, A4, A31, A37, and A72) and three L. bulgaricus strains (B29, B39, and B43), using S. thermophilus ND03 and L. bulgaricus ND02 as reference genomes. The analysis mainly focused on the utilization of carbon sources, with emphasis on the metabolism of D-ribose, L-arabinose, L-rhamnose, D-xylose, and trehalose. S. thermophilus generally retains the genes associated with pentose metabolism and central carbon metabolism, including the pentose phosphate pathway (PPP), such as tktA/B (transketolase), pfk (phosphofructokinase), and fba (aldolase), which encode the corresponding enzymes and collectively constitute the core metabolic module of the PPP (Figure 5A). The catabolic pathways of D-ribose, L-arabinose, and D-xylose converged into the PPP through the intermediate xylulose-5-phosphate (Xu5P). Xu5P was subsequently funneled into central carbon metabolism, where transketolase- and transaldolase-catalyzed reactions converted PPP intermediates into D-fructose-6-phosphate (F6P) through the catalysis of transketolase (tktA/B). F6P was phosphorylated by phosphofructokinase (pfk) to generate D-fructose-1,6-bisphosphate (F1,6BP). Finally, aldolase (fba) catalyzed the cleavage of F1,6BP into glyceraldehyde-3-phosphate and dihydroxyacetone phosphate (Figure 5B). In S. thermophilus, the D-ribose metabolic pathway was facilitated by rpiA and rpe genes. These genes encoded enzymes that catalyzed the conversion of D-ribose-5-phosphate and D-ribulose-5-phosphate into D-xylulose-5-phosphate, which subsequently entered the PPP. However, the rbsK gene was absent in S. thermophilus, thereby limiting its ability to initiate complete ribose catabolism.
Figure 5.
(A) Comparative analysis of carbohydrate metabolism–related genes in S. thermophilus and L. bulgaricus. The upper panel illustrates whole-genome comparisons of five S. thermophilus strains against the reference genome S. thermophilus ND03, while the lower panel compares three L. bulgaricus strains with the reference genome L. bulgaricus ND02. (B) Schematic representation of carbohydrate catabolic pathways in S. thermophilus and L. bulgaricus. Panels (a–d) correspond to pathways in S. thermophilus, whereas panels (e–i) correspond to those in L. bulgaricus. Yellow (L-arabinose), pink (D-ribose), blue (L-rhamnose), green (D-xylose), and gray (trehalose) modules represent the respective metabolic pathways. Solid arrows show metabolic flux direction, and dashed boxes highlight connections to glycolysis (EMP) and the PPP. The genes labeled (e.g., araA, rhaD, and xylB) denote key enzymes catalyzing the corresponding reactions.
In contrast, L. bulgaricus retained a complete D-ribose catabolic gene cluster (rbsK, rpiA, and rpe) (Figure 5A). The resulting metabolic flux sequentially proceeded through phosphorylation, isomerization, and epimerization to generate Xu5P, which was then cleaved by xylulose-5-phosphate phosphoketolase (xfp) into G3P and acetyl-phosphate, both of which entered central pyruvate metabolism (Figure 5B). Additionally, L. bulgaricus retained multiple genes associated with the metabolism of plant-derived sugars, particularly those involved in trehalose utilization, including crr, malH/treC, pgi, pfk, and fba (Figure 5A). Trehalose was imported and phosphorylated by the trehalose-specific PTS permease (crr). The resulting trehalose-6-phosphate was hydrolyzed by trehalose-6-phosphate hydrolase (malH/treC) to glucose and G6P. Then, G6P was sequentially metabolized by the pgi, pfk, and fba gene products, leading to the generation of C3 intermediates that feed into the pyruvate pathway (Figure 5B). Comparative genomic analysis between S. thermophilus and L. bulgaricus revealed distinct pentose metabolism strategies. Although S. thermophilus mainly uses the classic transketolase-dependent PPP, L. bulgaricus uses a more efficient phosphoketolase bypass that directly channels pentoses into central metabolism with fewer enzymatic steps [31], reflecting its evolutionary adaptation to dairy environments. Additionally, L. bulgaricus harbors a trehalose degradation gene cluster, enabling it to utilize the stress-protective sugar to enhance tolerance under adverse conditions, such as acid, cold, or desiccation [32,33].
2.7. Genetic Stability After Continuous Subculture
Whole-genome resequencing (average depth ≈ 1000×) was performed on S. thermophilus strains (A1, A4, A31, A37, and A72) and L. bulgaricus strains (B29, B39, and B43) after 2000 generations of continuous subculturing to identify SNPs and other genetic variations. As shown in Table 4, genomic alterations, including point mutations, insertions, deletions, and multiple nucleotide polymorphisms (MNPs), were detected in all S. thermophilus strains. For example, S. thermophilus A37 exhibited six SNPs, three MNPs, three insertions, and two deletions, whereas S. thermophilus A72 exhibited fewer variations, comprising four SNPs and two deletions. Similarly, L. bulgaricus strains exhibited comparable genomic variations. Among the strains, L. bulgaricus B39 presented the highest number of variations, a total of 15 SNPs, three MNPs, and one deletion, while L. bulgaricus B43 contained 12 SNPs, two insertions, and four deletions. Overall, the total number of genetic variations in S. thermophilus (A1, A4, A31, A37, and A72) and L. bulgaricus (B29, B39, and B43) remained limited after 2000 generations of continuous subculturing. Pightling et al. [34] proposed that fewer than 21 SNP differences in whole-genome sequencing data could be used as a threshold to support the conclusion that two or more bacterial genomes were closely related or identical. Our results meet this criterion, indicating that the subcultured strains retain high genomic identity with their progenitors, thus exhibiting excellent genetic stability under the experimental conditions.
Table 4.
Genomic mutation profiles of S. thermophilus and L. bulgaricus in the wild-type strain and generation 2000 during continuous subculturing.
Functional annotation and pathway enrichment analyses indicated that the identified variations (totaling fewer than 20 SNPs across all strains) were distributed among genes involved in diverse cellular processes, including basic metabolism and stress response. Importantly, no mutations were found in key genes or known regulatory elements directly associated with the pentose phosphate pathway (PPP) or the phosphoketolase pathway (PKP). Therefore, the current mutational profile does not support the notion that genetic mutations directly drove adaptive changes in the activity or flux of these specific pathways during long-term subculturing.
3. Materials and Methods
3.1. Continuous Subculturing of S. thermophilus and L. bulgaricus
The strains were inoculated at 2% (v/v) into the MRS medium in which lactose replaced glucose at a pH of 6.5. Serial subculturing was performed, with transfers conducted during the exponential growth phase, until the cumulative number of cell divisions reached approximately 2000 generations. The generation time (g) of Streptococcus salivarius subsp. thermophilus (S. thermophilus) and Lactobacillus delbrueckii subsp. bulgaricus (L. bulgaricus) during the exponential growth phase was calculated according to the following formula:
where t represents the cultivation time (h), N0 is the initial viable cell count (CFU/mL), Nt is the viable cell count (CFU/mL) at time t, and g denotes the generation time (h).
3.2. Measurement of pH, TA, and Viable Counts
Optical density (OD600) of the bacterial cultures was measured at 600 nm every 400 generations using a UV-2800A spectrophotometer (Unico Instrument Co., Ltd., Beijing, China). The pH of the culture sample was directly measured with a calibrated pH meter (Model S210, Mettler Toledo, Zurich, Switzerland). Viable counts of S. thermophilus and L. bulgaricus were determined by plating appropriate dilutions on M17 agar and MRS agar at an adjusted pH of 5.4, respectively. Plates were incubated at 42 °C for 48 h, and results were expressed as colony-forming units per gram of sample (CFU/g) [35]. All analyses were performed in triplicate using independently cultured samples.
3.3. Fermentation Vitality
Fermentation activity of strains was assessed every 400 passages during continuous subculturing, with all assays performed in triplicate. Activity was assessed by measuring the amount of acid produced during carbohydrate fermentation. Bacterial cells were inoculated into 10 mL of sterile skim milk at a concentration of 1 × 10⁷ CFU/mL and incubated at 42 °C for 24 h. After the incubation was complete, the samples were immediately cooled in an ice bath to terminate fermentation and then diluted with 20 mL of distilled water. The pH of the diluted samples was adjusted to 8.50–8.55 with 0.1 mol/L NaOH, and the endpoint was held for 30 s. The volume of NaOH consumed was recorded to calculate the lactic acid concentration, which was converted into activity units. One activity unit (U) was defined as the amount of lactic acid (1 μmol) produced by 107 cells during the fermentation of 1 mL of skim milk under the described conditions.
3.4. Scanning Electron Microscopy (SEM) Analysis
Subcultured strains were continuously harvested through centrifugation at 1000× g for 10 min. After the subcultured strains were washed twice with 10 mmol/L of phosphate-buffered saline (137 mM NaCl, 2.7 mM KCl, 10 mM Na2HPO4, and 2 mM KH2PO4; pH 7.4), the cell pellet was resuspended to a final concentration of 1 × 10⁵ CFU/mL. The cell suspension was fixed with 2.5% (v/v) glutaraldehyde and incubated at 4 °C for 24 h. After the mixture was centrifuged, the bacterial pellet was sequentially dehydrated with 30%, 50%, 70%, and 100% ethanol. The samples were lyophilized and subsequently gold-coated under vacuum (4.0 Pa) using an ion sputter coater (Hitachi MC1000, Hitachi High-Tech Corporation, Tokyo, Japan). A cold field-emission scanning electron microscope (Hitachi SU8010) operated at an accelerating voltage of 5 kV and a beam current of 10 μA was used to examine the morphology of the samples.
3.5. Growth Kinetics Modeling
The growth kinetics of S. thermophilus A37 and L. bulgaricus B29 were described using the Gompertz model. The four-parameter model is suitable for fitting asymmetric sigmoidal growth curves, characterized by initial lag, exponential growth, and stationary phases. The modified Gompertz equation was applied as follows:
where N(t) is the cell density (OD600) at time t (h); N0 is the initial cell density; Nm is the maximum cell density; λ is the lag phase duration (h); Rm is the maximum specific growth rate (h−1); and e is the base of the natural logarithm.
3.6. Whole-Genome Sequencing and Comparative Genome Analysis
Genomic DNA was extracted using the NEXTFLEX Rapid DNA-Seq Kit according to the manufacturer’s instructions. Drafts and complete genomes of five S. thermophilus and three L. bulgaricus strains were sequenced using the PacBio Sequel (Pacific Biosciences of California, Inc., Menlo Park, CA, USA)and the Illumina NovaSeq PE150 platform (Illumina, Inc., San Diego, CA, USA). Coding sequences (CDSs) were functionally annotated against the non-redundant, Swiss-Prot, Pfam, Gene Ontology, Clusters of Orthologous Genes (COG), and Kyoto Encyclopedia of Genes and Genomes (KEGG) databases with sequence alignment tools using BLASTP (NCBI BLAST+ version 2.17.0), Diamond, and HMMER. For each predicted protein, the annotation of the highest-scoring hit (e-value < 10−5) was retained. Genome-wide similarity was assessed using OrthoANIu (OrthoANI using USEARCH). Comparative genomic visualization was performed using the BLAST-based Circular Image Generator (v0.95).
3.7. Phenotypic Analyses
Carbon source utilization profiles of five S. thermophilus and three L. bulgaricus strains were analyzed using the Phenotype MicroArray system (Biolog, Hayward, CA, USA). PM1 and PM2A microplates were used to evaluate the metabolic capabilities of the strains toward different carbon sources [36]. Following the manufacturer’s protocol, the growth on MRS agar was suspended in IF-0a inoculating fluid to obtain a cell suspension with 81% light transmittance. Aliquots of 100 μL were dispensed into the wells of 96-well Phenotype MicroArray (PM) plates. Then, the plates were incubated in an OmniLog reader at 42 °C for 72 h. During incubation, the absorbance of the redox-sensitive dye G was automatically recorded every 15 min. Data were processed and analyzed using the OmniLog PM software 2.3.01 (Biolog) according to the manufacturer’s instructions.
3.8. Statistical Analysis and Genome Submission
Functional classification of protein-coding genes was performed using BLASTP (E-value ≤ 10−5) against NCBI COGs (Clusters of Orthologs), with a minimum identity of ≥30% and coverage of ≥30%. Sequence similarity was detected using BLAST, and multiple sequence alignments were conducted using Clustal 2.1. Putative carbohydrate metabolic pathways were predicted using KEGG. Data from growth characteristics, fermentation vitality, and phenotypic microarray analyses were analyzed using one-way analysis of variance (ANOVA). Each experiment was performed in triplicate, and pairwise comparisons of treatment means were conducted using Tukey’s test at p < 0.05 with Statistica, SPSS (27.0), and GraphPad Prism 8.0. All assembled genomes were submitted to the NCBI GenBank database (https://www.ncbi.nlm.nih.gov/) and assigned accession numbers. Strain designations and GenBank accession numbers were as follows: S. thermophilus A1 (PX945674); S. thermophilus A4 (PX945677); S. thermophilus A31 (PX945682); S. thermophilus A37 (PX945711); S. thermophilus A72 (PX945712); L. bulgaricus B29 (PX944889); L. bulgaricus B39 (PX944890); L. bulgaricus B43 (PX945891). Genome data of the reference genomes used for genome comparison were S. thermophilus ND03 (CP002340) and L. bulgaricus ND02 (CP002341.1).
4. Conclusions
In this study, after continuous subculturing for 2000 generations, both S. thermophilus and L. bulgaricus strains maintained stable colony and cellular morphology and retained high fermentative activity. Carbon utilization profiling revealed that S. thermophilus metabolized 28 carbon sources, including monosaccharides and disaccharides (e.g., L-arabinose), while L. bulgaricus utilized 43 substrates, including oligosaccharides, functional disaccharides, and sugar alcohols. Long-term subculturing significantly enhanced growth kinetics, which were confirmed by shortened lag phases, elevated maximum specific growth rates, and increased stationary-phase cell densities. Comparative genomic analysis revealed divergent metabolic strategies: L. bulgaricus used an efficient phosphoketolase-dependent bypass for pentose catabolism and possessed a trehalose degradation cluster, whereas S. thermophilus relied on the canonical transketolase-driven PPP. Whole-genome resequencing further confirmed that both species exhibited high genomic identity with their ancestral strains after prolonged subculturing, indicating robust genetic stability suitable for industrial applications. However, the mere presence of genes does not necessarily guarantee functional expression or metabolic flux. Further validation through transcriptomic, proteomic, enzymatic, or metabolic flux analyses would provide deeper insight into the active mechanisms underlying these metabolic pathways.
Supplementary Materials
The following supporting information can be downloaded at: https://www.mdpi.com/article/10.3390/ijms27062906/s1.
Author Contributions
Conceptualization, Y.Y., J.H. and X.L.; methodology, Y.Y., X.L. and J.Y.; software, B.L. and L.Z.; validation, Y.S. and Y.Z.; formal analysis, Y.Y. and H.F.; investigation, B.H.; data curation, Y.Y.; writing—original draft preparation, Y.Y.; writing—review and editing, R.W. and X.L.; visualization, Y.S.; supervision, X.L. and K.Z.; project administration, R.W.; funding acquisition, J.H. All authors have read and agreed to the published version of the manuscript.
Funding
This project was supported by grants from the National Center of Technology Innovation for Dairy (No. 2023-JSGG-16).
Institutional Review Board Statement
Not applicable.
Informed Consent Statement
Not applicable.
Data Availability Statement
The original contributions presented in this study are included in the article/Supplementary Materials. Further inquiries can be directed to the corresponding authors.
Conflicts of Interest
The authors declare no financial or personal conflicts of interest. The manuscript has been approved by all authors for publication.
References
- Aslam, H.; Marx, W.; Rocks, T.; Loughman, A.; Chandrasekaran, V.; Ruusunen, A.; Dawson, S.L.; West, M.; Mullarkey, E.; Pasco, J.A.; et al. The effects of dairy and dairy derivatives on the gut microbiota: A systematic literature review. Gut Microbes 2020, 12, 1799533. [Google Scholar] [CrossRef] [Scilit]
- Nestel, P.J.; Mori, T.A. Dairy foods: Beneficial effects of fermented products on cardiometabolic health. Curr. Nutr. Rep. 2023, 12, 478–485. [Google Scholar] [CrossRef] [Scilit] [PubMed]
- Savaiano, D.A.; Hutkins, R.W. Yogurt, cultured fermented milk, and health: A systematic review. Nutr. Rev. 2021, 79, 599–614. [Google Scholar] [CrossRef] [Scilit]
- Cataldo, P.G.; Klemm, P.; Thüring, M.; Saavedra, L.; Hebert, E.M.; Hartmann, R.K.; Lechner, M. Insights into 6S RNA in lactic acid bacteria (LAB). BMC Genom. Data 2021, 22, 29. [Google Scholar] [CrossRef] [Scilit] [PubMed]
- Baig, M.A.; Turner, M.S.; Liu, S.Q.; Shah, N.N.; Ayyash, M.M. Heat, cold, acid, and bile salt induced differential proteomic responses of a novel potential probiotic Lactococcus garvieae C47 isolated from camel milk. Food Chem. 2022, 397, 133774. [Google Scholar] [CrossRef] [Scilit]
- He, X.A.; Cui, Y.; Jia, Q.Y.; Zhuang, Y.L.; Gu, Y.; Fan, X.J.; Ding, Y.Y. Response mechanisms of lactic acid bacteria under environmental stress and their application in the food industry. Food Biosci. 2025, 64, 105938. [Google Scholar] [CrossRef] [Scilit]
- Li, X.X.; Yang, J.J.; Shi, S.Q.; Lan, H.L.; Zhao, W.; Hung, W.L.; He, J.; Wang, R. The genome of Bifidobacterium longum subsp. infantis YLGB-1496 provides insights into its carbohydrate utilization and genetic stability. Genes 2024, 15, 466. [Google Scholar] [CrossRef] [Scilit]
- Zhu, X.M.; Jiang, D.D.; Yuan, B.J.; Ni, K.K. Effect of low-temperature-tolerant lactic acid bacteria on the fermentation quality and bacterial community of oat silage at 5 °C vs. 15 °C. Fermentation 2022, 8, 158. [Google Scholar] [CrossRef] [Scilit]
- Hernández, A.; Larsson, C.U.; Sawicki, R.; van Niel, E.W.J.; Roos, S.; Håkansson, S. Impact of the fermentation parameters pH and temperature on stress resilience of Lactobacillus reuteri DSM 17938. AMB Express 2019, 9, 66. [Google Scholar] [CrossRef] [Scilit] [PubMed]
- Derunets, A.S.; Selimzyanova, A.I.; Rykov, S.V.; Kuznetsov, A.E.; Berezina, O.V. Strategies to enhance stress tolerance in lactic acid bacteria across diverse stress conditions. World J. Microbiol. Biotechnol. 2024, 40, 126. [Google Scholar] [CrossRef] [Scilit]
- Brunelli, L.; Perotti, S.; Gargari, G.; De Vitis, V.; Mantegazza, G.; Ferrari, R.; Minuzzo, M.; Pierallini, E.; Ricci, G.; Fiore, W.; et al. Genetic and phenotypic stability of Lacticaseibacillus paracasei DG (DSM 34154) over 10 years of industrial production. Appl. Environ. Microbiol. 2025, 91, e02394-24. [Google Scholar] [CrossRef] [Scilit]
- Valenzuela-Miranda, D.; Valenzuela-Muñoz, V.; Nuñez-Acuña, G.; Gallardo-Escárate, C. Long-term serial culture of Piscirickettsia salmonis leads to a genomic and transcriptomic reorganization affecting bacterial virulence. Aquaculture 2020, 529, 735634. [Google Scholar] [CrossRef] [Scilit]
- Ratib, N.R.; Seidl, F.; Ehrenreich, I.M.; Finkel, S.E. Evolution in long-term stationary-phase batch culture: Emergence of divergent Escherichia coli lineages over 1200 days. mBio 2021, 12, 10-1128. [Google Scholar] [CrossRef] [Scilit]
- Schröder, N.C.H.; Korsa, A.; Wami, H.; Mantel, O.; Dobrindt, U.; Kurtz, J. Serial passage in an insect host indicates genetic stability of the human probiotic Escherichia coli Nissle 1917. Evol. Med. Public Health 2022, 10, 71–86. [Google Scholar] [CrossRef] [Scilit] [PubMed]
- Shibata, Y.; Kawada, M.; Nakano, Y.; Toyoshima, K.; Yamashita, Y. Identification and characterization of an autolysin-encoding gene of Streptococcus mutans. Infect. Immun. 2005, 73, 3512–3520. [Google Scholar] [CrossRef] [Scilit] [PubMed]
- Liu, S.L.; Ma, Y.M.; Zheng, Y.; Zhao, W.; Zhao, X.; Luo, T.Q.; Zhang, J.; Yang, Z.N. Cold-stress response of probiotic Lactobacillus plantarum K25 by iTRAQ proteomic analysis. J. Microbiol. Biotechnol. 2020, 30, 187–195. [Google Scholar] [CrossRef] [Scilit]
- Du, Y.; Li, H.; Shao, J.C.; Wu, T.; Xu, W.L.; Hu, X.M.; Chen, J. Adhesion and colonization of the probiotic Lactobacillus plantarum HC-2 in the intestine of Litopenaeus Vannamei are associated with bacterial surface proteins. Front. Microbiol. 2022, 13, 878874. [Google Scholar] [CrossRef] [Scilit]
- Yu, P.; Li, N.; Geng, M.X.; Liu, Z.M.; Liu, X.M.; Zhang, H.P.; Zhao, J.X.; Zhang, H.; Chen, W. Lactose utilization of Streptococcus thermophilus and correlations with β-galactosidase and urease. J. Dairy Sci. 2020, 103, 166–171. [Google Scholar] [CrossRef] [Scilit]
- Peiro, C.; Millard, P.; de Simone, A.; Cahoreau, E.; Peyriga, L.; Enjalbert, B.; Heux, S. Chemical and metabolic controls on dihydroxyacetone metabolism lead to suboptimal growth of Escherichia coli. Appl. Environ. Microbiol. 2019, 85, e00768-19. [Google Scholar] [CrossRef] [Scilit] [PubMed]
- Collins, H.M.; Betts, N.S.; Dockter, C.; Berkowitz, O.; Braumann, I.; Cuesta-Seijo, J.A.; Skadhauge, B.; Whelan, J.; Bulone, V.; Fincher, G.B. Genes that mediate starch metabolism in developing and germinated barley grain. Front. Plant Sci. 2021, 12, 641325. [Google Scholar] [CrossRef] [Scilit]
- Andersen, S.; Moller, M.S.; Poulsen, J.C.N.; Pichler, M.J.; Svensson, B.; Lo Leggio, L.; Goh, Y.J.; Abou Hachem, M. An 1,4-α-glucosyltransferase defines a new maltodextrin catabolism scheme in Lactobacillus acidophilus. Appl. Environ. Microbiol. 2020, 86, e00661-20. [Google Scholar] [CrossRef] [Scilit]
- Yang, Y.X.; Yang, Y.J.; Fan, Q.; Huang, Z.X.; Li, J.J.; Wu, Q.; Tang, X.H.; Ding, J.M.; Han, N.Y.; Xu, B. Molecular and biochemical characterization of salt-tolerant trehalose-6-phosphate hydrolases identified by screening and sequencing salt-tolerant clones from the metagenomic library of the gastrointestinal tract. Front. Microbiol. 2020, 11, 1466. [Google Scholar] [CrossRef] [Scilit]
- Li, X.F.; Wang, M.H.; Ding, M.; Pang, X.Y.; Sun, J.; Lu, Y.J. Effects of complex cryoprotectant on the freeze-drying survival of Lactobacillus acidophilus FMNS-10 and its protective mechanisms. J. Stored Prod. Res. 2025, 112, 102646. [Google Scholar] [CrossRef] [Scilit]
- Xiong, F.K.; Liu, Z.B.; Hu, G.Z.; Zhao, D.; Qu, D.Q. Optimisation of the protection process in baijiu yeast spray drying and investigation of its micro-nano protection mechanism. LWT-Food Sci. Technol. 2025, 227, 118000. [Google Scholar] [CrossRef] [Scilit]
- Tan, H.H.; Hou, J.; Ouyang, J.; Zheng, Z.J. Development of a sustainable approach to produce galactaric acid from sunflower heads by engineered Pseudomonas putida KT2440. Bioresour. Technol. 2025, 437, 133115, Corrigendum in Bioresour. Technol. 2025, 437, 133179. https://doi.org/10.1016/j.biortech.2025.133179. [Google Scholar] [CrossRef] [Scilit] [PubMed]
- Avci, F.G.; Prasun, T.; Wendisch, V.F. Metabolic engineering for microbial production of sugar acids. BMC Biotechnol. 2025, 25, 36, Correction in BMC Biotechnol. 2025, 25, 50. https://doi.org/10.1186/s12896-025-00996-0. [Google Scholar] [CrossRef] [Scilit] [PubMed]
- Kapse, N.; Pisu, V.; Dhakephalkar, T.; Margale, P.; Shetty, D.; Wagh, S.; Dagar, S.; Dhakephalkar, P.K. Unveiling the probiotic potential of Streptococcus thermophilus MCC0200: Insights from in vitro studies corroborated with genome analysis. Microorganisms 2024, 12, 347. [Google Scholar] [CrossRef] [Scilit] [PubMed]
- Alexandraki, V.; Kazou, M.; Blom, J.; Pot, B.; Papadimitriou, K.; Tsakalidou, E. Comparative genomics of Streptococcus thermophilus support important traits concerning the evolution, biology and technological properties of the species. Front. Microbiol. 2019, 10, 2916. [Google Scholar] [CrossRef] [Scilit]
- Shehata, H.R.; Chandler, R.A.; Newmaster, S.G. Draft genome sequences of Lactobacillus delbrueckii subsp. bulgaricus strains CBC-LB69 and CBC-LB8, isolated from homemade dairy foods in bulgaria. Microbiol. Resour. Announc. 2020, 9, 10-1128. [Google Scholar] [CrossRef] [Scilit]
- Hao, P.; Zheng, H.J.; Yu, Y.; Ding, G.H.; Gu, W.Y.; Chen, S.T.; Yu, Z.H.; Ren, S.X.; Oda, M.; Konno, T.; et al. Complete sequencing and pan-Genomic analysis of Lactobacillus delbrueckii subsp bulgaricus reveal its genetic basis for industrial yogurt production. PLoS ONE 2011, 6, e15964. [Google Scholar] [CrossRef] [Scilit]
- Dinarieva, T.Y.; Klimko, A.I.; Kahnt, J.; Cherdyntseva, T.A.; Netrusov, A.I. Adaptation of lacticaseibacillus rhamnosus CM MSU 529 to aerobic growth: A proteomic approach. Microorganisms 2023, 11, 313. [Google Scholar] [CrossRef] [Scilit] [PubMed]
- Onwe, R.O.; Onwosi, C.O.; Ezugworie, F.N.; Ekwealor, C.C.; Okonkwo, C.C. Microbial trehalose boosts the ecological fitness of biocontrol agents, the viability of probiotics during long-term storage and plants tolerance to environmental-driven abiotic stress. Sci. Total Environ. 2022, 806, 150432. [Google Scholar] [CrossRef] [Scilit] [PubMed]
- Guo, Z.P.; Li, M.Y.; Guo, Z.T.; Zhu, R.; Xin, Y.; Gu, Z.H.; Zhang, L. Trehalose metabolism targeting as a novel strategy to modulate acid tolerance of yeasts and its application in food industry. Food Microbiol. 2023, 114, 104300. [Google Scholar] [CrossRef] [Scilit]
- Pightling, A.W.; Pettengill, J.B.; Luo, Y.; Baugher, J.D.; Rand, H.; Strain, E. Interpreting whole-genome sequence analyses of foodborne bacteria for regulatory applications and outbreak investigations. Front. Microbiol. 2018, 9, 1482. [Google Scholar] [CrossRef] [Scilit]
- An, M.L.; Zhao, Z.; Zhao, L.; Yang, J.J.; Gao, H.N.; Zhang, L.L.; Zhao, G.P.; Hou, B.C.; He, J.; Hung, W.L.; et al. Metabolic modulation of yogurt fermentation kinetics and storage stability by Lactobacillus-starter culture interactions. Foods 2025, 14, 2935. [Google Scholar] [CrossRef] [Scilit]
- Filannino, P.; Di Cagno, R.; Crecchio, C.; De Virgilio, C.; De Angelis, M.; Gobbetti, M. Transcriptional reprogramming and phenotypic switching associated with the adaptation of Lactobacillus plantarum C2 to plant niches. Sci. Rep. 2016, 6, 27392. [Google Scholar] [CrossRef] [Scilit] [PubMed]

Disclaimer/Publisher’s Note: The statements, opinions and data contained in all publications are solely those of the individual author(s) and contributor(s) and not of MDPI and/or the editor(s). MDPI and/or the editor(s) disclaim responsibility for any injury to people or property resulting from any ideas, methods, instructions or products referred to in the content. |
© 2026 by the authors. Licensee MDPI, Basel, Switzerland. This article is an open access article distributed under the terms and conditions of the Creative Commons Attribution (CC BY) license.