2.6. In Silico Antibacterial Activity Prediction of Top 5 Compounds from Both Molecular Targets
The AntiBac-Pred tool allows predictions to be made about whether a chemical compound has the ability to inhibit the growth of one or more than 353 species of bacteria available in the AntiBac-Pred algorithm. When the desired compound is entered to make the prediction, the result is displayed indicating which type of bacteria the inhibitory activity may occur in and the confidence value. There is no minimum confidence value to consider the potential inhibitory activity; however, a higher confidence value demonstrates that the chemical compound has a greater probability of being active and causing inhibition of the indicated bacterial strains according to the calculation performed by AntiBac-Pred [
48,
49].
Table 8 demonstrates the results obtained for predicting the antibacterial activity of the top five compounds for the target PBP2a. To validate the algorithm, the commercial compounds methicillin and oxacillin were inserted, which are known to have biological activity against a certain diversity of
S. aureus strains.
As observed, the antibacterial prediction for the drugs methicillin and oxacillin indicates inhibitory activity against S. aureus strains, emphasizing the resistant subtype S. aureus subsp. aureus RN4220, thus demonstrating the predictive specificity of AntiBac-Pred to indicate possible antibacterial activity.
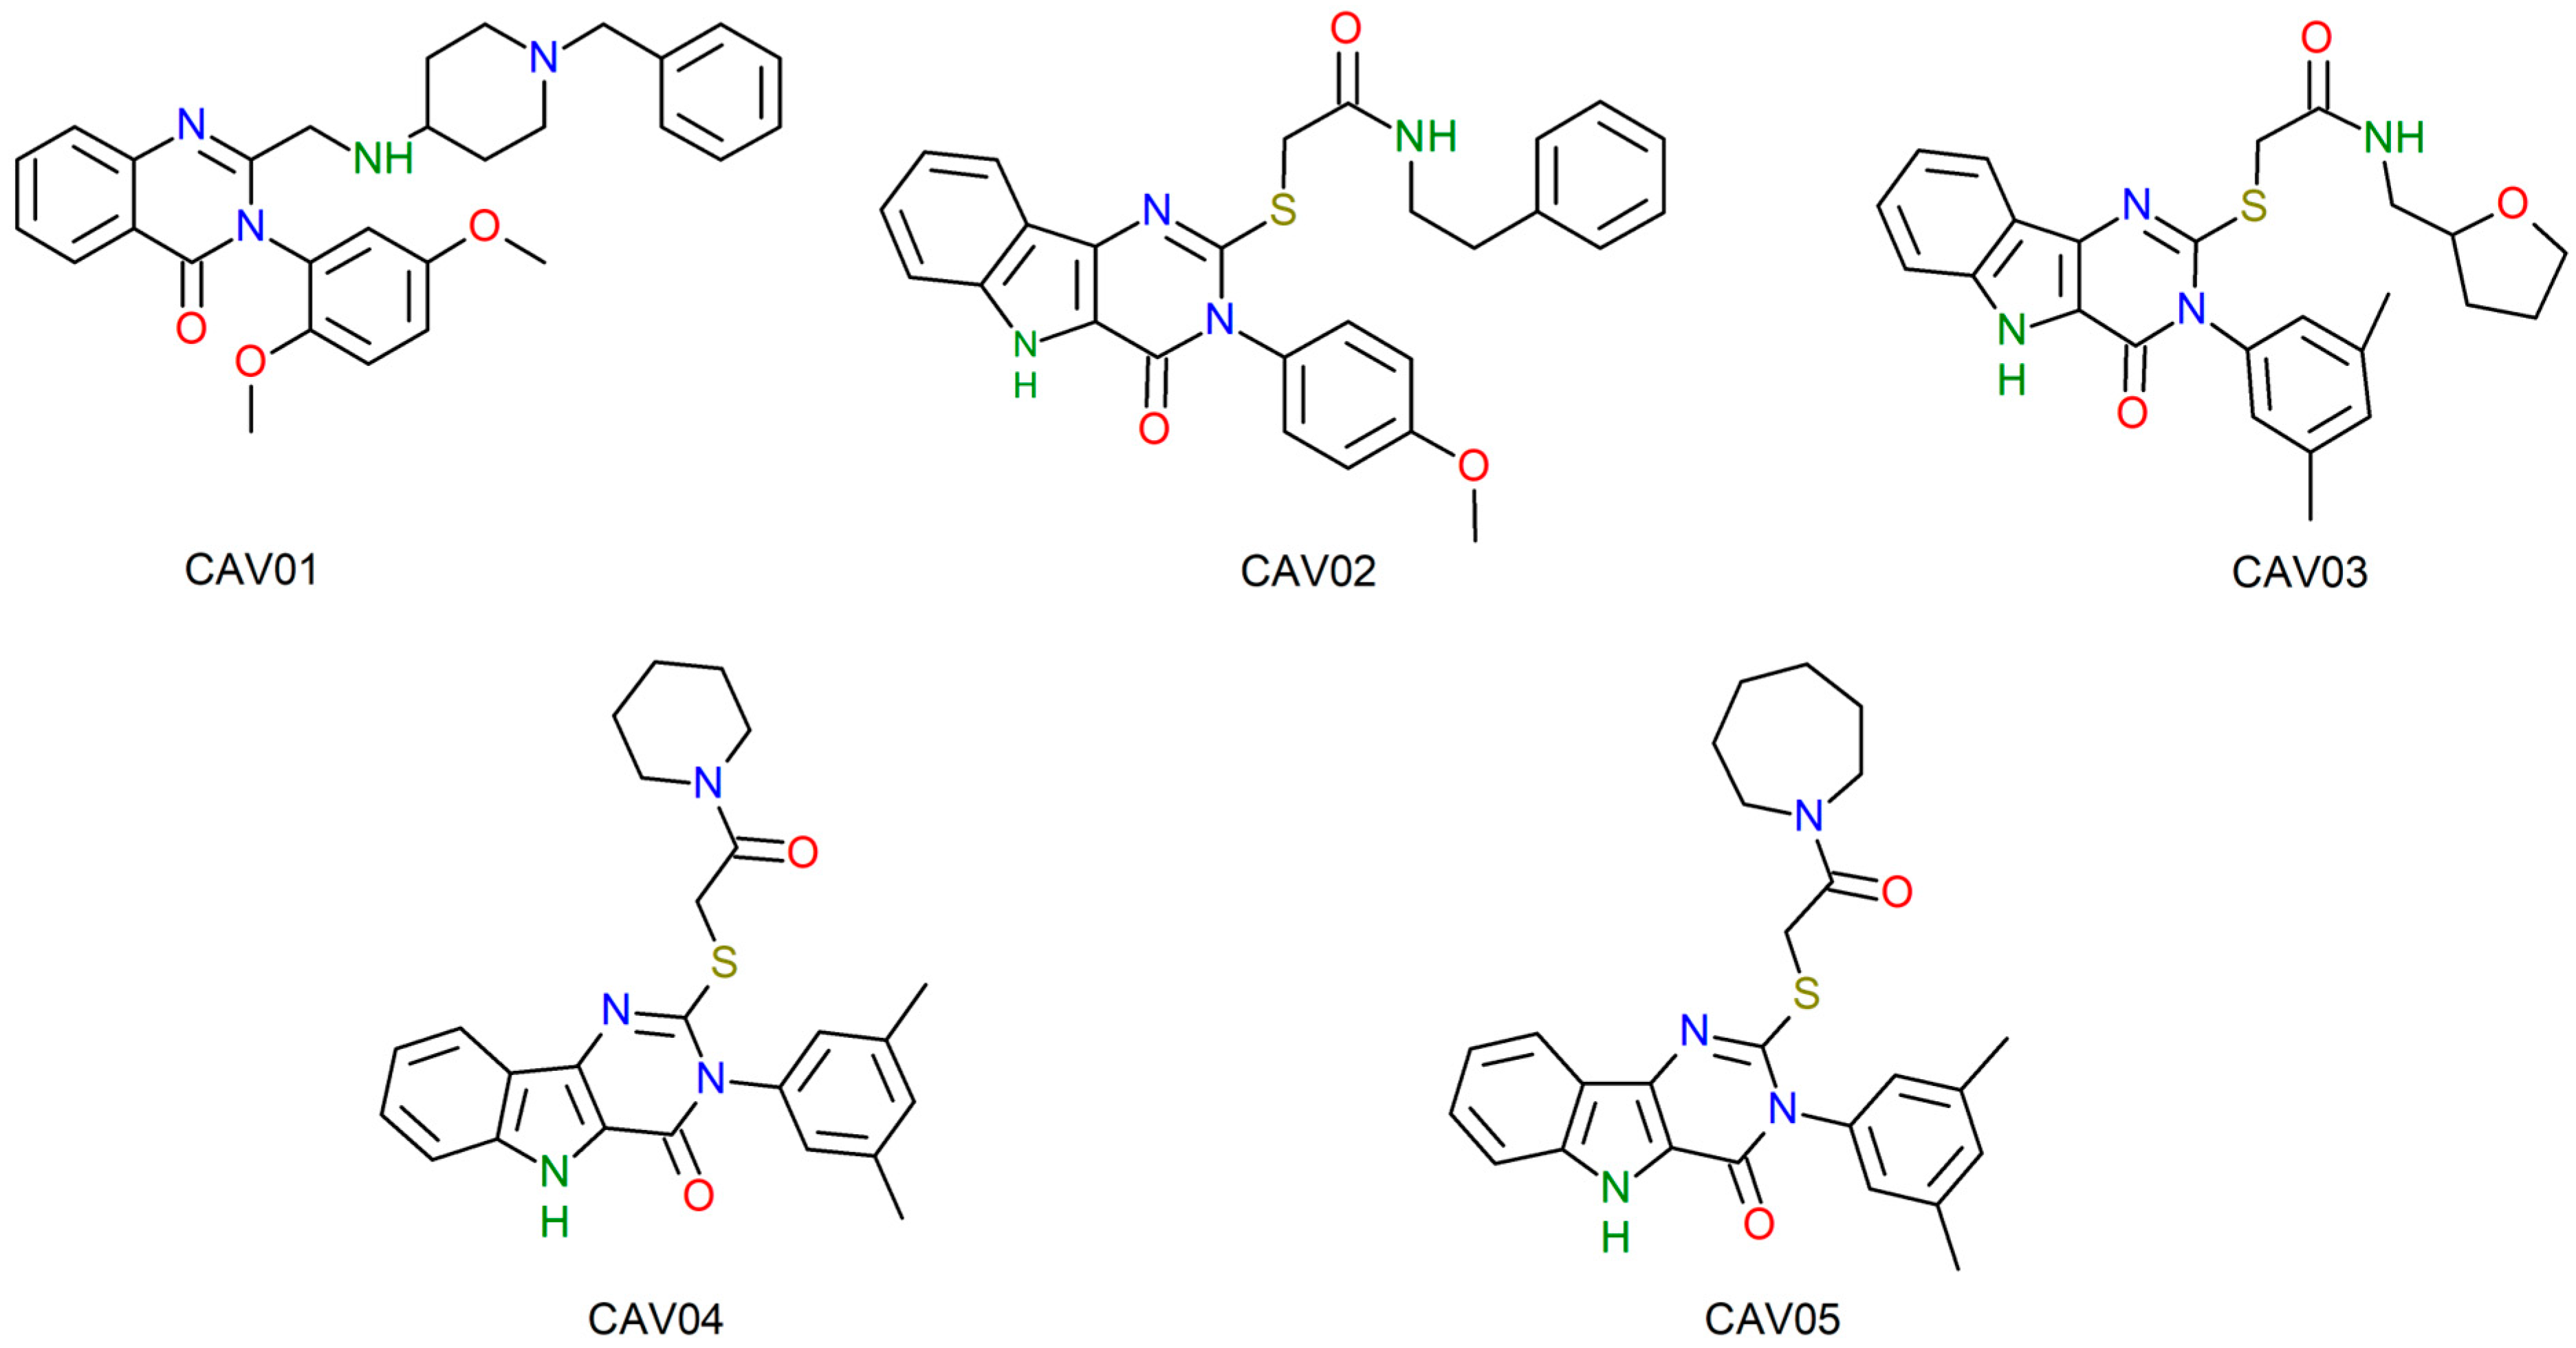
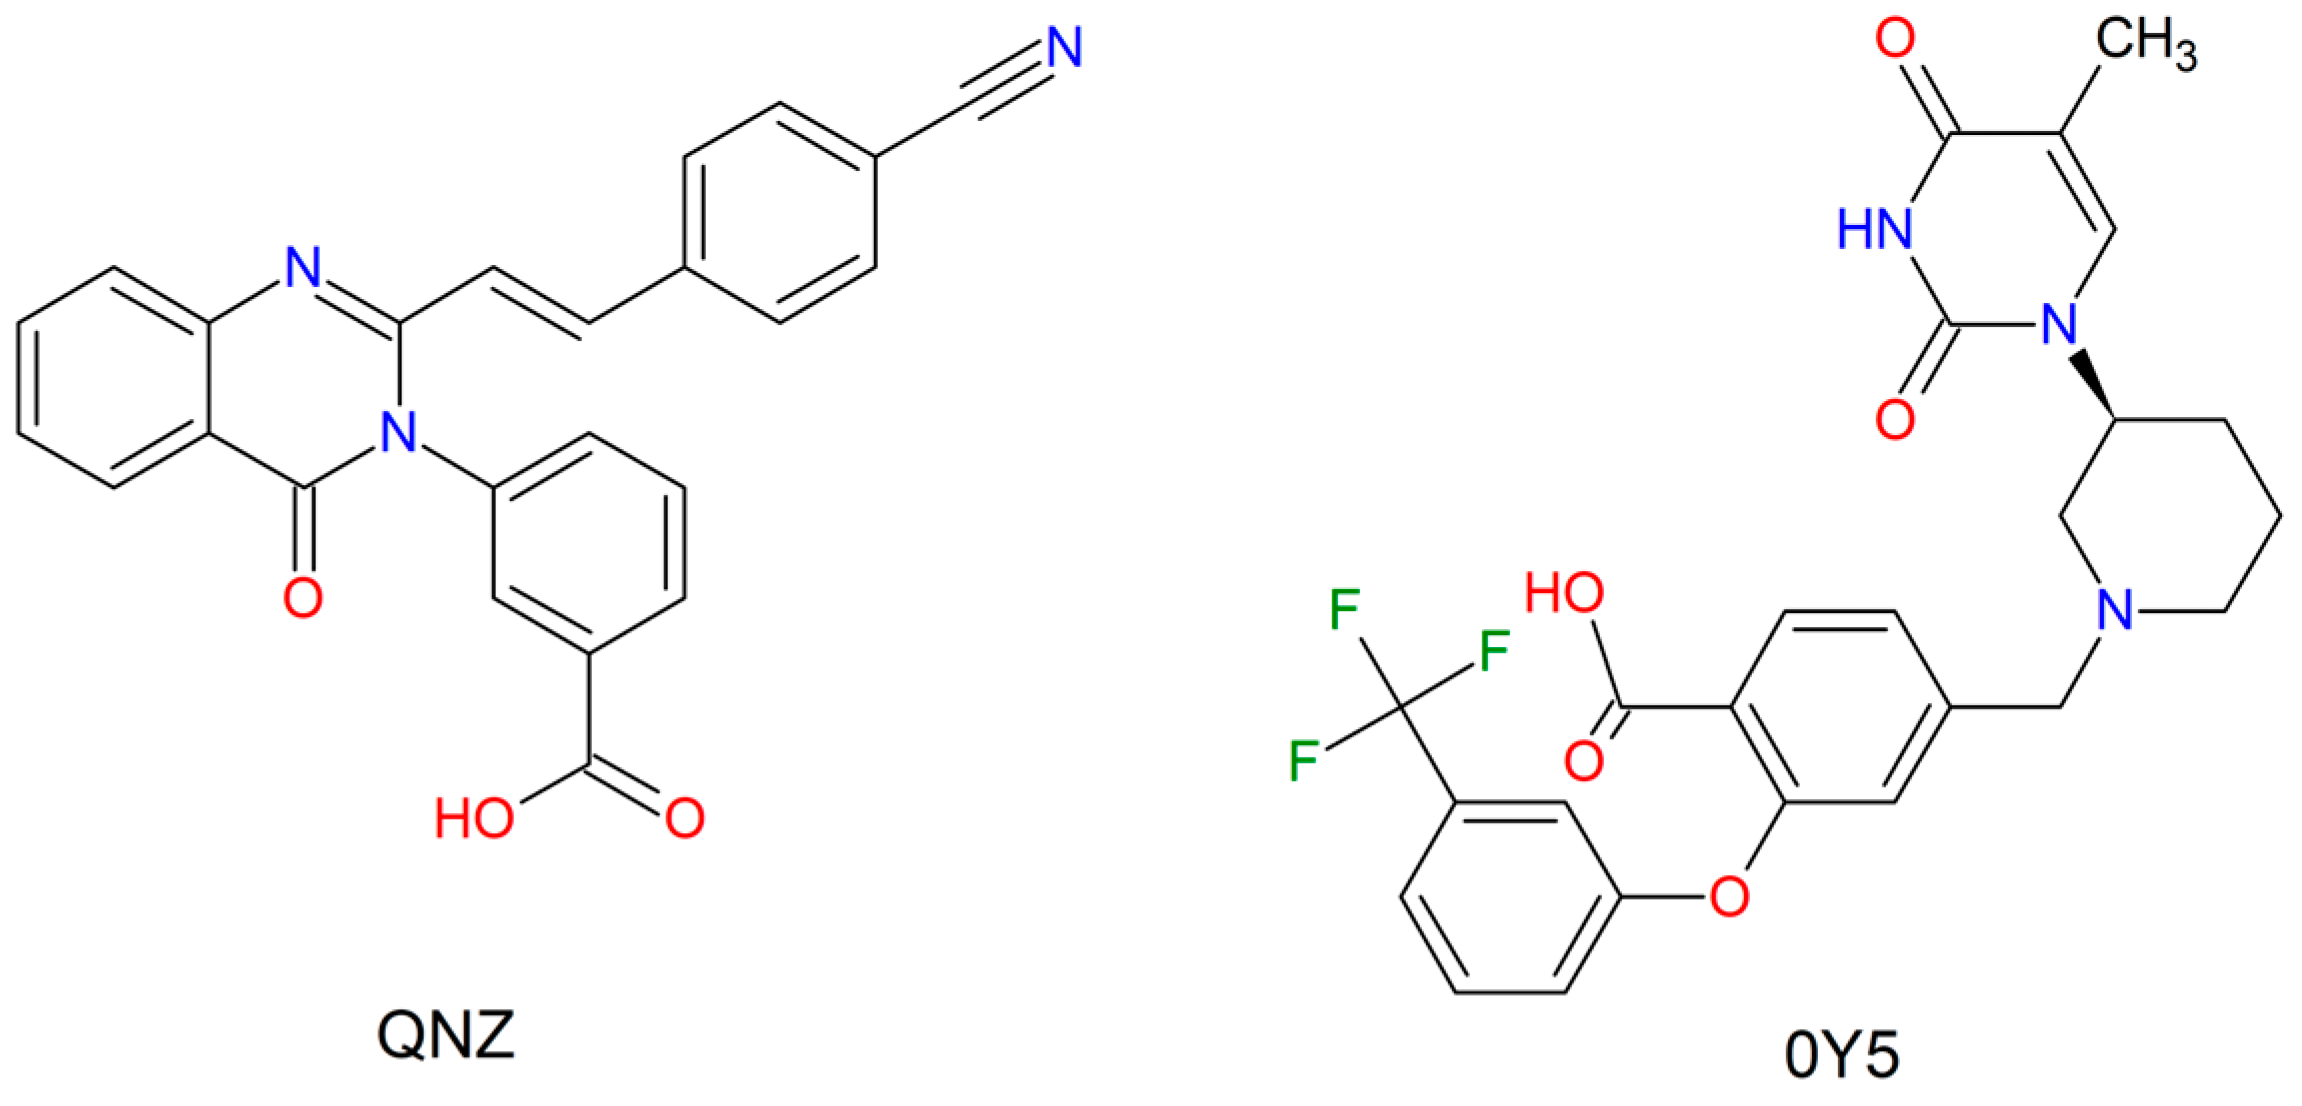
Regarding the five main compounds selected from QNZ, it is observed that all five molecules showed predicted antibacterial activity against some type or subtype of staphylococcal bacteria. It is recognized that the reliability values are low when compared to commercial antibiotics; however, the AntiBac-Pred tool is being used not as a way to confirm biological activity but rather to guide which bacterial strains future experimental stages of this study should focus on, in addition to resistant S. aureus strains. In this sense, compounds CAV02, CAV03, CAV04 and CAV05 stand out, for which possible activity was recorded for the resistant bacterial subtype S. aureus subsp. aureus MW2. Other types of staphylococcal bacteria recorded were S. haemolyticus (CAV01); S. intermedius (CAV02) and S. sciuri (CAV03). Thus, new perspectives can be developed for this study in order to investigate the potential of these compounds against other types of staphylococcal bacteria, not only S. aureus. These results obtained for the top five compounds screened from QNZ are fundamental to guide the future experimental stages.
Compounds CAV02, CAV03, CAV04, and CAV05 showed potential for activity against staphylococcal bacterial strains. It is essential to perform biological tests to investigate these activities in bacterial colonies, as well as to establish dosages and minimum inhibitory concentration (MIC) values.
The compound CAV01 may be tested against other strains of bacteria of medical importance, as indicated by the possible activity of AntiBac-Pred, and it will also be tested against resistant strains of S. aureus.
For the compounds screened from 0Y5 onwards, it is noted that there was no explicit result for potential activity against resistant S. aureus, as shown for the compounds screened from QNZ. However, there is a record of potential activity, in general, against the genus Staphylococcus, represented by all five molecules analyzed, which allows us to investigate the possibility of antibacterial activity against antibiotic-sensitive strains.
Experimental studies with these compounds are essential to check this activity, as well as the possibility of inhibiting resistant strains, since the result “
Sthapylococcus sp.” is a term that refers to several types of bacteria belonging to the
Staphylococcus genus, which may include resistant strains.
Table 9 illustrates the results obtained for the top five compounds for the TMK target screened from 0Y5.
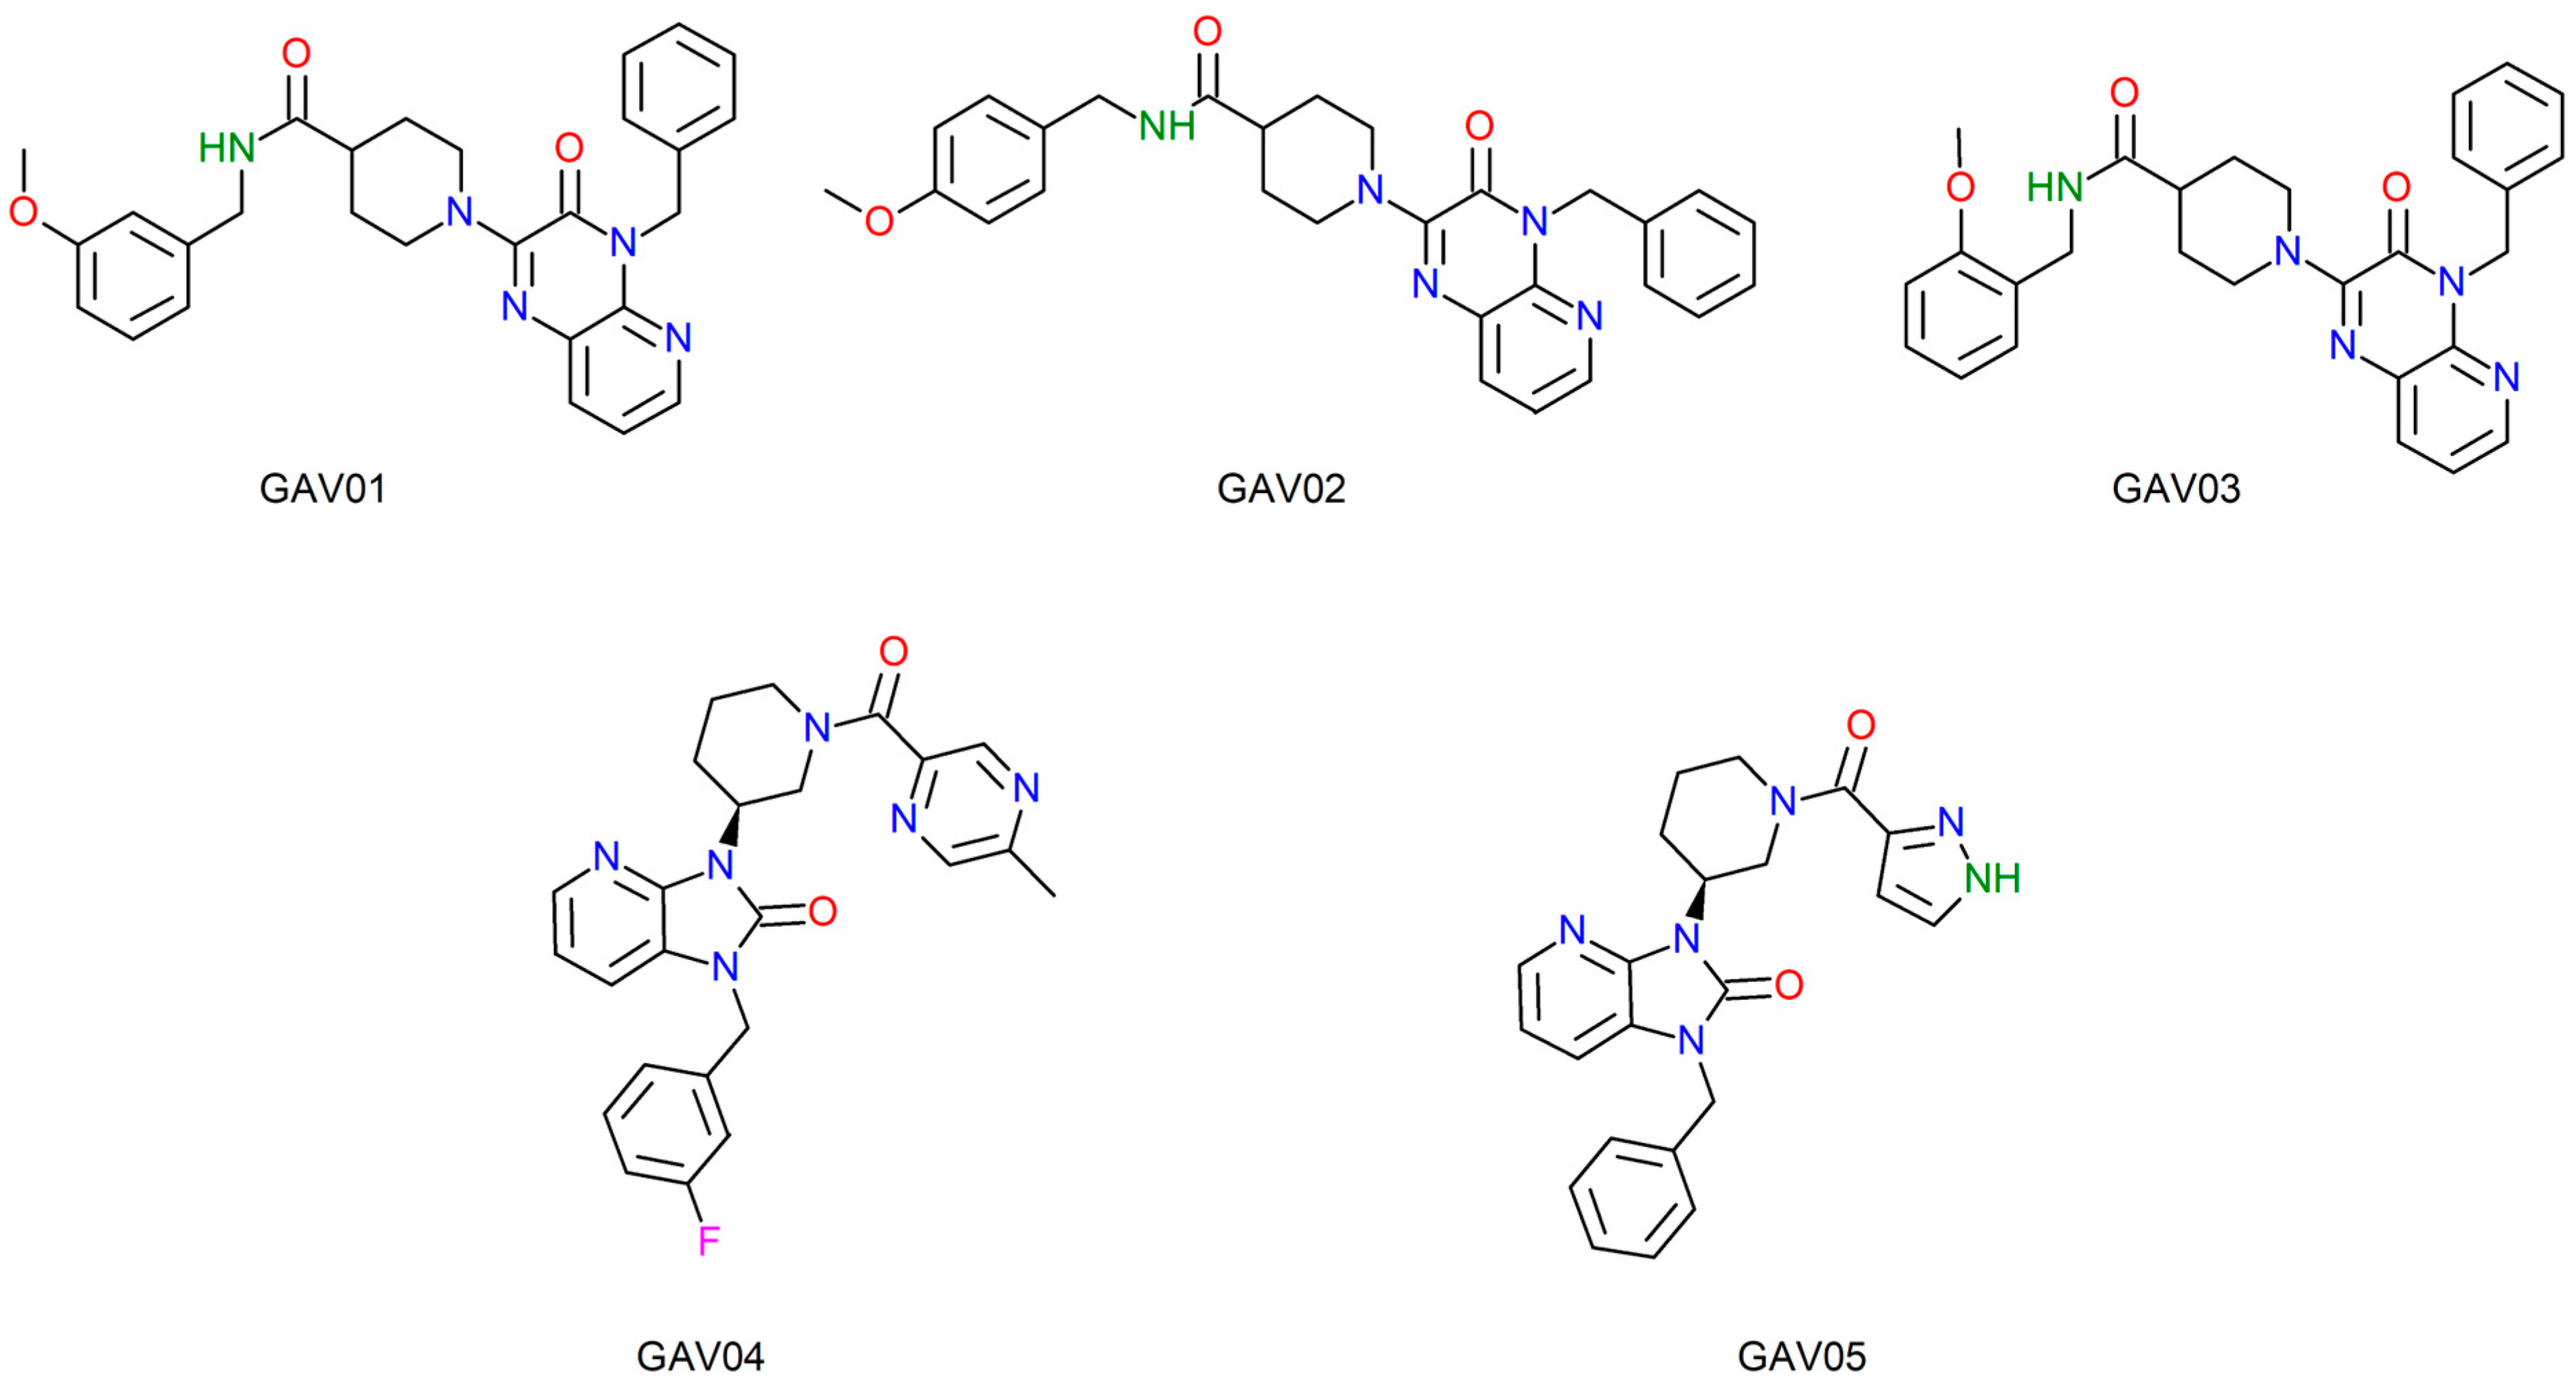
Expanding the analysis, it was noted that there was potential biological activity for other types of bacteria that are not of the Staphylococcus genus. Compounds GAV01, GAV02 and GAV03 showed predicted activity for the bacterial types RESISTANT Propionibacterium acnes and RESISTANT Bacteroides thetaiotaomicron. Compound GAV04 was the only one to record potential activity against the types of mycobacteria: Mycobacterium tuberculosis, M. tuberculosis H37Rv and RESISTANT M. tuberculosis. These bacteria cause tuberculosis.
Finally, compounds GAV04 and GAV05 demonstrated potential inhibitory activity against the Staphylococcus lugdunensis strain.
In the screening of compounds from pivot 0Y5, the fact that no explicit record of potential activity against resistant S. aureus was obtained will not result in the elimination of these compounds from future studies since this result suggests the possibility of identifying and selecting substances with potential activity against other bacteria of medical importance, not only S. aureus, which was the initial proposal of this study. Furthermore, there was an indication of potential activity against the genus, represented by the field Staphylococcus sp., which will allow testing of these compounds against strains of S, aureus as they belong to the indicated genus.
All five compounds for each molecular target showed significant results in the context of an in silico study, drawing attention to the potential antibacterial activity indicated. Experimental studies will be the next important step for the research group that conducted this work and may result in new biotechnological products of pharmaceutical interest and patent registration. The compounds discovered in this work are already in the acquisition process, and new studies from the research group will be published in the future.
Although auxiliary in silico predictions suggested potential interactions with additional bacterial species, these observations should be interpreted as exploratory hypotheses. The present study is focused on S. aureus, and any broader-spectrum implications require further computational and experimental validation. The experimental steps in this study will be directed toward the inhibition of resistant strains of S. aureus, highlighting compounds CAV02, CAV03, CAV04 and CAV05 and their potential against resistant S. aureus subsp. aureus MW2.
2.8. Molecular Dynamics Simulations
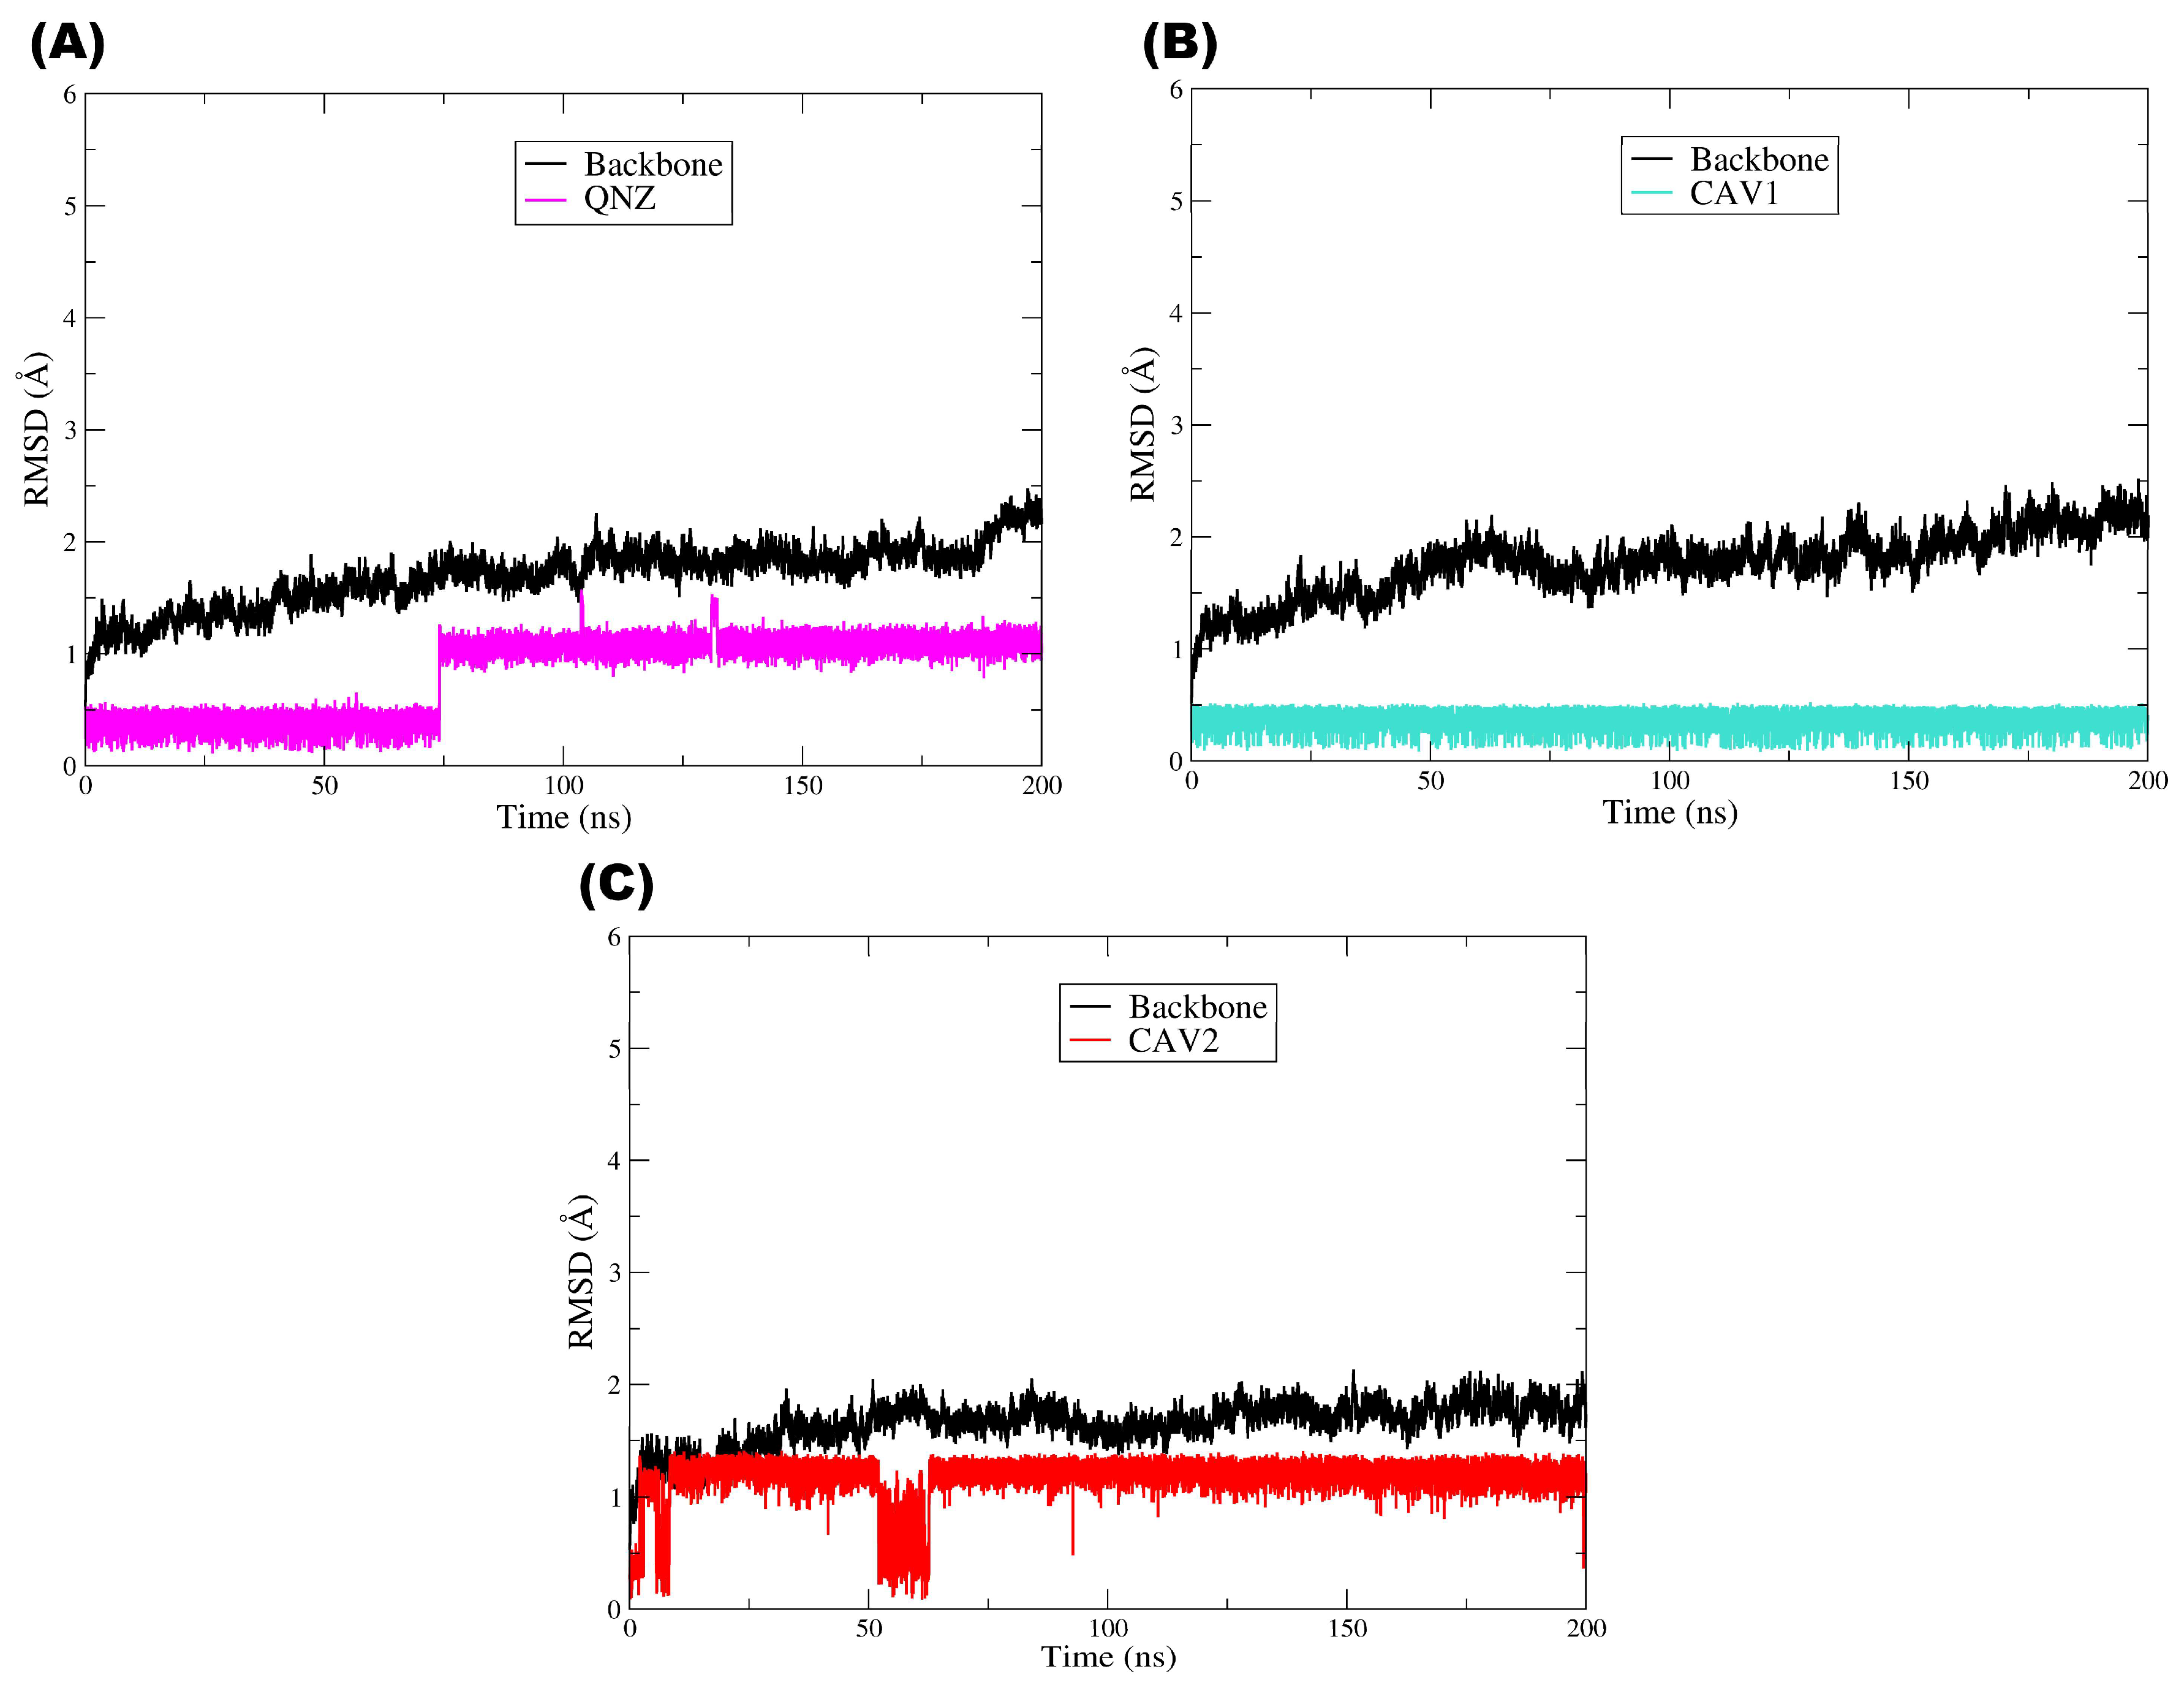
To assess the conformational stability of the complexes and the persistence of binding interactions over time, 200 ns molecular dynamics simulations were performed for the target protein PBP2a in complex with the pivot compound QNZ and the candidate compounds CAV1 and CAV2. This approach complements the molecular docking results by enabling the evaluation of whether the ligands remain stably accommodated within the binding site under dynamic conditions [
50]. As illustrated by the RMSD plot (
Figure 8), all the systems reached a structural equilibrium consistent with overall stability throughout the simulations. The RMSD of the PBP2a main chain (Cα) (black line) remained low (approximately ≈ 1.0–2.5 Å) after a brief initial equilibration phase, with no evidence of abrupt significant global conformational changes, although a slight tendency toward a gradual increase over time was observed. This behavior indicates that the presence of each ligand did not destabilize the protein structure, which remained structurally intact throughout the entire molecular dynamics trajectory.
With respect to the ligands, the pivot compound QNZ (magenta) displayed low RMSD values at the beginning of the simulation (≈0.2–0.5 Å) and, at approximately ≈70–80 ns, showed a step-like transition, thereafter oscillating around ≈1.0–1.3 Å until the end of the trajectory, with occasional peaks. This profile is indicative of a conformational rearrangement/realignment of the ligand within the binding site followed by stabilization in a new regime, a phenomenon commonly observed when a ligand explores alternative conformations while remaining associated with the target. Importantly, variations in ligand RMSD do not necessarily imply loss of affinity or dissociation but may instead reflect dynamic conformational adaptations within the binding site [
51,
52].
Compound CAV1 (cyan line) exhibited a highly stable and low RMSD profile throughout the simulation after a brief initial phase of conformational accommodation. The maintenance of RMSD values within a relatively constant range (≈0.2–0.6 Å) suggests that the ligand remained well fitted within the binding site, displaying a lower degree of structural fluctuation. This behavior is frequently associated with more persistent and energetically favorable binding modes, in agreement with previous molecular docking results [
53,
54].
Similarly, compound CAV2 (red line) also exhibited dynamic stability after the initial adaptation period, although with fluctuations at a slightly higher plateau than CAV1, remaining predominantly around ≈1.0–1.4 Å. A transient event involving a more pronounced decrease was also observed at approximately ≈50–60 ns, followed by a return to the previous plateau, with no evidence of continuous drift. Nevertheless, the absence of persistent abrupt deviations or a continuous increasing trend in RMSD indicates that the ligand maintained its association with the binding site throughout the simulation, a feature consistent with structurally stable complexes in molecular dynamics studies [
55,
56].
Overall, the plot demonstrates that all the systems reached a dynamic equilibrium regime characterized by controlled RMSD fluctuations over time. The stability of the protein structure, together with the maintenance of ligand RMSD profiles without a progressive increase compatible with instability, suggest that the protein–ligand complexes are structurally stable under the simulated conditions. A comparative analysis of the ligands further indicates that CAV1 displayed the most constrained profile (lowest RMSD), whereas CAV2 remained stable at a moderate plateau and QNZ exhibited a late rearrangement followed by stabilization, in agreement with the results obtained in the previous molecular docking and computational screening steps, thereby reinforcing the internal consistency of the adopted methodology [
54].
Taken together, the RMSD analysis throughout the molecular dynamics simulations indicates that the evaluated protein–ligand complexes exhibit structural stability consistent with well-equilibrated systems from both the protein and ligand perspectives. The maintenance of low conformational deviations in the main chain suggests that ligand binding does not induce relevant structural perturbations in the protein, whereas the RMSD profiles observed for QNZ, CAV1, and CAV2 reflect the dynamic conformational adaptations expected in physiologically simulated environments, with no evidence of dissociation or complex instability. As widely discussed in the literature, moderate fluctuations in ligand RMSD are common and are often associated with the intrinsic flexibility of the molecules and conformational exploration within the binding site rather than indicating loss of affinity or interaction failure. In this context, the RMSD results obtained in this study reinforce the internal consistency of the computational screening workflow, corroborating the molecular docking findings and the favorable pharmacokinetic profiles previously observed. Thus, although limited to the in silico scope, the MD data provide additional support for the selection of CAV1 and CAV2 as promising candidates for future experimental investigations, in line with contemporary molecular dynamics-based computer-aided drug discovery approaches [
57].
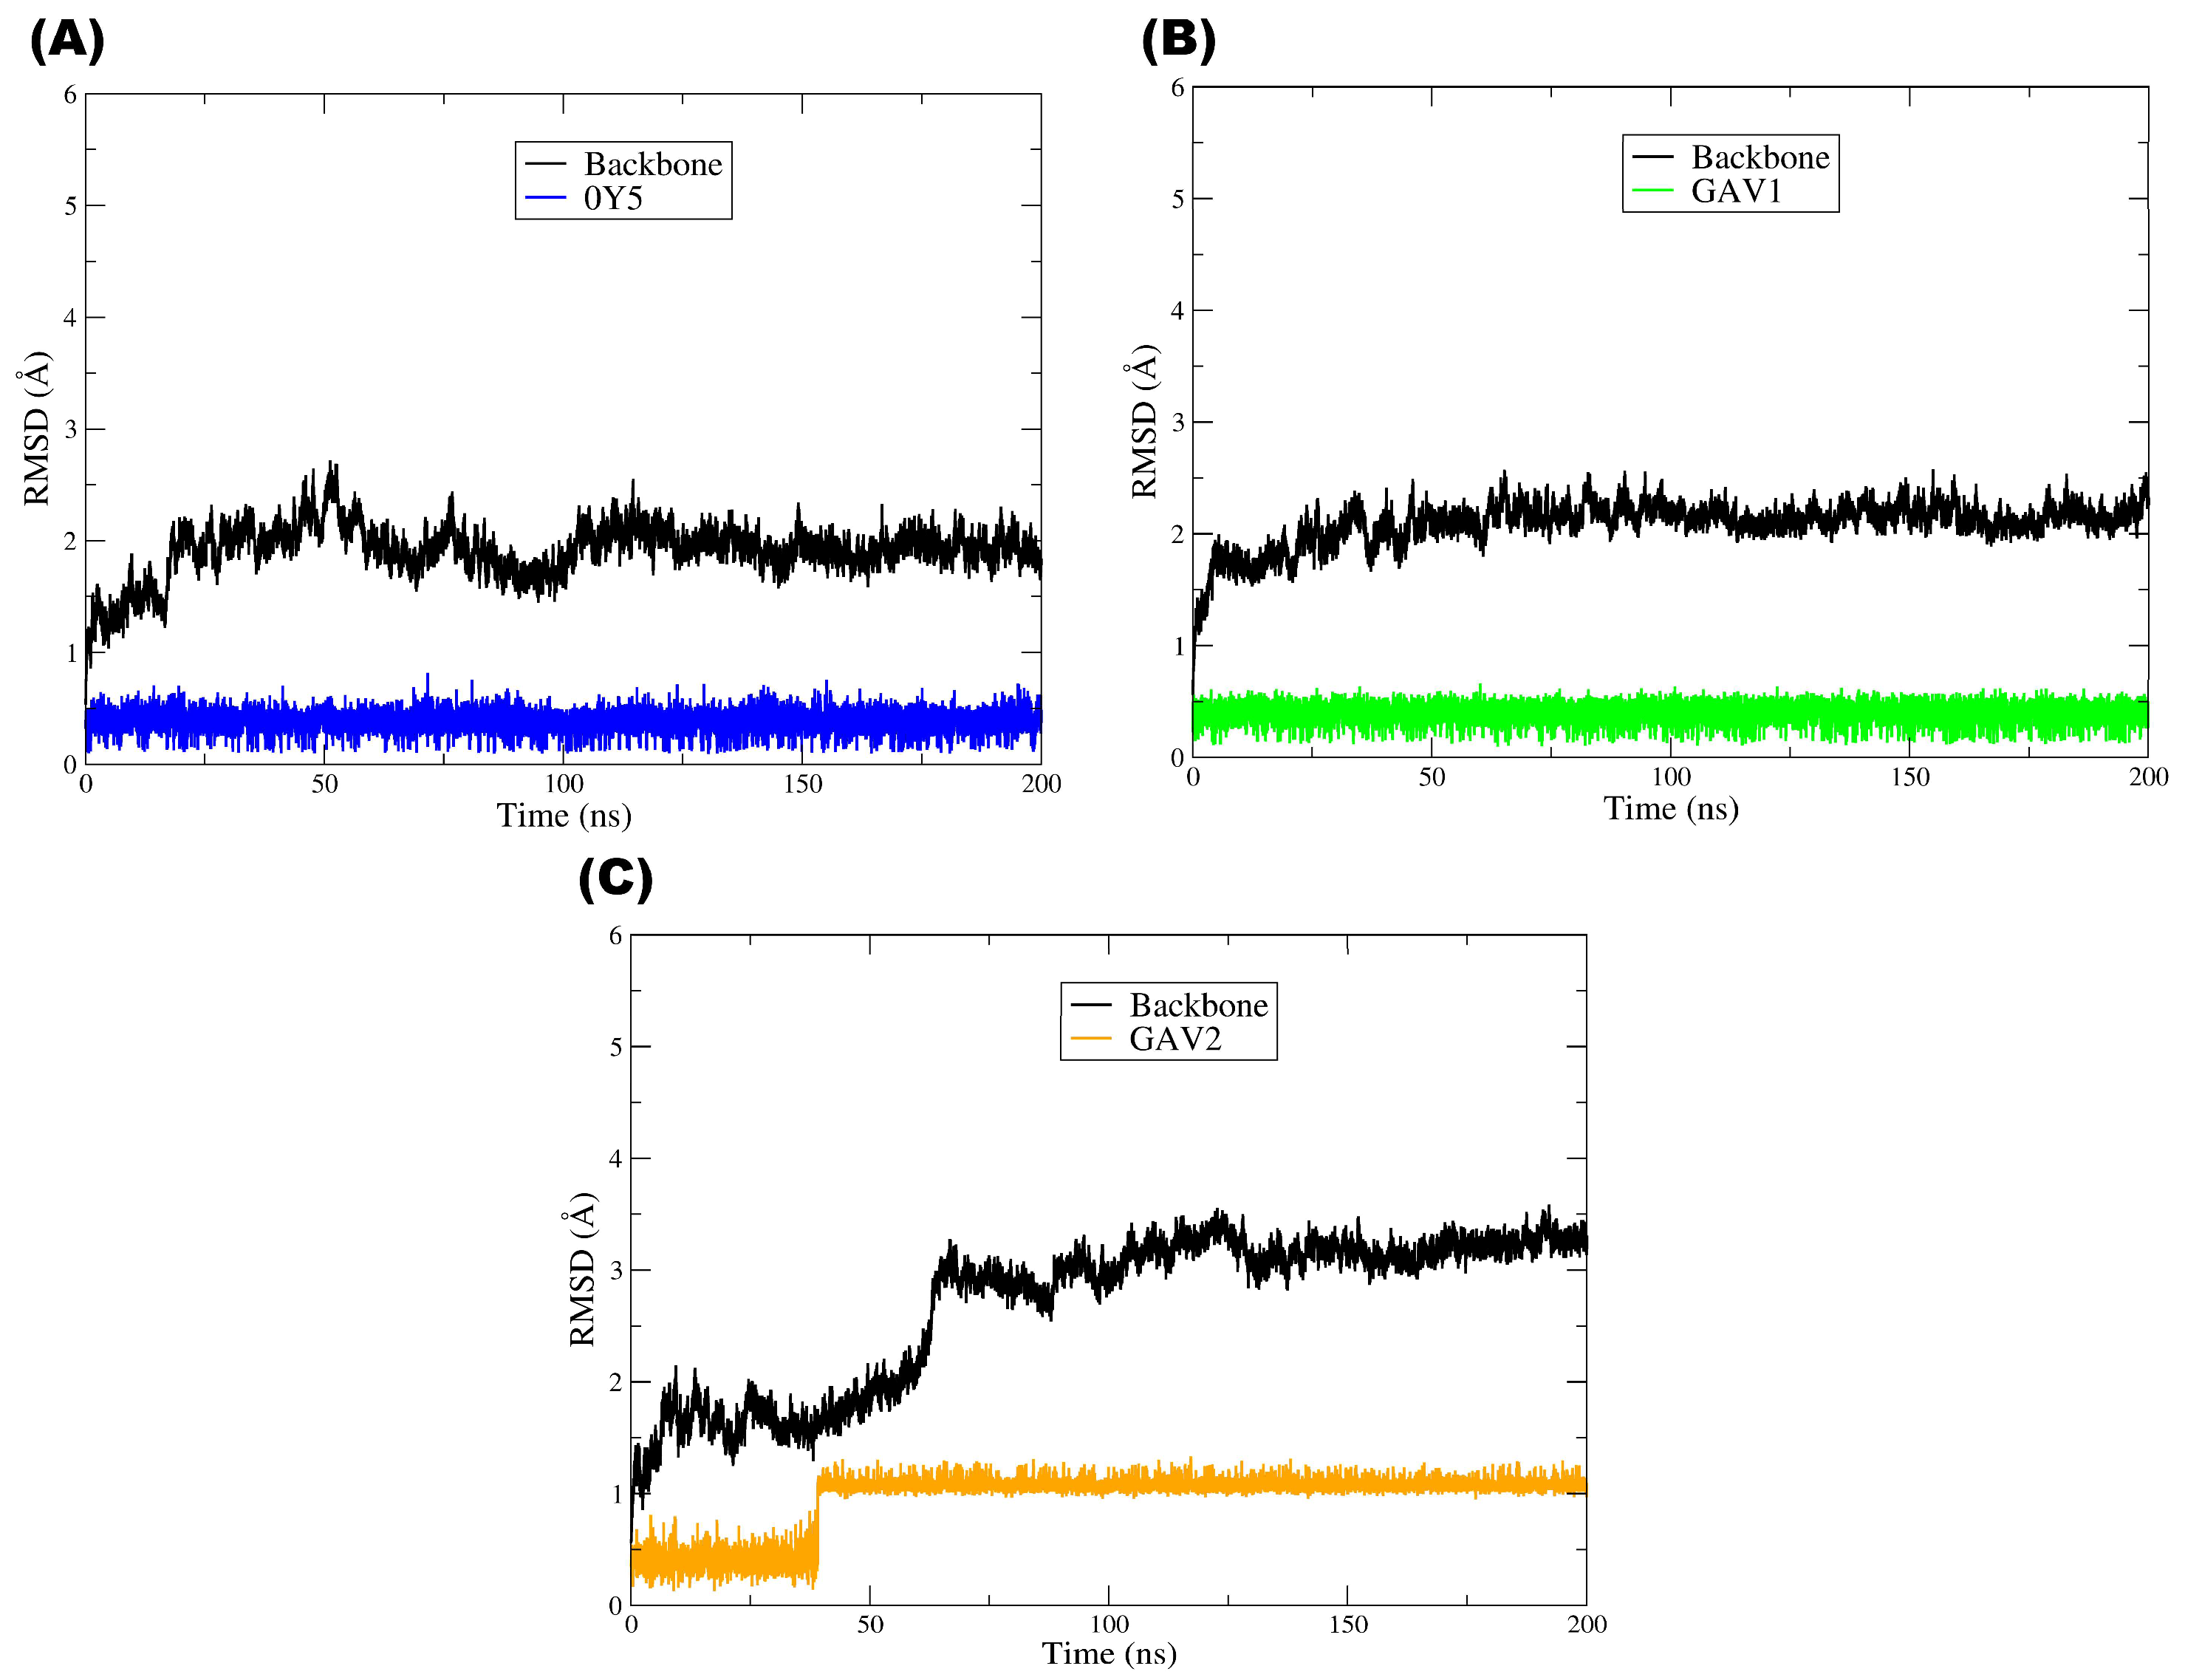
Figure 9 shows the RMSD plot corresponding to the molecular dynamics (MD) simulations of the TMK target (PDB: 4GSY), illustrating the temporal evolution of the structural deviation of the protein main chain (black line) and of ligands 0Y5 (blue), GAV01 (green), and GAV02 (orange) over 200 ns of simulation. The black line, corresponding to the RMSD of the protein main chain, exhibited low and relatively constant values throughout the simulation, with small fluctuations around ≈1–2.5 Å, although in the system with GAV02 a more pronounced increase in backbone RMSD was observed from approximately ≈60–70 ns onward, reaching a new plateau around ≈3.0–3.5 Å. This indicates that the overall TMK structure remained stable throughout the MD trajectory, showing globally continuous behavior and no persistent abrupt transitions in the systems with 0Y5 and GAV01, whereas the complex with GAV02 suggests a global conformational rearrangement followed by stabilization in a higher RMSD regime [
58].
With respect to the pivot compound 0Y5 (blue line), a low and stable RMSD profile was observed throughout the 200 ns simulation, with only small fluctuations after the initial accommodation phase, remaining predominantly around ≈0.2–0.6 Å. This behavior suggests that the ligand remained firmly associated with the TMK catalytic site throughout the simulation, reflecting the high affinity previously reported for this compound in experimental and computational studies. The conformational stability of 0Y5 during the molecular dynamics simulations is consistent with its role as the structural and functional reference in this study, serving as a comparative parameter for the selected compounds [
19].
Compound GAV01 (green line) exhibited RMSD values similar to those of the pivot ligand 0Y5, stabilizing at approximately ≈0.2–0.6 Å after the initial nanoseconds of the simulation. Despite these discrete fluctuations, the RMSD remained within a relatively constant range over time, with no trends toward progressive increase or abrupt instability events. This profile suggests that the ligand remained accommodated within the binding site while exploring local/fine conformational adjustments, a behavior frequently observed for ligands that retain a persistent binding mode [
54].
In turn, compound GAV02 (orange line) displayed distinct behavior, with a step-like transition occurring at approximately ≈35–45 ns. Initially, the RMSD oscillated around ≈0.2–0.6 Å and, after this transition, stabilized at a new level around ≈1.0–1.3 Å, maintaining moderate fluctuations until the end of the simulation. This behavior indicates ligand rearrangement/realignment within the catalytic site followed by stabilization, suggesting dynamic adaptation of the compound within a flexible protein environment. However, the absence of a continuous or irreversible increase in RMSD suggests that these fluctuations do not necessarily correspond to ligand dissociation from the catalytic site but rather to dynamic adaptation of the compound within a flexible protein environment. Previous studies have shown that larger ligands or those with multiple rotational degrees of freedom may display moderately elevated RMSD values while still maintaining relevant interactions with the biological target [
59].
Overall, the plot indicates that all the systems reached a dynamic equilibrium regime characterized by controlled RMSD fluctuations over time. The structural stability of the TMK main chain, together with ligand retention within the binding site throughout the simulation, suggest that the protein–ligand complexes are dynamically stable under the simulated conditions, particularly 0Y5 and GAV01, which maintained low and stable ligand RMSD, and GAV02, which stabilized after a ligand step transition and a backbone readjustment into a higher RMSD regime.
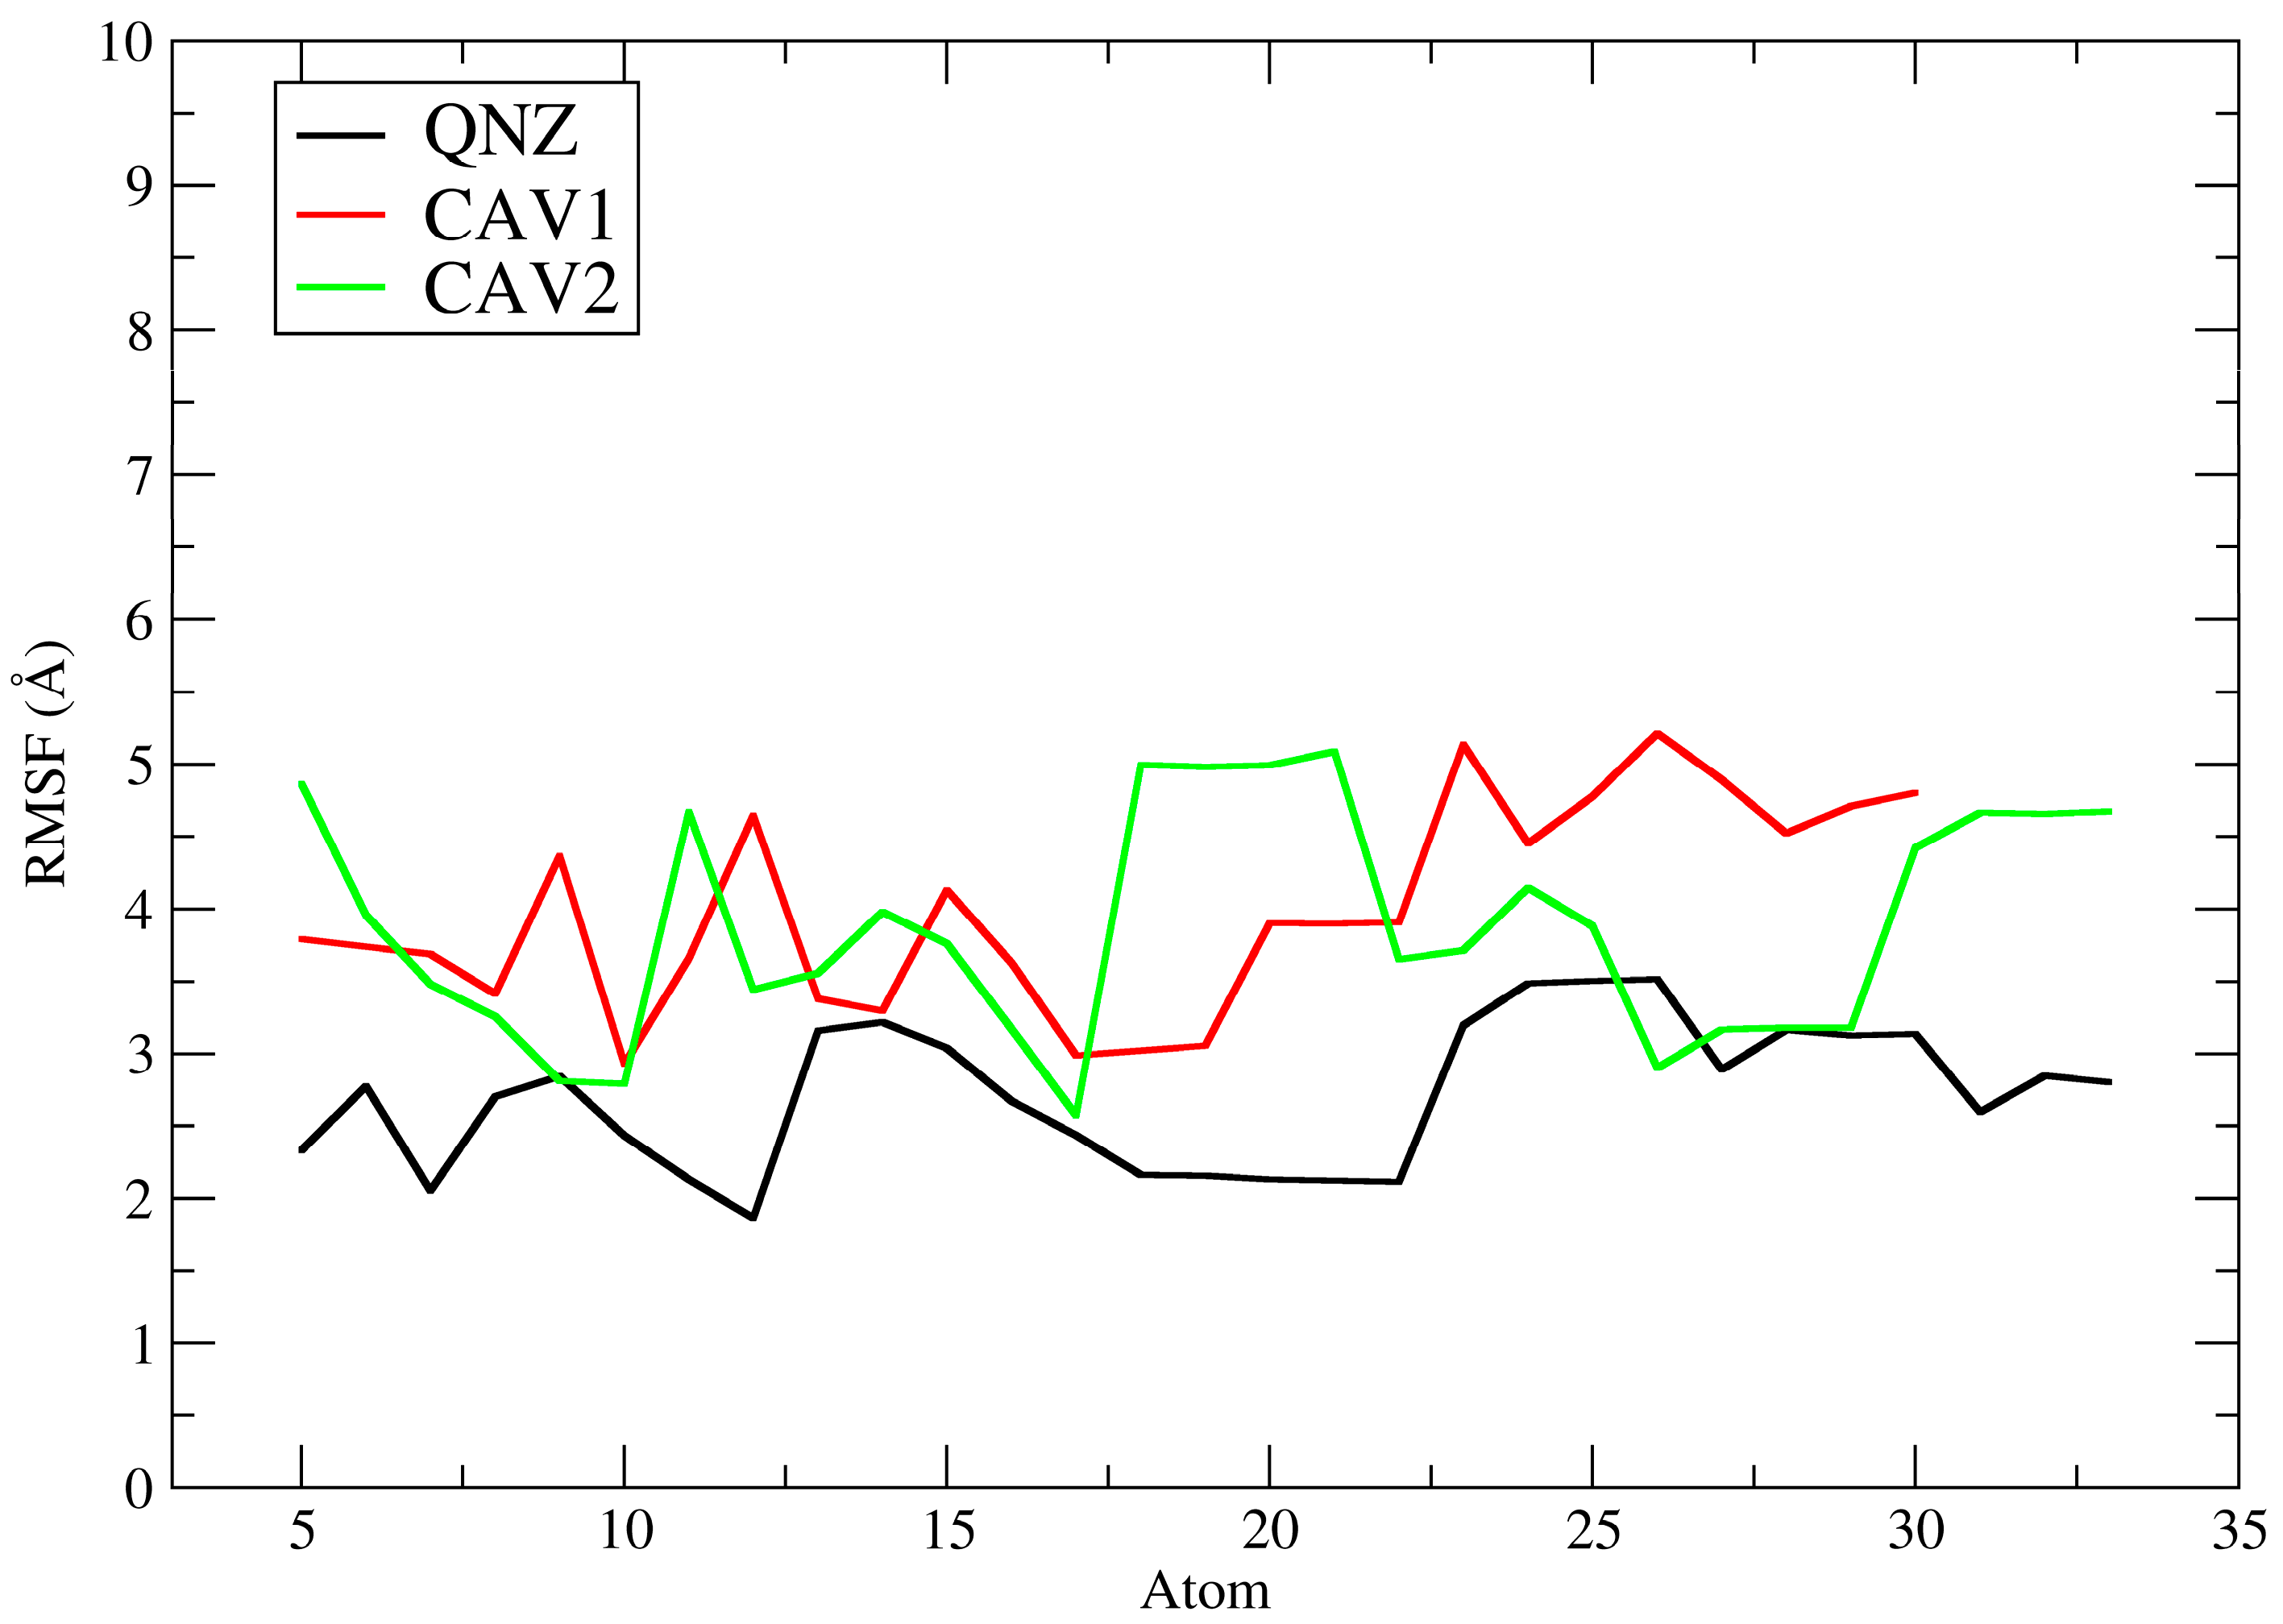
Figure 10 depicts the ligand root mean square fluctuation (L-RMSF) of ligands QNZ, CAV1, and CAV2 for the PBP2a target (PDB: 4CJN). The L-RMSF plot describes the root mean square fluctuation of each ligand atom for QNZ (black), CAV1 (red), and CAV2 (green) throughout the molecular dynamics simulations, allowing assessment of the internal flexibility of the ligands when complexed with the allosteric site of PBP2a. Unlike RMSD, which provides a global measure of structural displacement, RMSF offers local and detailed information on which regions of the ligand exhibit greater or lesser mobility during the simulation [
56].
In general, the pivot compound QNZ presented the lowest RMSF values across nearly its entire molecular structure, with fluctuations reaching approximately ≈2.0 to 3.5 Å and moderate peaks in specific regions. This behavior indicates lower intramolecular conformational flexibility, suggesting that different fragments of QNZ explored a more restricted conformational space while remaining associated with the allosteric site. This profile is consistent with ligands that, although biologically active, retain greater relative rigidity and a lower propensity for extensive dynamic rearrangements within the protein cavity [
60].
In contrast, compound CAV1 exhibited higher RMSF values than QNZ, with fluctuations predominantly concentrated between ≈3.0 and 5.2 Å across almost all its atoms, including more pronounced peaks in specific segments. This pattern suggests greater intramolecular flexibility and less restricted conformational behavior during the simulation, indicating that the ligand remained well accommodated within the binding site yet with a greater degree of internal freedom. According to the literature, higher ligand RMSF values may reflect greater mobility of peripheral moieties, often more solvent-exposed, even in stable complexes, particularly when combined with favorable affinity profiles obtained in molecular docking studies [
53].
Compound CAV2 showed a globally similar profile to that of CAV1 and higher than that of QNZ, with RMSF values generally ranging from ≈2.8 to 5.1 Å (
Figure 11). Notably, however, CAV2 exhibited a marked increase in one specific region (approximately atoms ≈18–21), reaching values close to ≈5.0–5.1 Å, followed by a reduction to more moderate ranges. This profile indicates that CAV2 displayed moderate to high flexibility, with certain more mobile regions, possibly associated with more exposed functional groups or with fewer stabilizing interactions with the protein. Nevertheless, the observed pattern suggests that the ligand maintained a relatively stable conformation within the allosteric site throughout the simulation, in agreement with the RMSD results.
A direct comparison among the three ligands reveals that QNZ displayed the lowest internal fluctuations, whereas CAV1 and CAV2 exhibited greater internal fluctuations, indicating more mobile conformational behavior during the molecular dynamics simulations. This finding is particularly relevant in the context of the computational screening conducted in this study since these compounds were selected based on more favorable docking affinity energies and advantageous pharmacokinetic and toxicological profiles. Thus, the L-RMSF data suggest that the screened compounds not only maintain relevant interactions with PBP2a but also exhibit greater intramolecular mobility than the pivot compound, which may reflect local conformational adaptations within the binding site without necessarily implying loss of complex stability.
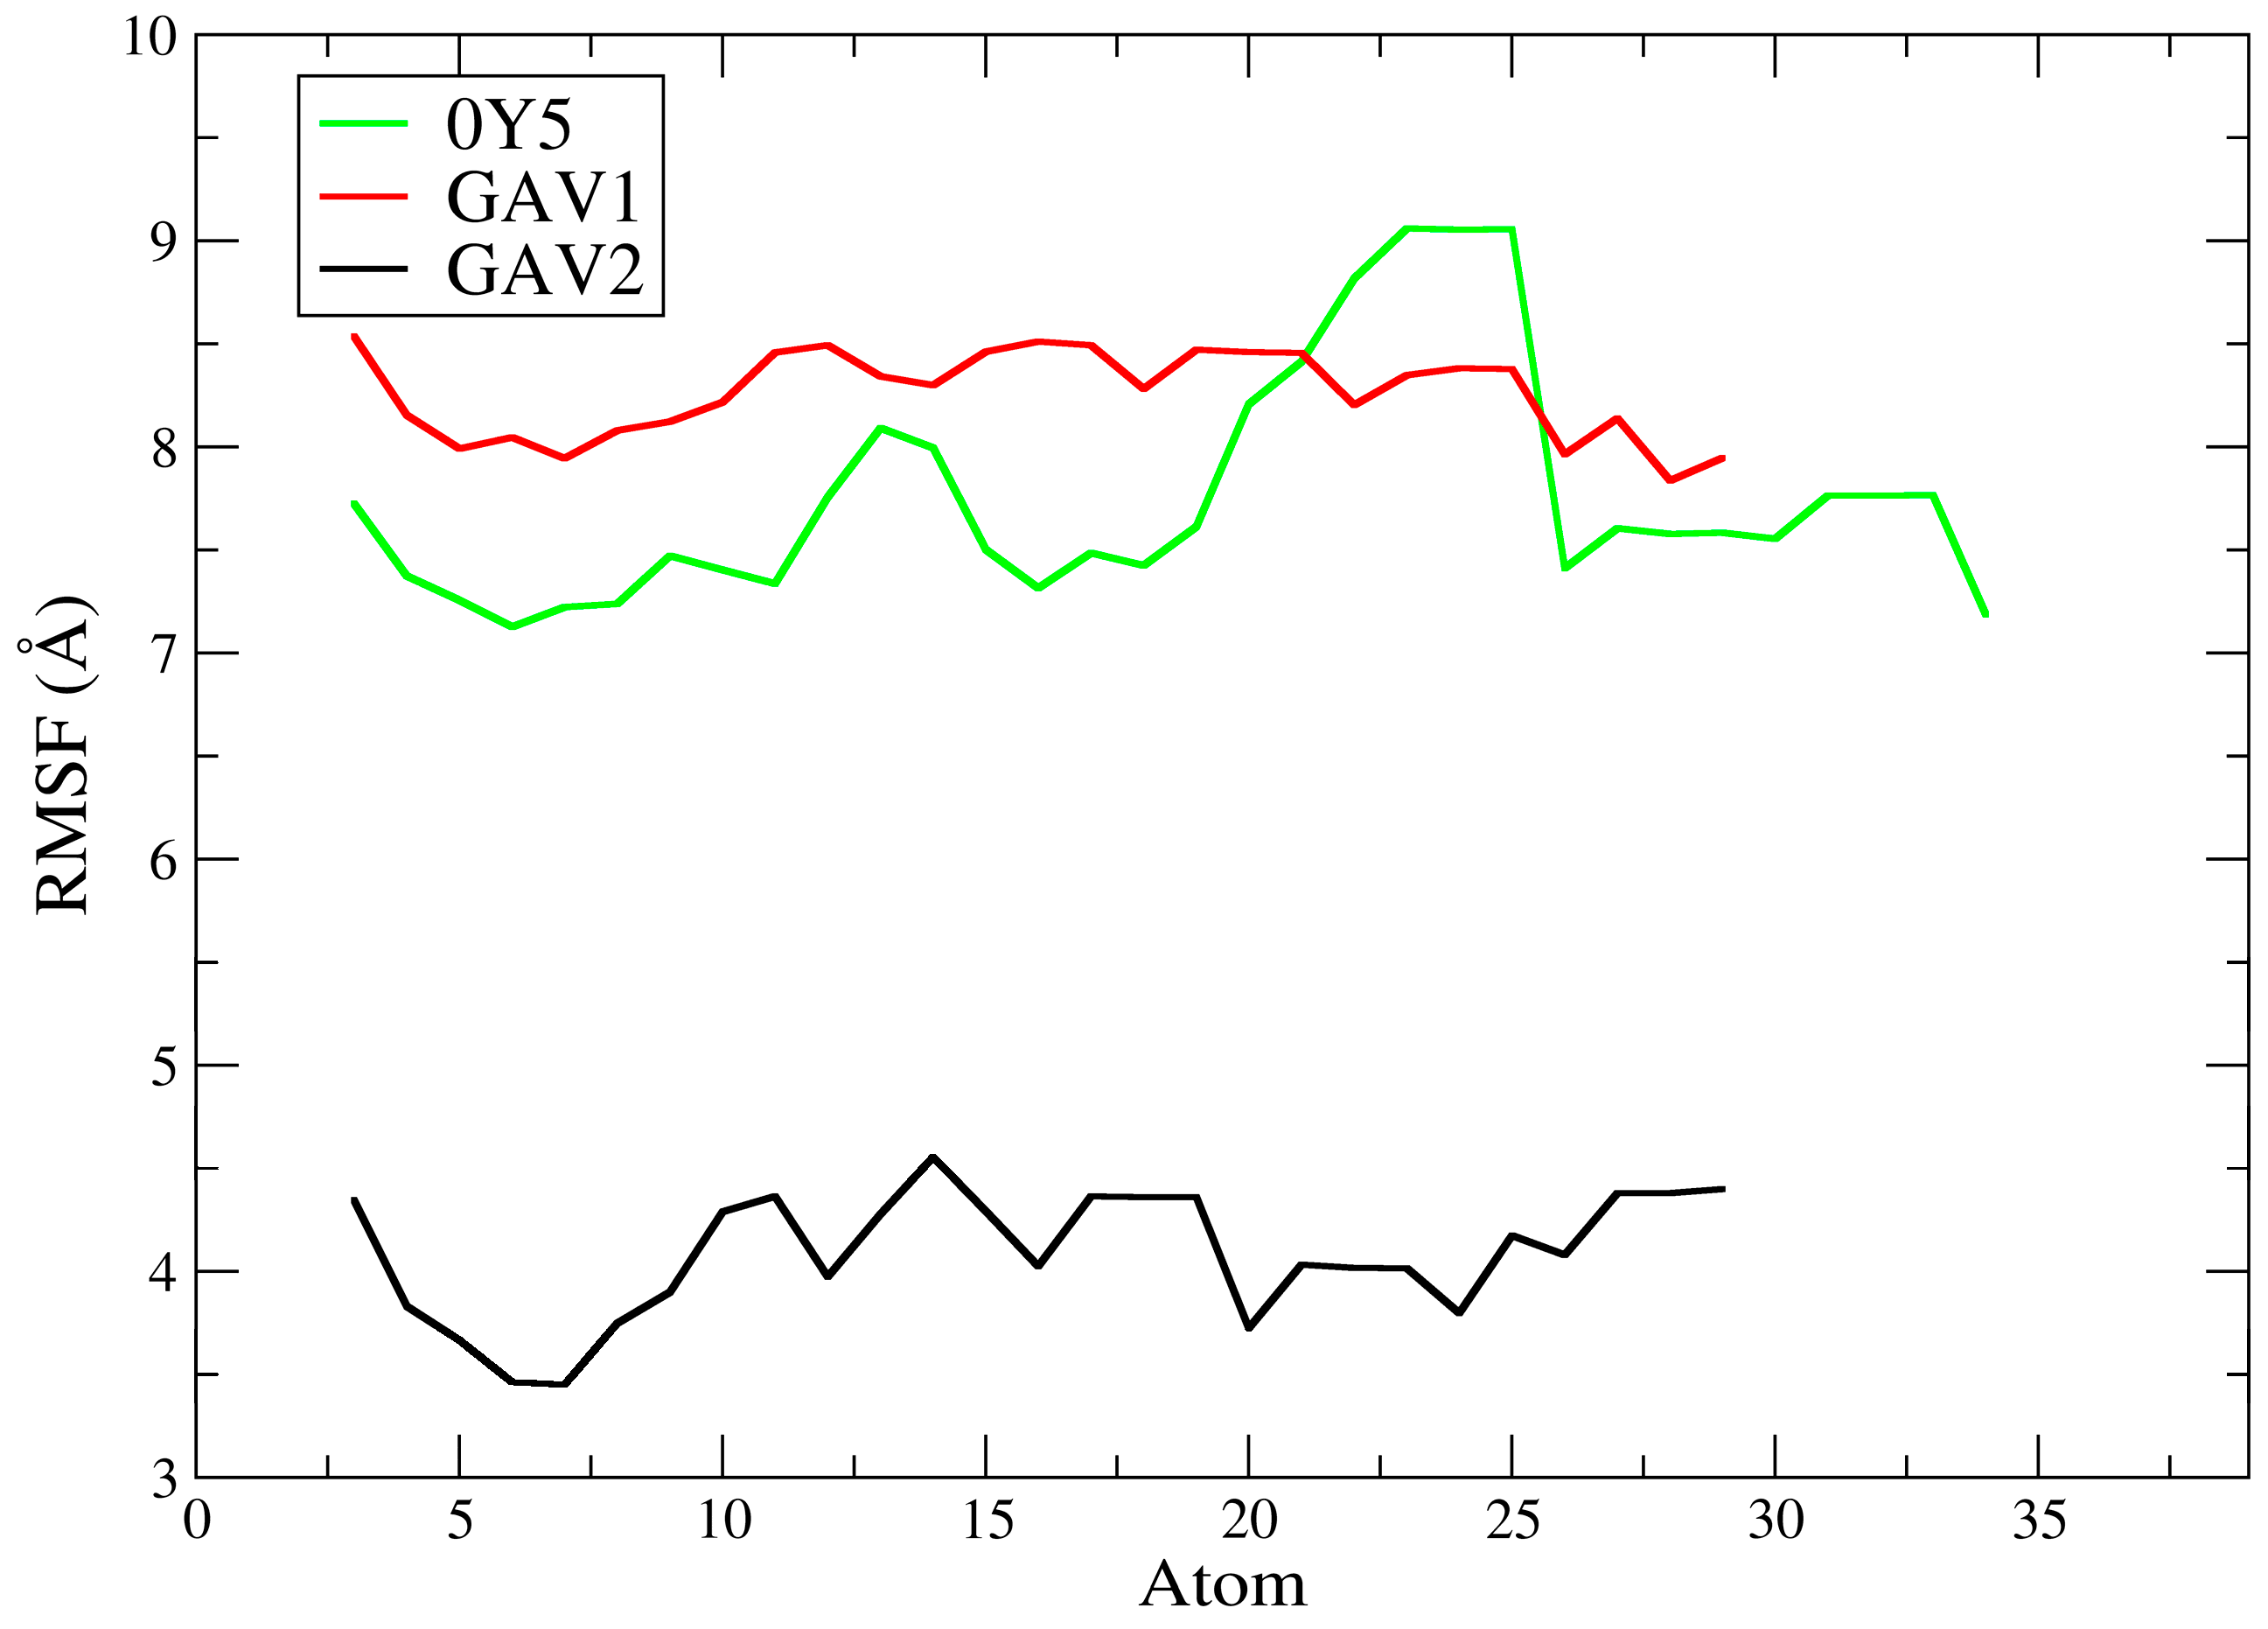
The pivot compound 0Y5 exhibited high RMSF values, predominantly around ≈7.1–9.1 Å across its entire molecular structure. A more pronounced increase was observed approximately between atoms ≈20 and 26, reaching a plateau close to ≈9.0–9.1 Å, followed by a reduction to a plateau around ≈7.2–7.8 Å in the terminal portions of the ligand. This profile indicates high intramolecular flexibility during the simulation, suggesting that the ligand may explore multiple internal conformations while remaining accommodated within the TMK catalytic site, with substantial fluctuations. This finding does not necessarily contradict the statement that ligand 0Y5 has high affinity for the bacterial enzyme [
19] since more mobile peripheral regions may coexist with stable core interactions and should be interpreted together with the profile observed in the RMSD analysis.
In contrast, compound GAV01 also presented high RMSF values but with a smaller amplitude of variation than 0Y5, remaining mostly between ≈7.8 and 8.6 Å, with relatively continuous fluctuations and no extremely pronounced abrupt peaks. This pattern indicates a high degree of conformational flexibility, suggesting that different ligand fragments explored multiple conformations during the dynamics. Such behavior may be associated with the presence of more exposed functional groups or a reduced number of stabilizing interactions with residues in the TMK catalytic site. As described in the literature, highly flexible ligands may exhibit elevated RMSF values while remaining associated with the target, reflecting dynamic adaptation within the enzymatic cavity [
57].
Compound GAV02 exhibited substantially more restricted behavior, with RMSF values predominantly around ≈3.4–4.6 Å across almost its entire molecular structure without increasing into the 7–9 Å range observed for 0Y5 and GAV01. This profile suggests that, although the ligand still displayed internal mobility, it was globally less flexible than GAV01 and 0Y5, maintaining moderate fluctuations across the analyzed atoms. Such behavior is frequently observed in ligands that retain a stable structural core within the binding site, while peripheral groups explore alternative conformations of smaller amplitude without compromising the overall association with the protein [
54].
A comparative analysis among the three ligands indicates that GAV02 exhibited the most restricted dynamic behavior (lowest L-RMSF), whereas GAV01 and 0Y5 displayed the greatest intramolecular flexibility, with 0Y5 showing the largest localized increase (≈atoms 20–26). These findings are consistent with the RMSD data discussed previously, in which 0Y5 and GAV01 exhibited low and stable RMSD, whereas GAV02 showed ligand rearrangement with a step transition and an increase in backbone RMSD to a higher regime, indicating that internal mobility (L-RMSF) and global stability (RMSD) may capture distinct aspects of the dynamic behavior of the complex. Taken together, the L-RMSF results suggest that the selected compounds remained associated with the TMK catalytic site, although they differed substantially in their degree of internal flexibility during the simulation.
It is important to note, however, that lower RMSF values do not necessarily imply greater biological activity, but rather indicate more restricted dynamic behavior under the simulated conditions. Therefore, the L-RMSF results should be interpreted as complementary evidence of the ligand’s intramolecular conformational flexibility within the protein–ligand complex, contributing to the rational prioritization of candidates in in silico studies, without extrapolation beyond the computational scope of the present work [
57]. It is worth emphasizing that efficacy and biological activity studies will be conducted in future in vitro and in vivo phases of this research. Our computational results reinforce the predicted selection of these ligands for future experimental stages, further supporting the role of the computational approach in saving resources and directing future investigations toward the molecules with the best results through the in silico approach.
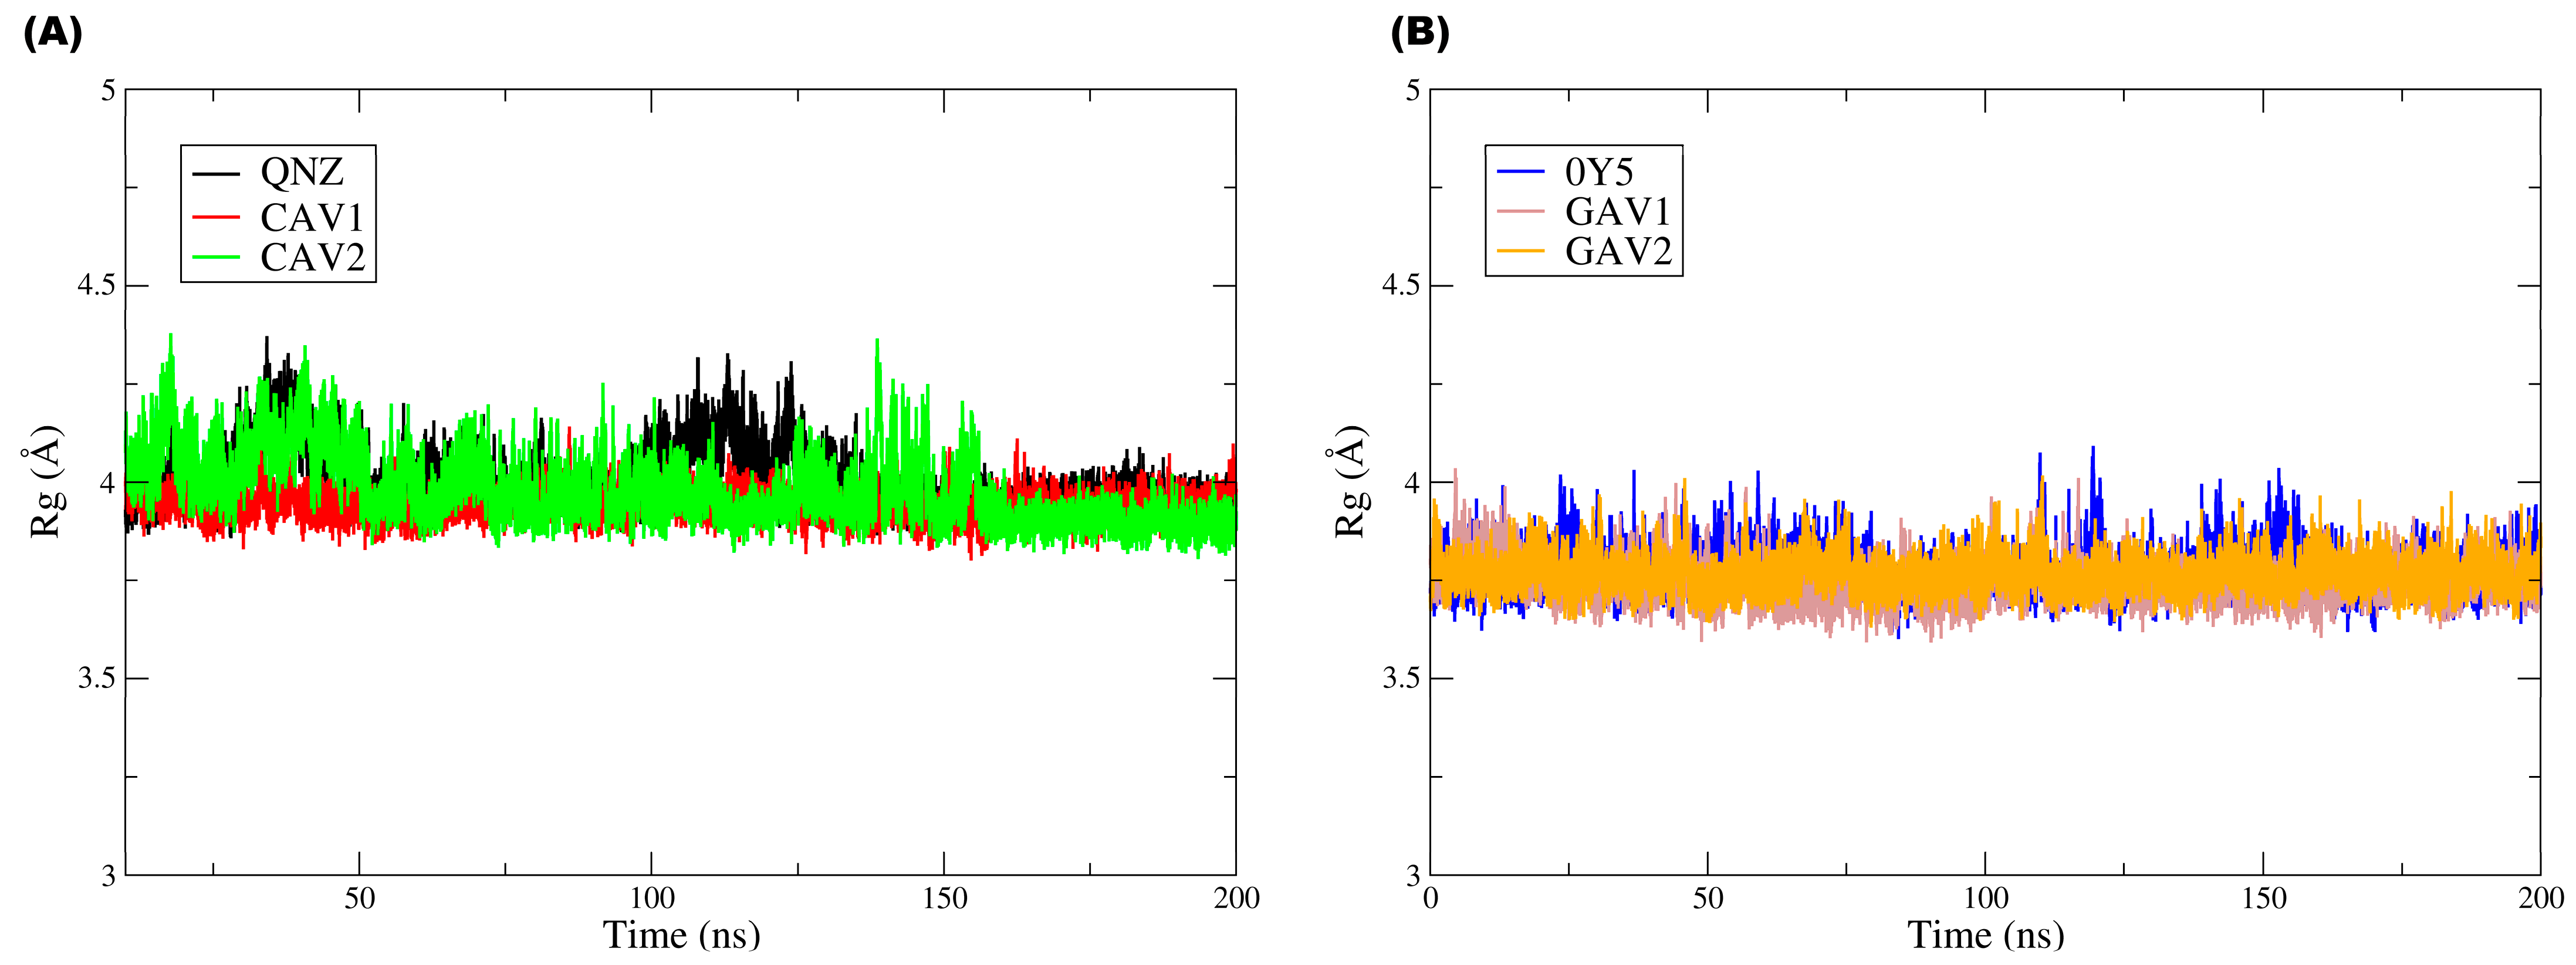
Figure 12 groups the Rg plots for both targets and their respective ligands, with
Figure 12A corresponding to QNZ, CAV1, and CAV2 and
Figure 12B corresponding to 0Y5, GAV01, and GAV02.
In
Figure 12B, it can be observed that the three ligands displayed very similar Rg values (around ≈3.9–4.2 Å), with moderate fluctuations over 200 ns and no continuous drift or persistent abrupt changes. Compound QNZ did not exhibit the lowest mean Rg values; on the contrary, it showed moderate fluctuations and discrete episodes of transient increase (approximately around ≈100–120 ns), reaching values close to ≈4.2 Å, suggesting small temporary conformational expansions during the simulation. Compound CAV1 (red) generally displayed the most constrained profile, with slightly lower Rg values (≈3.9–4.0 Å) and lower fluctuation amplitude, indicating a more compact and stable overall conformation over time. Compound CAV2 (green) maintained Rg values within the same general range but with greater variability and more frequent transient peaks than CAV1, reflecting episodes of reversible conformational expansion. The absence of prolonged maintenance of these peaks suggests that such events correspond to adaptive rearrangements, with no evidence of persistent ligand destabilization.
Ligands 0Y5, GAV01, and GAV02 also exhibited similar Rg values (≈3.6–4.0 Å), with moderate fluctuations and no trend toward progressive increase throughout the trajectory. Ligand 0Y5 (blue) was not the one with the lowest Rg values; rather, it oscillated around ≈3.7–3.9 Å, with occasional peaks approaching ≈4.0 Å, suggesting slight variation in overall compactness over time. Compound GAV01 (gray) tended to present the lowest mean values and the most stable profile, remaining predominantly around ≈3.6–3.8 Å, which is compatible with greater overall compactness. Compound GAV02 (orange) exhibited values very similar to those of GAV01, with slightly more evident fluctuations in some segments but without standing out as having the highest mean Rg in the set, indicating moderate and reversible global conformational flexibility.
The Rg results indicate that none of the ligands exhibited progressive loss of structural compactness during the molecular dynamics simulations, reinforcing that the fluctuations observed in the other metrics reflect natural and reversible conformational adaptations under dynamic conditions rather than structural destabilization.
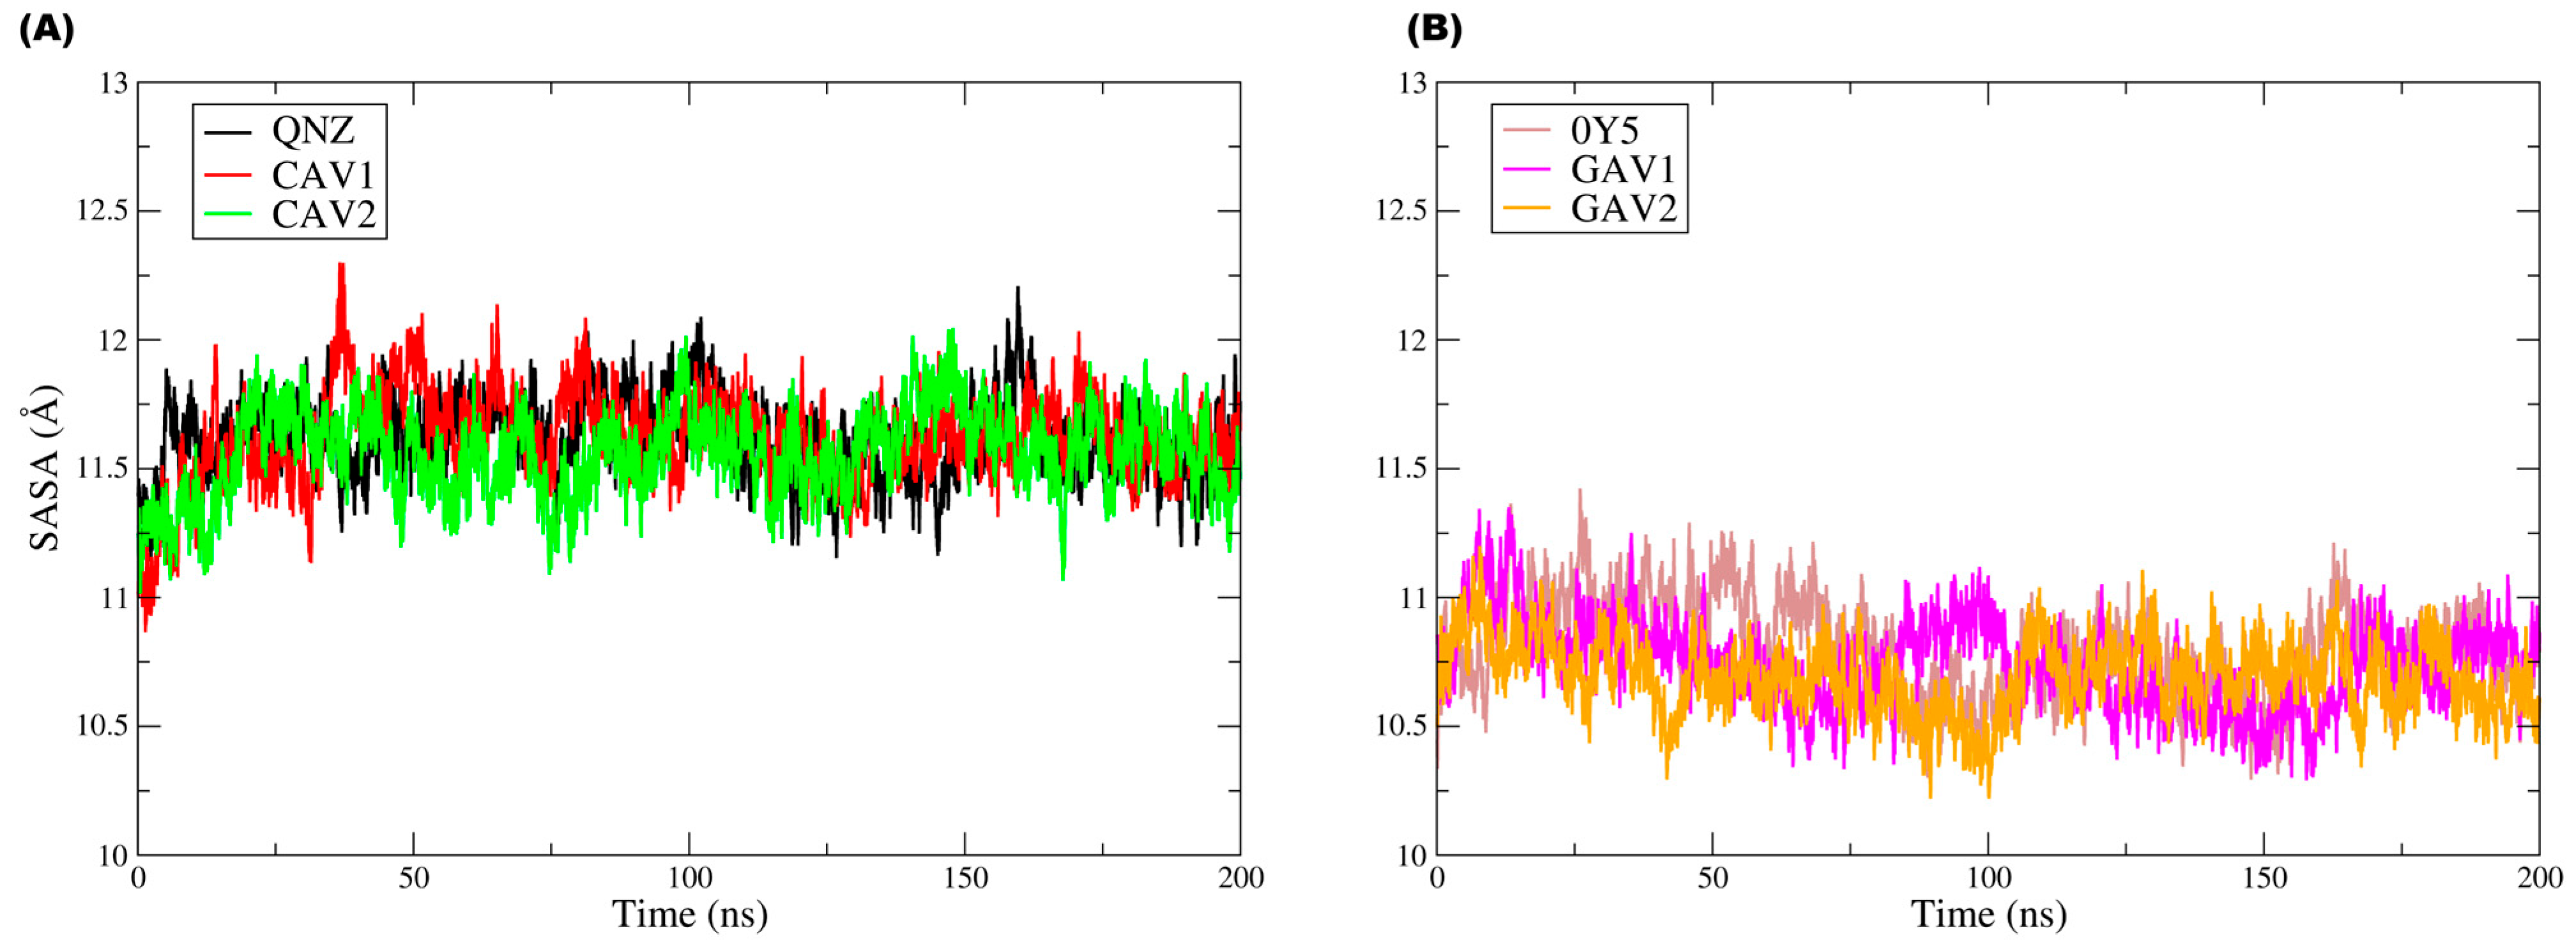
Figure 13 shows the unified solvent-accessible surface area (SASA) plot.
The analysis of the solvent-accessible surface area (SASA) throughout the simulation provides complementary information on solvent exposure and on possible global conformational rearrangements along the trajectory, allowing evaluation of the ligand surface area accessible to water molecules.
For the ligands in the PBP2a complexes (QNZ, CAV1, and CAV2), the SASA profiles reveal that the systems remained globally stable in terms of solvent exposure, with no continuous increasing or decreasing trends that would indicate structural opening events or conformational collapse. An initial increase in SASA was observed during the first nanoseconds, followed by stabilization at a relatively constant plateau, with moderate fluctuations throughout the 200 ns simulation. Approximately, the values were concentrated mainly around ≈11.2–11.9 Å, with occasional peaks near ≈12.0–12.2 Å, particularly for CAV1 and QNZ in some intervals. The moderate fluctuations in solvent-accessible area are consistent with local rearrangements and transient reorientation of exposed surfaces without compromising the overall structural organization or protein–ligand association. The SASA values oscillated within well-defined ranges, suggesting that the observed variations reflect natural dynamic conformational adjustments of the system in solution rather than persistent structural instability, as corroborated by the RMSD and L-RMSF data.
Likewise, for the TMK complexes (0Y5, GAV1, and GAV2), the SASA analysis indicated stability with respect to solvent exposure, with no evidence of pronounced structural opening or conformational collapse throughout the trajectory. In panel (B), the SASA values remained predominantly around ≈10.4–11.1 Å, with moderate fluctuations and no continuous drift. 0Y5 tended to occupy slightly higher values during part of the trajectory, especially in the early-to-middle simulation period, whereas GAV1 and GAV2 displayed comparable oscillations, with small transient depressions, for example around ≈80–110 ns, before returning to the mean plateau. In both plots, the SASA values remained confined within well-defined intervals, suggesting that the observed variations correspond to transient and reversible conformational rearrangements typical of biologically relevant systems in aqueous environments.
Taken together, the molecular dynamics data provide an integrated and consistent view of the dynamic behavior of the evaluated complexes. The low conformational deviations of the protein main chain indicate that ligand binding does not compromise the overall structural stability of the studied targets, whereas the ligand RMSD and RMSF profiles reflect dynamic conformational adaptations that are compatible with well-equilibrated systems, with no evidence of dissociation from the binding sites. In addition, the SASA profiles demonstrate that solvent exposure remained stable within narrow ranges, corroborating the absence of pronounced global conformational changes during the trajectories. Although differences in the degree of flexibility and interaction patterns were observed among the compounds, ligands CAV1 and CAV2, as well as GAV1 and GAV2, maintained continuous association with their respective functional sites, showing data consistent with the criteria adopted in the computational screening. Thus, within the limitations inherent to exclusively in silico studies, the results obtained corroborate that these ligands display satisfactory structural and dynamic properties, making them suitable for future in vitro and in vivo experimental evaluation, where their biological activity and pharmacological profiles may be properly validated.
Table 11 and
Table 12 present the binding affinity energy (MM/GBSA) values for the ligands evaluated in complexes with PBP2a and TMK, calculated from the molecular dynamics simulations. In all cases, negative ΔGbinding values were observed, indicating favorable ligand association with their respective targets. For the PBP2a set, the predicted affinity ranking (most favorable → least favorable) was QNZ (−31.48 kcal/mol) > CAV2 (−29.43 kcal/mol) > CAV1 (−27.10 kcal/mol). For the TMK set, the hierarchy was 0Y5 (−26.81 kcal/mol) > GAV1 (−25.32 kcal/mol) > GAV2 (−23.46 kcal/mol).
Table 11 presents the affinity energy values for ligands QNZ, CAV1, and CAV2 in complex with PBP2a (PDB: 4CJN), calculated by MM/GBSA. The analyzed energetic components include van der Waals interactions (ΔEvdW), electrostatic energy (ΔEele), polar solvation energy (ΔGGB), nonpolar solvation energy (ΔGNP), and total binding energy (ΔGbinding).
For QNZ, a marked contribution from van der Waals interactions was observed (ΔEvdW = −36.50 kcal/mol), together with electrostatic interactions (ΔEele = −12.80 kcal/mol), partially offset by the polar solvation penalty (ΔGGB = +22.10 kcal/mol). Nonpolar solvation contributed favorably (ΔGNP = −4.28 kcal/mol), resulting in ΔGbinding = −31.48 kcal/mol. This profile indicates that the energetic gain is predominantly vdW-driven, with electrostatic reinforcement, whereas the polar term (ΔGGB) imposes a consistent penalty, as expected in GB models.
For CAV2, ΔGbinding remained close to that of the pivot compound (ΔGbinding = −29.43 kcal/mol), supported by strongly favorable van der Waals interactions (ΔEvdW = −34.80 kcal/mol) and a relevant electrostatic contribution (ΔEele = −11.20 kcal/mol). As observed for QNZ, there was a substantial polar penalty (ΔGGB = +20.05 kcal/mol), partially compensated by the nonpolar term (ΔGNP = −3.48 kcal/mol). In the overall balance, CAV2 exhibited robust complex stabilization, mainly through packing/dispersion (vdW), but with a slightly less intense nonpolar contribution and somewhat weaker attractive interactions than QNZ, explaining its less negative ΔGbinding.
For CAV1, the total binding energy was the least favorable of the set (ΔGbinding = −27.10 kcal/mol). This result arises mainly from weaker attractive contributions (ΔEvdW = −31.45 kcal/mol; ΔEele = −9.51 kcal/mol) and a less favorable nonpolar term (ΔGNP = −2.90 kcal/mol) despite presenting the lowest polar solvation penalty among the three (ΔGGB = +16.76 kcal/mol). Thus, the limiting factor for CAV1 is the lower overall efficiency of dispersion and electrostatic contacts rather than an excessive polar cost.
Table 12 presents the affinity energy values for ligands 0Y5, GAV1, and GAV2 in complex with TMK (PDB: 4GSY), calculated by MM/GBSA, considering the same components (ΔEvdW, ΔEele, ΔGGB, ΔGNP, and ΔGbinding).
For 0Y5, the most negative ΔGbinding of the TMK set was observed (ΔGbinding = −26.81 kcal/mol), driven by attractive van der Waals (ΔEvdW = −30.90 kcal/mol) and electrostatic contributions (ΔEele = −9.80 kcal/mol), as well as a favorable nonpolar contribution (ΔGNP = −3.21 kcal/mol) despite a relatively larger polar penalty (ΔGGB = +17.10 kcal/mol). This energetic balance suggests that, also in TMK, the driving force is predominantly vdW, with an additional electrostatic contribution that is partially counteracted by polar desolvation.
For GAV1, ΔGbinding was close to that of 0Y5 (ΔGbinding = −25.32 kcal/mol), with slightly less intense attractive contributions (ΔEvdW = −29.60 kcal/mol; ΔEele = −9.10 kcal/mol) and a less favorable nonpolar term (ΔGNP = −2.62 kcal/mol) but with reduced polar penalty (ΔGGB = +16.00 kcal/mol). This balance explains the moderate difference relative to the pivot ligand.
For GAV2, the least negative ΔGbinding was observed (ΔGbinding = −23.46 kcal/mol), mainly reflecting reduced attractive contributions (ΔEvdW = −27.80 kcal/mol; ΔEele = −8.40 kcal/mol) and a less intense ΔGNP (ΔGNP = −2.66 kcal/mol) despite the lowest polar penalty in the set (ΔGGB = +15.40 kcal/mol). Therefore, the reduction in vdW/electrostatic contributions predominates in the balance and governs the lower energetic favorability of GAV2.
Comparatively between the targets, the PBP2a complexes exhibited more negative ΔGbinding values (QNZ: −31.48; CAV2: −29.43; CAV1: −27.10 kcal/mol) than the TMK complexes (0Y5: −26.81; GAV1: −25.32; GAV2: −23.46 kcal/mol), suggesting a more pronounced relative energetic preference in the PBP2a set under the same MM/GBSA formalism. This difference is consistent with stronger vdW contributions in PBP2a (ΔEvdW up to −36.50 kcal/mol) compared with TMK (ΔEvdW up to −30.90 kcal/mol), whereas PBP2a also imposes larger polar penalties (ΔGGB up to +22.10 kcal/mol) than TMK (ΔGGB up to +17.10 kcal/mol), reflecting a higher desolvation cost.
The MM/GBSA results reinforce that the affinity hierarchy is governed primarily by ΔEvdW (packing/dispersion) and, secondarily, by ΔEele and ΔGNP, whereas ΔGGB acts as a counterbalancing penalty in all cases. Within the limitations inherent to MM/GBSA, and considering that moderate differences (≈1–3 kcal/mol) should be interpreted with caution, the energetic data support the prioritization of CAV2 (for PBP2a) and GAV1 (for TMK) as promising candidates as they combine more favorable ΔGbinding with dynamic profiles previously compatible with stable complexes (RMSD/RMSF/Rg/SASA), with no evidence of global instability in the analyzed trajectories.



 ,
,