Article

Genome-Wide Association Analysis and Candidate Gene Prediction of Wheat Wet Gluten Content

1
Henan Institute of Crop Molecular Breeding, Henan Academy of Agricultural Sciences, Zhengzhou 450001, China
2
Shennong Laboratory, Zhengzhou 450002, China
*
Authors to whom correspondence should be addressed.
These authors contributed equally to this work.
Int. J. Mol. Sci. 2026, 27(2), 827; https://doi.org/10.3390/ijms27020827
Submission received: 5 December 2025 / Revised: 6 January 2026 / Accepted: 8 January 2026 / Published: 14 January 2026
(This article belongs to the Special Issue Molecular Research on Crop Quality)

Abstract

The wet gluten content (WGC) of wheat is a key indicator of wheat-processing quality, and its genetic basis is extremely critical in breeding. This study evaluated the WGC of 207 wheat accessions under three growing seasons from a natural population. Nine quantitative trait loci (QTLs) explained 7.61–15.18% of phenotypic variation in a genome-wide association study (GWAS) using a 660K SNP array. Among them, qWGC6B.2 on chromosome 6BL was consistently detected across multiple environments, accounting for 10.08–12.27% of variation. Incorporating grain transcriptome data led to the identification of TaWGC6B.1 (TraesCS6B02G386700), which is highly expressed in developing endosperm and strongly correlated with WGC. A competitive allele specific PCR (KASP) marker development and validation indicated that the Whaas68366_GG allele significantly enhanced gene expression and WGC. This study identified key genes and molecular markers, providing theoretical and technical support for WGC genetic improvement in wheat (Triticum aestivum L.).

1. Introduction

Around 17% of the world’s cultivated grain area is planted with wheat (Triticum aestivum L.), making it one of the most important staple crops [1]. Wheat flour plays an essential role in food production, and is used for baking bread, biscuits, cakes, noodles, steamed buns, and more [2]. Wheat production directly impacts the food industry and national food security. WGC is a critical criterion in wheat grading and is lower in Chinese varieties of strong-gluten wheat than in their foreign counterparts. For strong wheat, medium-strong wheat, medium wheat, and weak gluten wheat, the WGC standard is >30.5%, >28.5%, >24.0%, and <24.0%, respectively, at 14% moisture [3].
Wheat-processing quality is primarily determined by gluten proteins, including glutenins and gliadins, whose structure and ratio dictate wet gluten’s elasticity and extensibility [4]. Bread, buns, and noodles benefit from strong gluten because it enhances dough strength, water absorption, and tensile resistance. Selecting appropriate flour based on WGC can enhance product quality since wheat with different WGC levels is suitable for different end-use products. WGC is significantly correlated with bread volume and overall quality score, but excessive WGC may negatively impact bread firmness. A WGC of 30% is required for optimal bread quality [4,5,6].
Additionally, WGC significantly affects the sensory and palatability characteristics of steamed foods [2]. A uniform gluten network promotes gas retention and fermentation, which eventually results in a softer and elastic texture in steamed buns. The WGC of high-quality steamed buns normally needs to be between 25% and 30% [7]. Noodles made from flour with a higher WGC will be stronger with greater tensile strength but will also be softer and less elastic. Premium noodles usually have a WGC between 28% and 35% [8]. Studies show that WGC between 28% and 32% yields optimal results for volume, color, skin smoothness, internal texture, and flavor in northern Chinese wheat-based foods [9].
Recent years have seen the widespread use of marker-assisted selection (MAS) for breeding wheat varieties with high yield, resistance, quality, and adaptability [10,11]. By using a variety of mapping populations, multiple QTLs associated with WGC have been identified across nearly all chromosomes [12,13,14,15]. Li et al. [16] mapped 15 QTLs on chromosome 5A in an RIL population, with QWgc.WY-5A.2 explaining the largest proportion of phenotypic variation (28.37–36.76%). A variation explanation rate of 16.43% was reported for QWgc.sdau-6D on chromosome 6D by Sun et al. [17]. Li et al. [15] detected 16 QTLs across the 11 chromosomes, with stable loci on 3A, 4D, 5B, and 7B. However, QTL mapping using traditional bi-parental populations has limited resolution and detects only loci segregating between the parents. A genome-wide association study (GWAS) is more precise in detecting QTLs for complex traits by leveraging broader natural genetic variation [18,19,20]. Lou et al. [12] identified nine QTLs for WGC by GWAS on chromosomes 1A, 1B, 3A, 3D, and 6A. Chen et al. [14] found 129 significant SNPs on 2DL, 3AL, 6AS, etc., with explanation rates ranging from 10.4% to 33.3%. Among them, BS00046964_51 and IAAV5188 exhibited opposing regulatory effects on WGC on chromosome 6AS.
This study utilized 207 wheat accessions with diverse genetic backgrounds and geographical origins, 224,706 SNPs, and WGC data across three years. A mixed linear model (MLM) was used for GWAS to uncover stable loci, identify candidate genes, and develop KASP marker. The findings aim to provide a theoretical basis for quality wheat breeding and WGC regulatory mechanism research.

2. Results

2.1. Phenotypic Statistical Analysis of Wheat Wet Gluten Content

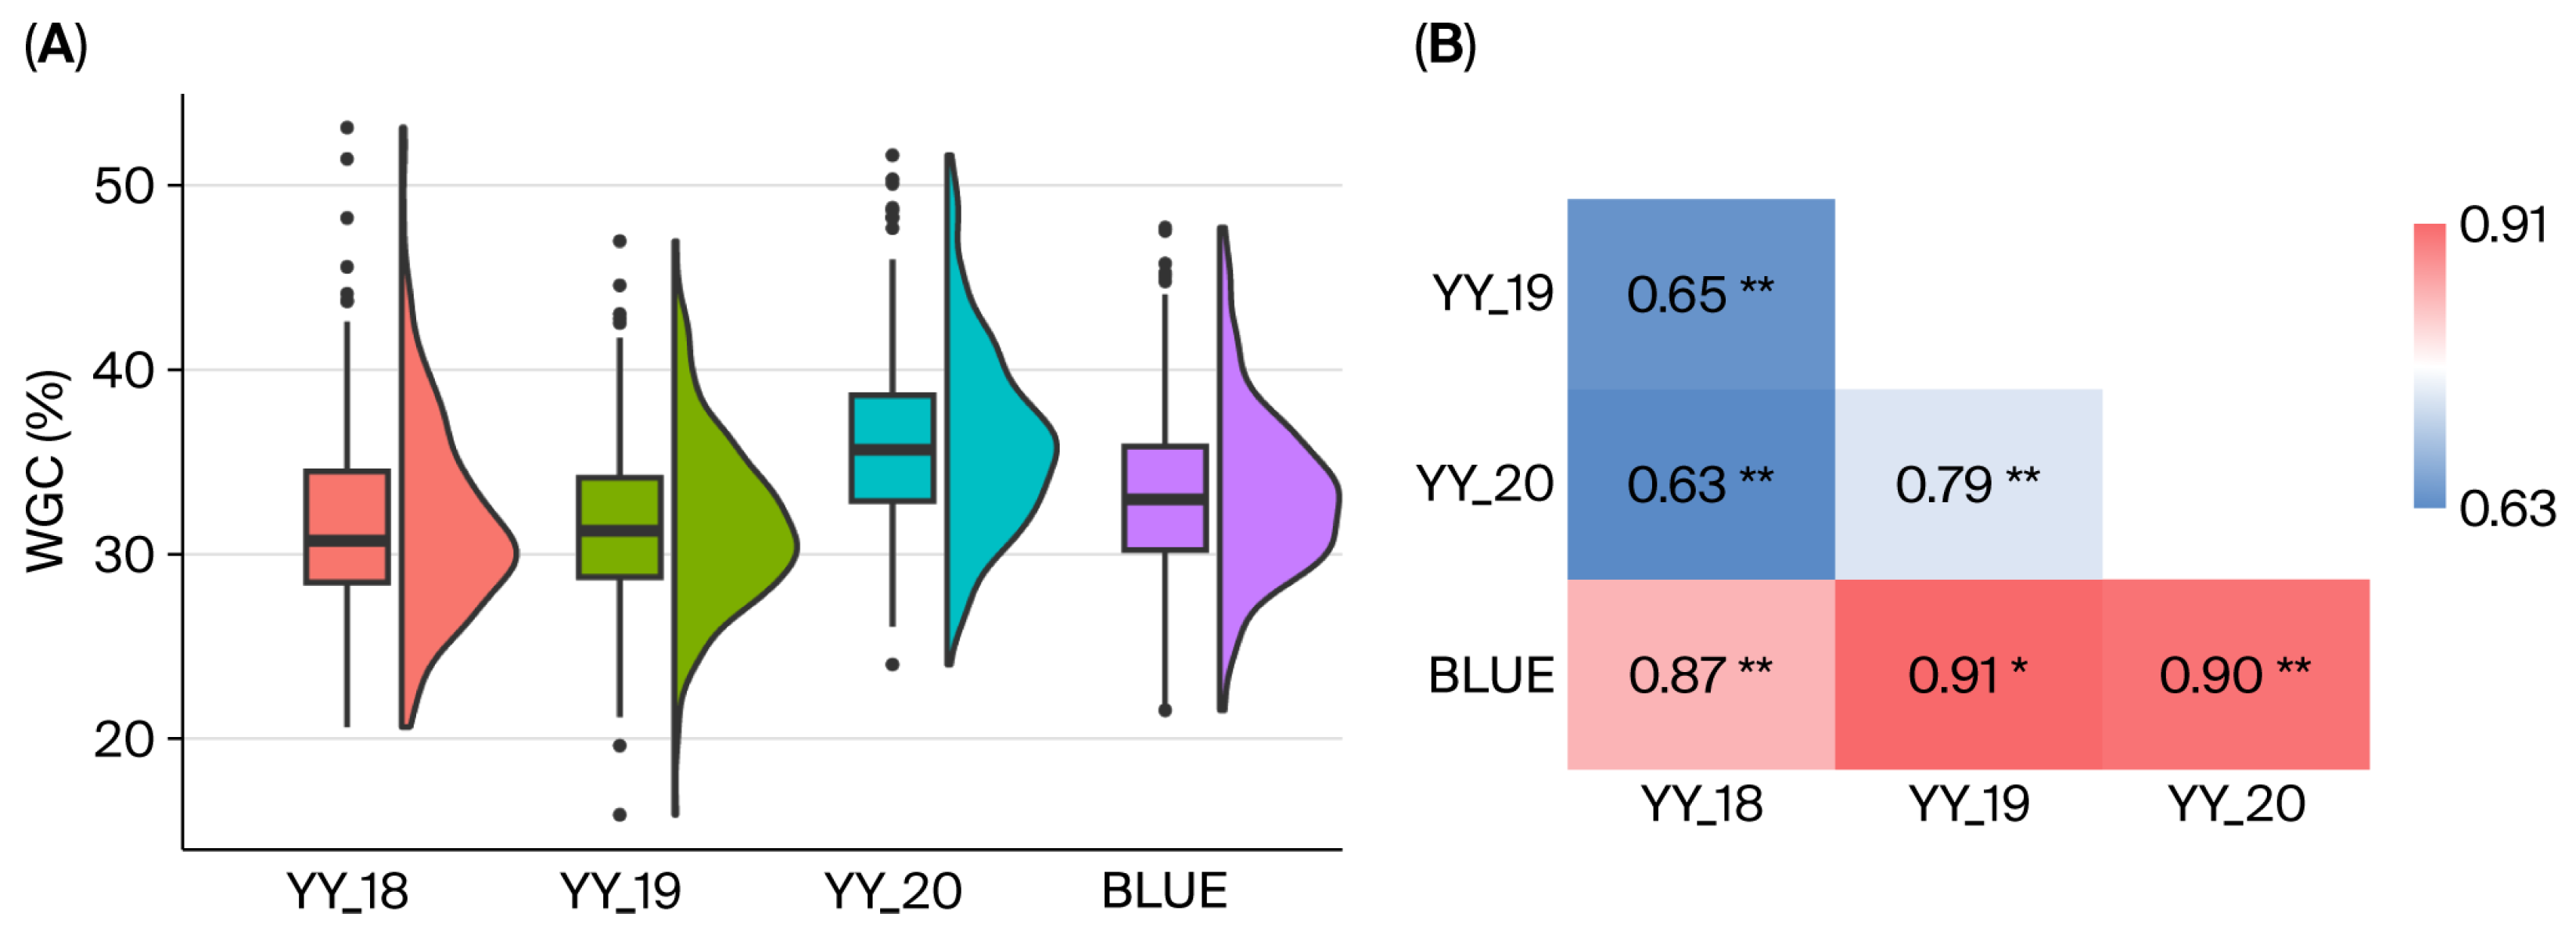
Wet gluten content (WGC) was measured in a natural wheat population across three environments (growing seasons from 2017 to 2020). The results indicated substantial phenotypic variation in WGC across the different varieties (Figure 1, Table S1). The mean WGC varied from 31.65% to 36.03% in the environments YY_18, YY_19, YY_20 and Best Linear Unbiased Estimator (BLUE) values, with coefficients of variation between 13.69% and 17.08% (Table S2). BLUE values ranged from 21.52% to 47.68%, with an average of 33.23%. Highly significant positive correlations were observed for WGC across all environments, with correlation coefficients ranging from 0.63 to 0.91 (p < 0.001). The broad-sense heritability for WGC estimated was 0.91. The results indicated that WGC is predominantly controlled by genetic factors and is a typical polygenic quantitative trait.

2.2. Genome-Wide Association Analysis of WGC

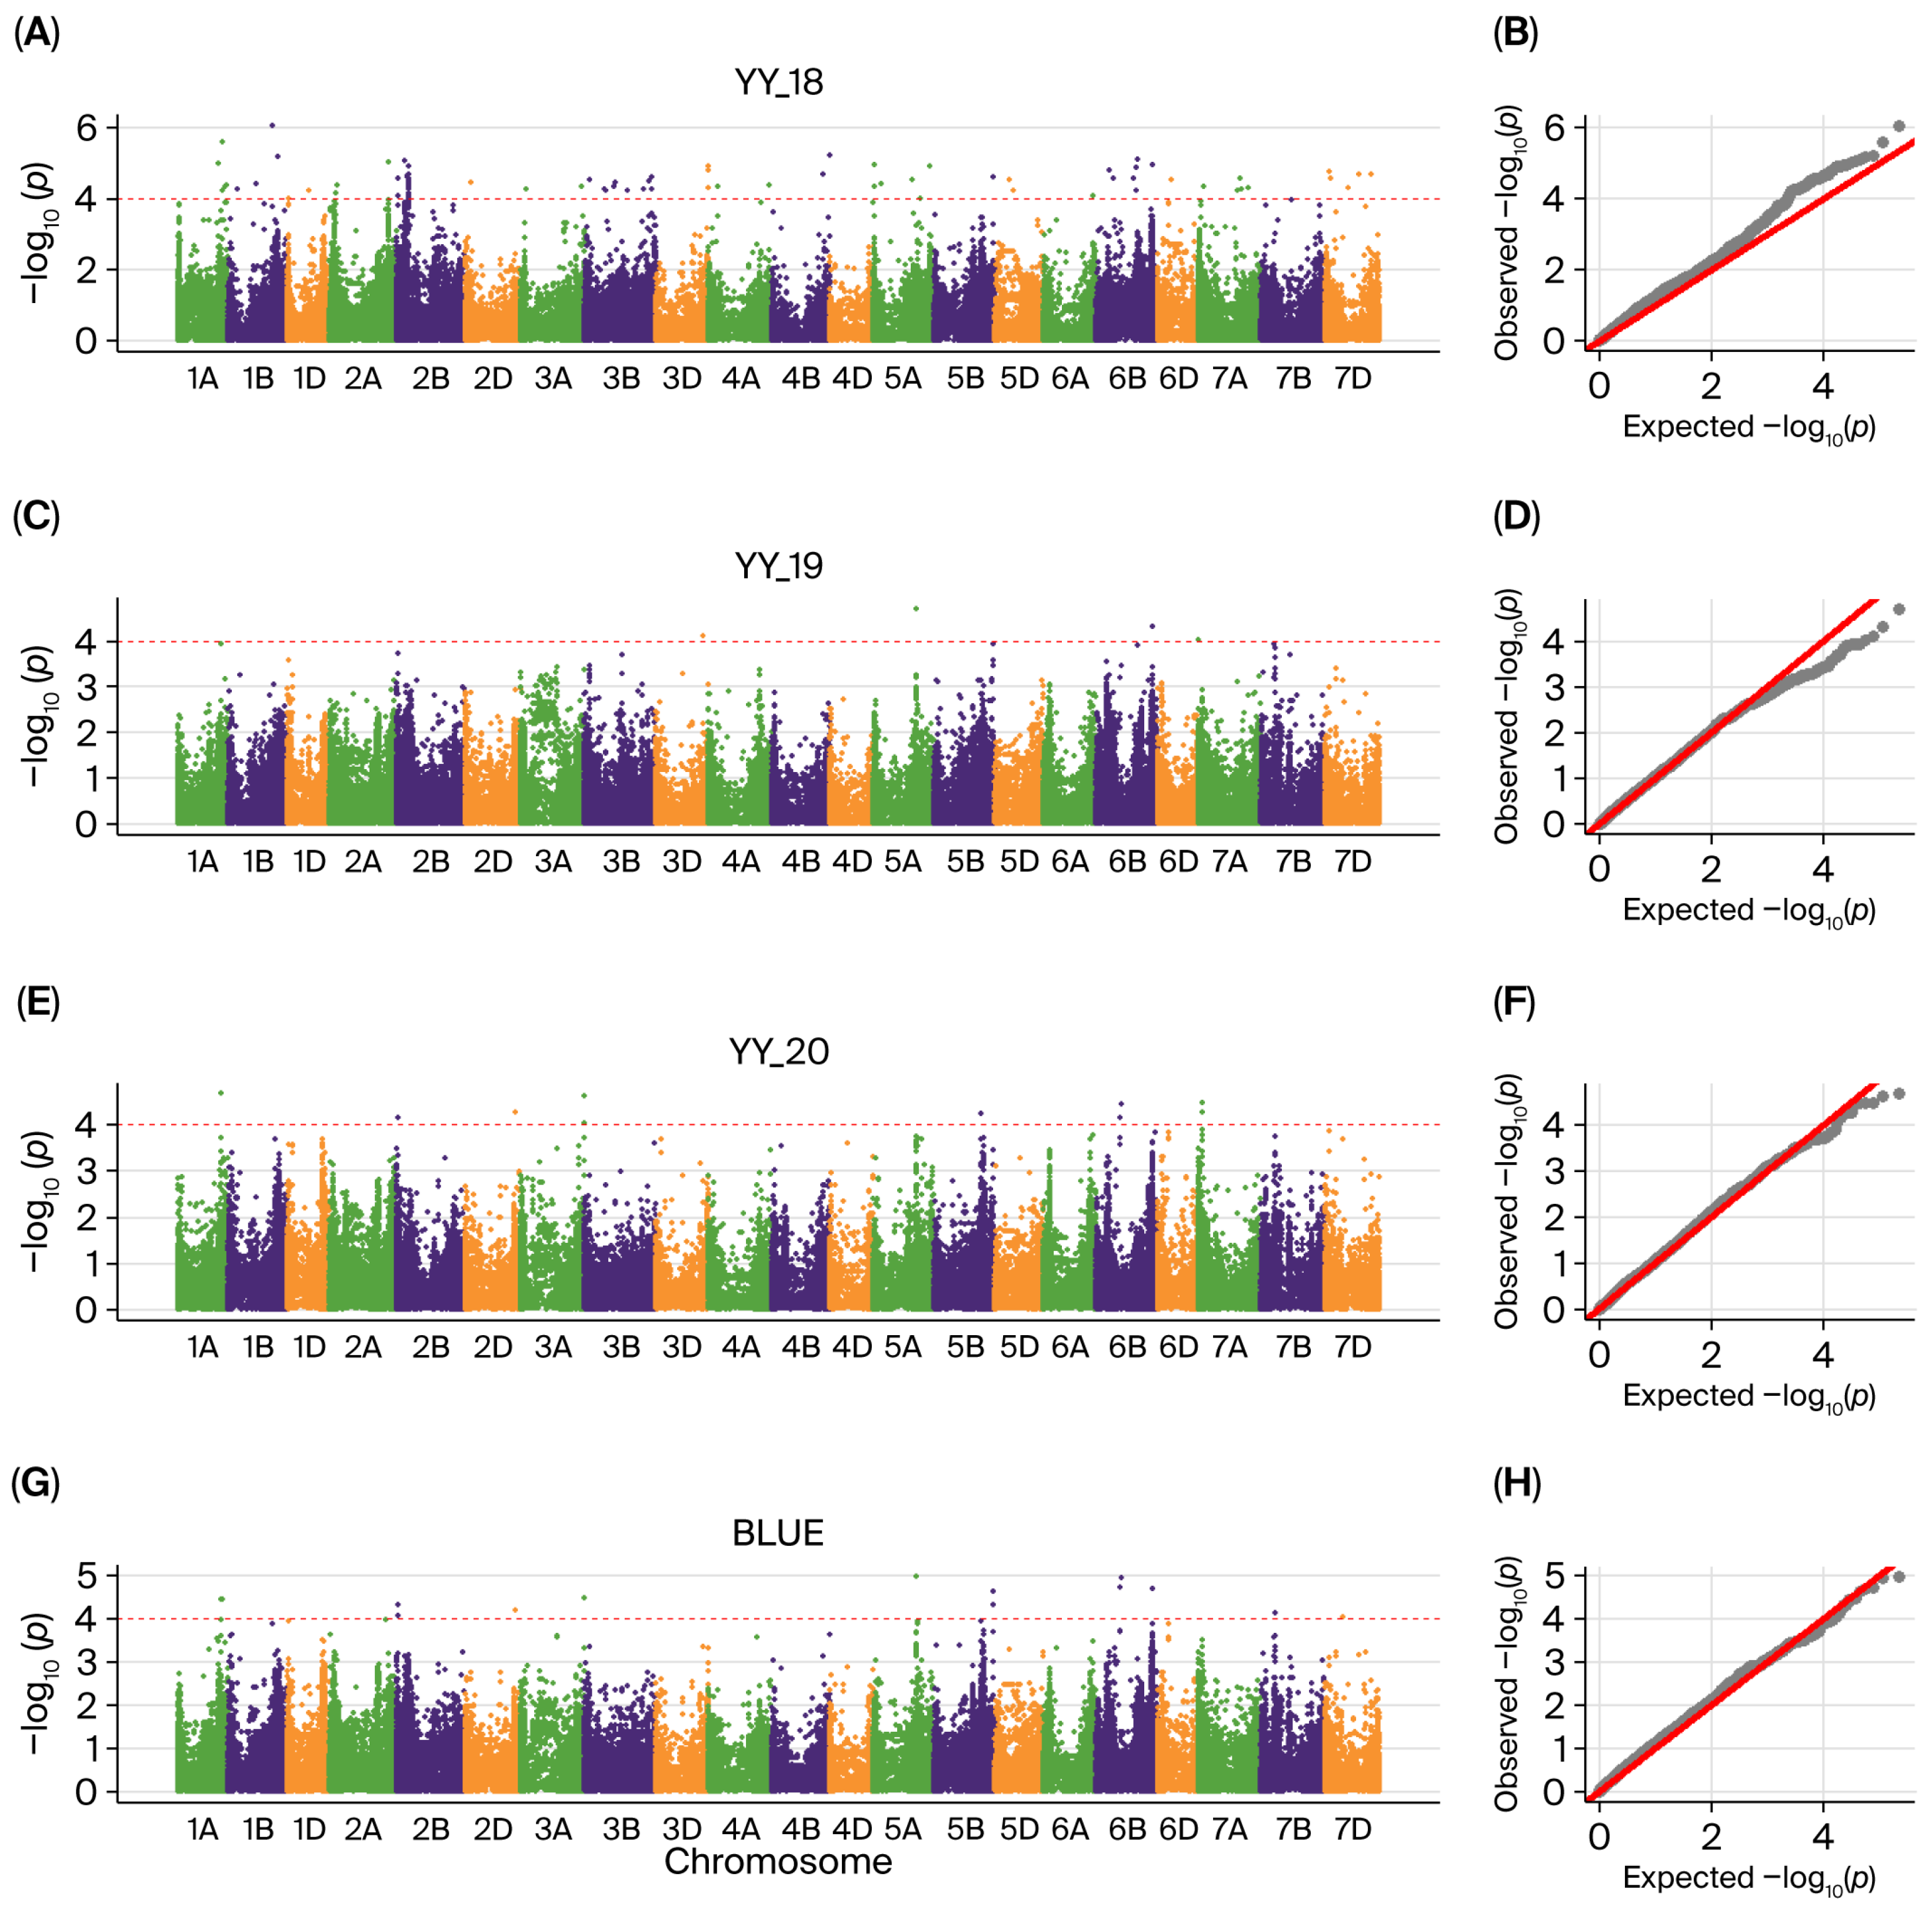
Nine quantitative trait loci (QTLs) were identified on chromosomes 1AL, 1BL, 1DS, 5AL, 5BL, 6BS, and 6BL and were stably expressed in at least two environments (Figure 2, Table 1 and Table S3). Additionally, 7.61% to 15.18% of phenotypic variation was explained by these QTLs. Both qWGC1A.1 and qWGC1A.2 were found on 1AL, explaining 9.76–10.99% and 10.10–14.02% of variation, respectively. The highest explained variance was seen in qWGC1B.1 on 1BL (9.28–15.18%). qWGC1D.1 on 1DS was located at 0.34 Mb and detected in environments YY_18 and YY_19. The qWGC5A.1 explained 10.92–10.96% of the variance on 5AL, whereas qWGC5B.1 explained 7.68–8.21% and 9.47–11.30% of the variance on 5BL, respectively. qWGC6B.1 has been identified on 6BS (10.43–11.10%). qWGC6B.2 showed stable major-effect QTL characteristics across all environments, with an explained variance of 10.08–12.27%. Different allelic genotypes within each QTL region showed significant differences in WGC, with favorable alleles increasing it by approximately 9.41% to 36.49% (Table S4).

2.3. Candidate Gene Analysis

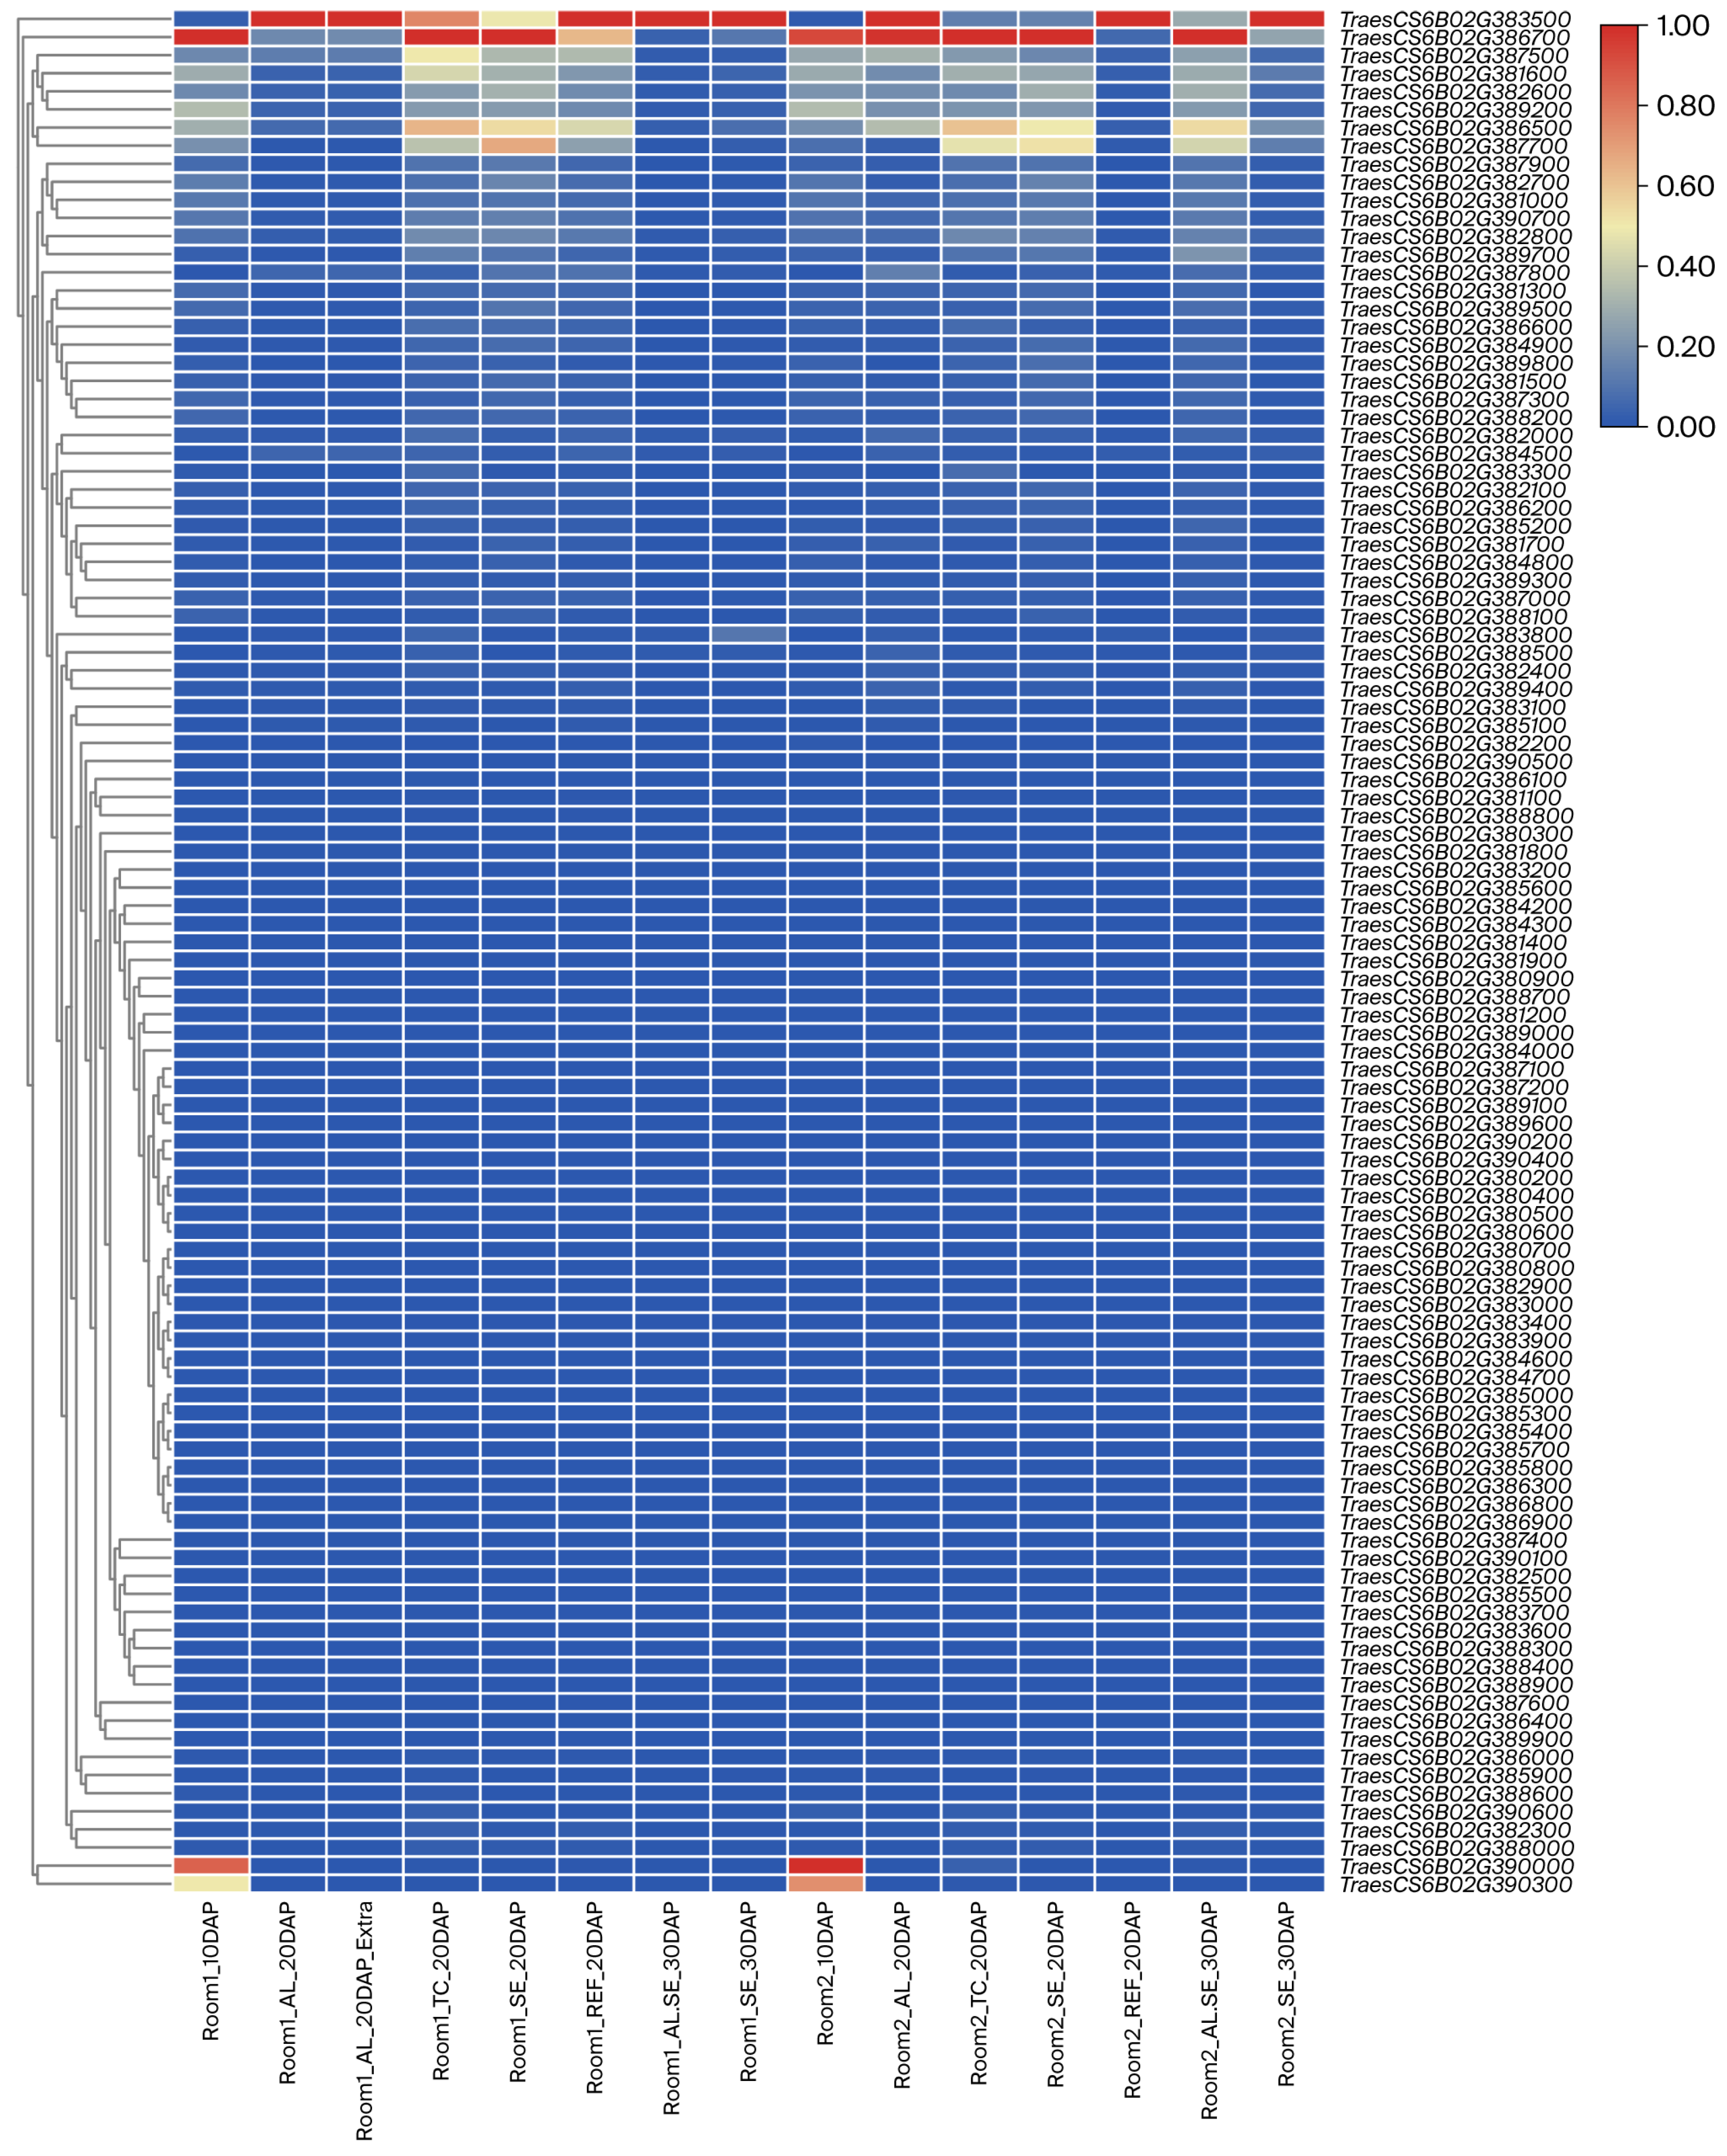
A total of 104 high-confidence genes were annotated in the qWGC6B.2 interval (Table S5) using the sequence and annotation of the Chinese Spring reference genome. Using the WheatOmics expression database, gene expression patterns were analyzed in various tissues (including the aleurone layer, the transfer cells, and the starchy endosperm) during various grain development stages (10DAP, 20DAP, 30DAP). TraesCS6B02G383500 and TraesCS6B02G386700 were identified as highly expressed genes (Figure 3).
TraesCS6B02G386700 was consistently highly expressed across all tissues and time points, and was especially predominantly expressed in the endosperm, whereas TraesCS6B02G383500 exhibited higher activity in the aleurone layer and transfer cells. Specifically, the expression level of TraesCS6B02G386700 was significantly higher than that of TraesCS6B02G383500 in SE_10DAP and SE_20DAP. However, its expression decreased in SE_30DAP.
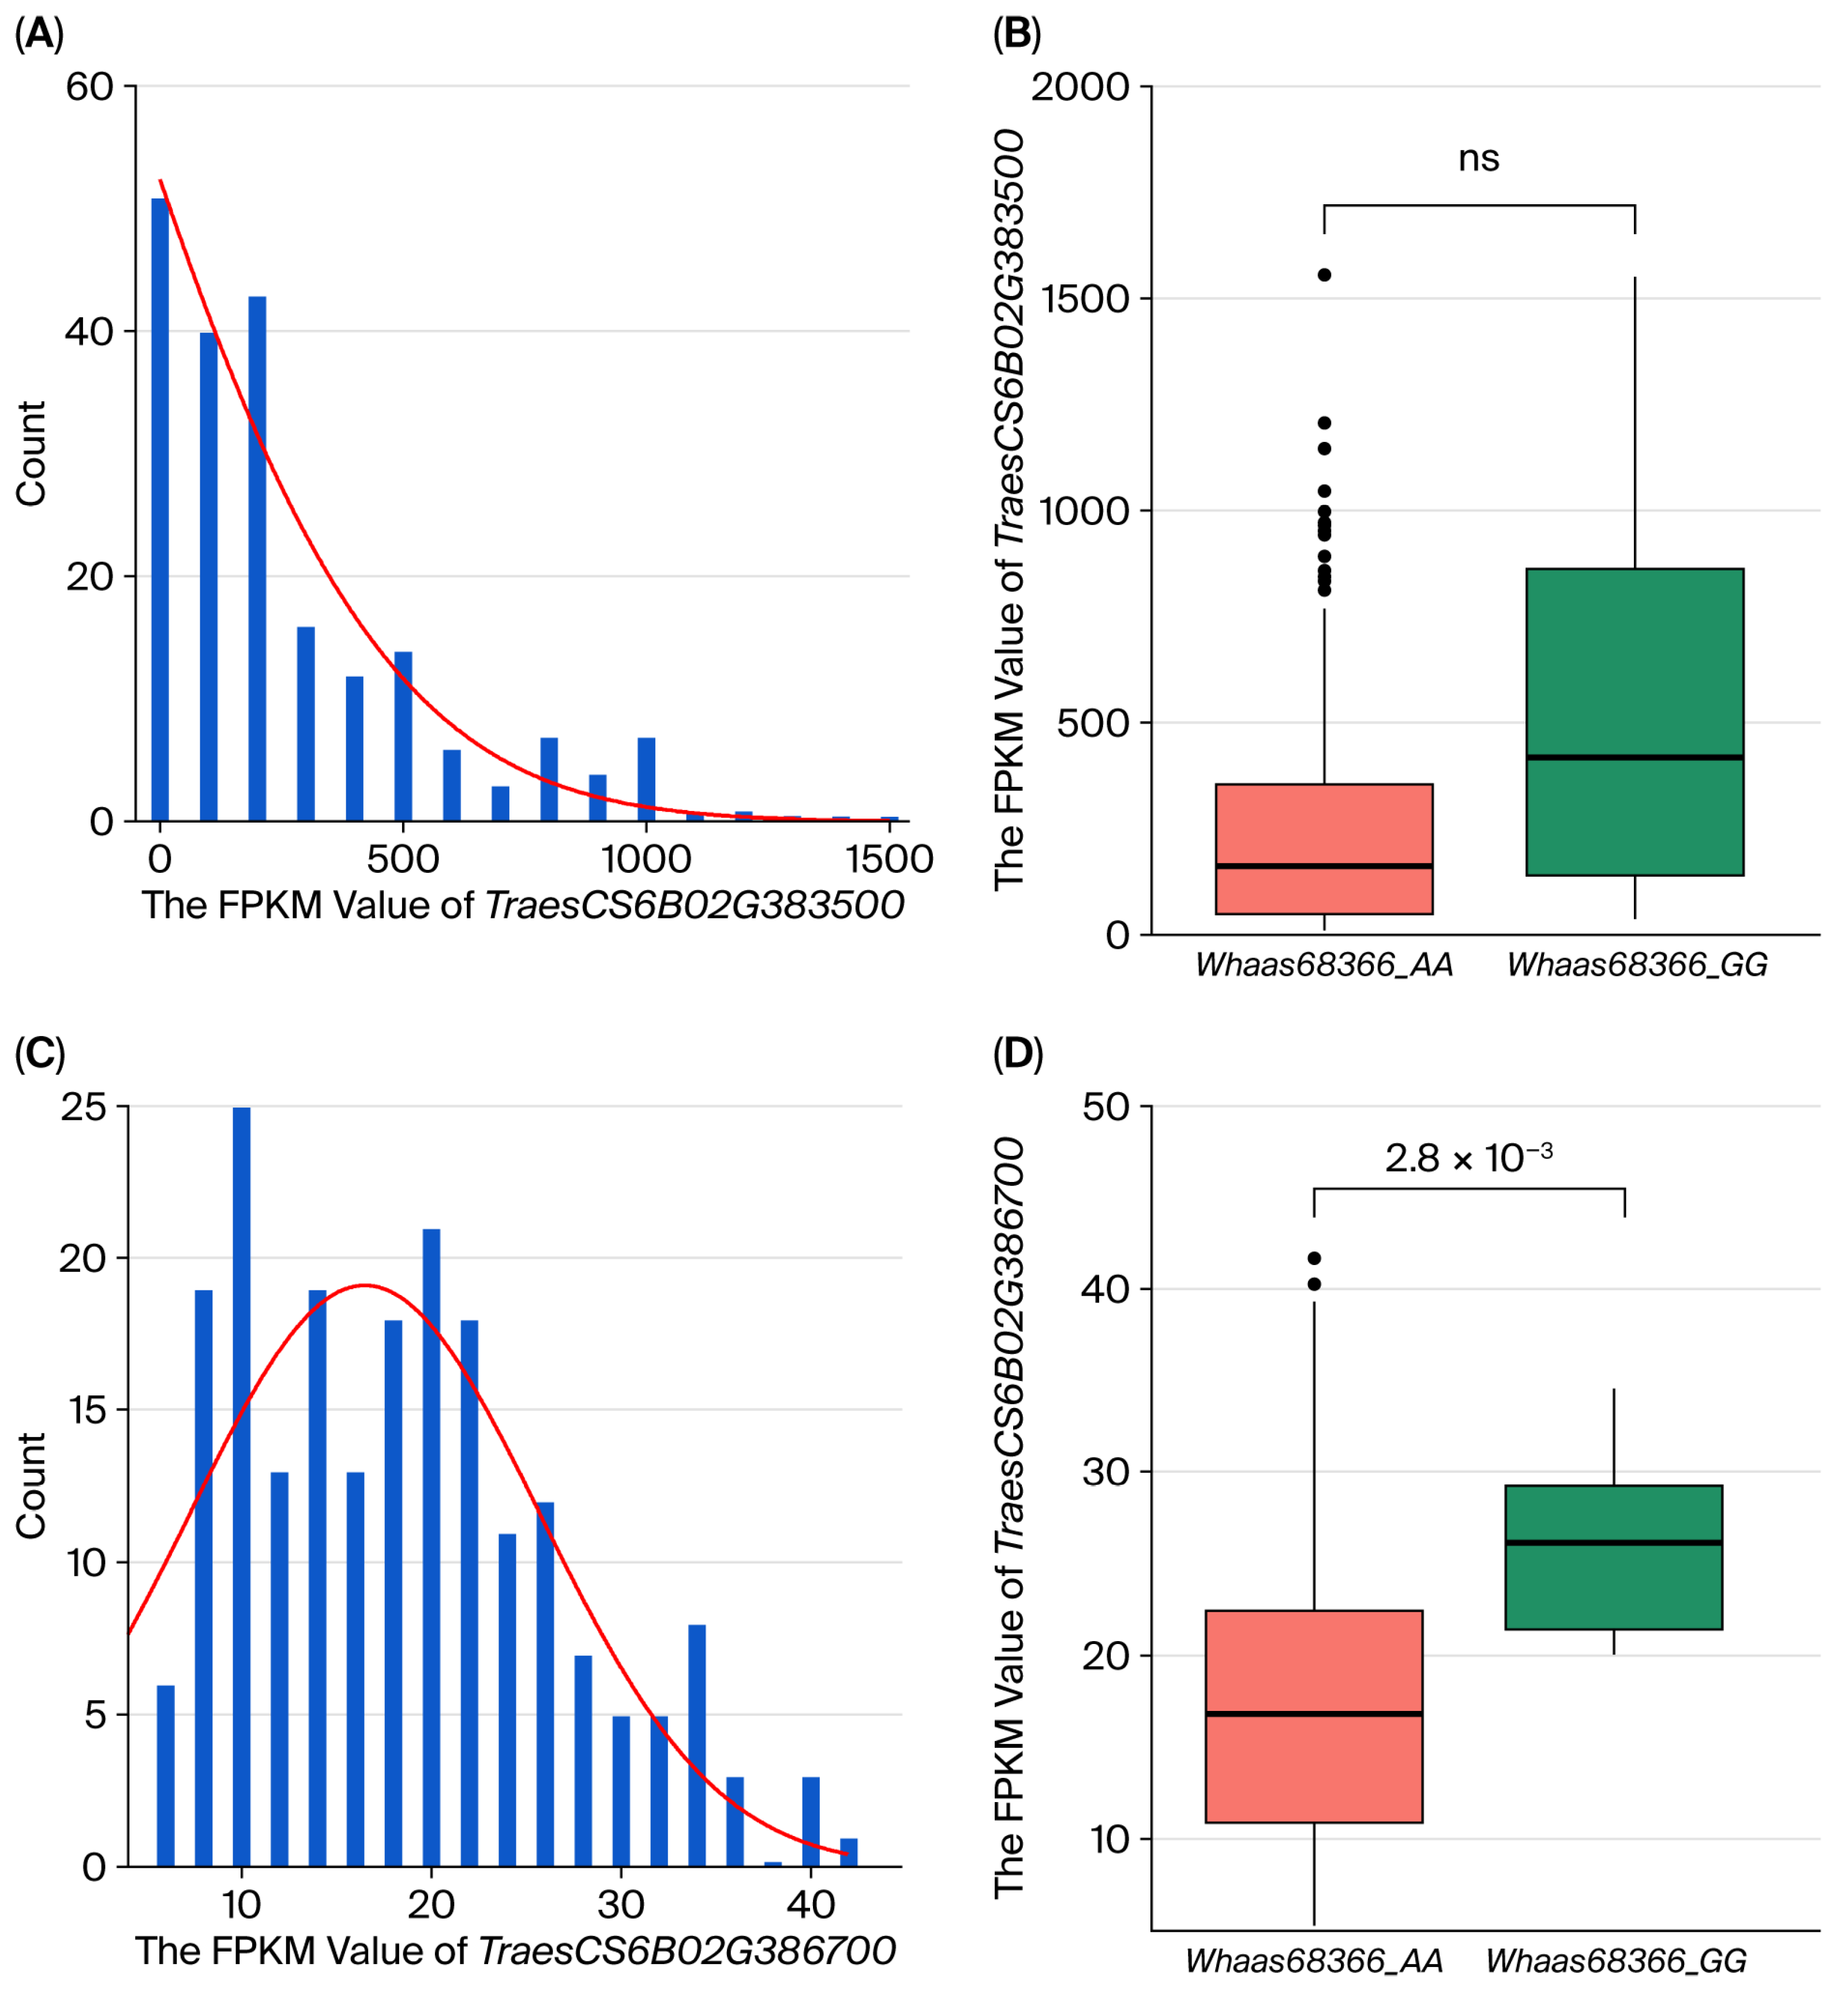
The expression of TraesCS6B02G386700 was further validated by RNA-seq data from grains 20 days after pollination (FPKM: 5.28–41.68) in the natural population, and was significantly lower than TraesCS6B02G383500 (10.85–1555.87) (Table S6). It was 25.99 in the Whaas68366_GG genotype compared to 17.88 in the Whaas68366_AA genotype, reflecting a 45.34% increase (Figure 4D). These results support the designation of TraesCS6B02G386700 as the candidate gene for TaWGC6B.1.
Analysis of two key genes in developing grains at 20 days after pollination within a natural population revealed that TraesCS6B02G383500 expression (FPKM) exhibited extensive variation across accessions, ranging from 10.85 to 1555.87. In contrast, TraesCS6B02G386700 maintained relatively stable expression levels (5.28–41.68 FPKM). Subsequent allelic genotyping at the Whaas68366 locus demonstrated no significant divergence in TraesCS6B02G383500 expression among genotypes (p > 0.05), whereas TraesCS6B02G386700 displayed highly significant genotype-dependent differences (p < 0.01).

2.4. eGWAS and Expression QTL Mapping of TaWGC6B.1

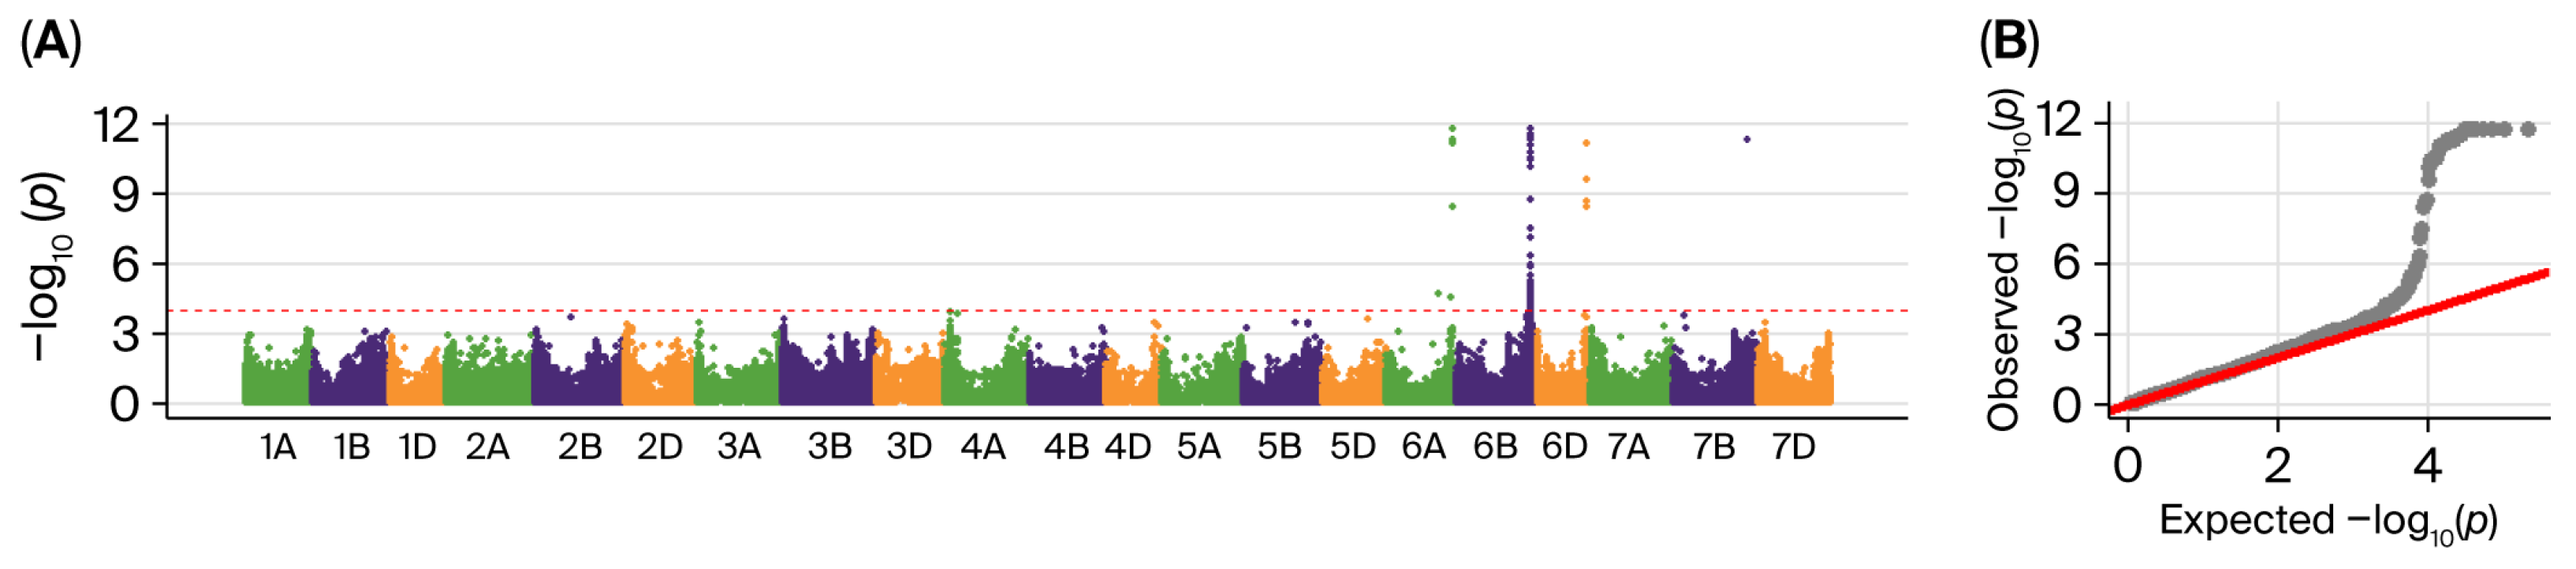
Using 660K SNP array genotypes and TaWGC6B.1 expression levels, expression GWAS (eGWAS) identified five expression QTLs (eQTLs) (Figure 5, Table 2). Two trans-eQTLs on 6AL (qWGCe6A.1, qWGCe6A.2) contributed 11.12% and 10.76–27.74% of variation, one trans-eQTL on 6BL (qWGCe6B.1) explained 7.66–28.24.4%, and one on 6DL (qWGCe6D.1) explained 20.88–25.78% and one on 7BL (qWGCe7B.1, 26.07%).
Interestingly, the expression-regulating SNP Whaas58965 of TaWGC6B.1 and the WGC-related SNP Whaas68366 were located in the same linkage block, separated by only 642,068 bases, suggesting that WGC could be controlled by TaWGC6B.1.

2.5. KASP Marker Development and Validation

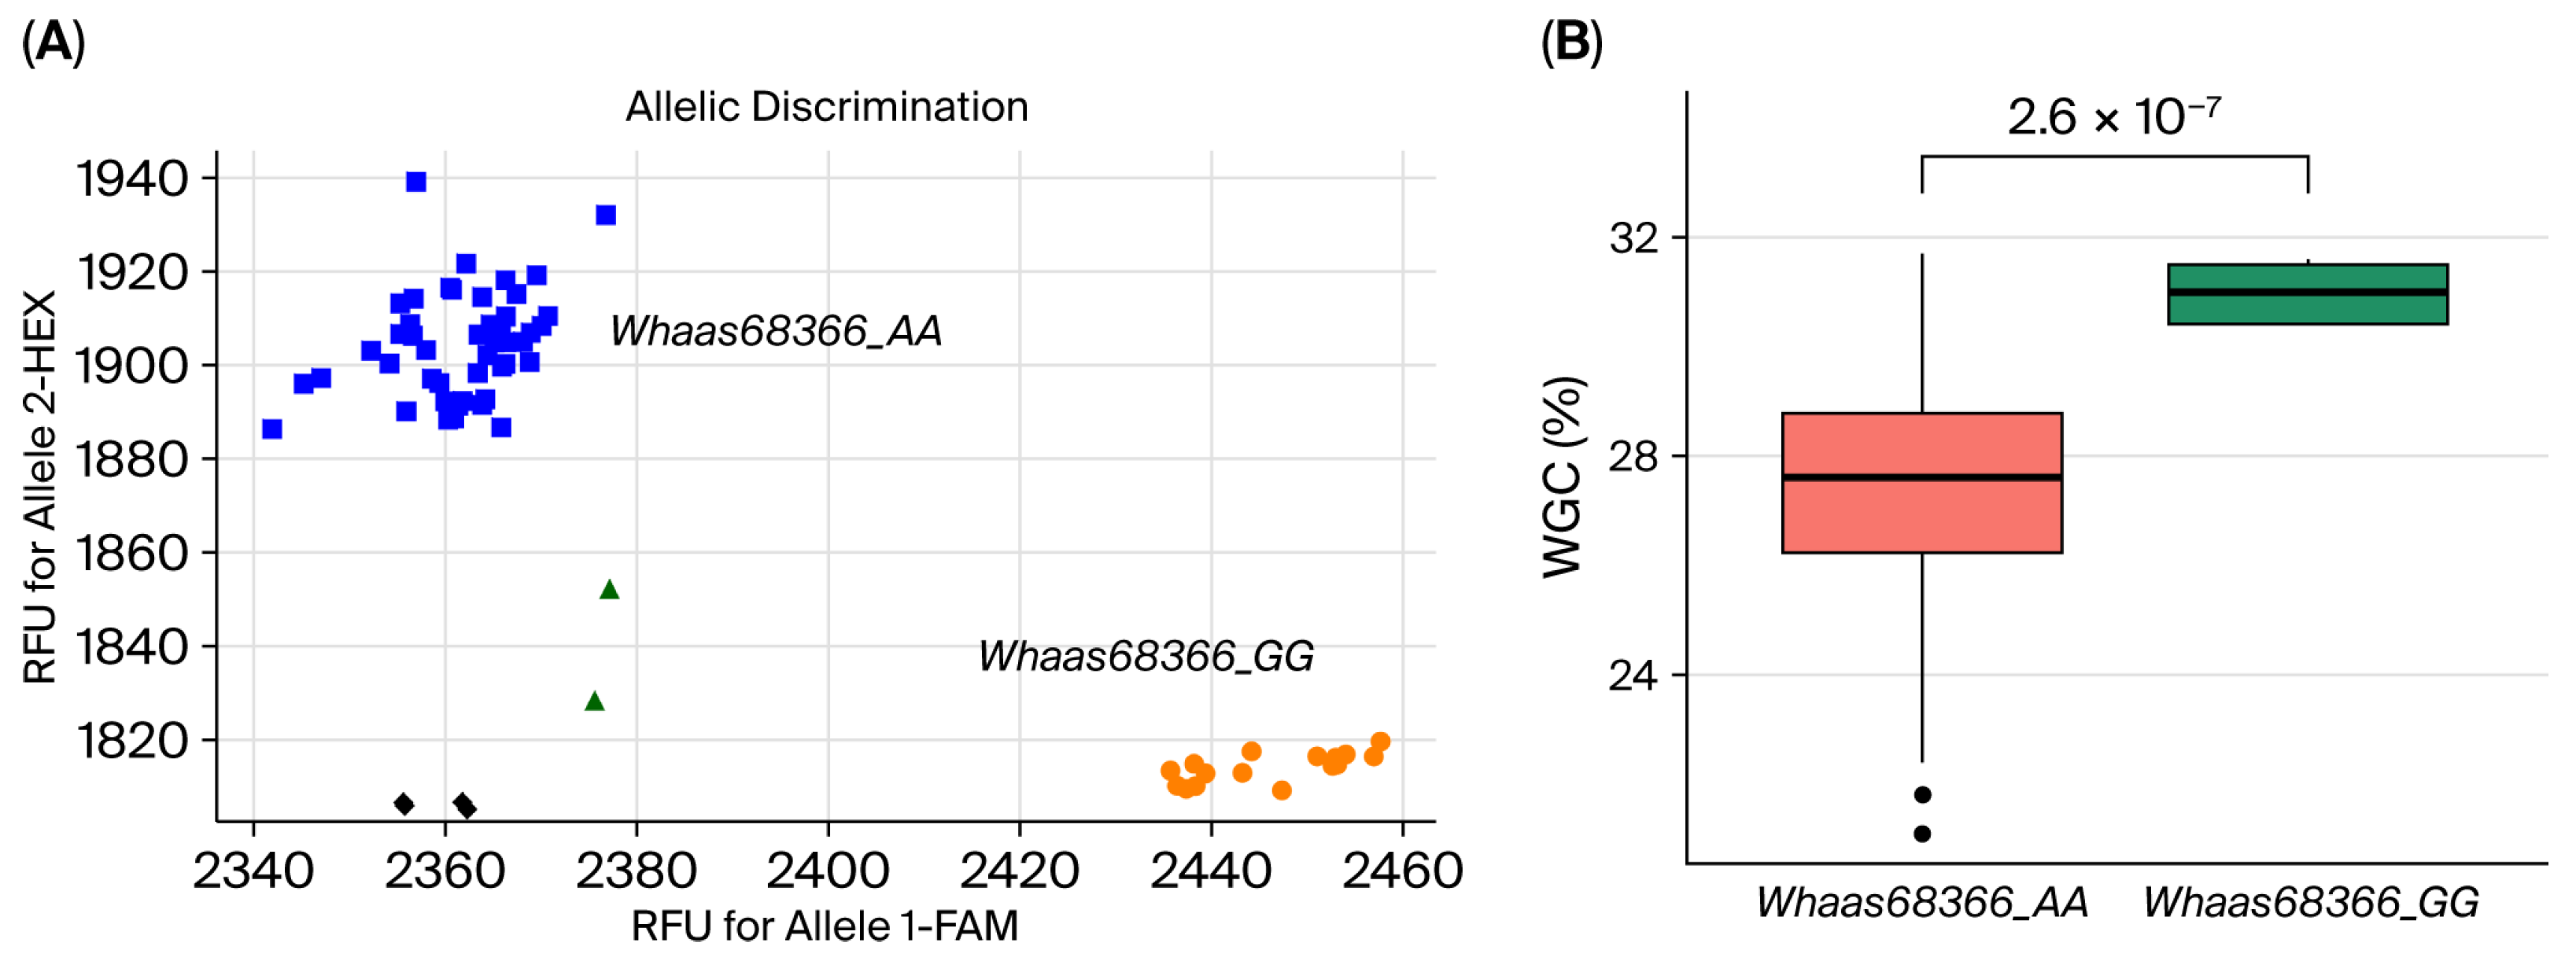
A KASP marker was developed based on the Whaas68366 SNP within qWGC6B.2 (Table S7). A total of 8 accessions were Whaas68366_GG and 186 were Whaas68366_AA. As compared to the Whaas68366_AA genotype, the Whaas68366_GG genotype showed significantly higher WGC in all environments, increasing by 32.70%, 27.52%, 24.76%, and 28.18%, respectively (Figure S1, Table S4).
Further validation in 107 lines from Population II identified 102 Whaas68366_AA genotypes and 5 Whaas68366_GG genotypes (Figure 6, Table S8). Whaas68366_GG lines had an average WGC of 30.98%, which was significantly higher than Whaas68366_AA lines (27.39%), which indicated an increase of 13.11%. These results demonstrate that Whaas68366_GG is a favorable allele and can be used for marker-assisted selection in breeding high-WGC wheat varieties.

3. Discussion

Accurate determination of wet gluten content is essential for quality assessment and breeding, as it directly influences water absorption, dough viscoelasticity, and product formability [21,22]. Instrument-based measurements were taken in this study across multiple environments and BLUE values ranged from 21.52 to 47.68%, indicating a wide range of genetic diversity. By selective breeding, significant potential can be gained for improving wheat quality based on the substantial genetic diversity in wet gluten content observed in this study.
Nine WGC-associated QTLs were identified on chromosomes 1AL (two loci), 1BL, 1DS, 5AL, 5BL (two loci), 6BS, and 6BL using GWAS. Among them, qWGC1A.1, qWGC1D.1, and qWGC5A.1 co-localized with previously reported QTLs QWgc.his-1A (535 Mb), QWgc.his-1D (23 Mb), and QWgc.his-5A (540 Mb) [23], suggesting that these regions possess stable genetic determinants. As a result of the overlap with previously reported QTLs related to wheat gluten content and composition, these findings are robust and emphasize the importance of this chromosomal region. The identification of these QTLs offers valuable insights into breeding programs aimed at enhancing wheat quality. Additionally, the complex genetic interactions among QTLs and the polygenic nature of gluten content may complicate marker-assisted selection, requiring further research.
Wheat glutenin and gliadin content reflects the ability of wheat proteins to absorb water and form networks [24]. Zhou et al. [25] identified 33 QTLs related to glutenin components in recombinant inbred lines, including QAx1.1AS-1, QBy.1BL-1, QLMW.1DS-1, and QLMW.5AL-1, which co-localize with qWGC1A.2, qWGC1B.1, qWGC1D.1, and qWGC5A.1 in this study. qWGC1D.1 was also co-localized with 1DS-1 controlling α-gliadin and gliadin accumulation in RIL population by Zhou et al. [26]. Additionally, Qωg5B.4 (578 Mb) and Qωg5B.5 (690 Mb) were found on 5BL to influence ω- and γ-gliadin expression, respectively. Qωg6B.3 (323 Mb) on 6BS and Qγg6B.2 (659 Mb) on 6BL also affect gliadin subunit expression [27].
This study identified qWGC6B.2 on 6BL as a stable major-effect QTL, with its favorable allele increasing WGC by 24.76–32.70%. TaWGC6B.1 (TraesCS6B02G386700), a cytochrome B-c1 complex subunit gene, has been identified as a potential candidate gene for qWGC6B.2. Mitochondrial cytochrome complexes play crucial roles in cellular respiration and energy production [28,29,30]. As developing grains are metabolically active and energy-intensive, the elevated expression of TaWGC6B.1 in the endosperm suggests that it may regulate ATP-dependent processes such as protein synthesis and starch accumulation. These physiological functions directly impact gluten protein content and grain quality. Moreover, expression QTL (eQTL) analysis revealed that TaWGC6B.1 plays both cis- and trans-acting roles in regulating its expression. The colocalization of the WGC phenotype-associated SNP (Whaas68366) with an eQTL SNP for TaWGC6B.1 (Whaas58965) within the same linkage block strengthens the hypothesis that WGC is modulated by transcriptional regulation of this gene. Understanding the transcriptional regulation of key genes like TaWGC6B.1 enables breeders to develop crops with enhanced traits through targeted manipulation of gene expression pathways.
Another candidate gene, TraesCS6B02G383500, belonging to the LEA (late embryogenesis abundant) D-II family, was identified in addition to TaWGC6B.1. The role of dehydrins in abiotic stress tolerance, particularly under drought and heat conditions, is well-known [31,32,33,34]. As grain filling and protein accumulation are highly sensitive to environmental factors, the expression of dehydrins could indirectly affect WGC by stabilizing storage protein synthesis. It is consistent with findings in rice [35] and barley [33], where LEA proteins were implicated in seed vigor, desiccation tolerance, and seed quality.
The integration of transcriptomic, genomic, and phenotypic data in this study exemplifies the power of multi-omics approaches in unraveling complex agronomic traits. To uncover regulatory mechanisms beyond transcript abundance, future studies could include epigenetic profiling (e.g., DNA methylation and histone modification) and proteomic analyses. According to Zhou et al. [36], some genes regulate WGC via transcriptional or epigenetic mechanisms, influencing gluten protein ratios through promoter DNA methylation. A premature stop codon has been found in TraesCS1D02G009900 in region 1DS.1, altering the HMW-GS/LMW-GS ratio and enhancing gluten aggregation, as reported by Zhou et al. [25]. Together, these findings indicate that gluten protein composition and proportional regulation are important determinants of wet gluten content (WGC), and that further study of underlying transcriptional and epigenetic mechanisms is warranted.
The successful development and validation of a competitive allele specific PCR (KASP) marker, Whaas68366, provides a practical application of the genetic findings. In addition to effectively distinguishing high-WGC genotypes, this marker demonstrated utility across multiple environments and populations. In breeding programs that aim to select high-quality wheat varieties, such markers represent an effective tool for genomic selection and precision breeding.

4. Materials and Methods

4.1. Plant Material and Cultivation

This study used 207 accessions from Henan, Jiangsu, Shaanxi, Sichuan, and Yunnan provinces in China, along with six other countries, including landraces, cultivars, and elite breeding lines [37]. A secondary population (Population II), comprising 107 wheat varieties from the southern region of Huang-Huai, was constructed to provide validation data.
Natural populations were grown at the Modern Agricultural Research and Development Base in Yuanyang County (113°97′ E, 35°5′ N), Henan Province, during 2017–2018, 2018–2019, and 2019–2020 growing seasons. Population II was grown at the same location in 2019–2020. The average temperature is 10.12 °C (http://www.tianqihoubao.com/lishi/hnyuanyang.html, accessed on 18 June 2025) and the average annual precipitation is 410.76 mm (https://www.tianqi24.com/historycity/, accessed on 18 June 2025) in the wheat-growing season. The varieties were planted in two rows, each two meters long, with 20 cm row spacing and 10 cm plant spacing, with two replicates. Field management followed local standard agronomic practices. Mature grains were harvested and air-dried.

4.2. Phenotypic Evaluation and Data Analysis

Moisture content was determined using the IM9500 multifunctional near-infrared analyzer (Perten, Stockholm, Sweden). SKCS 4100 single-kernel characterization system was used to measure the hardness index of 300 grains randomly selected from each sample, following GB/T 21304-2007 [38]. The soaking water content was adjusted based on the hardness index: 14% for soft wheat (HI < 40), 15% for mixed wheat (40 < HI < 60), and 16% for coarse wheat (HI > 60), with a soaking duration of 16–18 h [39].
The flour was prepared using a Bühler laboratory mill (Bühler, Uzwil, Swiss Confederation) according to American Association of Cereal Chemists (AACC) Method 26-20 [40], with an extraction rate of 70%. Wet gluten content (WGC) was measured with a GM2200 gluten washer (Perten, Stockholm, Sweden) following AACC Method 38-12A [41]. Each sample was measured twice replicates.
Descriptive statistics and correlation analyses of WGC across environments were conducted using IBM SPSS Statistics 22 (IBM, Chicago, IL, USA). Broad-sense heritability (H2) was obtained using the R software version 3.5.3 (R Development Core Team, 2019) package lme4 vision 1.1-14 (https://cran.r-project.org/src/contrib/Archive/lme4/, accessed on 20 December 2020) [42]. The best linear unbiased Estimator (BLUE) was also calculated using the lem4 software in R and used for the GWAS.

4.3. 660K SNP Genotyping and Genome-Wide Association Study (GWAS)

High-quality genomic DNA was extracted from the leaves at the seedling stage of 207 wheat varieties in natural population using the CTAB method. The quality and concentration of DNA were detected by NanoDrop2000 spectrophotometer (Thermo Scientific, Waltham, MA, USA) and 1.2% (v/v) agarose gel electrophoresis. Illumina wheat 660K SNP array (CapitalBio Technology Inc., Beijing, China) was used to genotype genomic DNA. BeadStudio software (https://illumina-beadstudio.software.informer.com/) (Illumina Inc., San Diego, CA, USA) was used to process the raw data. All SNPs with missing rates > 10%, minor allele frequencies < 5%, or ambiguous genotypes were excluded. SNPs of high quality were retained for further analyses of population structure and kinship matrix [37].
The population structure was conducted using the STRUCTURE software version 2.3.4 (Pritchard Lab, Stanford University, San Francisco, CA, USA) with a model-based Bayesian cluster analysis. The number of ancestral clusters (K) was varied from two to seven to explore potential population subdivisions. For each K, 1000 burn-in periods and 1000 Markov-Chain replicates were conducted. The adhoc statistic ΔK, derived from the rate of change in LnP(K), was used to determine the true subpopulations. The kinship matrix was generated with TASSEL 5.0 and was incorporated as a random-effect factor in GWAS.
GWAS was conducted using TASSEL 5.0 using a mixed linear model (MLM), accounting for population structure (Q) and kinship matrix (K). SNPs with p-values < 1.0 × 10⁻⁴ were considered significant. The Manhattan plot and Q-Q plot were generated using the R software version 3.5.3 (R Development Core Team, 2019) package CMplot version 4.5.1 (https://cran.r-project.org/web/packages/CMplot/index.html, accessed on 24 May 2024). As a result of each QTL, the peak SNP that explained the highest proportion of phenotypic variance was identified, and its corresponding 5 Mb region was defined as the QTL interval. The ggplot2 version 3.4.0 (https://cran.r-project.org/src/contrib/Archive/ggplot2/, accessed on 26 May 2024) was used to analyze and visualize genotypic differences.

4.4. Candidate Gene Prediction and Analysis

The IWGSC RefSeq v1.1 reference genome (https://www.wheatgenome.org) was used to identify gene candidates within the qWGC6B.2 region. Expression Browser (http://www.wheat-expression.com) was used to analyze gene expression profiles between grain development stages (10, 20, 30 days after pollination) and tissues (AL, TC, SE, REF, and AL.SE) [43].
An analysis of RNA-seq data from 20 DAP grains of the natural population [42] was performed to identify significantly expressed genes, with a focus on stable and highly expressed genes in the endosperm.

4.5. Competitive Allele Specific PCR (KASP) Models and Their Application

KASP marker was designed using peak SNP sequence from the polymarker website (http://www.polymarker.info/) [37]. The PCR reaction volume was prepared according to the KASP assay protocol: 5 μL KASP Master Mix, 1.4 μL Primer Mix containing F1, F2, R12, and ddH2O in a ratio of 12:12:30:46, 0.08 μL MgCl2, 1 μL of genomic DNA (100 ng/μL), and 2.52 μL ddH2O, making up a total volume of 10 μL. The designed KASP marker was subsequently used to genotype the wheat varieties in population II on the CFX Connect™ Real-Time System. PCR-cycling conditions included an initial denaturation step at 95 °C for 15 min; 10 cycles, denaturation at 95 °C for 20 s, annealing at 64 °C for 60 s, gradually reduce for 1 °C each cycle; 35 cycles, denaturation at 95 °C for 20 s, annealing at 57 °C for 60 s; 37 °C for 1 min, the signal was read after 1 min at 37 °C.
The alleles associated with higher WGC were considered favorable. Marker-assisted selection (MAS) was performed on accessions with favorable alleles.

5. Conclusions

Nine QTLs associated with wet gluten content were identified in a natural wheat population, with qWGC6B.2 on chromosome 6BL being a stable major-effect locus. Expression levels of the candidate gene TaWGC6B.1 correlated significantly with wet gluten content. The developed KASP marker Whaas68366 effectively distinguished favorable alleles and significantly enhanced WGC, proving its potential in molecular breeding. These findings provide key loci, candidate genes, and practical markers for wheat quality improvement.

Supplementary Materials

The following supporting information can be downloaded at https://www.mdpi.com/article/10.3390/ijms27020827/s1.

Author Contributions

Conceptualization, Z.L. and Z.Z.; methodology, C.L. and L.Z.; software, C.L. and L.J.; validation, C.L., C.W. and L.Z.; formal analysis, W.L.; investigation, C.W. and Z.D.; resources, M.Q. and W.L.; data curation, C.L., C.W., L.Z. and J.H.; writing—original draft preparation, C.L. and L.Z.; writing—review and editing, C.L., Z.L. and Z.Z.; visualization, L.Z. and J.H.; supervision, Z.L. and Z.Z.; project administration, Z.L. and Z.Z.; funding acquisition, Z.L. and Z.Z. All authors have read and agreed to the published version of the manuscript.

Funding

This research was funded by the National Natural Science Foundation of China (U22A20478), the Program of Leading Talent in Science and Technology Innovation of Zhongyuan (244200510032), the Key Research and development project of Henan Province (251111110300), the Joint Fund of Henan Provincial Science and Technology Research and Development Plan (242301420125), the International science and technology cooperation project of Henan Province (242102521058), and the Agriculture Research System of Henan Province (HARS-22–01-G3).

Institutional Review Board Statement

Not applicable.

Informed Consent Statement

Not applicable.

Data Availability Statement

The original contributions presented in this study are included in the article and Supplementary Materials. Further inquiries can be directed to the corresponding authors.

Acknowledgments

The authors are grateful to all lab members for their useful suggestions, support, and encouragement.

Conflicts of Interest

The authors declare no conflicts of interest.

Abbreviations

The following abbreviations are used in this manuscript:
WGCWet gluten content
MLMMixed liner model
GWASGenome-wide association study
BLUEBest linear unbiased estimate
QTLQuantitative trait locus
SNPSingle-nucleotide polymorphism
Q-QQuantile–quantile
PVEPhenotypic variation explained
IWGSCInternational Wheat Genome Sequence Consortium
SEStarchy endosperm
ALAleurone
TCTransfer cells
WThe whole endosperm
AL.SEAleurone tissue to contain contamination from SE cells
DAPDays after pollination
KASPCompetitive Allele Specific PCR

References

  1. Pingault, L.; Choulet, F.; Alberti, A.; Glover, N.; Wincker, P.; Feuillet, C.; Paux, E. Deep transcriptome sequencing provides new insights into the structural and functional organization of the wheat genome. Genome Biol. 2015, 16, 29. [Google Scholar] [CrossRef] [Scilit]
  2. Igrejas, G.; Ikeda, T.; Guzmán, C. Wheat Quality for Improving Processing and Human Health; Springer: Cham, Switzerland, 2020. [Google Scholar]
  3. Rustgi, S.; Shewry, P.; Brouns, F.; Deleu, L.J.; Delcour, J.A. Wheat Seed Proteins: Factors Influencing Their Content, Composition, and Technological Properties, and Strategies to Reduce Adverse Reactions. Compr. Rev. Food Sci. Food Saf. 2019, 18, 1751–1769. [Google Scholar] [CrossRef] [Scilit]
  4. Wang, D.; Li, F.; Cao, S.; Zhang, K. Genomic and functional genomics analyses of gluten proteins and prospect for simultaneous improvement of end-use and health-related traits in wheat. Theor. Appl. Genet. 2020, 133, 1521–1539. [Google Scholar] [CrossRef] [Scilit]
  5. Peng, Y.; Zhao, Y.; Yu, Z.; Zeng, J.; Xu, D.; Dong, J.; Ma, W. Wheat Quality Formation and Its Regulatory Mechanism. Front. Plant Sci. 2022, 13, 834654. [Google Scholar] [CrossRef] [Scilit]
  6. Hao, F.; Liu, T.; Zhang, Z.; Qiu, D. Analysis Of Nutritional Quality and Processing Characteristics Of High-Quality Strong Gluten Wheat Flour. IOSR J. Environ. Sci. Toxicol. Food Technol. 2024, 18, 1–7. [Google Scholar] [CrossRef] [Scilit]
  7. Wu, H. Investigation on the Association between Wheat Quality Traits with Performance of Noodle and Steamed Bread in the Lower Yangtze Vally Zone. Master’s Thesis, Yangzhou University, Yangzhou, China, 2004. [Google Scholar]
  8. Zhang, Z. The Studies on Quality Evalution of Noodle of Chinese Wheat. Master’s Thesis, Henan University of Technology, Zhengzhou, China, 2012. [Google Scholar]
  9. Li, J.; Wang, F.; Wei, X.; Han, W.; Qiao, J. Effect of wet gluten content of wheat flour on the quality of northern-style steamed stuffed bun. Food Ferment. Ind. 2021, 47, 192–197. [Google Scholar]
  10. Song, L.; Wang, R.; Yang, X.; Zhang, A.; Liu, D. Molecular Markers and Their Applications in Marker-Assisted Selection (MAS) in Bread Wheat (Triticum aestivum L.). Agriculture 2023, 13, 642–660. [Google Scholar] [CrossRef] [Scilit]
  11. Ashutosh; Mishra, V.K.; Srivastava, K.; Kumar, M.; Singh, P. Marker-assisted foreground pyramiding of genes/QTL’s for grain quality and rust resistance genes in most popular wheat cv., HUW234 of Eastern Gangetic plains of India. J. Plant Biochem. Biotechnol. 2025, 34, 514–525. [Google Scholar]
  12. Lou, H.; Zhang, R.; Liu, Y.; Guo, D.; Zhai, S.; Chen, A.; Zhang, Y.; Xie, C.; You, M.; Peng, H.; et al. Genome-wide association study of six quality-related traits in common wheat (Triticum aestivum L.) under two sowing conditions. Theor. Appl. Genet. 2020, 134, 399–418. [Google Scholar] [PubMed]
  13. Deng, Z.; Tian, J.; Chen, F.; Li, W.; Zheng, F.; Chen, J.; Shi, C.; Sun, C.; Wang, S.; Zhang, Y. Genetic dissection on wheat flour quality traits in two related populations. Euphytica 2015, 203, 221–235. [Google Scholar]
  14. Chen, J.; Zhang, F.; Zhao, C.; Lv, G.; Sun, C.; Pan, Y.; Guo, X.; Chen, F. Genome-wide association study of six quality traits reveals the association of the TaRPP13L1 gene with flour colour in Chinese bread wheat. Plant Biotechnol. J. 2019, 17, 2106–2122. [Google Scholar] [CrossRef] [Scilit]
  15. Li, Y.; Song, Y.; Zhou, R.; Branlard, G.; Jia, J. Detection of QTLs for bread-making quality in wheat using a recombinant inbred line population. Plant Breed. 2009, 128, 235–243. [Google Scholar] [CrossRef] [Scilit]
  16. Li, J.; Cui, F.; Ding, A.-M.; Zhao, C.-H.; Wang, X.-Q.; Wang, L.; Bao, Y.-G.; Qi, X.-L.; Li, X.-F.; Gao, J.-R.; et al. QTL detection of seven quality traits in wheat using two related recombinant inbred line populations. Euphytica 2012, 183, 207–226. [Google Scholar] [CrossRef] [Scilit]
  17. Sun, H.; Lü, J.; Fan, Y.; Zhao, Y.; Kong, F.; Li, R.; Wang, H.; Li, S. Quantitative trait loci (QTLs) for quality traits related to protein and starch in wheat. Prog. Nat. Sci. 2008, 18, 825–831. [Google Scholar] [CrossRef] [Scilit]
  18. Nicolae, D.L.; Gamazon, E.; Zhang, W.; Duan, S.; Dolan, M.E.; Cox, N.J. Trait-associated SNPs are more likely to be eQTLs: Annotation to enhance discovery from GWAS. PLoS Genet. 2010, 6, e1000888. [Google Scholar] [CrossRef] [Scilit] [PubMed]
  19. Wei, Z.; Yuan, Q.; Lin, H.; Li, X.; Zhang, C.; Gao, H.; Zhang, B.; He, H.; Liu, T.; Jie, Z.; et al. Linkage analysis, GWAS, transcriptome analysis to identify candidate genes for rice seedlings in response to high temperature stress. BMC Plant Biol. 2021, 21, 85–98. [Google Scholar] [CrossRef] [Scilit]
  20. Wang, X.; Chen, Q.; Wu, Y.; Lemmon, Z.H.; Xu, G.; Huang, C.; Liang, Y.; Xu, D.; Li, D.; Doebley, J.F. Genome-wide analysis of transcriptional variability in a large maize-teosinte population. Mol. Plant 2018, 11, 443–459. [Google Scholar] [CrossRef] [Scilit] [PubMed]
  21. Wang, D.; Zhang, K.; Dong, L.; Dong, Z.; Li, Y.; Hussain, A.; Zhai, H. Molecular genetic and genomic analysis of wheat milling and end-use traits in China: Progress and perspectives. Crop J. 2018, 6, 68–81. [Google Scholar] [CrossRef] [Scilit]
  22. Yu, X.; Chen, X.; Wang, L.; Yang, Y.; Zhu, X.; Shao, S.; Cui, W.; Xiong, F. Novel insights into the effect of nitrogen on storage protein biosynthesis and protein body development in wheat caryopsis. J. Exp. Bot. 2017, 68, 2259–2274. [Google Scholar] [CrossRef] [Scilit]
  23. Dehua, Z.; Xin, X.U.; Yujie, W.; Ziyang, Z.; Xiaojun, L.I. Mapping of Quantitative Trait Loci for Quality Traits Using Recombinant Inbred Line Population Derived from Bainong AK58/Bima 4 in Wheat. Acta Agric. Boreali-Sin. 2023, 38, 23–31. [Google Scholar]
  24. Ma, W. Wheat gluten protein and its impacts on wheat processing quality. Front. Agric. Sci. Eng. 2019, 6, 279–287. [Google Scholar] [CrossRef] [Scilit]
  25. Zhou, Z.; Zhang, Z.; Mason, A.S.; Chen, L.; Liu, C.; Qin, M.; Li, W.; Tian, B.; Wu, Z.; Lei, Z.; et al. Quantitative traits loci mapping and molecular marker development for total glutenin and glutenin fraction contents in wheat. BMC Plant Biol. 2021, 21, 455–467. [Google Scholar] [CrossRef] [Scilit] [PubMed]
  26. Zhou, Z.; Geng, S.; Guan, H.; Liu, C.; Qin, M.; Li, W.; Shi, X.; Dai, Z.; Yao, W.; Lei, Z.; et al. Dissection of the Genetic Architecture for Quantities of Gliadins Fractions in Wheat (Triticum aestivum L.). Front. Plant Sci. 2022, 13, 826909. [Google Scholar] [CrossRef] [Scilit]
  27. Chen, L. Genome-Wide Assoiation Analysis of Wheat Gliadin Content. Master’s Thesis, Henan Agricultural University, Zhengzhou, China, 2021. [Google Scholar]
  28. Zhang, W.; Zhao, Y.; Li, L.; Xu, X.; Yang, L.; Luo, Z.; Wang, B.; Ma, S.; Fan, Y.; Huang, Z. The Effects of Short-Term Exposure to Low Temperatures During the Booting Stage on Starch Synthesis and Yields in Wheat Grain. Front. Plant Sci. 2021, 12, 684784. [Google Scholar] [CrossRef] [Scilit]
  29. Yang, W.; Li, Y.; Yin, Y.; Qin, Z.; Zheng, M.; Chen, J.; Luo, Y.; Pang, D.; Jiang, W.; Li, Y.; et al. Involvement of ethylene and polyamines biosynthesis and abdominal phloem tissues characters of wheat caryopsis during grain filling under stress conditions. Sci. Rep. 2017, 7, 46020. [Google Scholar] [CrossRef] [Scilit] [PubMed]
  30. Lu, P.; Zhang, G.; Li, J.; Gong, Z.; Wang, G.; Dong, L.; Zhang, H.; Guo, G.; Su, M.; Wang, K.; et al. A wheat tandem kinase and NLR pair confers resistance to multiple fungal pathogens. Science 2025, 387, 1418–1424. [Google Scholar] [CrossRef] [Scilit] [PubMed]
  31. Klimešová, J.; Holková, L.; Středa, T. The Expression of Dehydrin Genes and the Intensity of Transpiration in Drought-stressed Maize Plants. Cereal Res. Commun. 2017, 45, 355–368. [Google Scholar] [CrossRef] [Scilit]
  32. Hassan, N.M.; El-Bastawisy, Z.M.; El-Sayed, A.K.; Ebeed, H.T.; Nemat Alla, M.M. Roles of dehydrin genes in wheat tolerance to drought stress. J. Adv. Res. 2015, 6, 179–188. [Google Scholar] [CrossRef] [Scilit]
  33. Yang, W.; Zhang, L.; Lv, H.; Li, H.; Zhang, Y.; Xu, Y.; Yu, J. The K-segments of wheat dehydrin WZY2 are essential for its protective functions under temperature stress. Front. Plant Sci. 2015, 6, 406. [Google Scholar] [CrossRef] [Scilit]
  34. Kosová, K.; Vítámvás, P.; Prášil, I.T. Wheat and barley dehydrins under cold, drought, and salinity–what can LEA-II proteins tell us about plant stress response? Front. Plant Sci. 2014, 5, 343. [Google Scholar] [CrossRef] [Scilit]
  35. Zong, W.; Yang, J.; Fu, J.; Xiong, L. Synergistic regulation of drought-responsive genes by transcription factor OsbZIP23 and histone modification in rice. J. Integr. Plant Biol. 2020, 62, 723–729. [Google Scholar] [CrossRef] [Scilit] [PubMed]
  36. Zhou, Z.; Liu, C.; Qin, M.; Li, W.; Hou, J.; Shi, X.; Dai, Z.; Yao, W.; Tian, B.; Lei, Z.; et al. Promoter DNA hypermethylation of TaGli-γ-2.1 positively regulates gluten strength in bread wheat. J. Adv. Res. 2021, 36, 163–173. [Google Scholar] [CrossRef] [Scilit]
  37. Liu, C.; Zhou, Z.; Wu, Z.; Qin, M.; Shi, X.; Wang, Y.; Li, W.; Yao, W.; Lei, Z.; Zhao, R. In-depth genetic analysis reveals conditioning of polyphenol oxidase activity in wheat grains by cis regulation of TaPPO2A-1 expression level. Genomics 2020, 112, 4690–4700. [Google Scholar] [CrossRef] [Scilit]
  38. GB/T 21304-2007; Determination of Wheat Hardness—Hardness Index Method. National Standards of People’s Republic of China: Beijing, China, 2007.
  39. Jin, H.; Wen, W.; Liu, J.; Zhai, S.; Zhang, Y.; Yan, J.; Liu, Z.; Xia, X.; He, Z. Genome-Wide QTL Mapping for Wheat Processing Quality Parameters in a Gaocheng 8901/Zhoumai 16 Recombinant Inbred Line Population. Front. Plant Sci. 2016, 7, 1032. [Google Scholar] [CrossRef] [Scilit]
  40. American Association of Cereal Chemists. Approved Methods of AACC, Method 26–20; AACC: St Paul, MN, USA, 1976. [Google Scholar]
  41. American Association of Cereal Chemists. AACC Approved Method 38-12A; AACC: St Paul, MN, USA, 2000. [Google Scholar]
  42. Zhou, Z.; Guan, H.; Liu, C.; Zhang, Z.; Geng, S.; Qin, M.; Li, W.; Shi, X.; Dai, Z.; Lei, Z.; et al. Identification of genomic regions affecting grain peroxidase activity in bread wheat using genome-wide association study. BMC Plant Biol. 2021, 21, 523–535. [Google Scholar] [CrossRef] [Scilit] [PubMed]
  43. Pfeifer, M.; Kugler, K.G.; Sandve, S.R.; Zhan, B.; Rudi, H.; Hvidsten, T.R.; Consortium, I.W.G.S.; Mayer, K.F.X.; Olsen, O.-A. Genome interplay in the grain transcriptome of hexaploid bread wheat. Science 2014, 345, 287–293. [Google Scholar] [CrossRef] [Scilit]
Figure 1. Phenotypic distribution and correlation analysis of wet gluten content (WGC) in the natural population for three different years (YY_18, YY_19 and YY_20) and BLUE values. (A) Phenotype distribution of WGC in YY_18, YY_19, YY_20 and BLUE values. (B) Pearson correlation coefficient among different years (E1 and E2). YY_18 was planted in Yuanyang County, Henan Province, from 2017 to 2018, YY_19 was planted in Yuanyang County from 2018 to 2019, YY_20 was planted in Yuanyang County from 2019 to 2020, and BLUE represents the Best Linear Unbiased Estimator. * represents p < 0.05, ** represents p < 0.01.
Ijms 27 00827 g001
Figure 2. Manhattan plot and Q-Q plot for WGC in different environments. (A,C,E,G) represent Manhattan plot for WGC in YY_18, YY_19, YY_20 and BLUE, respectively; (B,D,F,H) represent Q-Q plot for WGC in YY_18, YY_19, YY_20 and BLUE, respectively. Red horizontal dotted line indicates significance threshold line (−log10(p) = 4).
Ijms 27 00827 g002
Figure 3. Distribution of gene expression levels within the qWGC6B.2 by the public database in different wheat tissues. DAP: Days after pollination, AL: Aleurone, TC: Transfer cells, SE: Starchy endosperm, AL.SE: Aleurone tissue to contain contamination from SE cells.
Ijms 27 00827 g003
Figure 4. Distribution and comparative analysis with different alleles of the fragments per kilobase Million (FPKM) value of TraesCS6B02G383500 and TraesCS6B02G386700. (A,C) Distribution of TraesCS6B02G383500 and TraesCS6B02G386700 expression levels in the natural population, respectively. (B,D) The expression levels of TraesCS6B02G383500 and TraesCS6B02G386700 between the varieties with Whaas68366. The genotypes of Whaas68366_AA and Whaas68366_GG correspond to the two homozygous allelic variants detected by Whaas68366 in wheat varieties in natural population. ns: no significance.
Ijms 27 00827 g004
Figure 5. Manhattan plot and Q-Q plot for the expression levels of TaWGC6B.1. (A) Manhattan plot, (B) Q-Q plot. Red horizontal dotted line indicates significance threshold line (−log10(p) = 4).
Ijms 27 00827 g005
Figure 6. KASP marker and comparative analysis of WGC in wheat varieties with different allele genotypes of Whaas68366 in population II. (A) KASP assay for Whaas68366 showing Whaas68366_GG on FAM and Whaas68366_AA on HEX clusters. (B) Comparative analysis of WGC in wheat varieties with Whaas68366_AA and Whaas68366_GG in population II. The orange circle, blue square and green triangle represent the genotype of Whaas68366_GG, Whaas68366_AA and heterozygous of Whaas68366, respectively. The black square represents the control without DNA template.
Ijms 27 00827 g006
Table 1. Distribution of significant SNP of wet gluten content (WGC) in different environments.
NumQTLPeak SNPChrPos (Mb)−log10 (p)R2 (%)Environment
1qWGC1A.1Whaas334941AL516.74.23–4.689.76–10.99YY_20, BLUE
2qWGC1A.2Whaas057211AL532.84.36–5.5810.10–14.02YY_18, BLUE
3qWGC1B.1Whaas467331BL515.54.04–6.039.28–15.18YY_18, BLUE
4qWGC1D.1Whaas080681DS0.34.01–4.177.61–9.80YY_18, YY_19
5qWGC5A.1Whaas938365AL510.14.69–4.7410.92–10.96YY_19, BLUE
6qWGC5B.1Whaas419685BL555.14.07–4.267.68–8.21YY_20, BLUE
7qWGC5B.2Whaas433735BL693.04.09–4.579.47–11.30YY_18, BLUE
8qWGC6B.1Whaas330256BS301.04.45–4.7910.43–11.10YY_20, BLUE
9qWGC6B.2Whaas683666BL659.24.31–4.9410.08–12.27YY_18, YY_19, BLUE
Table 2. Information for QTL associated with the expression levels of TaWGC6B.1.
NumQTLPeak SNPChrPos (Mb)−log10 (p)R2
1qWGCe6A.1Whaas865166A454.74.7111.12
2qWGCe6A.2Whaas496436A585.44.56–11.7710.76–27.74
3qWGCe6B.1Whaas589656B659.84.00–11.787.66–28.24
4qWGCe6D.1Whaas299436D437.88.40–11.1520.88–25.78
5QWGCe7B.1Whaas584617B658.211.2526.07
Disclaimer/Publisher’s Note: The statements, opinions and data contained in all publications are solely those of the individual author(s) and contributor(s) and not of MDPI and/or the editor(s). MDPI and/or the editor(s) disclaim responsibility for any injury to people or property resulting from any ideas, methods, instructions or products referred to in the content.