2.1. Synthesis and Characterization of Functionalized Manganese-Based Nanoparticles
The manganese-based nanoparticles (S1–S5) were synthesized via a polyol-assisted solvothermal route utilizing a high-pressure stainless steel autoclave. Different manganese precursors were dissolved in liquid polyols, which served as both high-boiling solvents and capping/reducing agents. Where specified, reducing agents were incorporated to modulate nucleation kinetics and particle growth (
Table 1).
Table 1.
Synthetic parameters, precursor formulations, and reaction yields for the polyol-assisted solvothermal synthesis of manganese-based nanoparticles (S1–S5).
Table 1.
Synthetic parameters, precursor formulations, and reaction yields for the polyol-assisted solvothermal synthesis of manganese-based nanoparticles (S1–S5).
| Sample | Precursor | Polyol | Reducing Agent | Reaction Yield | Isolated NPs |
|---|
| S1 | ΚMnO4 | TEG | - | 66.10% | MnCO3@TEG |
| S2 | MnCl2∙4H2O | PG | OAm | 34.05% | MnCO3@OAm |
| S3 | Mn(acac)2 | TEG | NaOH | 68.85% | MnOHCO3@TEG |
| S4 | Mn(NO3)2∙xH2O | TEG | - | 21.80% | MnO2/Mn2O3@TEG |
| S5 | Mn(acac)3 | PG | NaOH | 38.55% | Mn3O4@PG |
The identification of the crystalline structure of the three samples, MnCO
3@TEG, MnCO
3@OAm, and MnOHCO
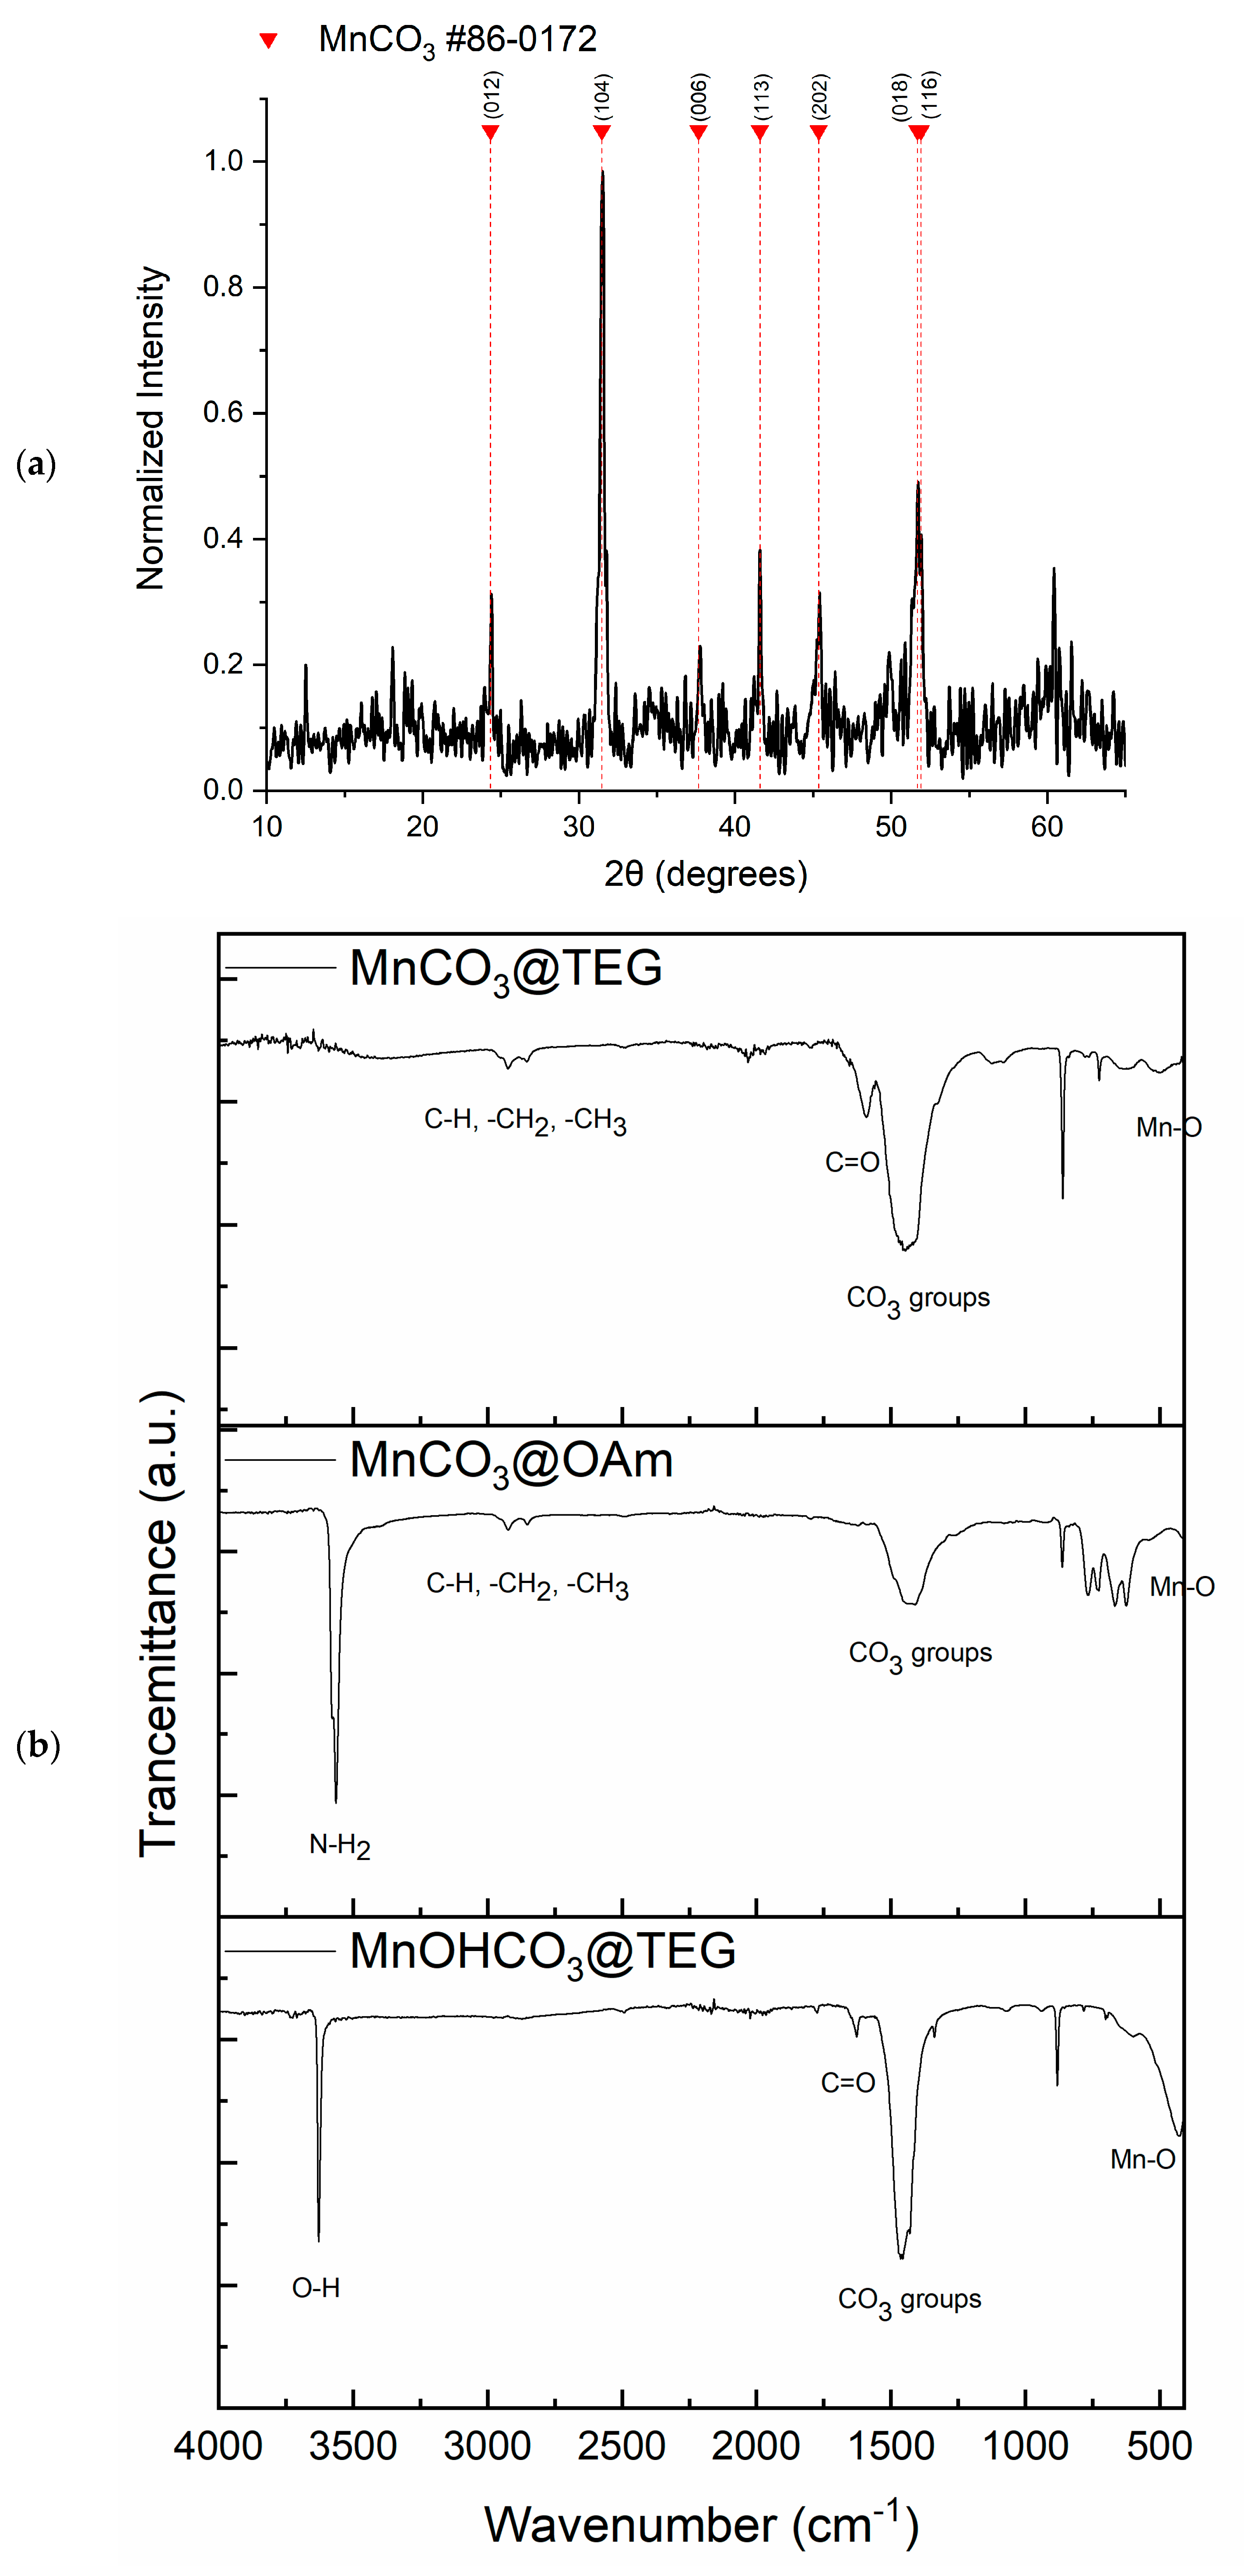
3@TEG, was carried out following the analysis of their XRD patterns. Owing to their analogous diffraction profiles, the XRD pattern of sample S1 is presented as a representative example (
Figure 1a). The pattern exhibits well-defined diffraction peaks that match standard ICDD card #86-0172 for pure manganese carbonate (rhodochrosite), confirming it as the sole crystalline phase present. The primary reflections of the structure are indexed to the (012), (104), (006), (113), (202), (018), and (116) planes, with the (104) plane displaying the highest relative intensity. Sample S1 crystallizes in a hexagonal lattice system within the space group R-3c. The calculated lattice parameters for the hexagonal unit cell are α = b = 4.773 Å and c = 15.642 Å, with axial angles of α = β = 90° and γ = 120°.
The ATR-IR spectra (
Figure 1b) of all three samples, MnCO
3@TEG, MnCO
3@OAm, MnOHCO
3@TEG, confirm the successful formation of manganese carbonate or hydroxycarbonate cores alongside surface functionalization by their respective organic capping agents. Across all three samples, the presence of the inorganic carbonate core is evidenced by strong characteristic CO
32− vibrational bands (~1408–1455 cm
−1, ~860–880 cm
−1, and ~702–726 cm
−1) [
22,
23], accompanied by low-wavenumber Mn-O stretching modes occupying tetrahedral (~597–665 cm
−1) and octahedral sites (~430–500 cm
−1) [
24]. The presence of organic shells is identified by aliphatic C-H stretching modes (~2850–2925 cm
−1) present in all samples [
25], along with ligand-specific features: an intense doublet corresponding to N-H
2 stretching (3579 and 3564 cm
−1) confirms oleylamine functionalization in MnCO
3@OAm [
26], a sharp structural O-H stretching band (3627 cm
−1) characterizes MnOHCO
3@TEG, and polyether C-O-C modes (1123 and 1081 cm
−1) appear in MnCO
3@TEG [
27]. Furthermore, oxidation products of tetraethylene glycol (TEG) are evident in both TEG-functionalized samples through C=O stretching vibrations (1590 cm
−1 for aldehyde derivatives in MnCO
3@TEG and 1626 cm
−1 for carboxylic species in MnOHCO
3@TEG) [
28].
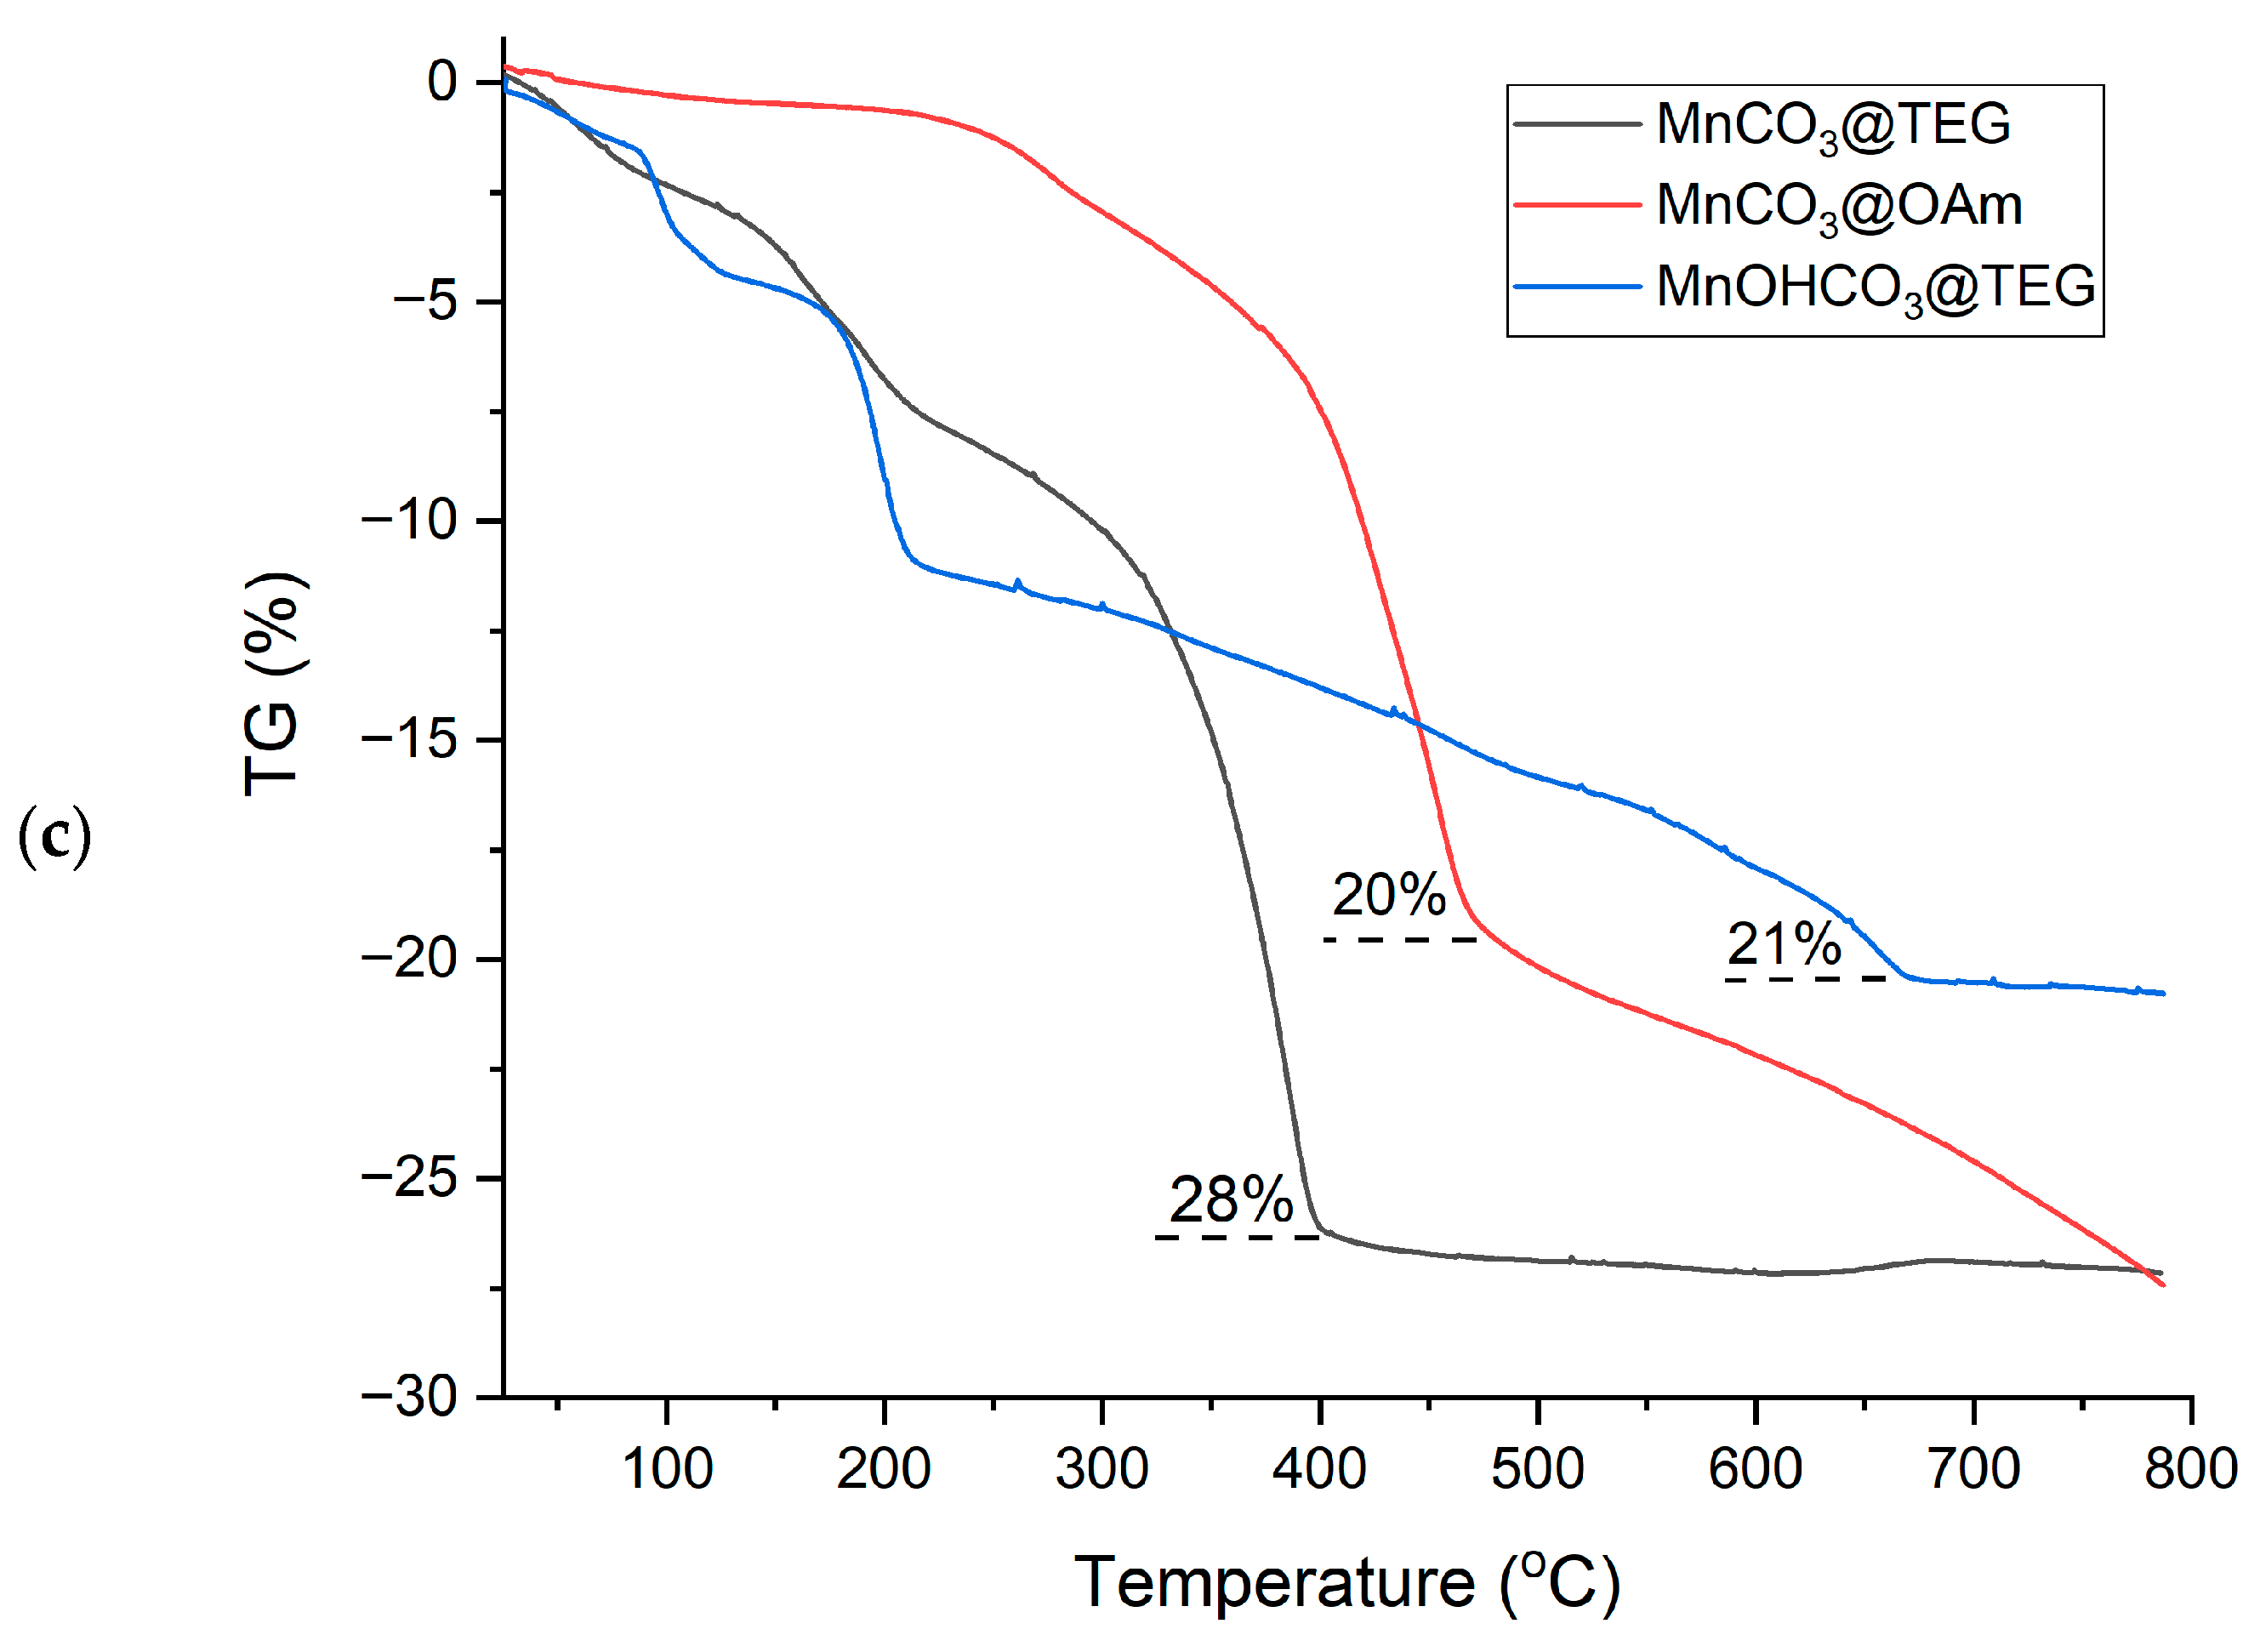
The thermogravimetric analysis (TGA) of all three samples, MnCO
3@TEG, MnCO
3@OAm, and MnOHCO
3@TEG (
Figure 1c), reveals multi-step mass-loss profiles reflecting the sequential evaporation of adsorbed water, degradation of the organic surface coatings, and thermal decomposition of the inorganic core phases. At lower temperatures, each sample exhibits an initial minor mass loss due to the removal of physically adsorbed moisture (~1.5–3.2%), followed by a secondary step corresponding to the breakdown of the organic shell (~3.5–6.5%). The major decomposition stage occurs at higher temperatures and is governed by core breakdown; for MnCO
3@TEG and MnCO
3@OAm, the sharp mass decrease between 220–400 °C and 360–500 °C, respectively, corresponds to the decarbonation of the MnCO
3 core into manganese oxide via CO
2 evolution. In contrast, MnOHCO
3@TEG displays an extended degradation region between 250 °C and 680 °C due to two overlapping processes: crystal lattice dehydroxylation and carbonate breakdown. Ultimately, each thermal profile reaches a stable plateau corresponding to the formation of an inorganic manganese oxide residue, yielding total overall mass losses of 28% for MnCO
3@TEG, 20% for MnCO
3@TEG MnCO
3@OAm, and 21% for MnOHCO
3@TEG, which confirms successful surface functionalization across all three samples.
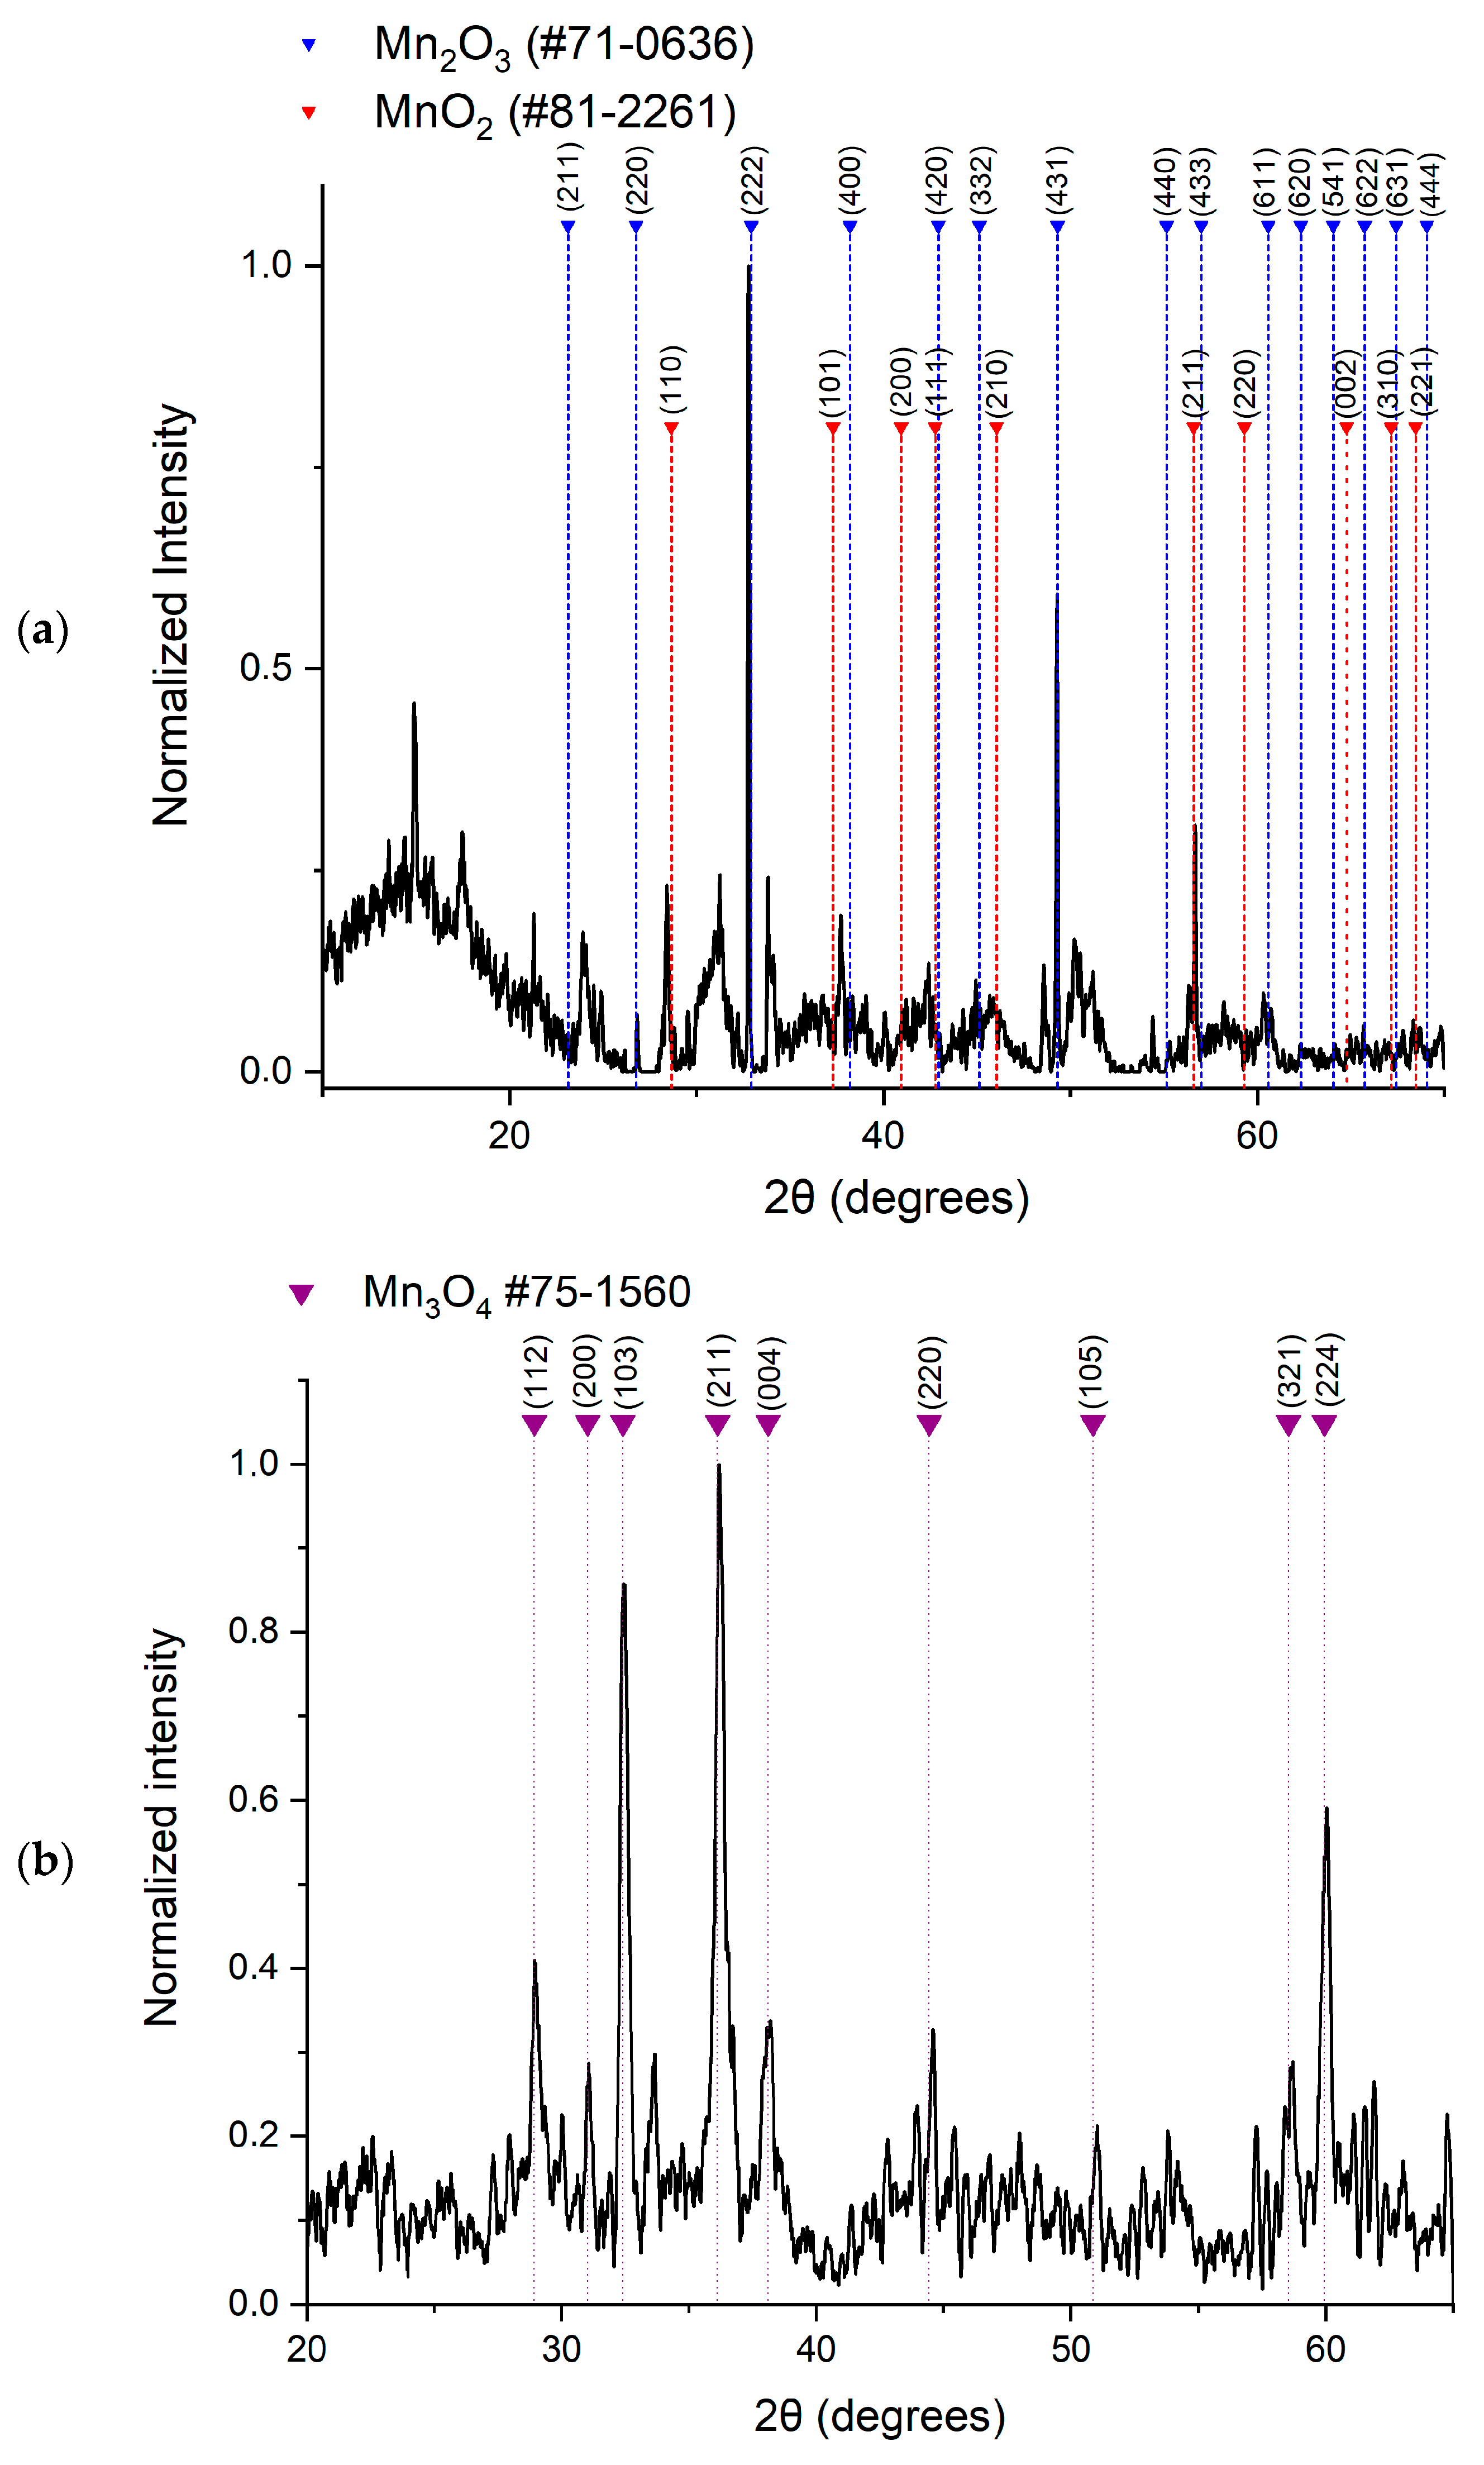
The identification of the crystalline structure of sample S4 was carried out following the analysis of its XRD pattern. The XRD pattern of sample S4 (
Figure 2a) exhibits reflection peaks corresponding to ICDD card #71-0636 for bixbyite Mn
2O
3 and #81-2261 for pyrolusite MnO
2. The primary reflections for the bixbyite structure are indexed to the (211), (220), (222), (400), (420), (332), (431), (440), (433), (611), (620), (541), (622), (631), and (444) planes, with (222) being the main peak. Bixbyite Mn
2O
3 crystallizes in a cubic lattice structure belonging to the space group Ia-3. The calculated lattice parameters for this cubic structure are α = b = c = 9.4146 Å and α = β = γ = 90°, which are in good agreement with the literature values (α = b = c = 9.409 Å, α = β = γ = 90°) [
29]. The characteristic reflections of the pyrolusite MnO
2 structure are assigned to the (110), (101), (200), (111), (210), (211), (220), (002), (310), and (221) planes. Pyrolusite crystallizes in a tetragonal lattice system with calculated lattice constants of α = b = 4.4041 Å, c= 2.8765 Å, and α = β = γ = 90°, which closely align with the previous reference (α = b = 4.400 Å, c= 2.874 Å, α = β = γ = 90°) [
30]. The crystallite size was calculated using the Scherrer equation based on the full width at half maximum (FWHM) of the primary (222) reflection, yielding a value of 140 nm. Quantitative phase analysis indicates that the sample consists of 92% bixbyite and 8% pyrolusite.
The XRD pattern of sample S5 (
Figure 2b) exhibits reflection peaks corresponding to ICDD card #75-1560 for hausmannite Mn
3O
4, which constitutes the sole phase present in the sample. The main structural reflections are indexed to the (112), (200), (103), (211), (004), (220), (105), (321), and (224) planes, with the (211) plane displaying the primary (most intense) peak. Sample S5 crystallizes in a tetragonal lattice structure. The calculated lattice parameters for this tetragonal structure are α = b = 5.762 Å, c = 9.439 Å, and α = β = γ = 90°, which closely agree with literature values (α = b = 5.762 Å, c = 9.46 Å, α = β = γ = 90°) [
31]. The crystallite size was calculated as 28 nm.
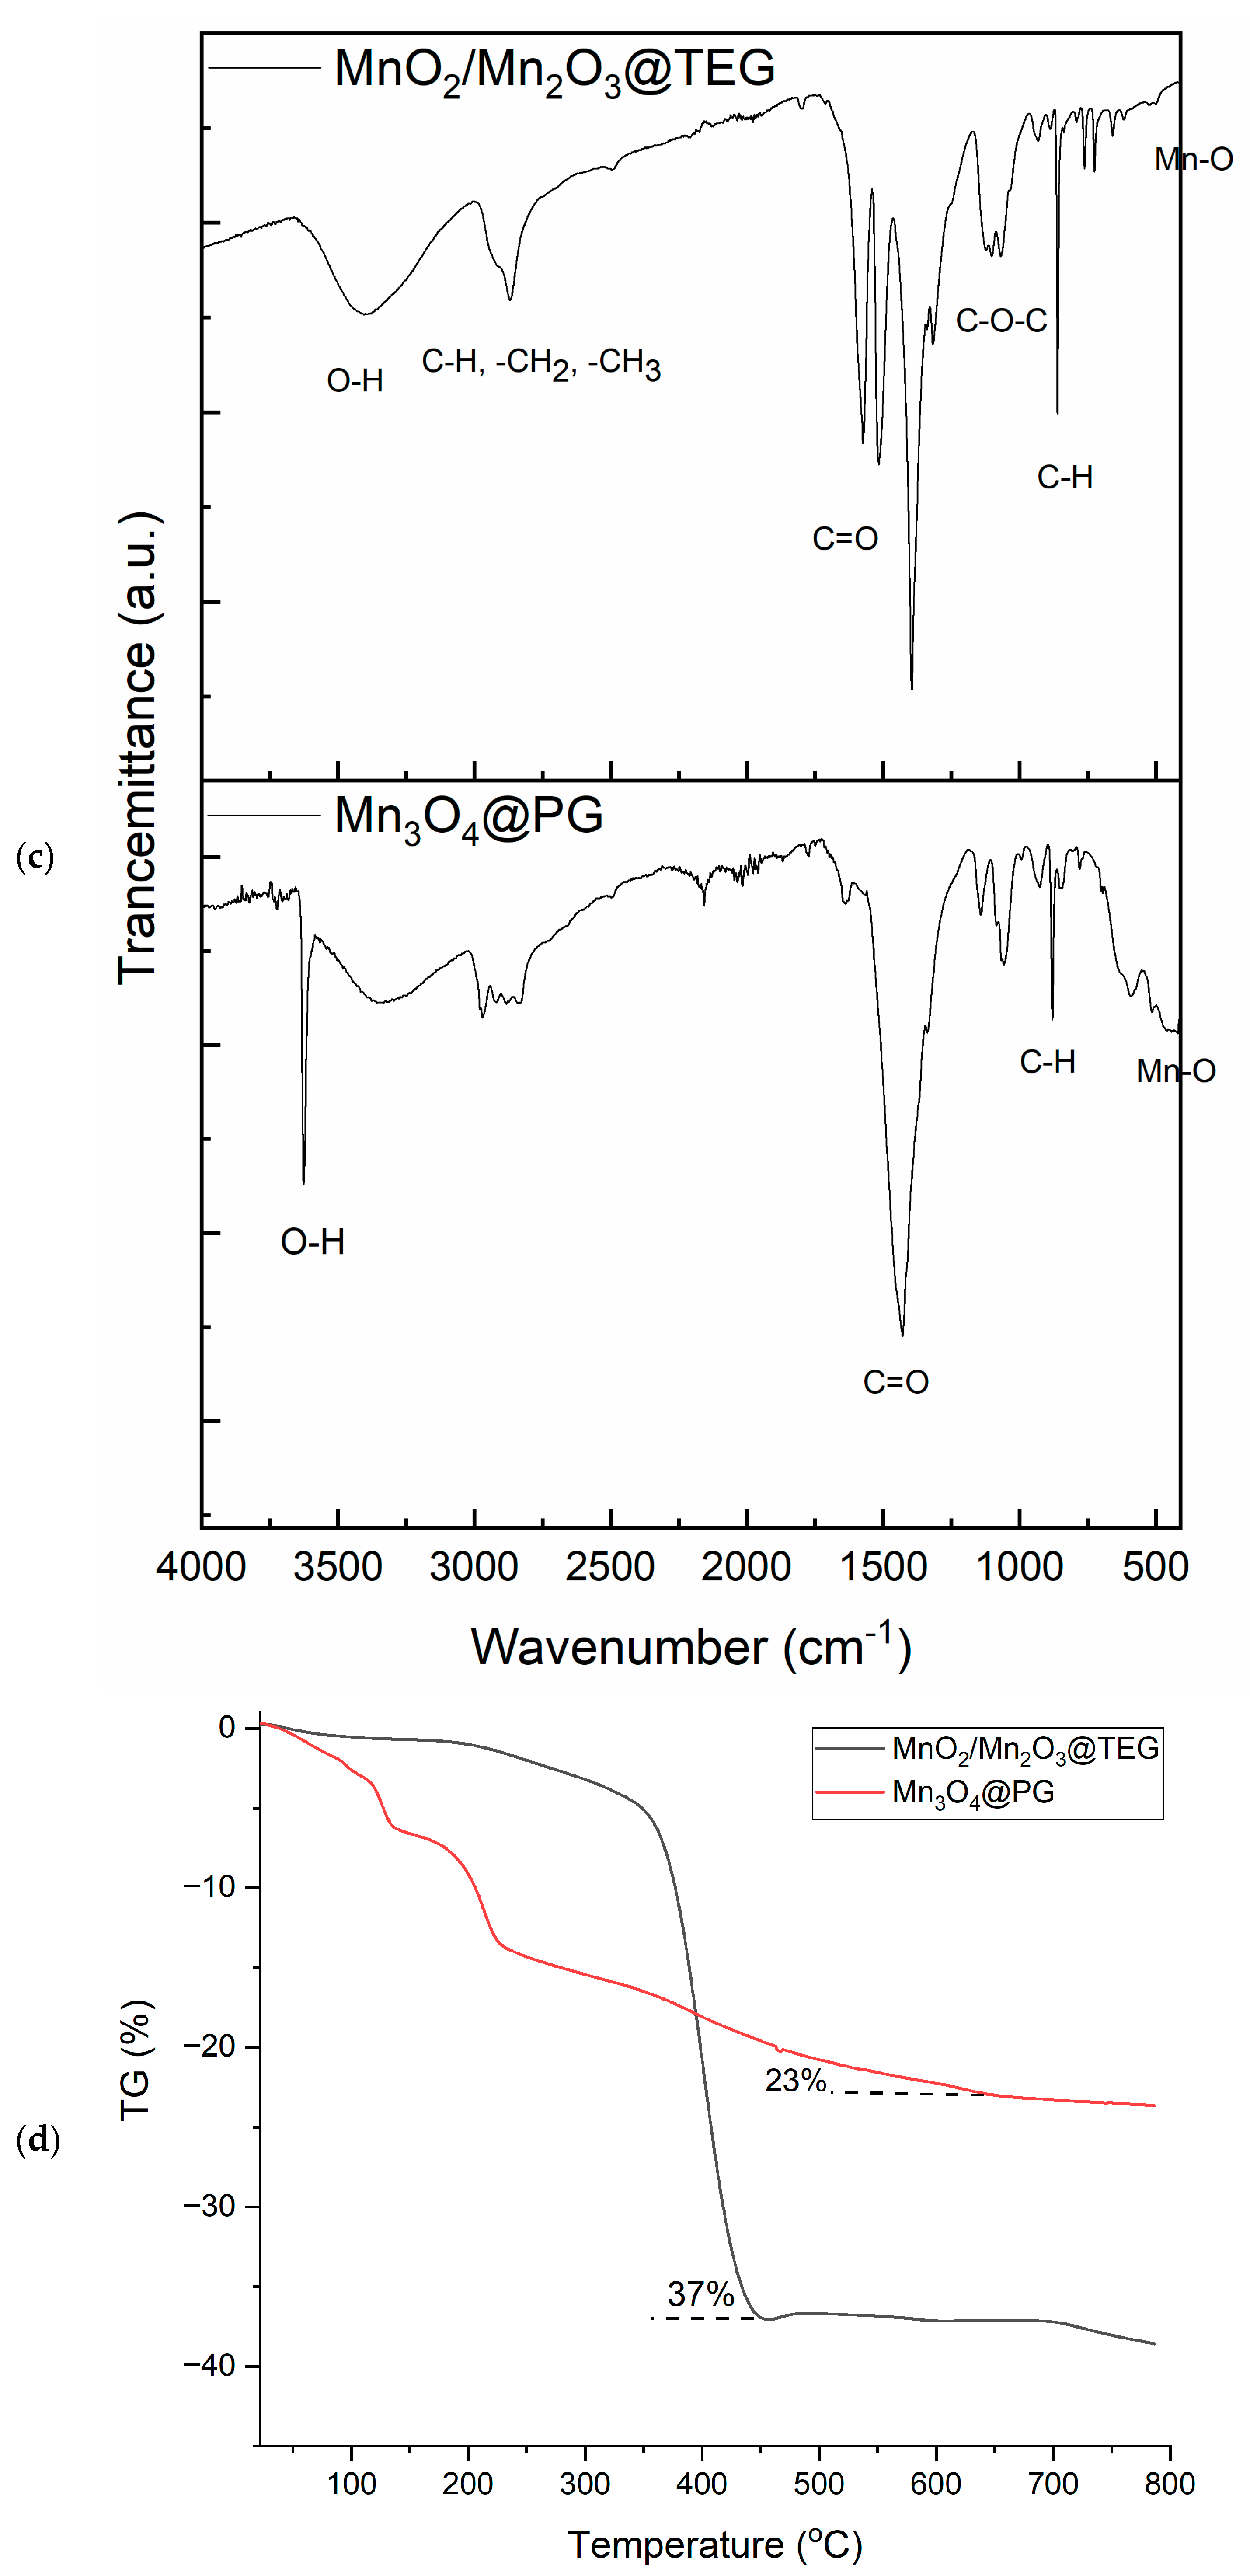
The ATR-IR spectra (
Figure 2c) of MnO
2/Mn
2O
3@TEG NPs and Mn
3O
4@PG NPs confirm the formation of distinct manganese oxide core phases along with their corresponding organic shell modifications. In the high-wavenumber region, hydroxyl features appear as a broad O-H stretching band centered at ~3400 cm
−1 for MnO
2/Mn
2O
3@TEG NPs due to adsorbed water, whereas Mn
3O
4@PG NPs exhibit a sharp, intense band at 3626 cm
−1 attributed to structural/surface O–H groups from propylene glycol or its derivatives. Both spectra display signature organic features resulting from polyol oxidation during synthesis: MnO
2/Mn
2O
3@TEG NPs displays aliphatic C–H stretching (2915, 2868 cm
−1), oxidation derivative bands (1574, 1515, 1394, 1316 cm
−1), ether C–O–C modes (1120, 1065 cm
−1), and in-plane C–H bending (861, 761 cm
−1), while Mn
3O
4@PG NPs are dominated by a strong C=O stretching vibration at 1430 cm
−1 (from hydroxyacetone and lactaldehyde derivatives) along with a C–H bending mode at 879 cm
−1 [
32]. Finally, the low-wavenumber lattice region clearly distinguishes the two oxide phases: MnO
2/Mn
2O
3@TEG exhibits characteristic Mn–O stretching bands at 523 and 500 cm
−1 [
33,
34], whereas Mn
3O
4@PG shows modes at 592 and 472 cm
−1, corresponding to Mn–O vibrations in tetrahedral and octahedral coordination sites, respectively [
35,
36].
Thermogravimetric analysis (TGA) up to 800 °C reveals distinct thermal degradation profiles for MnO
2/Mn
2O
3@TEG NPs and Mn
3O
4@PG NPs (
Figure 2d), reflecting variations in their surface organic coatings. For Mn
3O
4@PG NPs, the thermal decomposition proceeds via a multi-step process: an initial 3% mass loss up to 110 °C from physically adsorbed water evaporation, a double-step loss of ~10% between 110 °C and 250 °C due to the volatilization of propylene glycol oxidation derivatives (hydroxyacetone and lactaldehyde), and a final gradual 10% loss up to 800 °C corresponding to the removal of chemisorbed residues, giving an overall mass reduction of 23%. In contrast, MnO
2/Mn
2O
3@TEG NPs exhibit high thermal stability at lower temperatures with a minor water desorption step (~2.5%) up to 250 °C, followed by a single, sharp weight drop of ~34.5% between 250 °C and 450 °C attributed to the complete degradation and combustion of the TEG shell. Above 450 °C, the TEG profile stabilizes into a plateau corresponding to the solid MnO
2/Mn
2O
3 inorganic residue, yielding a total weight loss of 37% and confirming efficient surface functionalization for both nanoparticle systems.
Dynamic light scattering measurements provided intensity-weighted Z-average hydrodynamic diameters of all samples, which are presented in
Table 2 along with the polydispersity indices and the zeta potential values. Mn
3O
4@PG NPs had the smallest Z-average hydrodynamic diameter (101 nm), PDI (0.130), and a zeta potential of −36.93 mV. MnOHCO
3@TEG had a Z-average diameter of 196 nm, PDI of 0.278, and zeta potential of −38.7 mV. MnCO
3@TEG had a Z-average diameter of 226 nm, PDI of 0.183, and zeta potential of −24.3 mV. These ensemble measurements describe dispersion behavior and do not directly determine primary particle morphology or size.
MnCO3@OAm showed a larger Z-average hydrodynamic diameter (324 nm), PDI of 0.299, and zeta potential of −14.7 mV. MnO2/Mn2O3@TEG had the largest Z-average hydrodynamic diameter (624 nm), PDI of 0.410, and a near-neutral zeta potential (−4.1 mV), consistent with a broad, aggregated dispersion. Because the measurements were intensity-weighted, larger scattering species can strongly influence the reported hydrodynamic diameter.
Crystallite size and hydrodynamic diameter are distinct quantities. The Scherrer crystallite size estimates the coherent X-ray scattering domain and may represent only part of a particle or an aggregate. DLS reports the hydrodynamic diameter of scattering entities in suspension, including the inorganic core, surface coating, and any aggregates. Thus, the 140 nm Scherrer crystallite size and 624 nm DLS diameter for MnO2/Mn2O3@TEG are compatible with aggregation and/or multicrystallite assemblies.