Article

CNGC Gene Family in Pyrus betulaefolia: Genome-Wide Analysis and CNGC4/14 Function in Salt Tolerance via DNA Methylation


by
Hui Li
,
Jialiang Kan
,
Yilong Liu
,
Chunxiao Liu
and
Xiaogang Li
*
Jiangsu Key Laboratory for Horticultural Crop Genetic Improvement, Institute of Pomology, Jiangsu Academy of Agricultural Sciences, Nanjing 210014, China
*
Author to whom correspondence should be addressed.
Int. J. Mol. Sci. 2026, 27(18), 8252; https://doi.org/10.3390/ijms27188252 (registering DOI)
Submission received: 17 August 2026 / Revised: 3 September 2026 / Accepted: 10 September 2026 / Published: 16 September 2026
(This article belongs to the Section Molecular Biology)

Abstract

Salt stress severely restricts the growth and development of pear trees, and DNA methylation may potentially modulate the salt tolerance of Pyrus betulaefolia by regulating ion transporter genes. Cyclic nucleotide-gated channel (CNGC) family genes are essential for plant ion transport and salt stress adaptation; however, the epigenetic regulatory relationship between DNA methylation and CNGC genes underlying pear salt tolerance remains unclear. In this study, 26 PbCNGC genes were systematically identified from P. betulaefolia, which possess the conserved motifs characteristic of the CNGC family and can be classified into five subclades. PbCNGC members exhibit distinct spatiotemporal expression patterns in ordinary and salt-tolerant genotypes. Under salt stress, core members PbCNGC3, PbCNGC4, PbCNGC10, and PbCNGC14 displayed typical fluctuating up-and-down expression patterns across roots, stems, and leaves, with distinct spatiotemporal specificity in their expression peaks. In contrast, PbCNGC19 and PbCNGC20;1 were exclusively induced in roots under salt stress. Quantitative results showed marked genotypic differences in salt responsiveness. At 4 h of salt treatment, the root transcript levels of PbCNGC4 and PbCNGC14 were upregulated by 8.27-fold and 6.76-fold in the salt-tolerant genotype, respectively, which were considerably higher than those in the ordinary genotype (2.08-fold and 4.50-fold). Obvious genotypic differences in mCHH methylation modifications of PbCNGC4 and PbCNGC14 were detected after salt treatment, and pharmacological experiments confirmed that DNA methylation negatively modulates the transcription of these two genes. Yeast functional complementation assays further demonstrated that PbCNGC4 and PbCNGC14 act as functional Na+ and K+ permeable cation influx channels. Combined with methylation analysis results, this study reveals a potential regulatory cascade in which DNA methylation may inhibit the transcription of PbCNGC4 and PbCNGC14, modulating their ion-transport capacity, effectively reduces Na+ overaccumulation, sustains cellular K+ retention to alleviate salt-induced ionic toxicity, and may ultimately shape the salt tolerance of P. betulaefolia. These findings enrich the understanding of epigenetic regulation of plant salt tolerance and provide valuable candidate genes and theoretical references for salt-tolerant molecular breeding in pear trees.

1. Introduction

Global soil salinization is increasingly aggravated worldwide, posing a major threat to agricultural sustainability and plant growth development [1,2]. Salt stress inhibits plant growth and productivity by disrupting ion homeostasis and inducing osmotic and oxidative damage, where excess reactive oxygen species impair cell membrane stability and photosynthesis [3,4,5]. Plants have evolved multiple adaptive strategies to cope with salinity, including antioxidant defense, phytohormonal signaling, and microbial regulation, with ion transporters central to maintaining Na+/K+ balance and mitigating salt damage [6,7]. Cyclic nucleotide-gated channels (CNGCs), NHX antiporters, and HAK transporters are core components mediating cation transport and salt signal transduction in plants [7,8,9]. DNA methylation, a key epigenetic modification, modulates the transcription of salt-responsive transporter genes, and genotype-specific methylation patterns contribute to varied salt tolerance by differentially regulating gene expression under salt stress [1,10,11]. Besides endogenous genetic and epigenetic regulation, exogenous strategies effectively improve plant salt resistance through optimizing photosynthetic performance, maintaining intracellular ion homeostasis, and activating stress defense mechanisms to alleviate salt-induced damage [12,13,14,15]. Further investigations of epigenetic regulatory networks, combined with cation transport, will advance our understanding of plant salt adaptation and provide valuable theoretical support and gene resources for salt-tolerant crop molecular breeding.
Pear, as an important temperate fruit crop, is celebrated worldwide owing to its sweet, succulent flesh and wonderful texture [16]. Nevertheless, the continuous degradation of the global ecological environment has led to persistent restrictions on the progression of the pear industry. Consequently, the growth and development of pear trees are inhibited by ionic toxicity and osmotic stress induced by saline conditions [1]. As the original domestication center of pears, China conserves abundant distinctive and elite germplasm resources [2,17]. These germplasm resources consist of experimental materials with diverse genetic backgrounds capable of responding to and mitigating multiple environmental stresses, and carry important practical value for the excavation of pear resistance genes and salt-tolerant breeding research. Among them, Pyrus betulaefolia Bunge, an excellent native wild pear species, possesses prominent practical utility. When used as a grafting rootstock, this species can distinctly enhance the salt tolerance of Oriental pears [18].
P. betulaefolia employs multiple adaptive strategies to maintain normal growth under salt stress, including restricting Na+ translocation to above-ground tissues, regulating Na+/K+ homeostasis, and enhancing osmotic adjustment [6,10,19]. For instance, specific ion transporters, including AKT1, HAK25, NHXs, and VHA-B1, mediate Na+ sequestration to maintain cellular ionic and osmotic homeostasis after salt exposure [3,8,10,20]. On the other hand, several genes belonging to the HAK/KUP/KT family facilitate the selective absorption of K+ and participate in the maintenance of intracellular Na+/K+ homeostasis [7,21]. Meanwhile, salt stress induces the reprogramming of genomic DNA methylation patterns in the roots of P. betulaefolia. Specifically, epigenetic DNA modifications manifested as altered CHH methylation levels modulate the transcription of Ca2+ sensor genes PbCDPK20.1/20.2 as well as their downstream functional genes PbAKT1 and PbHAK25, which further stabilizes Na+/K+ homeostasis in root tissues [10]. Nevertheless, it is still unclear whether this DNA methylation regulatory cascade acts on other ion transport genes. Indeed, elucidating the correlation between dynamic methylation variations and the transcriptional abundance of different ion transporter genes upon salt stress is indispensable to completely decipher the molecular framework whereby DNA methylation governs salt tolerance in P. betulaefolia.
Plant cyclic nucleotide-gated channels (CNGCs) are evolutionarily conserved non-selective cation channels (permeable to Na+, K+, Ca2+) that regulate Na+ homeostasis through specific signaling pathways, thus participating in salt tolerance regulation [9]. CNGCs primarily function as direct mediators of ion transport. In Arabidopsis, AtCNGC10 promotes root Na+ influx. Suppression of its expression reduces Na+ accumulation and enhances salt tolerance [22]. Conversely, its antisense lines exhibit higher shoot Na+ content than the wild-type line [23]. AtCNGC4 can be activated by cyclic nucleotides and exhibits equal permeability to Na+ and K+ [24]. But AtCNGC19 and AtCNGC20 function as functionally redundant genes, which single-gene mutations fail to alter Na+ accumulation and salt tolerance phenotypes in plants [25]. Previous studies also revealed similar roles for CNGCs in other plant species. Kenaf HcCNGC21 enhances salt tolerance through Na+ transport [26], whereas soybean GsCNGC20-d is involved in Ca2+ efflux and Na+/K+ uptake [27]. Besides directly transporting ions, CNGCs still participate in maintaining plant ion homeostasis. For example, certain root-expressed CNGC members rapidly activate the Na+/K+ homeostasis pathway. AtCNGC10 mediates root cation uptake and shoot ion allocation [23]; its homolog AtCNGC3 exhibits similar functions [28]. GsCNGC20-d confers salt tolerance in soybean by maintaining a low shoot Na+/K+ ratio [29]. Notably, CNGC expression is dynamically regulated by salt stress signals and further integrates with multiple signaling pathways to form a molecular regulatory network [29,30,31,32,33]. In addition, demethylation of certain CNGC genes not only serves as a prerequisite for their transcriptional activation but also acts as a key initiating node within the stress-response network [34]. Taken together, the above results establish a theoretical basis for dissecting the regulatory functions of CNGC family genes underlying salt tolerance in P. betulaefolia.
This study aims to fill the knowledge gap regarding the epigenetic regulation of the cyclic nucleotide-gated channel (CNGC) gene family underlying salt tolerance in P. betulaefolia. Previous studies have demonstrated that the salt-tolerant P. betulaefolia genotype copes with salt stress by maintaining a higher root K+/Na+ ratio and reducing Na+ accumulation in aerial tissues. Furthermore, the expression of potassium transporter genes (e.g., PbAKT1 and PbHAK25) is negatively regulated by their promoter methylation levels [10]. Nevertheless, whether the CNGC gene family participates in salt stress responses through a similar methylation regulatory mechanism remains unclear. Accordingly, the present study established the following specific objectives. First, we comprehensively identify the members of the CNGC gene family in the P. betulaefolia genome and analyze their sequence characteristics, evolutionary relationships, as well as their spatiotemporal expression profiles in both ordinary and salt-tolerant genotypes. Second, yeast complementation assays are performed to functionally verify the Na+ and K+ transport capacities of candidate CNGC genes, particularly PbCNGC4 and PbCNGC14. Third, pharmacological treatments are applied to manipulate the methylation level of CNGC genes, and the resulting transcriptional changes are detected. This study intends to clarify whether DNA methylation improves salt tolerance in P. betulaefolia by modulating the expression of CNGC genes, thereby providing experimental evidence for elucidating the comprehensive role of DNA methylation in coordinating salt tolerance mechanisms in pear rootstock.

2. Results

2.1. PbCNGCs Identification and Bioinformatics Analysis

A total of 26 CNGC genes were screened and identified from the P. betulaefolia genome. Domain analysis revealed that each candidate gene encodes a cyclic nucleotide monophosphates binding domain (CNBD), six transmembrane domains with a pore loop (P-loop), and at least one calmodulin binding domain (CaMBD) (Table 1). These genes were systematically named according to the sequence homology between PbCNGCs of P. betulaefolia and CNGC family members from P. bretschneideri, the detailed information of which was summarized in Table 1. Among these PbCNGC genes, all but three (namely PbCNGC11;1, PbCNGC13, and PbCNGC21) were found to possess a distinct isoleucine-glutamine (IQ) calmodulin-binding motif. Further characterization of their physicochemical properties showed that their corresponding CDS regions range from 1782 to 2424 bp in length. The deduced amino acid sequences of these proteins contain 593 to 807 residues, with calculated molecular weights ranging from 68.78 kDa to 91.73 kDa. Isoelectric point analysis indicated that all PbCNGC proteins have pI values between 8.35 and 10.05, which are above 7, classifying them as alkaline proteins. Furthermore, subcellular localization prediction suggested that all identified PbCNGC proteins are targeted to the plasma membrane.
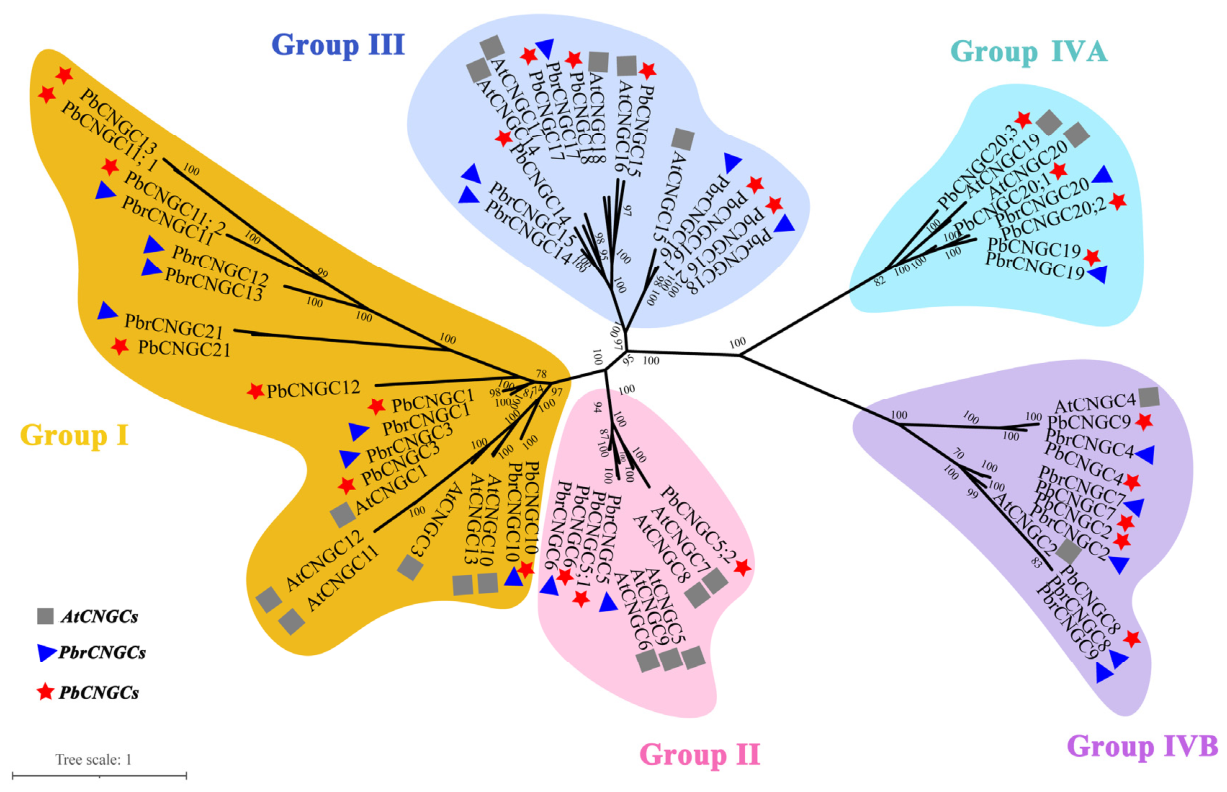
To investigate the classification and evolutionary relationships of the P. betulaefolia PbCNGC genes, a phylogenetic analysis was performed based on their deduced amino acid sequences. A maximum likelihood (ML) phylogenetic tree revealed that all PbCNGC genes could be divided into four highly supported clades, with bootstrap values ranging from 95% to 100% (Figure 1). Notably, the previously designated clade IV was further split into two distinct subclades. Collectively, the 26 PbCNGC genes were clustered into five groups, namely Groups I, II, III, IVA, and IVB (Figure 1). Group I represented the largest clade, comprising eight members, while the remaining groups contained three to six members each. Furthermore, although the CNGC genes of pear and Arabidopsis formed a monophyletic cluster within Group I, the substantial genetic distance between them suggested that these genes might have undergone independent amplification events. The number of CNGC members in Group III was approximately equivalent between pear and Arabidopsis. In contrast, pronounced disparities in member numbers were observed in Groups II and IVB: the PbCNGC family contained more members in Group IVB (five members) but fewer in Group II (three members). Taken together, these findings suggest that frequent gene duplication events occurred in the PbCNGC subfamilies after the divergence of pear from other species, thereby contributing to the rapid expansion of the PbCNGC gene family in P. betulaefolia.
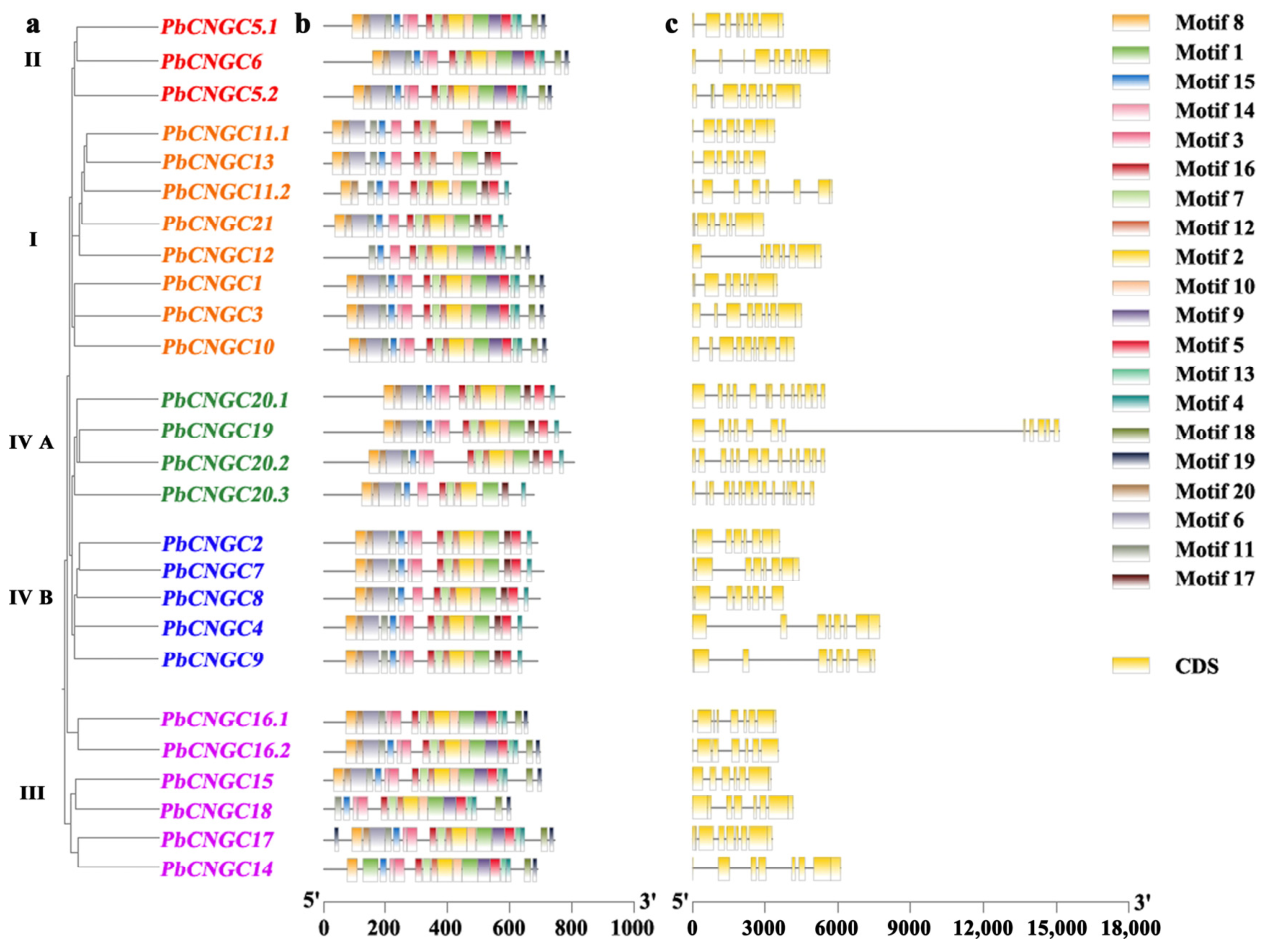
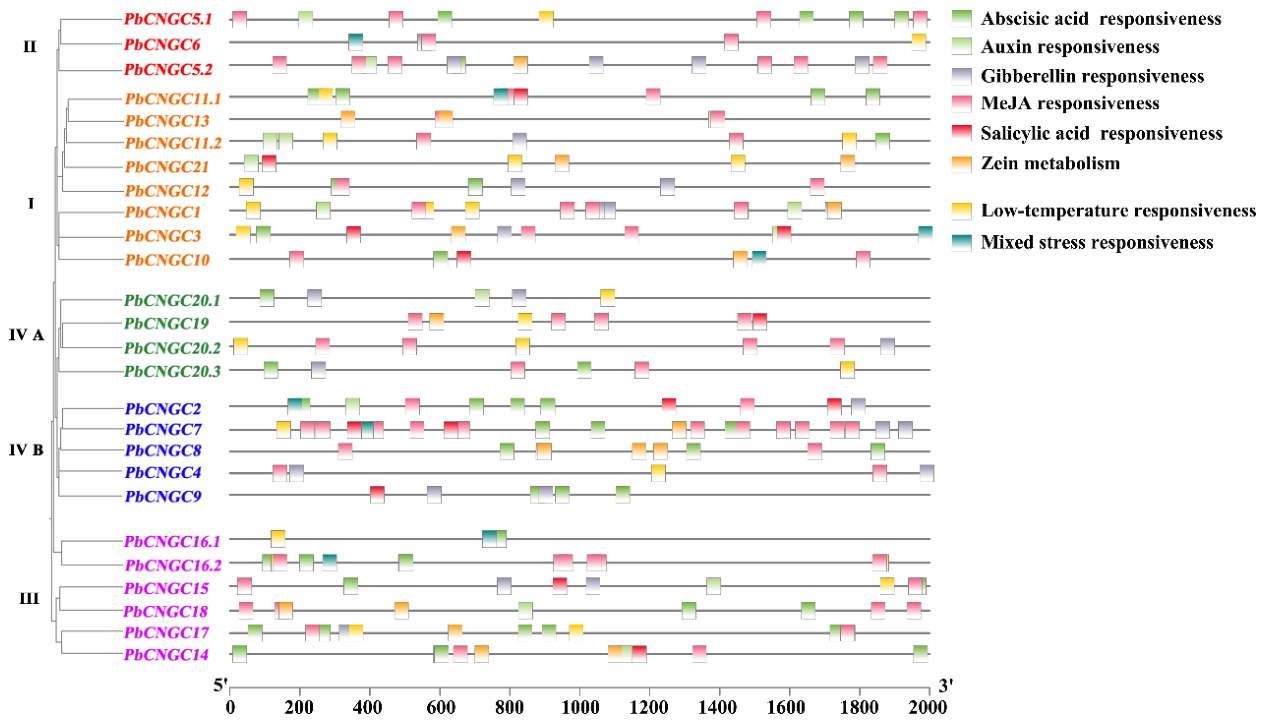
Motif analysis revealed that pear CNGCs contain a diverse set of motifs (Figure 2) and exhibit high similarity in both motif quantity and distribution, particularly among PbCNGCs belonging to the same subfamily. Among the 26 PbCNGC proteins, PbCNGC17 contained 20 motifs, while the other members possessed 13 to 19 motifs (Figure 2). Gene structure analysis of PbCNGCs showed that the number of CDSs per gene ranged from 6 to 15. Specifically, PbCNGC20;1, PbCNGC20;2, and PbCNGC20;3 each contained more than ten exons (Figure 2). Cis-element analysis demonstrated that every PbCNGC family member harbors plant hormone-responsive motifs, and low-temperature responsive cis-elements are detected in the majority of these genes (Figure 3). Furthermore, eight members (PbCNGC2, 3, 6, 7, 10, 11;1, 16;1, and 16;2) possess mixed stress response elements (Figure 3).
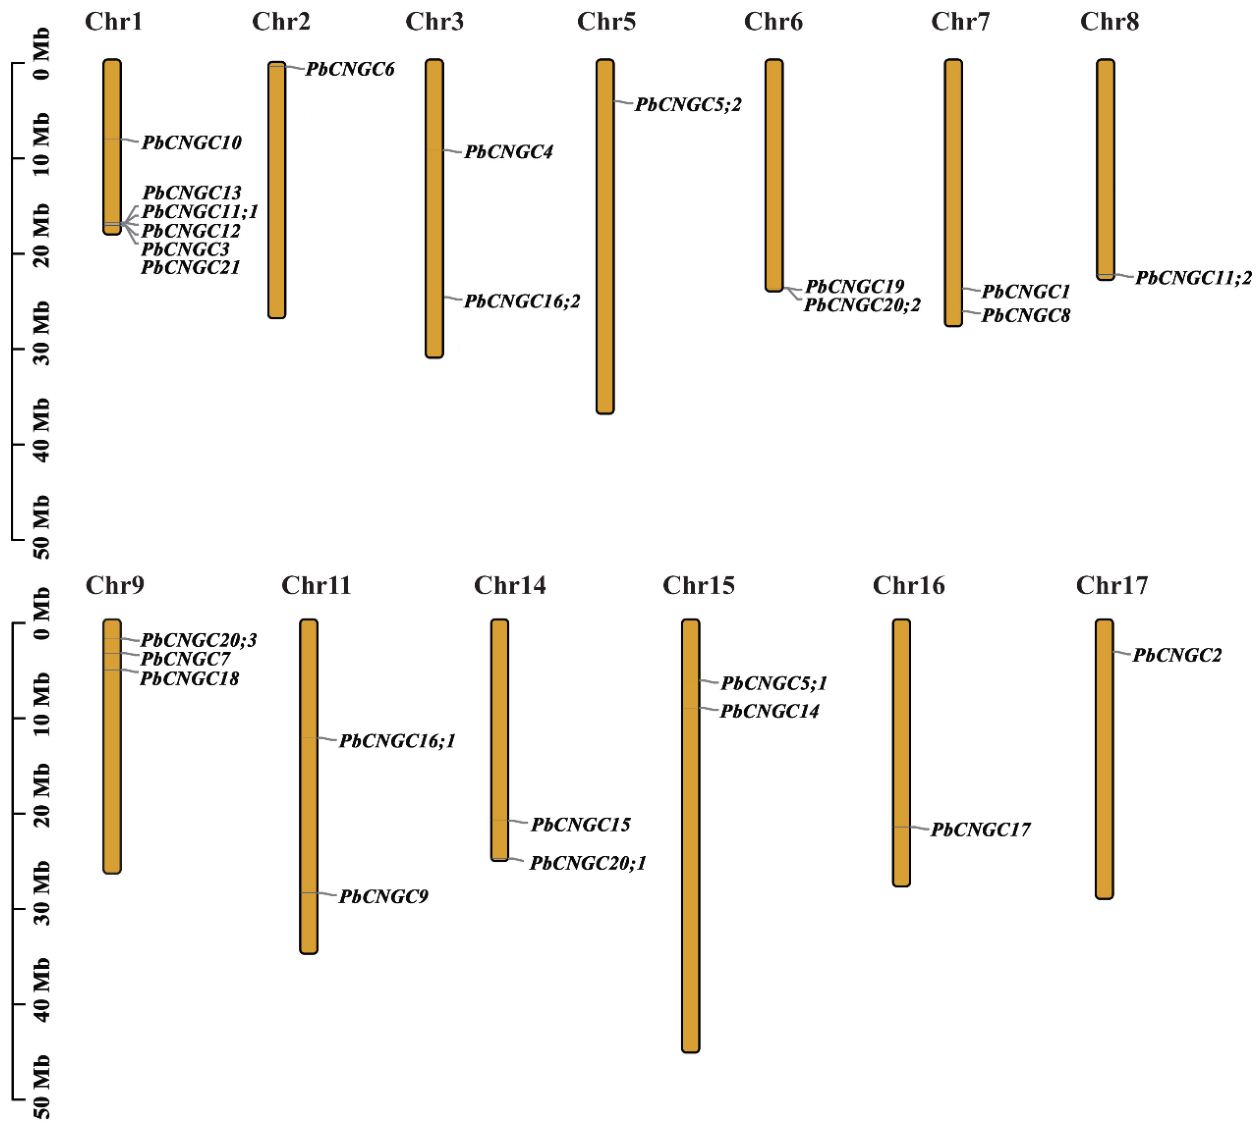
Based on the genomic annotation data of P. betulaefolia, the chromosomal distribution of PbCNGC genes was mapped (Figure 4). The 26 PbCNGC genes were unevenly distributed across 17 pear chromosomes. Chromosome 1 harbored the largest number of PbCNGC genes, with a total of six members. Chromosome 9 carried three PbCNGC genes, while chromosomes 3, 6, 7, 11, 14, and 15 each contained two members. Only one PbCNGC gene was detected on each of chromosomes 2, 5, 8, 16, and 17.

2.2. Response of PbCNGC Genes to Salt Stress

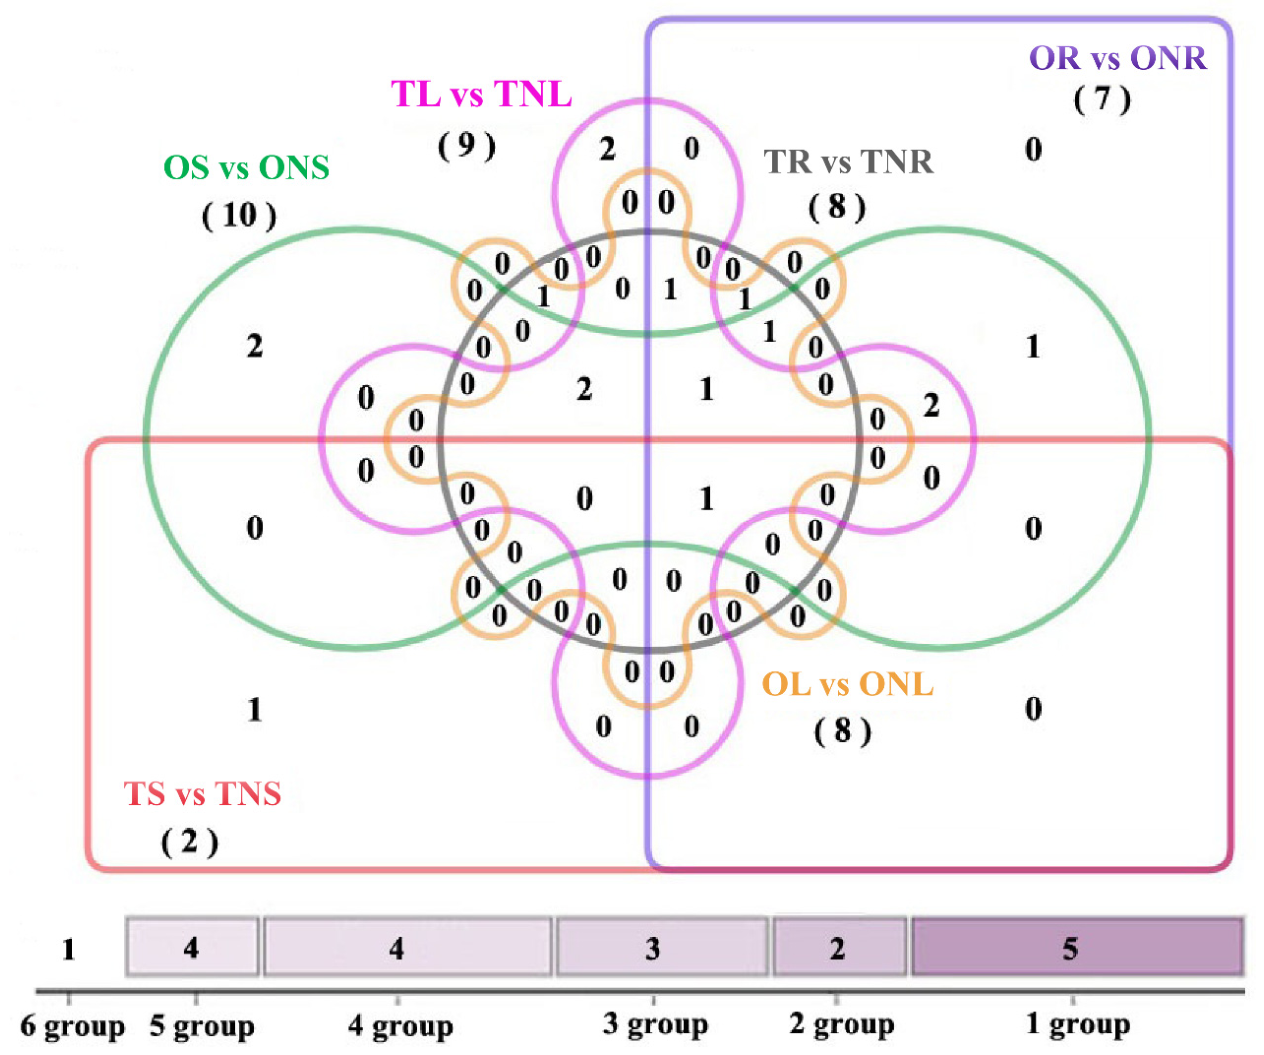
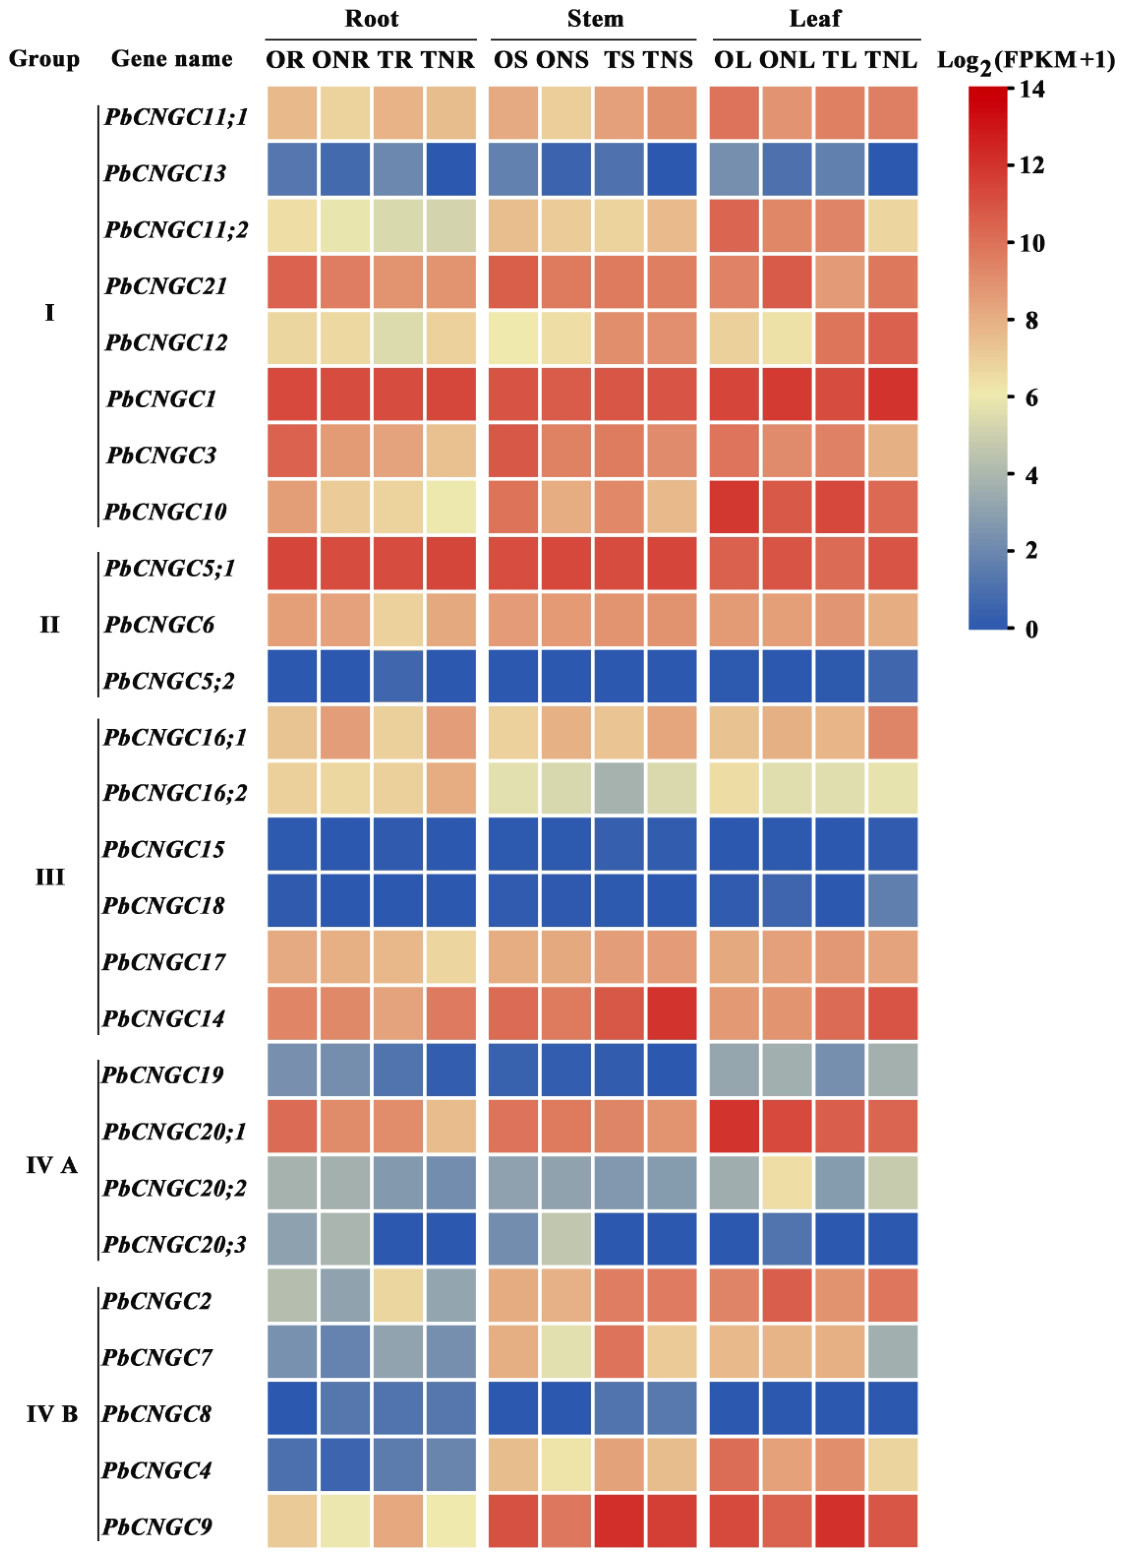
To characterize the biological functions of the 26 PbCNGC genes in response to salt stress, transcriptome data (NCBI, project number PRJNA812627) from ordinary genotype (O) and salt-tolerant genotype (T) of P. betulaefolia were used to profile gene expression across root, stem, and leaf tissues. Results showed that most PbCNGCs exhibited transcriptional signals in the three tested tissues, whereas their primary expression tissues varied substantially across individual genes (Figure 5). Prior to salt stress treatment, PbCNGC2, 4, 7, and 9 accumulated abundant transcripts in both leaves and stems; by contrast, PbCNGC10, PbCNGC11;2, and PbCNGC20;1 were preferentially expressed solely within leaf tissue. After 24 h of 200 mM NaCl treatment, 12 genes displayed identical expression patterns in the ordinary genotype (O) and salt-tolerant genotype (T). Within this subset, PbCNGC2/3/9/20;1, PbCNGC7, and PbCNGC4 experienced transcriptional down-regulation in roots, stems, and stems plus leaves, respectively. Meanwhile, the transcript abundance of PbCNGC10 and PbCNGC13 was suppressed in all three tested organs (roots, stems, and leaves). In contrast, transcription of PbCNGC18, PbCNGC20;2, and PbCNGC21 in leaves was up-regulated upon salt stress, and PbCNGC16;1 showed induced expression across roots, stems, and leaves. The rest of the PbCNGC family members displayed differential transcriptional remodelling in multiple organs when comparing the two genotypes (Figure 5 and Figure 6). All results indicated that PbCNGC genes perform their primary biological functions in different tissues.
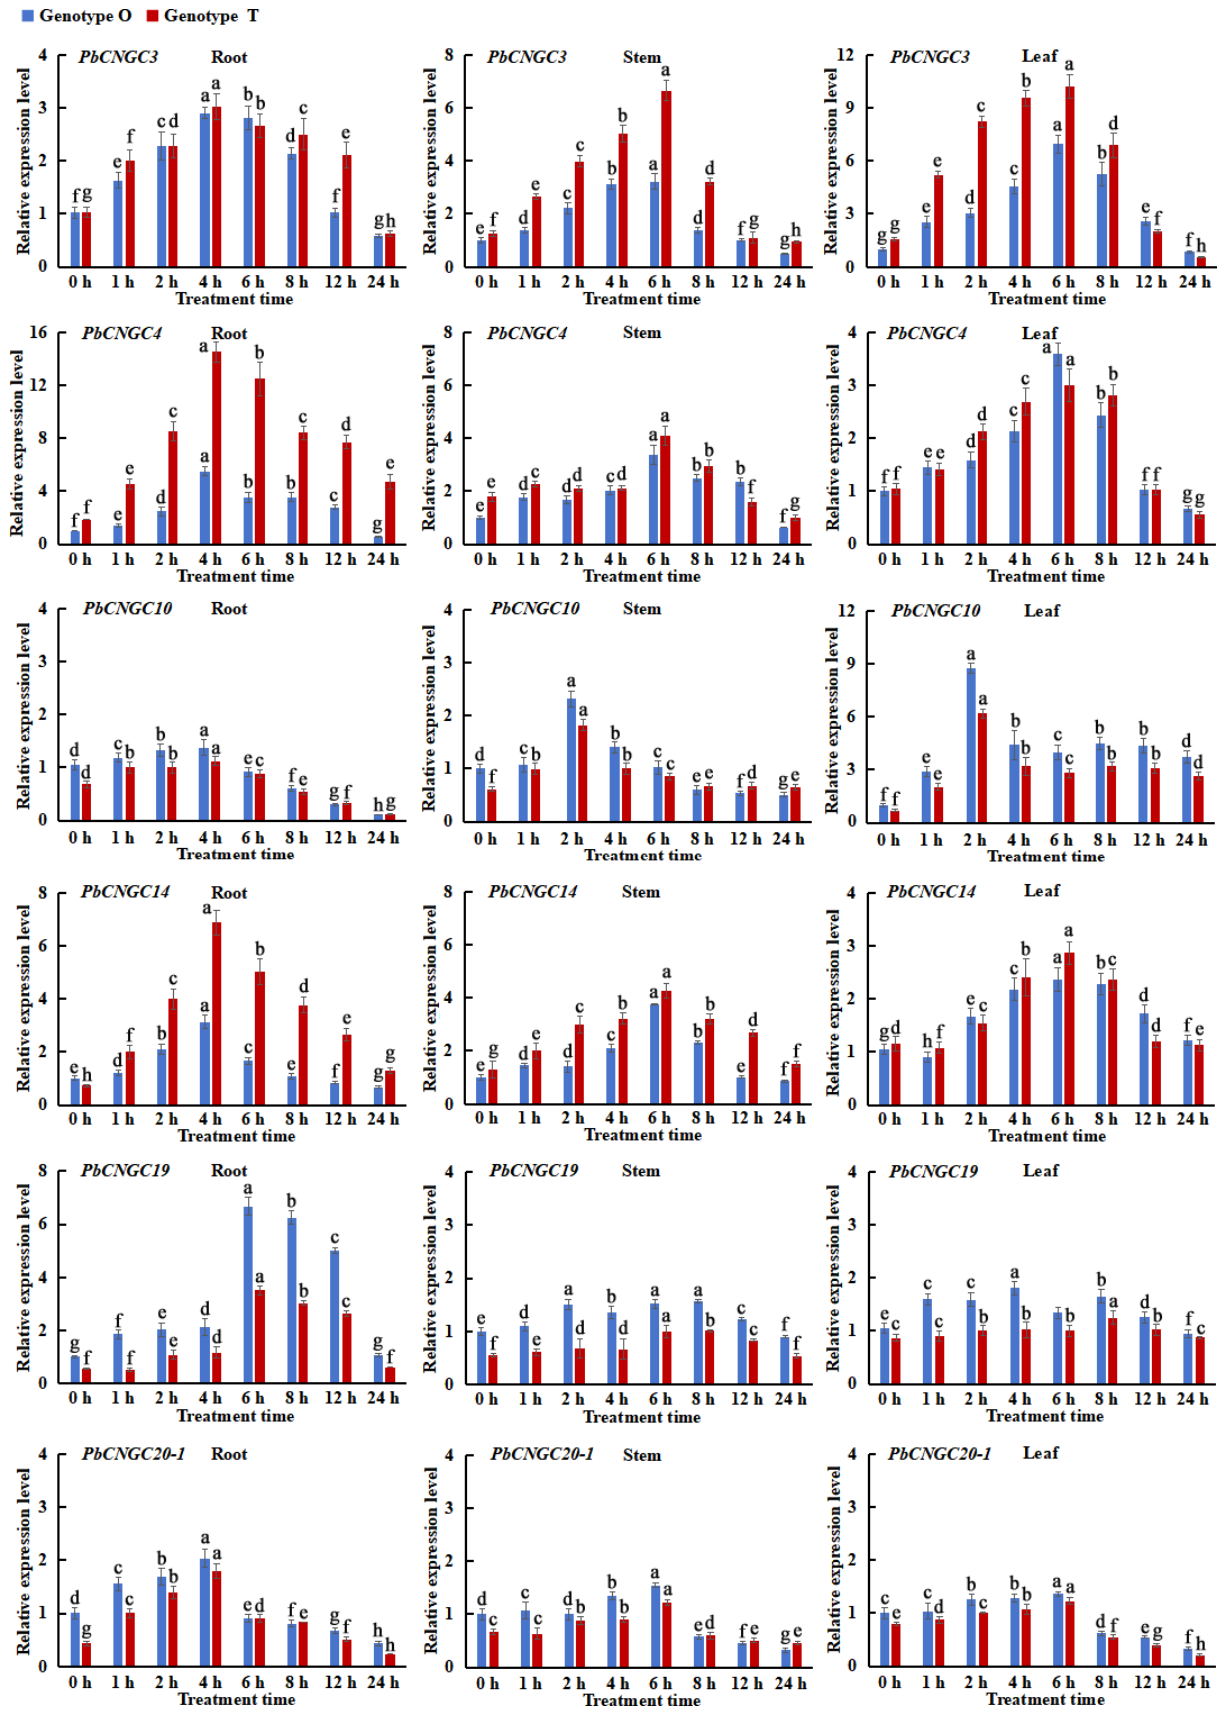
To further characterize the expression dynamics of PbCNGC genes under salt stress, qPCR was performed to quantify their transcript levels in six family members (Figure 7). The transcript levels of the six PbCNGC genes were initially induced and subsequently repressed under prolonged salt stress, indicating their involvement in plant salt response regulation. Under salt stress, PbCNGC3, PbCNGC4, PbCNGC10, and PbCNGC14 exhibited a typical dynamic up-and-down regulation pattern in roots, stems, and leaves, with distinct temporal and spatial specificity in their peak expression. In roots, PbCNGC3, PbCNGC4, PbCNGC10, PbCNGC14, and PbCNGC20;1 reached peak transcript abundance at 4 h of salt treatment, whereas PbCNGC19 peaked later at 6 h. In stems and leaves, PbCNGC3, PbCNGC4, and PbCNGC14 achieved their maximum transcript levels at 6 h, while PbCNGC10 displayed an earlier response and peaked at 2 h. In contrast, PbCNGC19 and PbCNGC20;1 showed strict root-specific salt responsiveness; their expression was significantly induced only in roots and remained stable without obvious temporal fluctuations in stems and leaves. In terms of tissue-dependent expression magnitude, PbCNGC4 and PbCNGC14 exhibited substantially higher fold changes in roots than in stems and leaves under salt stress, while PbCNGC3 and PbCNGC10 showed stronger upregulation in leaves than in other tissues. Moreover, the induction extent differed significantly between the two genotypes. At 4 h of salt treatment, the fold changes of PbCNGC4 and PbCNGC14 in the roots of the salt-tolerant genotype reached 8.27-fold and 6.76-fold, respectively, which were markedly higher than those in the ordinary genotype (2.08-fold and 4.50-fold).

2.3. DNA Methylation Changes Influence PbCNGC4/14 Expression Under Salt Stress

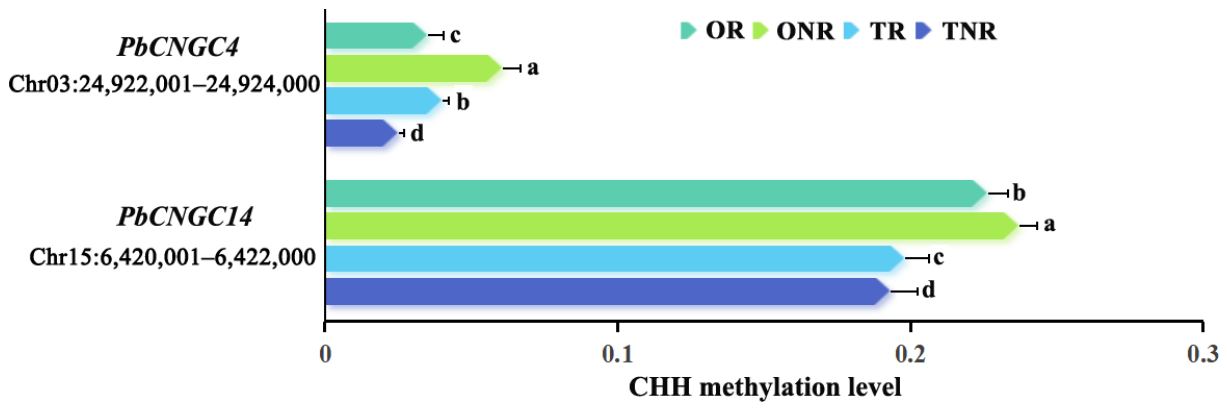
To explore whether salt-responsive transcriptional variation is modulated by dynamic DNA methylation, we used MethylKit (v1.12.0, span = 1000) [10] to screen root differentially methylated regions (DMRs) in two P. betulaefolia genotypes under salt treatment and control conditions. DMR functional annotation was performed via Bedtools (v2.31.0). Then, two DMRs were matched to the genomic intervals of PbCNGC4 and PbCNGC14 in birch-leaf pear roots. More concretely, upon 24 h of 200 mM NaCl treatment, the salt-tolerant genotype exhibited reduced methylation levels within the PbCNGC4 locus (Chr03:24922001–24924000) and the PbCNGC14 genomic interval (Chr15:6420001–6422000) (Figure 8). In contrast, these two regions exhibited increased methylation levels in the ordinary genotype under the same condition (Figure 8). In addition, the differentially methylated regions within the gene sequences of PbCNGC4 and PbCNGC14 belonged to the mCHH methylation type. Specifically, the differential methylation region of PbCNGC4 was located in the intron region, while that of PbCNGC14 was situated in the promoter region (Table 2). Collectively, these two genes exhibited distinct methylation patterns between the salt-tolerant and ordinary genotypes.
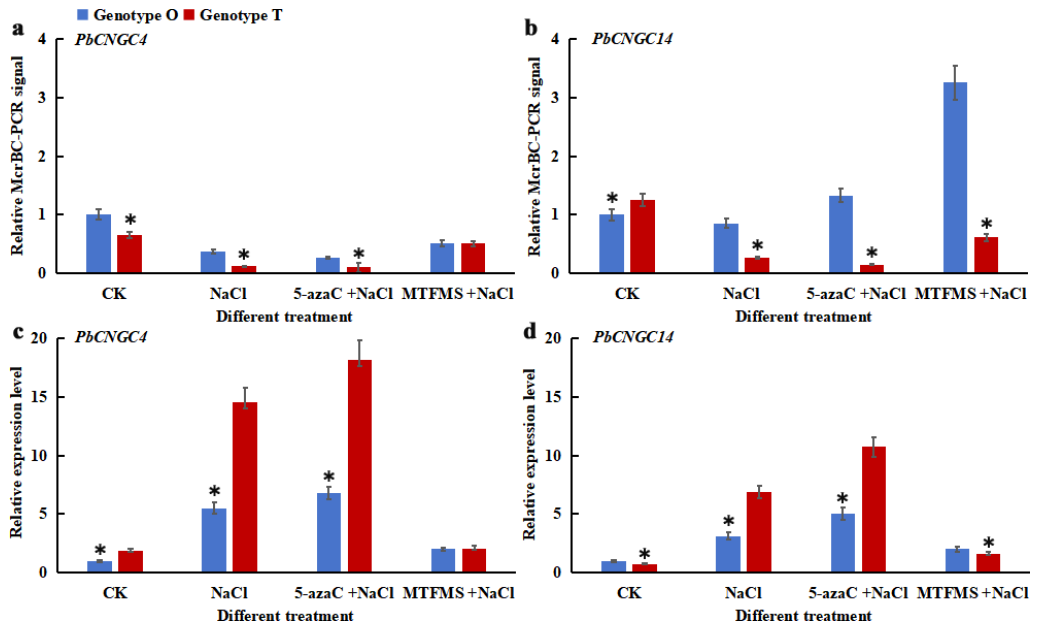
To verify whether DNA methylation regulates the expression of PbCNGC4 and PbCNGC14 in P. betulaefolia roots, we treated the ordinary genotype (O) and salt-tolerant genotype (T) with the DNA methylation inhibitor 5-azaC and methylation accelerator MTFMS for 12 h, followed by 200 mM NaCl salt-stress treatment for 4 h. Intrinsic genotypic differences in DNA methylation existed between the two genotypes. Under control conditions, salt-tolerant genotype T displayed significantly lower methylation levels and higher transcript abundance of PbCNGC4 and PbCNGC14 relative to ordinary genotype O. Upon NaCl exposure, methylation levels of both genes declined in both genotypes, yet genotype T still preserved hypomethylation and higher gene expression (Figure 9a–d). Pharmacological manipulation supported our expectations. Under salt stress, 5-azaC decreased DNA methylation and significantly up-regulated PbCNGC4 and PbCNGC14 transcription in both genotypes, and diminished genotypic divergence in methylation and gene expression in genotype O. By contrast, MTFMS elevated methylation and repressed gene transcription; it notably strengthened PbCNGC14 methylation and suppressed its expression in genotype O, while genotype T retained relatively low methylation. The transcriptional changes of PbCNGC4 and PbCNGC14 were tightly correlated with DNA methylation dynamics upon 5-azaC and MTFMS treatments: 5-azaC reduced target-gene methylation to elevate their expression under salt stress, whereas MTFMS caused opposite changes in methylation and transcript abundance. Collectively, these results confirm that DNA methylation critically modulates PbCNGC4 and PbCNGC14 transcription. Higher methylation confers stronger transcriptional repression, whereas hypomethylation facilitates transcript accumulation. Thus, genotype-specific basal DNA methylation differences govern the transcriptional activation of PbCNGC4 and PbCNGC14 under salt stress. This may partly explain the increased Na+ storage and higher K+/Na+ ratio observed in roots of the salt-tolerant ecotype [10].

2.4. PbCNGC4/14 Complements Yeast Mutants Defective in Na+/K+ Uptake

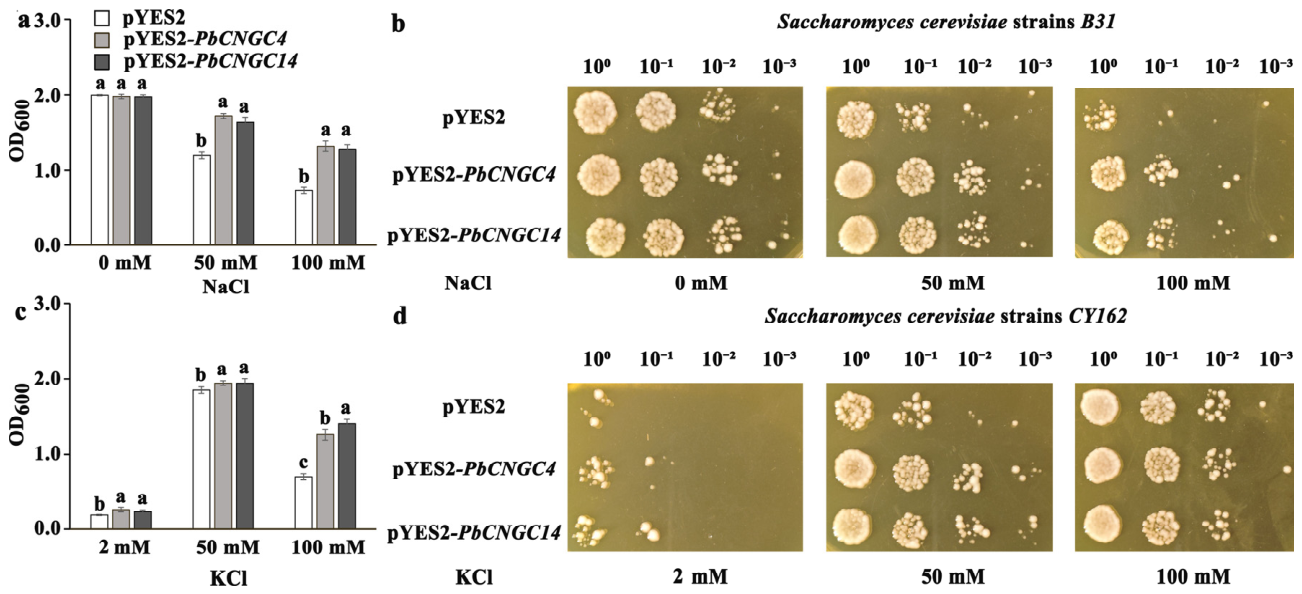
To verify whether PbCNGC4 and PbCNGC14 confer cation channel activity and mediate transmembrane ion transport, we performed heterologous expression of these two genes in yeast mutants with impaired cation transport capacity. The yeast strain B31 lacks the key Na+-efflux ATPase genes ENA1-4, leading to drastically increased salt sensitivity [22]. Under NaCl-free AP medium, yeast cells transformed with the empty vector pYES2 or recombinant vectors pYES2-PbCNGC4/PbCNGC14 exhibited consistent growth performance. However, distinct growth differences were observed among the three groups after 72 h of cultivation on solid medium and 48 h of incubation in liquid medium supplemented with 50 mM or 100 mM NaCl (Figure 10a,b). Compared with the severely growth-inhibited pYES2 control cells, yeast strains expressing PbCNGC4 or PbCNGC14 showed substantially enhanced salt tolerance (Figure 10a,b). The yeast strain CY162 lacks the high-affinity K+ uptake system Trk1/Trk2/Tok1, which impairs cellular potassium absorption [35]. All yeast strains failed to grow normally on YNB solid and liquid medium containing only 2 mM KCl, whereas the addition of 50 mM or 100 mM KCl partially restored their growth defects (Figure 10c,d). Notably, heterologous expression of PbCNGC4 and PbCNGC14 obviously promoted yeast growth relative to the pYES2 empty vector control (Figure 10c,d). Collectively, these results demonstrate that PbCNGC4 and PbCNGC14 act as Na+- and K+-permeable cation influx channels in yeast and may participate in regulating Na+/K+ homeostasis during salt-stress adaptation in P. betulaefolia.

3. Discussion

3.1. P. betulaefolia CNGCs Possess Conserved Family Structures

Cyclic nucleotide-gated ion channels (CNGCs) are tetrameric cation channels that govern plant Na+, K+, and Ca2+ uptake, and their biological roles have been well documented in numerous herbaceous species [9,32]. Nevertheless, functional investigations of the CNGC family remain scarce for fruit-tree rootstocks, which are critical for stress adaptation in orchards. In the present work, we identified 26 PbCNGC members from P. betulaefolia, a stress-tolerant wild pear species widely used as rootstock for pear cultivation. Phylogenetic analysis classified these PbCNGC proteins into five established subgroups (Figure 1), consistent with the classification reported across various plant lineages [23,30,32,36,37,38,39,40,41,42,43].
Considerable variation in CNGC copy number exists among plant genomes. Genomic comparison between wild P. betulaefolia and domesticated P. bretschneideri revealed five PbCNGC paralogs unique to the wild P. betulaefolia, distributed in subgroups I, II, III, and IV-A, respectively. Such copy-number divergence may arise from long-term evolutionary adaptation in wild P. betulaefolia, coupled with gene loss events occurring during the domestication of cultivated P. bretschneideri. It is reasonable to speculate that these retained extra paralogs could contribute to the superior stress-adaptive capacity of wild P. betulaefolia rootstock, though their individual biological functions remain to be further verified.
Conserved-motif distribution and multiple-sequence alignment further supported the phylogenetic clustering of PbCNGCs. Motifs 1, 3, 7, 12, and 16 were universally preserved across all identified CNGC proteins, indicating their fundamental importance for CNGC biochemical activity [27,29,41]. In addition, the canonical conserved amino-acid signature [LI]-X(2)-[GS]-X-[FYIVS]-X-G-X(0,1)-[DE]-LL-X(8,25)-[SA]-X(9)-[VLIT]-E-X-F-X-[IL], where X stands for any amino acid residue and the numerals in parentheses represent the quantity of intervening amino acids, within the CNBD domain was detected in PbCNGC proteins. The phosphate-binding cassette and hinge region inside the CNBD are indispensable for CNGC activation. The preservation of these canonical structural features implies that PbCNGC4 and PbCNGC14, the two salt-responsive members characterized in this study, likely follow the general activation mode of plant CNGCs. Meanwhile, variations in non-core motifs among subgroups may underlie functional divergence, such as differences in ion-selectivity or stress-response specificity among different PbCNGC paralogs [23,32,39,40,41,42,43].

3.2. PbCNGCs Mediate the Salt Stress Response in P. betulaefolia

Accumulating evidence confirms that cyclic nucleotide-gated ion channels (CNGCs) exert vital functions in plant responses to biotic and abiotic stresses [4,9]. In particular, CNGCs are generally involved in plant adaptation to salt stress, and their functions are relatively conserved across plant species [27,33]. Our analyses revealed that PbCNGCs possess the conserved structural features typical of plant CNGC families and undergo transcriptional changes under NaCl treatment (Figure 5 and Figure 6). Moreover, CNGCs from diverse plant species usually confer salt tolerance by maintaining Ca2+ homeostasis via hormone signaling pathways [38]. Here, sequence analysis showed that the promoters of PbCNGC genes contain abundant cis-regulatory elements associated with stress and hormone responses (Figure 3). Even so, whether hormone signals dominate the transcriptional regulation of PbCNGCs remains to be verified by further experiments.
Quantitative expression analysis indicated that six PbCNGC members exhibited a typical expression profile of initial upregulation followed by downregulation under salt stress, with transcript abundance peaking at different time points after NaCl treatment. For both genotypes, the expression peaks of these genes appeared earlier in roots than in stems and leaves (Figure 7). Specifically, PbCNGC3, PbCNGC4, and PbCNGC14 displayed differential expression across roots, stems, and leaves, respectively. PbCNGC10 showed leaf-preferential expression, whereas PbCNGC19 and PbCNGC20;1 were mainly differentially expressed in roots. Collectively, the divergent tissue-specific expression patterns and dynamic salt-responsive transcriptional characteristics of PbCNGCs drive functional specialization of the CNGC family in P. betulaefolia, thereby improving the salt adaptability of this rootstock.
Plant CNGCs act as core cation channels mediating K+ and Na+ transport. The high conservation of CNGC amino acid sequences across species implies conserved ion transport functions [22,23,26,27]. For example, Arabidopsis AtCNGC1 and AtCNGC4 exhibit equal permeability to K+ and Na+ [24,44]. In the present study, yeast complementation assays verified that PbCNGC4 and PbCNGC14 could effectively rescue impaired ion uptake and transport in yeast mutants and markedly facilitate transmembrane transport of Na+ and K+ (Figure 10). The transcription of these two PbCNGC genes shows spatiotemporal divergence, and such expression variations modulate the cation transport activity of PbCNGC4 and PbCNGC14 proteins. These findings uncover functional diversification within the PbCNGC family and provide a basis for dissecting the potential molecular mechanism governing salt tolerance in P. betulaefolia.

3.3. PbCNGC4 and PbCNGC14 Regulate Salt Tolerance via DNA Methylation

DNA methylation, particularly promoter region methylation, acts as a core epigenetic mechanism that regulates gene transcription and mediates plant salt adaptation under abiotic stress [11]. Previous studies have reported that salt stress-induced DNA demethylation can activate the expression of ion transport and stress-responsive genes, thereby maintaining cellular ion homeostasis and improving plant salt tolerance [5]. In this study, significant methylation differences in PbCNGC4 and PbCNGC14 were detected in the roots of two P. betulaefolia genotypes. Under salt stress, the salt-tolerant genotype exhibited a substantially greater reduction in methylation levels of these two genes in roots than the ordinary genotype, which led to a much higher increase in their transcriptional abundance in the salt-tolerant genotype and further resulted in differences in root Na+/K+ contents between the two genotypes [10]. These results indicate that, beyond spatiotemporal and tissue-specific transcriptional variations, epigenetic modifications of PbCNGCs play a pivotal role in shaping the salt-responsive expression patterns in ordinary (O) and salt-tolerant (T) P. betulaefolia genotypes. Exogenous bioactive compounds can improve crop salt tolerance [12,13,14,15]. For example, 5-azaC treatment reduces DNA methylation and activates stress-responsive genes in kenaf to boost salt tolerance [45]. Comparable responses occur in P. betulaefolia, where 5-azaC triggers DNA demethylation and K+ enrichment [10]. Accordingly, we hypothesize that the salt-tolerant genotype (T) keeps a “pre-activated” hypomethylated state at the PbCNGC4 and PbCNGC14 loci, enabling fast transcriptional reprogramming under salt stress. In contrast, the ordinary genotype (O) possesses a hyper-methylated epigenetic barrier that represses ion-transporter production, causing Na+ over-accumulation, K+ efflux, and salt sensitivity [10]. These genotype-dependent methylation variations explain transcriptional divergence and efficient ion homeostasis in salt-tolerant plants [10]. Thus, targeted modification of CNGC methylation may serve as a promising strategy for breeding salt-tolerant crops.
In cotton, demethylation of GhCNGC4 mediated by the demethylase GhALKBH10B participates in drought responses by altering m6A methylation levels and modulating mRNA stability, confirming that methylation modification serves as a vital upstream regulatory mechanism for CNGC stress responses [34]. Most existing studies have centered on methylation-dependent regulation of CNGC genes in response to drought stress, whereas the epigenetic mechanisms governing CNGC-associated salt-stress responses remain poorly characterized. Combined with our transcriptomic data, the differential methylation levels of PbCNGC4 and PbCNGC14 between the two genotypes may largely account for their divergent spatiotemporal expression patterns under salt stress, ultimately driving the functional differentiation of PbCNGC family members.
CNGC-mediated Ca2+ influx acts as an upstream trigger of the salt-stress signaling cascade, promoting Na+ efflux and maintaining Na+/K+ homeostasis in plants. The resultant Ca2+ signal can be perceived by Ca2+-dependent protein kinase (CDPK), which functions as a Ca2+-binding Ca2+ sensor to execute downstream calcium signal transduction [9]. For instance, the synergistic regulation of GsCNGC20-d and GsCDPK29 contributes to salt-stress response and adaptation in the salt-tolerant wild soybean Glycine soja BB52 [27]. Our previous studies have verified that CDPK family genes, as core downstream components of Ca2+ signal transduction, can decode specific Ca2+ signatures and activate downstream stress-responsive pathways, playing an indispensable role in the salt tolerance regulation of P. betulaefolia [10]. In this study, yeast complementation assays further functionally verified the ion transport capacity of PbCNGC4 and PbCNGC14 proteins and clarified their specific functions in Na+/K+ transport. However, whether methylation modification affects the ion transport functions of PbCNGC4 and PbCNGC14 by regulating gene expression remains to be experimentally validated. Collectively, we speculate that methylation-mediated transcriptional regulation of PbCNGC4 and PbCNGC14 modulates the intensity and temporal rhythm of intracellular Ca2+ influx under salt stress, thereby precisely regulating the expression levels and functional activity of downstream PbCDPK genes. However, the specific interaction mode between CNGCs and downstream CDPKs remains unclear and requires further experimental verification. The epigenetic–transcriptional synergistic regulation model of CNGCs identified in this study accounts for the differential salt stress responses among different P. betulaefolia genotypes, offering a novel epigenetic perspective for further dissecting the functional differentiation mechanism of plant CNGC families and improving the regulatory network of salt stress responses.

4. Materials and Methods

4.1. Plant Materials and Treatments

The salt-tolerant (T, 6‰ NaCl-tolerant) and ordinary (O, 3‰ NaCl-tolerant) genotypes of Pyrus betulaefolia were maintained in the pear germplasm nursery of Jiangsu Academy of Agricultural Sciences [10]. Mature seeds were collected in the autumn of 2024. After stratification and germination treatment, the seeds were sown in a mixed substrate consisting of nutrient soil and vermiculite at a ratio of 3:1. All seedlings were cultivated in a greenhouse at 25 °C, with 70% relative humidity and a 16-h light photoperiod. Seedlings at 90 days after germination were carefully rinsed to remove root substrate and prepared for subsequent different treatments. Forty-eight seedlings of each genotype were transferred to Hoagland’s nutrient solution supplemented with 200 mM NaCl for quantitative real-time polymerase chain reaction (qPCR) analysis. The roots, stems, and leaves were harvested after being treated with 200 mM NaCl for 0, 1, 2, 4, 6, 8, 12, and 24 h (with three biological replicates) to detect target gene expression levels.
Twenty-four seedlings of each genotype were transferred to Hoagland solution for the methylation experiment. The DNA methylation inhibitor 5-azacytidine (5-azaC, Solarbio, Beijing, China) and accelerator methyl trifluoromethanesulfonate (MTFMS, TCI, Tokyo, Japan) were applied to regulate DNA methylation levels. 5-azaC + NaCl and MTFMS + NaCl groups were supplied with 100 μmol∙L−1 5-azaC or 100 μmol∙L−1 MTFMS in Hoagland solution for 12 h. Meanwhile, the control and NaCl groups grew in Hoagland solution for 12 h. Then, the control group was provided with fresh Hoagland solution, and the other three groups were transferred to Hoagland solution supplemented with 200 mmol∙L−1 NaCl for 4 h. Finally, roots from four groups were collected for qPCR and McrBC-qPCR (McrBC digestion coupled quantitative real-time PCR) analysis, respectively.

4.2. Identification and Analysis of CNGC Genes

Similar to previous research [46], protein sequences of Arabidopsis thaliana CNGCs were used as queries for BLASTP (v2.14.0) searches (E-value < 1 × 10⁻⁵) against the P. betulaefolia genome deposited in the NCBI database to identify CNGC homologs (accessed on 8 March 2025). Meanwhile, the Hidden Markov Model (HMM) profiles of the ion transport (PF00520) and CNBD (PF00027), obtained from the Pfam database (https://www.ebi.ac.uk/interpro/, accessed on 10 March 2025), were used to search for CNGC proteins [29]. The results from both methods were merged, and redundant sequences were removed. Then, these protein sequences were submitted to the Conserved Domains Database (https://www.ncbi.nlm.nih.gov/Structure/cdd/cdd.shtml, accessed on 10 March 2025), SMART database (http://smart.embl-heidelberg.de/, accessed on 10 March 2025), and Pfam database (https://pfam.xfam.org/, accessed on 10 March 2025) for domain analysis [30]. Finally, the physicochemical properties, including isoelectric points (pI), amino acid compositions, and molecular weight, were calculated using the “Protein Parameter Calc” function in the TBtools-II software (v2.376) [47]. Subcellular localization of CNGC proteins was predicted using the WoLF PSORT online server (https://wolfpsort.hgc.jp/, accessed on 11 March 2025) [48].
These genes were aligned with 20 AtCNGC [36] and 21 PbrCNGC [37] sequences using the MUSCLE program in the TBtools-II software (v2.376) [47]. Then, a neighbor-joining phylogenetic tree was constructed with 1000 bootstrap replicates, and its visualization optimization was conducted on EvolView (https://www.evolgenius.info/evolview/, accessed on 11 March 2025). In addition, other feature analyses and visualizations of the CNGC gene family—including motif characterization, gene structure analysis, promoter element analysis, chromosomal distribution mapping, and FPKM heatmap—were also performed using the TBtools-II software (v2.376) [47]. The DESeq2 software package (v1.46.0) in R (v4.4.1) was employed to identify differentially expressed genes (DEGs) in the transcriptomes of two genotypes before and after salt stress (NCBI, project number PRJNA812627), with the screening criteria of fold change ≥2 and false discovery rate (FDR) < 0.05 [10]. Subsequently, specific CNGC members among these DEGs were screened based on their gene IDs (Table 1), and a Venn diagram was generated using the EVenn online tool (https://www.bic.ac.cn/test/venn/#/, accessed on 12 March 2025).

4.3. Methylation Analysis and Differentially Methylated CNGC Genes

Genome-wide methylation data of P. betulaefolia was downloaded from NCBI (project number PRJNA812739) to analyze the methylation status of this species, and methylation analysis was carried out as described previously [10]. Then, Bedtools (v2.21.0) [49] in R package (v4.4.1) was utilized to annotate the genetic characteristics of all differentially methylated regions (DMRs). Differentially methylated genes (DMGs) were defined as the set of genes that overlap between DMRs and DEGs identified from the transcriptome data. Ultimately, the differentially methylated CNGC family members were identified based on their gene IDs (Table 1).

4.4. qPCR and McrBC-qPCR

RNA extraction and cDNA synthesis were performed as previously described [10]. In the present study, the Primer3 online tool (http://primer3.ut.ee, accessed on 15 March 2025) was employed to design qPCR primers specific to six CNGC genes from P. betulaefolia (Table 3). After validating primer specificity, the qPCR reaction mixture was prepared in strict compliance with the protocol of Genious 2 × SYBR Green Fast qPCR Mix (ABclonal, Wuhan, China), with the thermal cycling program set as follows: an initial denaturation step at 95 °C for 30 s, followed by 40 cycles of denaturation at 95 °C for 5 s and annealing/extension at 60 °C for 30 s. Here, the internal control gene was PbEF-1α (GWHTAAYT007379) and the expression levels of the CNGC genes relative to PbEF-1α were determined via the 2−ΔΔCT algorithm [10]. Genomic DNA (gDNA) isolation and enzymatic digestion with the restriction endonuclease McrBC (New England Biolabs, Beverly, USA) were performed as previously described [10]. The design and specificity verification for McrBC-qPCR primers were consistent with the above qPCR assays (Table 3). Notably, the qPCR signal intensity is negatively correlated with the methylation level of the target region in McrBC-qPCR results [50].

4.5. Yeast Complementation Experiment

To assess the roles of PbCNGC4 and PbCNGC14 in Na+ or K+ uptake, Saccharomyces cerevisiae genotypes B31 [22] and CY162 [35] were used for yeast complementation assays, respectively. The full-length cDNAs of PbCNGC4 or PbCNGC14 were cloned into the yeast expression vector pYES2 (Invitrogen, Carlsbad, CA, USA) downstream of the GAL1 promoter between the KpnI and XbaI restriction sites, and transformed into B31 and CY162 via MicroPulser electroporation (Bio-Rad, Hercules, CA, USA), respectively. Transformants of B31 and CY162 were selected on an SD basal medium supplemented with uracil dropout supplement (-Ura DO, Clontech, San Francisco, CA, USA).
Following 16 h of pre-cultivation of individual transformants in liquid SD-Ura medium at 30 °C, 1 mL aliquots of the yeast suspension were centrifuged at 5000× g for 1 min, and the supernatants were discarded. Yeast cells were rinsed three times with Na+-free AP medium and subsequently adjusted to an optical density at 600 nm (OD600) of 1.0. For the Na+ influx assay in B31 transformants, 0, 50, or 100 mM NaCl was supplemented into the AP medium. All yeast genotypes were subjected to 1:10 serial dilution, after which 10 μL of each diluted suspension was spotted onto corresponding agar plates. The plates were then incubated at 30 °C for 72 h to allow cell growth. For growth rate evaluation, the washed cells were resuspended in liquid AP medium with 0, 50, or 100 mM NaCl to an OD600 of 0.01 and incubated at 30 °C for 48 h. Then, aliquots were collected for OD600 determination. For K+ influx assay in CY162 transformants, all procedures were performed as described above, except that potassium-free modified YNB medium supplemented with 2, 50, or 100 mM KCl was used for yeast cultivation.

4.6. Data Analysis

All experiments were performed with three independent biological replicates, and each biological replicate included three technical replicates. Statistical analyses were conducted using Origin 2025 software (https://www.originlab.com/). One-way analysis of variance (ANOVA) combined with Tukey’s honestly significant difference test was used for pairwise comparisons of PbCNGC gene expression and yeast complementation data, and different lowercase letters indicate significant differences at p < 0.05. Two-sample t-test combined with hypothesis testing was used for comparisons of methylation levels and gene expression levels between the two P. betulaefolia genotypes in methylation experiments, and asterisks (*) indicate significant differences at p < 0.05. All data were expressed as mean ± standard error (SE) with three biological replicates.

5. Conclusions

P. betulaefolia harbors 26 conserved CNGC family members, which respond to salt stress via distinct spatiotemporal expression patterns. PbCNGC4 and PbCNGC14 could restore Na+ and K+ uptake capacity in mutant yeast, and their transcriptional levels are modulated by demethylation modification under salt stress. In salt-tolerant genotypes, salt stress induces a substantial reduction in the methylation levels of PbCNGC4 and PbCNGC14, which significantly upregulates their gene expression and further affects the absorption and transport of sodium and potassium ions in roots.

Author Contributions

Conceptualization, H.L.; methodology, H.L. and X.L.; software, J.K.; validation, H.L., C.L., and Y.L.; formal analysis, H.L., J.K., and Y.L.; investigation, C.L. and Y.L.; resources, Y.L.; data curation, J.K.; writing—original draft preparation, H.L.; writing—review and editing, C.L., J.K., and X.L.; visualization, H.L.; supervision, Y.L.; project administration, H.L.; funding acquisition, J.K. and X.L. All authors have read and agreed to the published version of the manuscript.

Funding

This research was funded by the funds of Zhongshan Biological Breeding Laboratory, China (Grant No. ZSBBL-KY2024-03) (J.K.), and the seed industry promotion project of Jiangsu, China (Grant No. JBGS(2021)084) (X.L.).

Institutional Review Board Statement

Not applicable.

Informed Consent Statement

Not applicable.

Data Availability Statement

Data will be made available on request.

Conflicts of Interest

The authors declare no conflicts of interest.

References

  1. Saradadevi, G.P.; Das, D.; Mangrauthia, S.K.; Mohapatra, S.; Chikkaputtaiah, C.; Roorkiwal, M.; Solanki, M.; Sundaram, R.M.; Chirravuri, N.N.; Sakhare, A.S.; et al. Genetic, epigenetic, genomic and microbial approaches to enhance salt tolerance of plants: A comprehensive review. Biology 2021, 10, 1255. [Google Scholar] [CrossRef] [Scilit] [PubMed]
  2. Chen, X.S.; Wang, N.; Zhang, Z.Y.; Feng, S.Q.; Chen, X.L.; Mao, Z.Q. Progress on the resource and breeding of kernel fruits I: Progress on the germplasm resources, quality development and genetics and breeding of pear in China. J. Plant Genet. Resour. 2019, 20, 791–800. (In Chinese) [Google Scholar]
  3. Dong, H.Z.; Wang, C.M.; Xing, C.H.; Yang, T.Y.; Yan, J.X.; Gao, J.Z.; Li, D.L.; Wang, R.; Blumwald, E.; Zhang, S.L.; et al. Overexpression of PbrNHX2 gene, a Na+/H+ antiporter gene isolated from Pyrus betulaefolia, confers enhanced tolerance to salt stress via modulating ROS levels. Plant Sci. 2019, 285, 14–25. [Google Scholar] [CrossRef] [Scilit] [PubMed]
  4. Hua, B.G.; Mercier, R.W.; Leng, Q.; Berkowitz, G.A. Plants do it differently. A new basis for potassium/sodium selectivity in the pore of an ion channel. Plant Physiol. 2003, 132, 1353–1361. [Google Scholar] [CrossRef] [Scilit] [PubMed]
  5. Ma, L.; Li, J.R.; Li, J.F.; Huo, Y.D.; Yang, Y.Q.; Jiang, C.F.; Guo, Y. Plant salt-tolerance mechanisms: Classic signaling pathways, emerging frontiers, and future perspectives. Mol. Plant 2026, 19, 538–570. [Google Scholar] [CrossRef] [Scilit] [PubMed]
  6. Wu, Q.S.; Zou, Y.N. Adaptive responses of birch-leaved pear (Pyrus betulaefolia) seedlings to salinity stress. Not. Bot. Horti Agrobot. Cluj-Napoca 2009, 37, 133–138. [Google Scholar]
  7. Li, Y.; Peng, L.R.; Xie, C.Y.; Shi, X.Q.; Dong, C.X.; Shen, Q.R.; Xu, Y.C. Genome-wide identification, characterization, and expression analyses of the HAK/KUP/KT potassium transporter gene family reveals their involvement in K+ deficient and abiotic stress responses in pear rootstock seedlings. Plant Growth Regul. 2018, 85, 187–198. [Google Scholar] [CrossRef] [Scilit]
  8. Li, H.; Liu, W.; Yang, Q.S.; Lin, J.; Chang, Y.H. Isolation and comparative analysis of two Na+/H+ antiporter NHX2 genes from Pyrus betulaefolia. Plant Mol. Biol. Report. 2018, 36, 439–450. [Google Scholar] [CrossRef] [Scilit]
  9. Duszyn, M.; Świeżawska, B.; Szmidt-Jaworska, A.; Jaworski, K. Cyclic nucleotide gated channels (CNGCs) in plant signalling—Current knowledge and perspectives. J. Plant Physiol. 2019, 241, 153035. [Google Scholar] [CrossRef] [Scilit] [PubMed]
  10. Li, H.; Zhang, Y.F.; Zhou, X.Y.; Lin, J.; Liu, C.X.; Li, X.G.; Chang, Y.H. Single-base resolution methylome of different ecotype from Pyrus betulaefolia reveals epigenomic changes in response to salt stress. Sci. Hortic. 2022, 306, 111437. [Google Scholar] [CrossRef] [Scilit]
  11. Zhang, H.M.; Lang, Z.B.; Zhu, J.K. Dynamics and function of DNA methylation in plants. Nat. Rev. Mol. Cell Biol. 2018, 19, 489–506. [Google Scholar] [CrossRef] [Scilit] [PubMed]
  12. Hewedy, O.A.; Elsheery, N.I.; Karkour, A.M.; Elhamouly, N.; Arafa, R.A.; Mahmoud, G.A.E.; Dawood, M.F.A.; Hussein, W.E.; Mansour, A.; Amin, D.H.; et al. Jasmonic acid regulates plant development and orchestrates stress response during tough times. Environ. Exp. Bot. 2023, 208, 105260. [Google Scholar] [CrossRef] [Scilit]
  13. Elhefnawy, S.M.; Elsheery, N.I. Use of nanoparticles in improving photosynthesis in crop plants under stress. In Photosynthesis; Elsevier Inc.: Amsterdam, The Netherlands, 2023; Chapter 7; pp. 105–135. [Google Scholar]
  14. Elsheery, N.I.; Helaly, M.N.; El-Hoseiny, H.M.; Alam-Eldein, S.M. Zinc oxide and silicone nanoparticles to improve the resistance mechanism and annual productivity of salt-stressed mango trees. Agronomy 2020, 10, 558. [Google Scholar] [CrossRef] [Scilit]
  15. Elsheery, N.I.; Helaly, M.N.; Omar, S.A.; John, S.V.S.; Rastogi, A. Physiological and molecular mechanisms of salinity tolerance in grafted cucumber. S. Afr. J. Bot. 2020, 130, 90–102. [Google Scholar] [CrossRef] [Scilit]
  16. Li, J.M.; Zhang, M.Y.; Li, X.L.; Khan, A.; Kumar, S.; Allan, A.C.; Wang, K.L.; Espley, R.V.; Wang, C.H.; Wang, R.Z.; et al. Pear genetics: Recent advances, new prospects, and a roadmap for the future. Hortic. Res. 2022, 9, uhab040. [Google Scholar] [CrossRef] [Scilit] [PubMed]
  17. Zhang, Y.; Cao, Y.F.; Huo, H.H.; Xu, J.Y.; Tian, L.M.; Dong, X.G.; Qi, D.; Liu, C. An assessment of the genetic diversity of pear (Pyrus L.) germplasm resources based on the fruit phenotypic traits. J. Integr. Agric. 2022, 21, 2275–2290. [Google Scholar] [CrossRef] [Scilit]
  18. Li, H.; Wang, S.Y.; Zhang, Y.; Xu, C.R.; Yu, Y.F.; Xiang, L.; Huang, W.T.; Tian, B.H.; Li, T.Z.; Wang, S.N. Long-distance transport of the pear HMGR1 mRNA via the phloem is associated with enhanced salt tolerance. Plant Sci. 2023, 332, 111705. [Google Scholar] [CrossRef] [Scilit] [PubMed]
  19. Huo, H.L.; Wang, C.; Yang, X.; Cao, Y.F.; Tian, L.M.; Dong, X.G.; Zhang, Y.; Qi, D.; Xu, J.Y.; Liu, C. Physiological response and saline-alkali tolerance evaluation of Pyrus betulifolia resources under saline-alkali stress. J. Plant Genet. Resour. 2022, 23, 480–492. (In Chinese) [Google Scholar]
  20. Lin, L.K.; Yuan, K.L.; Huang, Y.D.; Dong, H.Z.; Qiao, Q.H.; Xing, C.H.; Huang, X.S.; Zhang, S.L. A WRKY transcription factor PbWRKY40 from Pyrus betulaefolia functions positively in salt tolerance and modulating organic acid accumulation by regulating PbVHA-B1 expression. Environ. Exp. Bot. 2022, 196, 104782. [Google Scholar] [CrossRef] [Scilit]
  21. Jin, Y.M.; Yang, H.; Shen, C.W.; Xu, Y.C.; Dong, C.X. Cloning and functional analysis of PbHAK17, a gene responsive to low potassium and salt stress in Pyrus betulaefolia. J. Plant Nutr. Fertil. 2023, 30, 2089–2100. (In Chinese) [Google Scholar]
  22. Jin, Y.K.; Jing, W.; Zhang, Q.; Zhang, W.H. Cyclic nucleotide gated channel 10 negatively regulates salt tolerance by mediating Na+ transport in Arabidopsis. J. Plant Res. 2015, 128, 211–220. [Google Scholar] [CrossRef] [Scilit] [PubMed]
  23. Guo, J.; Islam, M.A.; Lin, H.C.; Ji, C.G.; Duan, Y.H.; Liu, P.; Zeng, Q.D.; Day, B.; Kang, Z.S.; Guo, J. Genome-wide identification of cyclic nucleotide-gated ion channel gene family in wheat and functional analyses of TaCNGC14 and TaCNGC16. Front. Plant Sci. 2018, 9, 18. [Google Scholar] [CrossRef] [Scilit] [PubMed]
  24. Balagué, C.; Lin, B.; Alcon, C.; Flottes, G.; Malmström, S.; Köhler, C.; Neuhaus, G.; Pelletier, G.; Gaymard, F.; Roby, D. HLM1, an essential signaling component in the hypersensitive response, is a member of the cyclic nucleotide–gated channel ion channel family. Plant Cell 2003, 15, 365–379. [Google Scholar] [CrossRef] [Scilit] [PubMed]
  25. Kugler, A.; Köhler, B.; Palme, K.; Wolff, P. Salt-dependent regulation of a CNG channel subfamily in Arabidopsis. BMC Plant Biol. 2009, 9, 138. [Google Scholar] [CrossRef] [Scilit] [PubMed]
  26. Chen, C.N.; Wu, Q.J.; Yue, J.; Wang, X.; Wang, C.J.; Wei, R.J.; Li, R.; Jin, G.; Chen, T.; Chen, P. A cyclic nucleotide-gated channel gene HcCNGC21 positively regulates salt and drought stress responses in kenaf (Hibiscus cannabinus L.). Plant Sci. 2024, 345, 112111. [Google Scholar] [CrossRef] [Scilit] [PubMed]
  27. Pi, B.Y.; Liu, X.; Huang, Q.Y.; Zhang, T.L.; Yu, B.J. Comparative transcriptomic analysis of Glycine soja and G. max and functional identification of GsCNGC20-d interacted with GsCDPK29 under salt stress. Environ. Exp. Bot. 2023, 206, 105185. [Google Scholar] [CrossRef] [Scilit]
  28. Gobert, A.; Park, G.; Amtmann, A.; Sanders, D.; Maathuis, F.J. Arabidopsis thaliana cyclic nucleotide gated channel 3 forms a non-selective ion transporter involved in germination and cation transport. J. Exp. Bot. 2006, 57, 791–800. [Google Scholar] [CrossRef] [Scilit] [PubMed]
  29. Li, S.T.; Kong, W.Y.; Chen, J.B.; Hao, D.L.; Guo, H.L. Genome-wide identification and expression analysis of the cyclic nucleotide-gated channel gene family in Zoysia Japonica under salt stress. Int. J. Mol. Sci. 2024, 25, 10114. [Google Scholar] [CrossRef] [Scilit] [PubMed]
  30. Lu, Z.Y.; Yin, G.; Chai, M.; Sun, L.; Wei, H.L.; Chen, J.; Yang, Y.F.; Fu, X.K.; Li, S.Y. Systematic analysis of CNGCs in cotton and the positive role of GhCNGC32 and GhCNGC35 in salt tolerance. BMC Genom. 2022, 23, 560. [Google Scholar] [CrossRef] [Scilit] [PubMed]
  31. Qiu, L.N.; Mei, C.; Qi, Z.P.; Yang, J.X.; Li, N.; Li, M.; Sun, Y.X.; Yang, J.; Ma, F.W.; Mao, K. Genome-wide analysis of apple CNGC family allows the identification of MdCNGC15A negatively regulating apple salt tolerance. Plant Stress 2024, 14, 100606. [Google Scholar] [CrossRef] [Scilit]
  32. Saand, M.A.; Xu, Y.P.; Munyampundu, J.P.; Li, W.; Zhang, X.R.; Cai, X.Z. Phylogeny and evolution of plant cyclic nucleotide-gated ion channel (CNGC) gene family and functional analyses of tomato CNGCs. DNA Res. 2015, 22, 471–483. [Google Scholar] [CrossRef] [Scilit] [PubMed]
  33. Zhao, J.H.; Peng, S.; Cui, H.T.; Li, P.Y.; Li, T.M.; Liu, L.L.; Zhang, H.F.; Tian, Z.Y.; Shang, H.H.; Xu, R.Q. Dynamic expression, differential regulation and functional diversity of the CNGC family genes in cotton. Int. J. Mol. Sci. 2022, 23, 2041. [Google Scholar] [CrossRef] [Scilit] [PubMed]
  34. Li, B.Q.; Zhang, M.M.; Sun, W.N.; Yue, D.D.; Ma, Y.Z.; Zhang, B.Y.; Duan, L.F.; Wang, M.J.; Lindsey, K.; Nie, X.H.; et al. N6-methyladenosine RNA modification regulates cotton drought response in a Ca2+ and ABA-dependent manner. Plant Biotechnol. J. 2023, 21, 1270–1285. [Google Scholar] [CrossRef] [Scilit] [PubMed]
  35. Li, X.L.; Borsics, T.; Harrington, H.M.; Christopher, D.A. Arabidopsis AtCNGC10 rescues potassium channel mutants of E. coli, yeast and Arabidopsis and is regulated by calcium/calmodulin and cyclic GMP in E. coli. Funct. Plant Biol. 2005, 32, 643–653. [Google Scholar] [CrossRef] [Scilit] [PubMed]
  36. Mäser, P.; Thomine, S.; Schroeder, J.I.; Ward, J.M.; Hirschi, K.; Sze, H.; Talke, I.N.; Amtmann, A.; Maathuis, F.J.M.; Sanders, D.; et al. Phylogenetic relationships within cation transporter families of Arabidopsis. Plant Physiol. 2001, 126, 1646–1667. [Google Scholar] [CrossRef] [Scilit] [PubMed]
  37. Chen, J.Q.; Yin, H.; Gu, J.P.; Li, L.T.; Liu, Z.; Jiang, X.T.; Zhou, H.S.; Wei, S.W.; Zhang, S.L.; Wu, J.Y. Genomic characterization, phylogenetic comparison and differential expression of the cyclic nucleotide-gated channels gene family in pear (Pyrus bretchneideri Rehd.). Genomics 2015, 105, 39–52. [Google Scholar] [CrossRef] [Scilit] [PubMed]
  38. Chen, L.; Wang, W.W.; He, H.L.; Yang, P.; Sun, X.T.; Zhang, Z.S. Genome-wide identification, characterization and experimental expression analysis of CNGC gene family in Gossypium. Int. J. Mol. Sci. 2023, 24, 4617. [Google Scholar] [CrossRef] [Scilit] [PubMed]
  39. Hao, L.; Qiao, X. Genome-wide identification and analysis of the CNGC gene family in maize. Peer J. 2018, 6, e5816. [Google Scholar] [CrossRef] [Scilit] [PubMed]
  40. Li, Q.; Yang, S.; Ren, J.; Ye, X.; Jiang, X.; Liu, Z. Genome-wide identification and functional analysis of the cyclic nucleotide-gated channel gene family in Chinese cabbage. 3 Biotech 2019, 9, 114. [Google Scholar] [CrossRef] [Scilit] [PubMed]
  41. Liu, W.; Kang, Y.; Ren, R.; Liu, Y.; Li, W.Q.; Xie, P.; Liao, L.; Wang, W.P.; Qian, L.W.; Guan, M.; et al. Identification and expression analysis of BnaCNGC family gene in the response to phytohormones, abiotic and biotic stresses in Brassica napus. J. Plant Interact. 2021, 16, 575–586. [Google Scholar] [CrossRef] [Scilit]
  42. Nawaz, Z.; Kakar, K.U.; Saand, M.A.; Shu, Q.Y. Cyclic nucleotide-gated ion channel gene family in rice, identification, characterization and experimental analysis of expression response to plant hormones, biotic and abiotic stresses. BMC Genom. 2014, 15, 853. [Google Scholar] [CrossRef] [Scilit] [PubMed]
  43. Nawaz, Z.; Kakar, K.U.; Ullah, R.; Yu, S.; Zhang, J.; Shu, Q.Y.; Ren, X.L. Genome-wide identification, evolution and expression analysis of cyclic nucleotide-gated channels in tobacco (Nicotiana tabacum L.). Genomics 2019, 111, 142–158. [Google Scholar] [CrossRef] [Scilit] [PubMed]
  44. Jarratt-Barnham, E.; Wang, L.M.; Ning, Y.Z.; Davies, J.M. The complex story of plant cyclic nucleotide-gated channels. Int. J. Mol. Sci. 2021, 22, 874. [Google Scholar] [CrossRef] [Scilit] [PubMed]
  45. Li, Z.Q.; Luo, D.J.; Cao, S.; Mubeen, S.; Rehman, M.; Wang, C.J.; Jin, G.; Li, R.; Chen, T.; Chen, P. DNA methylome provide new insights into the physiological-molecular regulation of salt stress in kenaf using 5-azaC pretreatment. J. Soil Sci. Plant Nutr. 2024, 24, 3889–3907. [Google Scholar] [CrossRef] [Scilit]
  46. Zhang, R.Y.; Liang, K.X.; Qiu, Z.M.; Shi, D.X.; He, S.; Zhu, G.Q.; Xu, B.J.; Hussain, I.; Huang, J.B.; Gulzar, R.M.A. CBL gene family in Brassica napus: Genome-wide and expression profiling in response to phytohormones under diverse stress conditions. Agriculture 2026, 16, 1088. [Google Scholar] [CrossRef] [Scilit]
  47. Chen, C.J.; Wu, Y.; Li, J.W.; Wang, X.; Zeng, Z.H.; Xu, J.; Liu, Y.L.; Feng, J.T.; Chen, H.; He, Y.H.; et al. TBtools-II: A “one for all, all for one” bioinformatics platform for biological big-data mining. Mol. Plant 2023, 16, 1733–1742. [Google Scholar] [CrossRef] [Scilit] [PubMed]
  48. Horton, P.; Park, K.J.; Obayashi, T.; Fujita, N.; Harada, H.; Adams-Collier, C.J.; Nakai, K. WoLF PSORT: Protein localization predictor. Nucleic Acids Res. 2007, 35, W585–W587. [Google Scholar] [CrossRef] [Scilit] [PubMed]
  49. Quinlan, A.R.; Hall, I.M. BEDTools: A flexible suite of utilities for comparing genomic features. Bioinformatics 2010, 26, 841–842. [Google Scholar] [CrossRef] [Scilit] [PubMed]
  50. Mao, H.D.; Wang, H.W.; Liu, S.X.; Li, Z.G.; Yang, X.H.; Yan, J.B.; Li, J.S.; Tran, L.S.P.; Qin, F. A transposable element in a NAC gene is associated with drought tolerance in maize seedlings. Nat. Commun. 2015, 6, 8326. [Google Scholar] [CrossRef] [Scilit] [PubMed]
Figure 1. Phylogenetic relationship among cyclic nucleotide-gated channels (CNGCs) from Pyrus betulaefolia, Pyrus bretschneideri, and Arabidopsis. The preliminary nomenclature of these P. betulaefolia CNGCs was assigned to be consistent with that of P. bretschneideri CNGCs. Neighbor-joining phylogenetic tree shows the relationship among 26 P. betulaefolia, 21 P. bretschneideri, and 20 Arabidopsis CNGC proteins. The resulting five group names are labeled as I, II, III, IV-A, IV-B. Tree visualization and optimization were implemented on EvolView (https://www.evolgenius.info/evolview/, accessed on 11 March 2025), and the scale bar represents a genetic distance of 1.0.
Ijms 27 08252 g001
Figure 2. The phylogenetic tree, motifs, and gene structure analysis of PbCNGCs. (a) Phylogenetic tree of PbCNGCs; (b) motifs of PbCNGCs; (c) gene structures of PbCNGCs.
Ijms 27 08252 g002
Figure 3. The phylogenetic tree of PbCNGCs from Pyrus betulaefolia was constructed using the neighbor-joining (NJ) method with 1000 replicates of bootstrap validation. The types, numbers, and locations of cis-elements in promoter regions 2 kb upstream of PbCNGC genes were checked by using the PlantCARE database (https://bioinformatics.psb.ugent.be/webtools/plantcare/html/, accessed on 12 March 2025).
Ijms 27 08252 g003
Figure 4. Distributions of PbCNGC genes on the Pyrus betulaefolia chromosomes. The scale is shown on the left.
Ijms 27 08252 g004
Figure 5. The expression patterns of PbCNGCs in two ecotypes of Pyrus betulaefolia under salt stress. OR, OS, and OL represent the roots, stems, and leaves of the ordinary genotype under normal conditions, respectively. ONR, ONS, and ONL represent the roots, stems, and leaves of the ordinary genotype under salt stress, respectively. TR, TS, and TL represent the roots, stems, and leaves of the salt-tolerant genotype under normal conditions, respectively. TNR, TNS, and TNL represent the roots, stems, and leaves of the salt-tolerant genotype under salt stress, respectively.
Ijms 27 08252 g005
Figure 6. Venn diagram of PbCNGCs which were differentially expressed in two ecotypes of Pyrus betulaefolia after salt stress. OR, OS, and OL represent the roots, stems, and leaves of the ordinary genotype under normal conditions, respectively. ONR, ONS, and ONL represent the roots, stems, and leaves of the ordinary genotype under salt stress, respectively. TR, TS, and TL represent the roots, stems, and leaves of the salt-tolerant genotype under normal conditions, respectively. TNR, TNS, and TNL represent the roots, stems, and leaves of the salt-tolerant genotype under salt stress, respectively.
Ijms 27 08252 g006
Figure 7. Expression status of PbCNGCs in roots, stems, and leaves of two ecotypes from Pyrus betulaefolia after salt stress. Values are presented as means ± standard deviations (SDs). Vertical bars indicate SDs of the means from no fewer than three biological replicates. Values marked with different superscript letters differ significantly among treatments (p < 0.05; one-way analysis of variance followed by Tukey’s Honestly Significant Difference test).
Ijms 27 08252 g007
Figure 8. Methylation level in the reading windows of differentially methylated PbCNGC4 and PbCNGC14 genes in roots of Pyrus betulaefolia after salt stress. OR, roots of the ordinary genotype under normal conditions; ONR, roots of the ordinary genotype under salt-stress conditions; TR, roots of the salt-tolerant genotype under normal conditions; TNR, roots of the salt-tolerant genotype under salt-stress conditions. Values marked with different superscript letters differ significantly among treatments (p < 0.05; one-way analysis of variance followed by Tukey’s Honestly Significant Difference test).
Ijms 27 08252 g008
Figure 9. Effects of the DNA methyltransferase inhibitor 5-azacytidine (5-azaC) and accelerator methyl trifluoromethanesulfonate (MTFMS) on DNA methylation and transcript levels of PbCNGC4 and PbCNGC14 in two ecotypes of Pyrus betulaefolia under salt-stress conditions. (a) Relative McrBC-PCR signal of PbCNGC4. (b) Relative McrBC-PCR signal of PbCNGC14. (c) Relative expression level of PbCNGC4. (d) Relative expression level of PbCNGC14. Methylated DNA can be digested by McrBC, and thus, higher qPCR signals indicate lower methylation levels (MLs). Values are presented as the means ± standard deviations (SDs). Vertical bars represent the SDs of the means from at least three biological replicates, and values with asterisks (*) are considered significantly different between the two P. betulaefolia genotypes (p < 0.05, Hypothesis Testing followed by Two-Sample t-Test, performed using Origin 2025).
Ijms 27 08252 g009
Figure 10. Complementation of Na+ and K+ transport mutants of Saccharomyces cerevisiae by PbCNGC4 and PbCNGC14 from Pyrus betulaefolia. (a) Complementation of the B31 yeast strain on AP medium containing 0, 50, or 100 mM NaCl. B31 was transformed with plasmids containing pYES2-PbCNGC4, pYES2-PbCNGC14, or an empty vector pYES2 (negative control). Photographs were taken after incubation at 30 °C for 72 h. (b) The OD600 values of recombinant yeast after 48 h of cultivation in AP liquid medium supplemented with 0, 50, or 100 mM NaCl. (c) Complementation of the CY162 yeast strain on potassium-free modified YNB medium containing 2, 50, or 100 mM KCl. CY162 was transformed with plasmids containing pYES2-PbCNGC4, pYES2-PbCNGC14, or an empty vector pYES2 (negative control). Photographs were taken after incubation at 30 °C for 72 h. (d) The OD600 values of recombinant yeast after 48 h of cultivation in potassium-free modified YNB medium supplemented with 2, 50, or 100 mM KCl. Values are means ± standard error (SE, n = 3). Different lowercase letters indicate significant differences (p < 0.05) among transformed yeast strains, based on one-way analysis of variance followed by Tukey’s Honestly Significant Difference test, performed using Origin 2025.
Ijms 27 08252 g010
Table 1. Characteristics of 26 cyclic nucleotide-gated ion channel (CNGC) genes in Pyrus betulaefolia.
Gene Name GroupGene ID PositionSubcellular LocalizationCoding Sequence Length/bpProtein Length/aaConserved DomainsConserved Domains’ LocationRelative Molecular Weight/kDaTheoretical Isoelectric Point (pI)
PbCNGC1IGWHGAAYT050302 GWHAAYT00000007: 26,403,195–26,406,463: +Plasma membrane2142713PLN03192
cNMP domain SM000100
626–636 IQAAWRRHMKK82.439.13
PbCNGC3IGWHGAAYT002107 GWHAAYT00000001: 17,099,483–17,102,711: +Plasma membrane2142713PLN03192
cNMP domain SM000100
627–637
IQAAWRRHMKK
82.47 9.11
PbCNGC10IGWHGAAYT000814 GWHAAYT00000001: 8,365,044–8,368,150: +Plasma membrane2166721PF00520 cNMP domain SM000100 651–661 IQAAWRRHWKR82.7810.02
PbCNGC11;1IGWHGAAYT002146 GWHAAYT00000001: 17,375,383–17,378,488: − Plasma membrane1962653cNMP domain SM000100 No75.31 9.71
PbCNGC11;2IGWHGAAYT053237 GWHAAYT00000008: 22,546,955–22,552,615: +Plasma membrane1815604cNMP domain
SM000100
593–603 IQATWRRRHGR68.949.92
PbCNGC12IGWHGAAYT002109 GWHAAYT00000001: 17,116,814–17,121,863: +Plasma membrane2107668cNMP domain SM000100 582–592 IQAAWRRHMKK75.78 9.41
PbCNGC13IGWHGAAYT002147 GWHAAYT00000001: 17,393,165–17,396,179: − Plasma membrane1878625cNMP domain SM000100 No71.76 9.64
PbCNGC21IGWHGAAYT002105 GWHAAYT00000001: 17,090,683–17,093,096: −Plasma membrane1782593cNMP domain SM000100 No68.789.05
PbCNGC5;1IIGWHGAAYT020856 GWHAAYT00000015: 9,290,815–9,294,361: +Plasma membrane2150719PLN03192
cNMP domain SM000100
633–643 IQAAWRRYSKR81.91 9.74
PbCNGC5;2IIGWHGAAYT040814 GWHAAYT00000005: 4,374,730–4,378,058: − Plasma membrane2223740PLN03192
cNMP domain
SM000100
651–661 IQAAWRHYRRK84.81 8.87
PbCNGC6IIGWHGAAYT031139 GWHAAYT00000002: 497,679–503,220: +Plasma membrane2385794cNMP domain SM000100 708–718 IQAAWRRYSKR90.22 9.76
PbCNGC14IIIGWHGAAYT020433 GWHAAYT00000015: 6,417,019–6,420,004: −Plasma membrane2241746PLN03192
cNMP domain SM000100
644–654 IQVAWRRFKKK86.02 9.07
PbCNGC15IIIGWHGAAYT018774 GWHAAYT00000014: 21,111,829–21,114,953: − Plasma membrane2114704PLN03192
cNMP domain SM000100
588–598 IQVAWRRFRKR80.97 8.91
PbCNGC16;1IIIGWHGAAYT007497 GWHAAYT00000011: 12,444,624–12,447,975: −Plasma membrane1986661PF00520 cNMP domain SM000100 587–588 IQAAWRRCKKR75.738.82
PbCNGC16;2IIIGWHGAAYT035281 GWHAAYT00000003: 9,498,373–9,501,909: − Plasma membrane2103700PF00520 cNMP domain SM000100 622–632 IQAAWRRSKKR80.38 9.27
PbCNGC17IIIGWHGAAYT027204 GWHAAYT00000016: 21,786,091–21,791,824: +Plasma membrane2079692PLN03192
cNMP domain SM000100
598–608 IQAAWRRHKRR79.36 8.92
PbCNGC18IIIGWHGAAYT053695 GWHAAYT00000009: 2,038,273–2,041,602: − Plasma membrane1815604PF00520 cNMP domain SM000100 488–498 IQAAWRRFKKR69.258.6
PbCNGC19IV AGWHGAAYT047144 GWHAAYT00000006: 23,953,978–23,969,075: +Plasma membrane2391796PF00520 cNMP domain SM000100 754–755 IQVAWRYRKKC89.72 8.52
PbCNGC20;1IV AGWHGAAYT019425 GWHAAYT00000014: 25,088,326–25,093,798: + Plasma membrane2334777 PF00520 cNMP domain SM000100741–751 IQVAWRYRKKC88.61 9.57
PbCNGC20;2IV AGWHGAAYT047142 GWHAAYT00000006: 23,940,600–23,946,060: +Plasma membrane2424807PF00520 cNMP domain SM000100769–779
IQVAWRYRKKC
91.73 8.65
PbCNGC20;3IV AGWHGAAYT054207 GWHAAYT00000009: 5,307,449–5,312,469: −Plasma membrane2040679PF00520 cNMP domain SM000100 647–657 IQVAWRYRKKR77.749.32
PbCNGC2IV BGWHGAAYT028356 GWHAAYT00000017: 3,414,080–3,417,326: −Plasma membrane2076691PLN03192
cNMP domain SM000100
666–676 IQFAWRRYRLR79.14 9.89
PbCNGC4IV BGWHGAAYT036687 GWHAAYT00000003: 24,919,487–24,926,754: −Plasma membrane2076691PLN03192
cNMP domain
SM000100
635–645 IQLAWRRYKHR79.78 8.35
PbCNGC7IV BGWHGAAYT053948 GWHAAYT00000009: 3,551,511–3,555,613: −Plasma membrane2139712PLN03192
cNMP domain SM000100
666–676 IQFAWRRYRLR81.6310.05
PbCNGC8IV BGWHGAAYT049912 GWHAAYT00000007: 24,009,828–24,013,592: +Plasma membrane2100699cNMP domain SM000100 656–666 IQLAWRRHRMR80.759.56
PbCNGC9IV BGWHGAAYT009007 GWHAAYT00000011: 28,712,407–28,719,652: −Plasma membrane2076691PLN03192
cNMP domain SM000100
635–645 IQLAWRRYKHR79.878.93
Note: (+) and (−) represent the forward and reverse orientations of genes on chromosomes, respectively.
Table 2. Differential methylation profiles of PbCNGC genes in roots of Pyrus betulaefolia.
Gene NameThe Type of MethylationGene IDChromosomeMethylation StartMethylation EndWidthMethylation DifferentialSignificantAnnotationGene StartGene
End
Gene LengthDistance to TSS
PbCNGC4TR vs. TNR
CHH
GWHGAAYT0366870324,922,00124,922,200200−18.13HypoIntron
(2 of 6)
24,919,02924,926,75477264554
TR vs. OR
CHH
GWHGAAYT0366870324,919,00124,919,20020010.07Hyper3′ UTR24,919,02924,926,75477267554
PbCNGC14TR vs. OR
CHH
GWHGAAYT020433156,421,8016,422,000200−27.72HypoPromoter (1–2 kb)6,416,8556,420,1283274−1673
OR vs. ONR
CHH
GWHGAAYT020433156,421,2016,421,40020013.27HyperPromoter (1–2 kb)6,416,8556,420,1283274−1073
OR vs. ONR CHHGWHGAAYT020433156,421,6016,421,80020012.01HyperPromoter (1–2 kb)6,416,8556,420,1283274−1473
OR vs. ONR CHHGWHGAAYT020433156,421,8016,422,00020028.45HyperPromoter (1–2 kb)6,416,8556,420,1283274−1673
Note: OR and ONR denote root samples of the ordinary genotype collected before and after 24 h of 200 mM NaCl treatment, respectively. TR and TNR represent root samples of the salt-tolerant genotype prior to and following the same 200 mM NaCl treatment for 24 h. TSS refers to the transcription start site.
Table 3. Primer sequences of qPCR and McrBC-qPCR in this study.
Gene NameGene ID Forward Primer (5′→3′)Reverse Primer (5′→3′)Target Amplicon Size/bpDestination
PbCNGC3GWHGAAYT002107 CCTGCCCGATACAAGATGAAGAAATAGCACCAACCCAGCGAT229qPCR
PbCNGC4GWHGAAYT036687 GCAACGGGGCTCATCATAGAAGACCTTGCACTAGTGTCGC243qPCR
AGGTCCAACTTTTTGCCCTCACAACCGTGATGCAGGTGATTG232McrBC-qPCR
PbCNGC10GWHGAAYT000814 AGGCTGGTGACTTCTGTGGACGAAACTGGGAGGCGACAAA160qPCR
PbCNGC14GWHGAAYT020433 GTGCGAGCGTTTGGTATCCTGAGGGTTGATTTGGGAAGCA217qPCR
ATGTTCGAAAGACAGGCGGATGGGATTGTTCATGCCACCA244McrBC-qPCR
PbCNGC19GWHGAAYT047144 TAGGTTTCTGCCTCTGCTCGTCATTTCCACGCCCACAATC228qPCR
PbCNGC20;1GWHGAAYT019425 AGCCATAGACGCTTACCAGAGGTTCATCCATCAGGGCAAA191qPCR
Note: qPCR, quantitative real-time polymerase chain reaction. McrBC-qPCR, McrBC digestion coupled quantitative real-time PCR.
Disclaimer/Publisher’s Note: The statements, opinions and data contained in all publications are solely those of the individual author(s) and contributor(s) and not of MDPI and/or the editor(s). MDPI and/or the editor(s) disclaim responsibility for any injury to people or property resulting from any ideas, methods, instructions or products referred to in the content.