1. Introduction
The intestinal epithelium serves as a key determinant of the pharmacokinetics and toxicity of ingested environmental toxins, including a wide array of modern insecticides. While gut-derived insect cell lines remain indispensable tools for pharmacokinetic screening, they possess structural limitations that impact their utility in complex physiological modeling. Most notably, these cells lack the organized epithelial architecture—characterized by polarized cell layers and robust tight junctions that are essential for the transport studies typically conducted in mammalian systems. Without this specialized spatial orientation, insect cell cultures cannot fully replicate the selective permeability or the active transport mechanisms found in mammalian intestinal models. Because of these limitations, there is a need to develop better insect-cell-like models.
One of the best in vitro models of intestinal drug transport is the human Caco-2 cell line [
1,
2,
3]. In 1971, this cell line was established in culture from a human colon adenocarcinoma sample and exhibited morphological as well as functional similarities to human enterocytes [
4,
5]. Caco-2 cells grow exponentially and, when in confluency, undergo enterocytic differentiation after approximately 21 days in culture [
4]. This involves the formation of a polarized monolayer with an apical brush border as well as tight cellular junctions. Once cells are differentiated, efflux ratios (ERs) can be calculated which distinguish between active uptake, diffusion, and active efflux. Values significantly greater than (>2) indicate active rejection by the cell.
Transporters have a major impact on the absorption, distribution, metabolism and excretion (ADME) of a diverse number of toxins. A critical component of this defense across species is the ATP-binding-cassette (ABC)-transporter superfamily, which utilizes ATP hydrolysis as the driving force for the efflux of drugs or xenobiotics from the cell; thereby, toxin accumulation within sensitive tissues is limited [
6]. P-glycoprotein (Pgp: MDR1, ABCB1) is perhaps the most prominent ABC transporter. Pgp is ubiquitously expressed on the apical surface of intestinal enterocytes [
7], the canalicular membrane of hepatocytes, the brush border membrane of renal proximal tubular cells, and the endothelial cells of the blood–brain barrier.
Membrane transporters, particularly the ABC and SLC (solute carrier) superfamilies, serve as critical gatekeepers that mediate the pharmacokinetics of insecticide uptake across the insect gut and blood–brain barrier. As highlighted by Denecke et al. [
8] these transporters can limit xeniobiotic absorption, effectively reducing the internal bioavailability of the pesticide before it reaches its molecular target. This ‘Phase III’ detoxification mechanism not only regulates the systemic distribution of insecticides but can also be a driver of resistance in several major agricultural pests. For example, the upregulation of Pgp homologs in the midgut and Malpighian tubules of pests such as the diamondback moth (
Plutella xylostella) [
9] or various mosquito species [
10,
11] is associated with increased tolerance to lethal doses of toxins like pyrethroids and avermectins. This evolutionary adaptation effectively lowers the intracellular concentration of the insecticide before it can reach its molecular target [
12].
In the current study, we developed an “insectified” Caco-2 cell line that can be used to study pesticide bioavailability selectivity across species—including target insect pests, humans, and non-target pollinators. This approach also serves to validate the role of certain Pgp genes (such as upregulated genes or different alleles) in conferring pesticide resistance.
3. Discussion
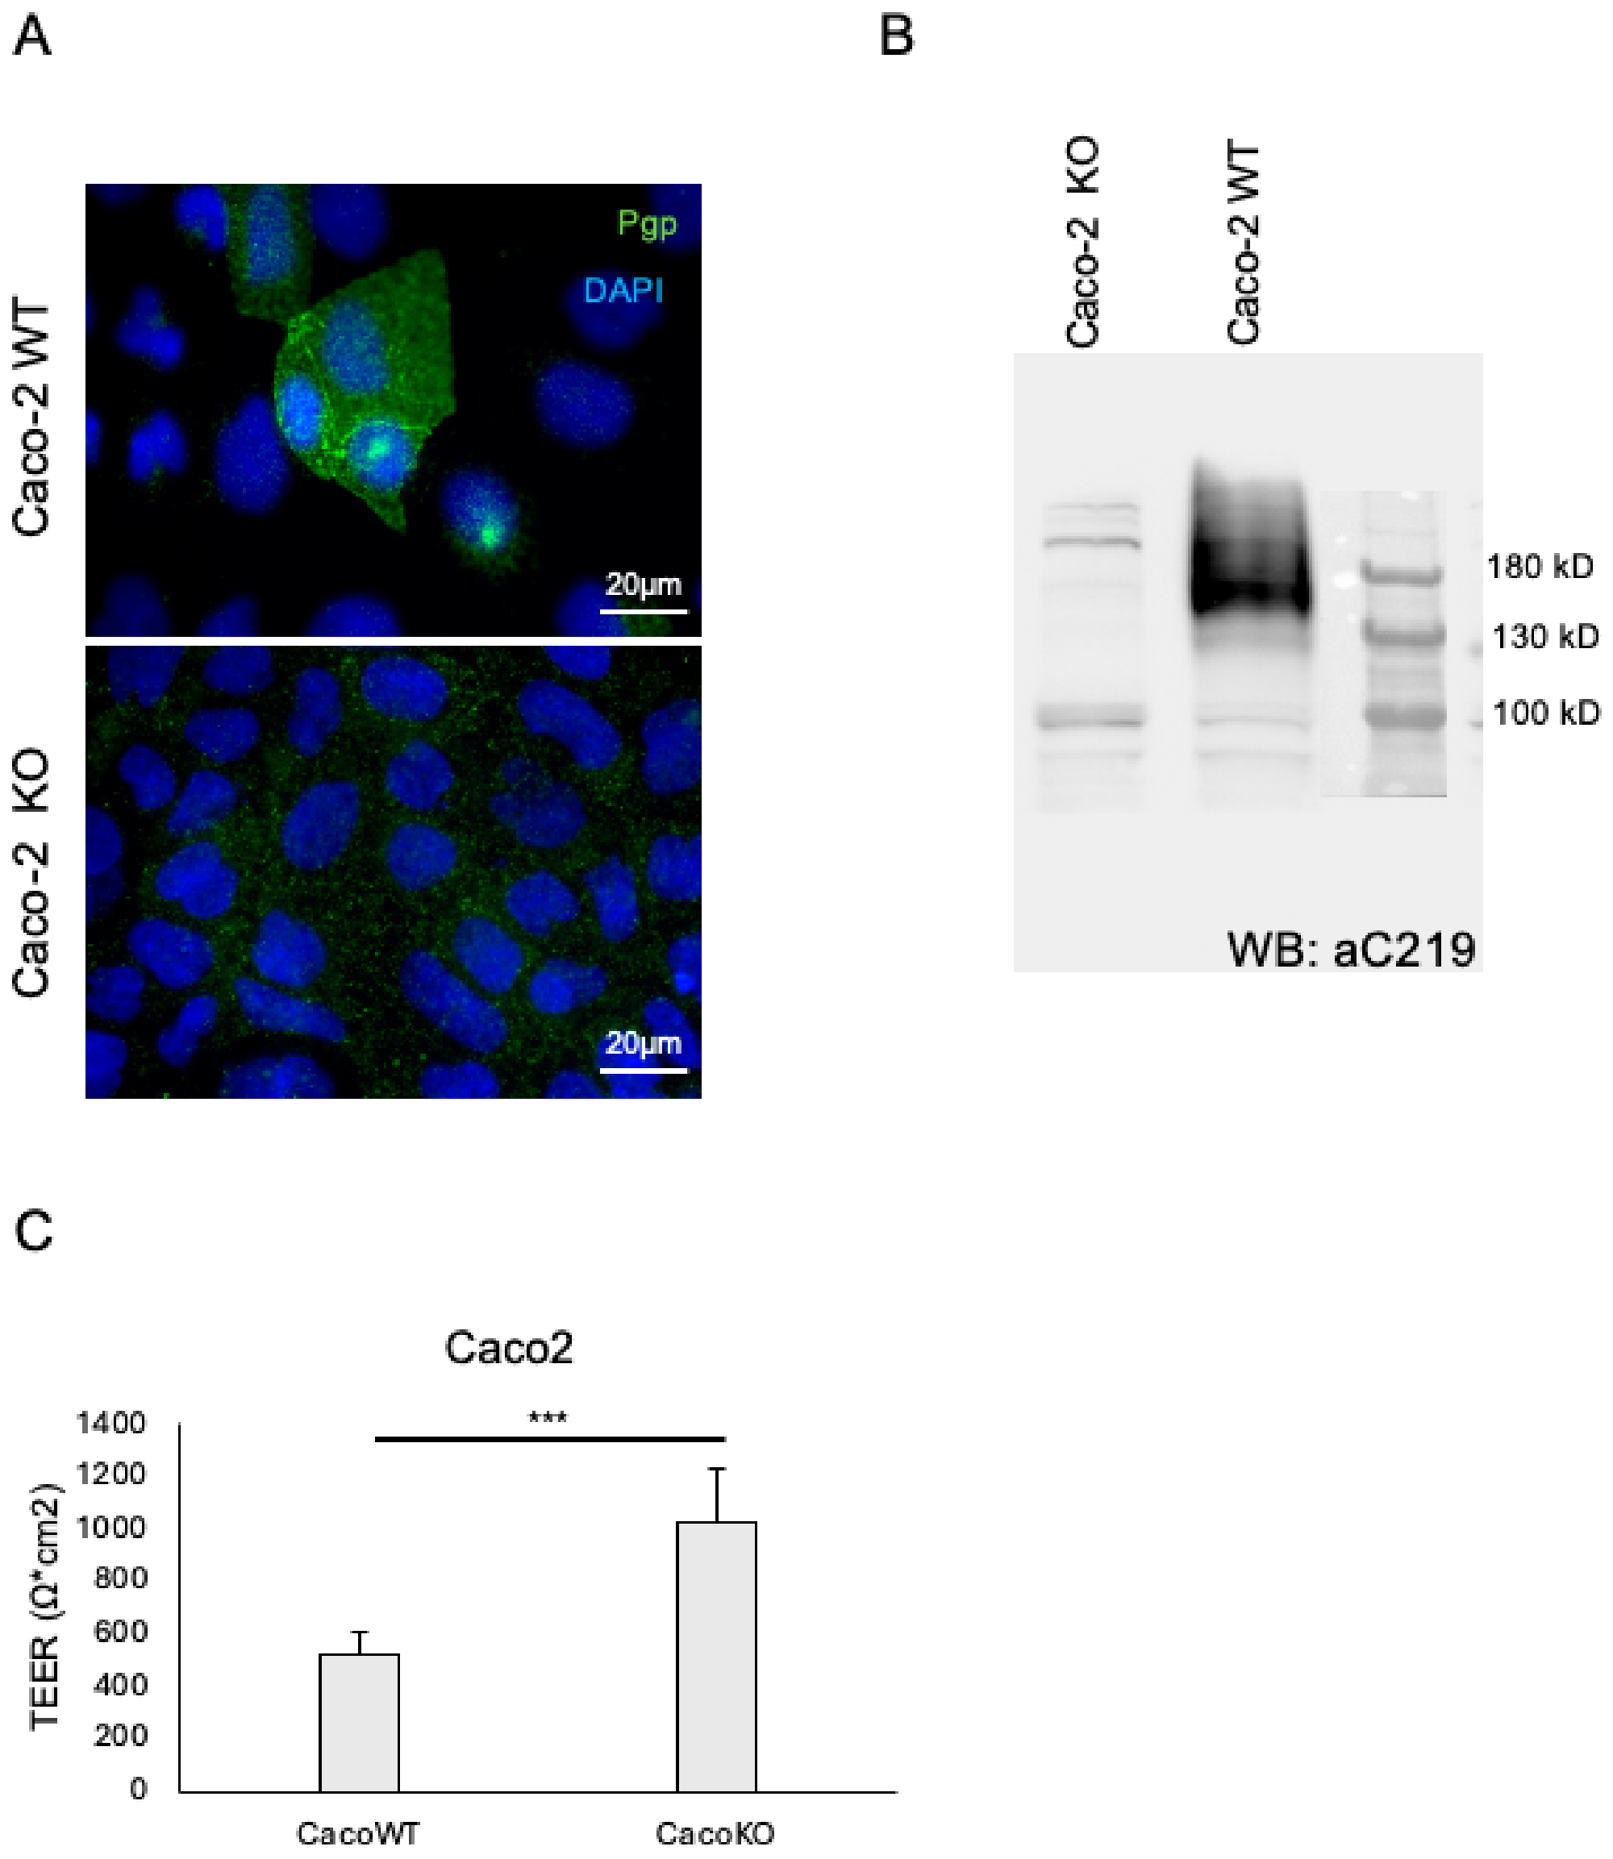
We successfully established and validated a robust in vitro permeability and efflux screening platform based on genetically engineered Caco-2 cells. By removing endogenous P-glycoprotein (PgpKO) and stably expressing Pgp orthologs from humans (Homo sapiens), moths (Helicoverpa armigera), and mosquitoes (Anopheles gambiae), the capacity of insect Pgp orthologs to transport tool compounds and pesticides was measured. Initial characterization confirmed the effective knockout of Pgp in the Caco-2 PgpKO cell line. Immunofluorescence and Western blot analyses demonstrated complete loss of Pgp expression in PgpKO cells, while wild-type Caco-2 cells showed strong membrane-localized Pgp expression, consistent with previous reports describing polarized ABCB1 localization in intestinal epithelial models [
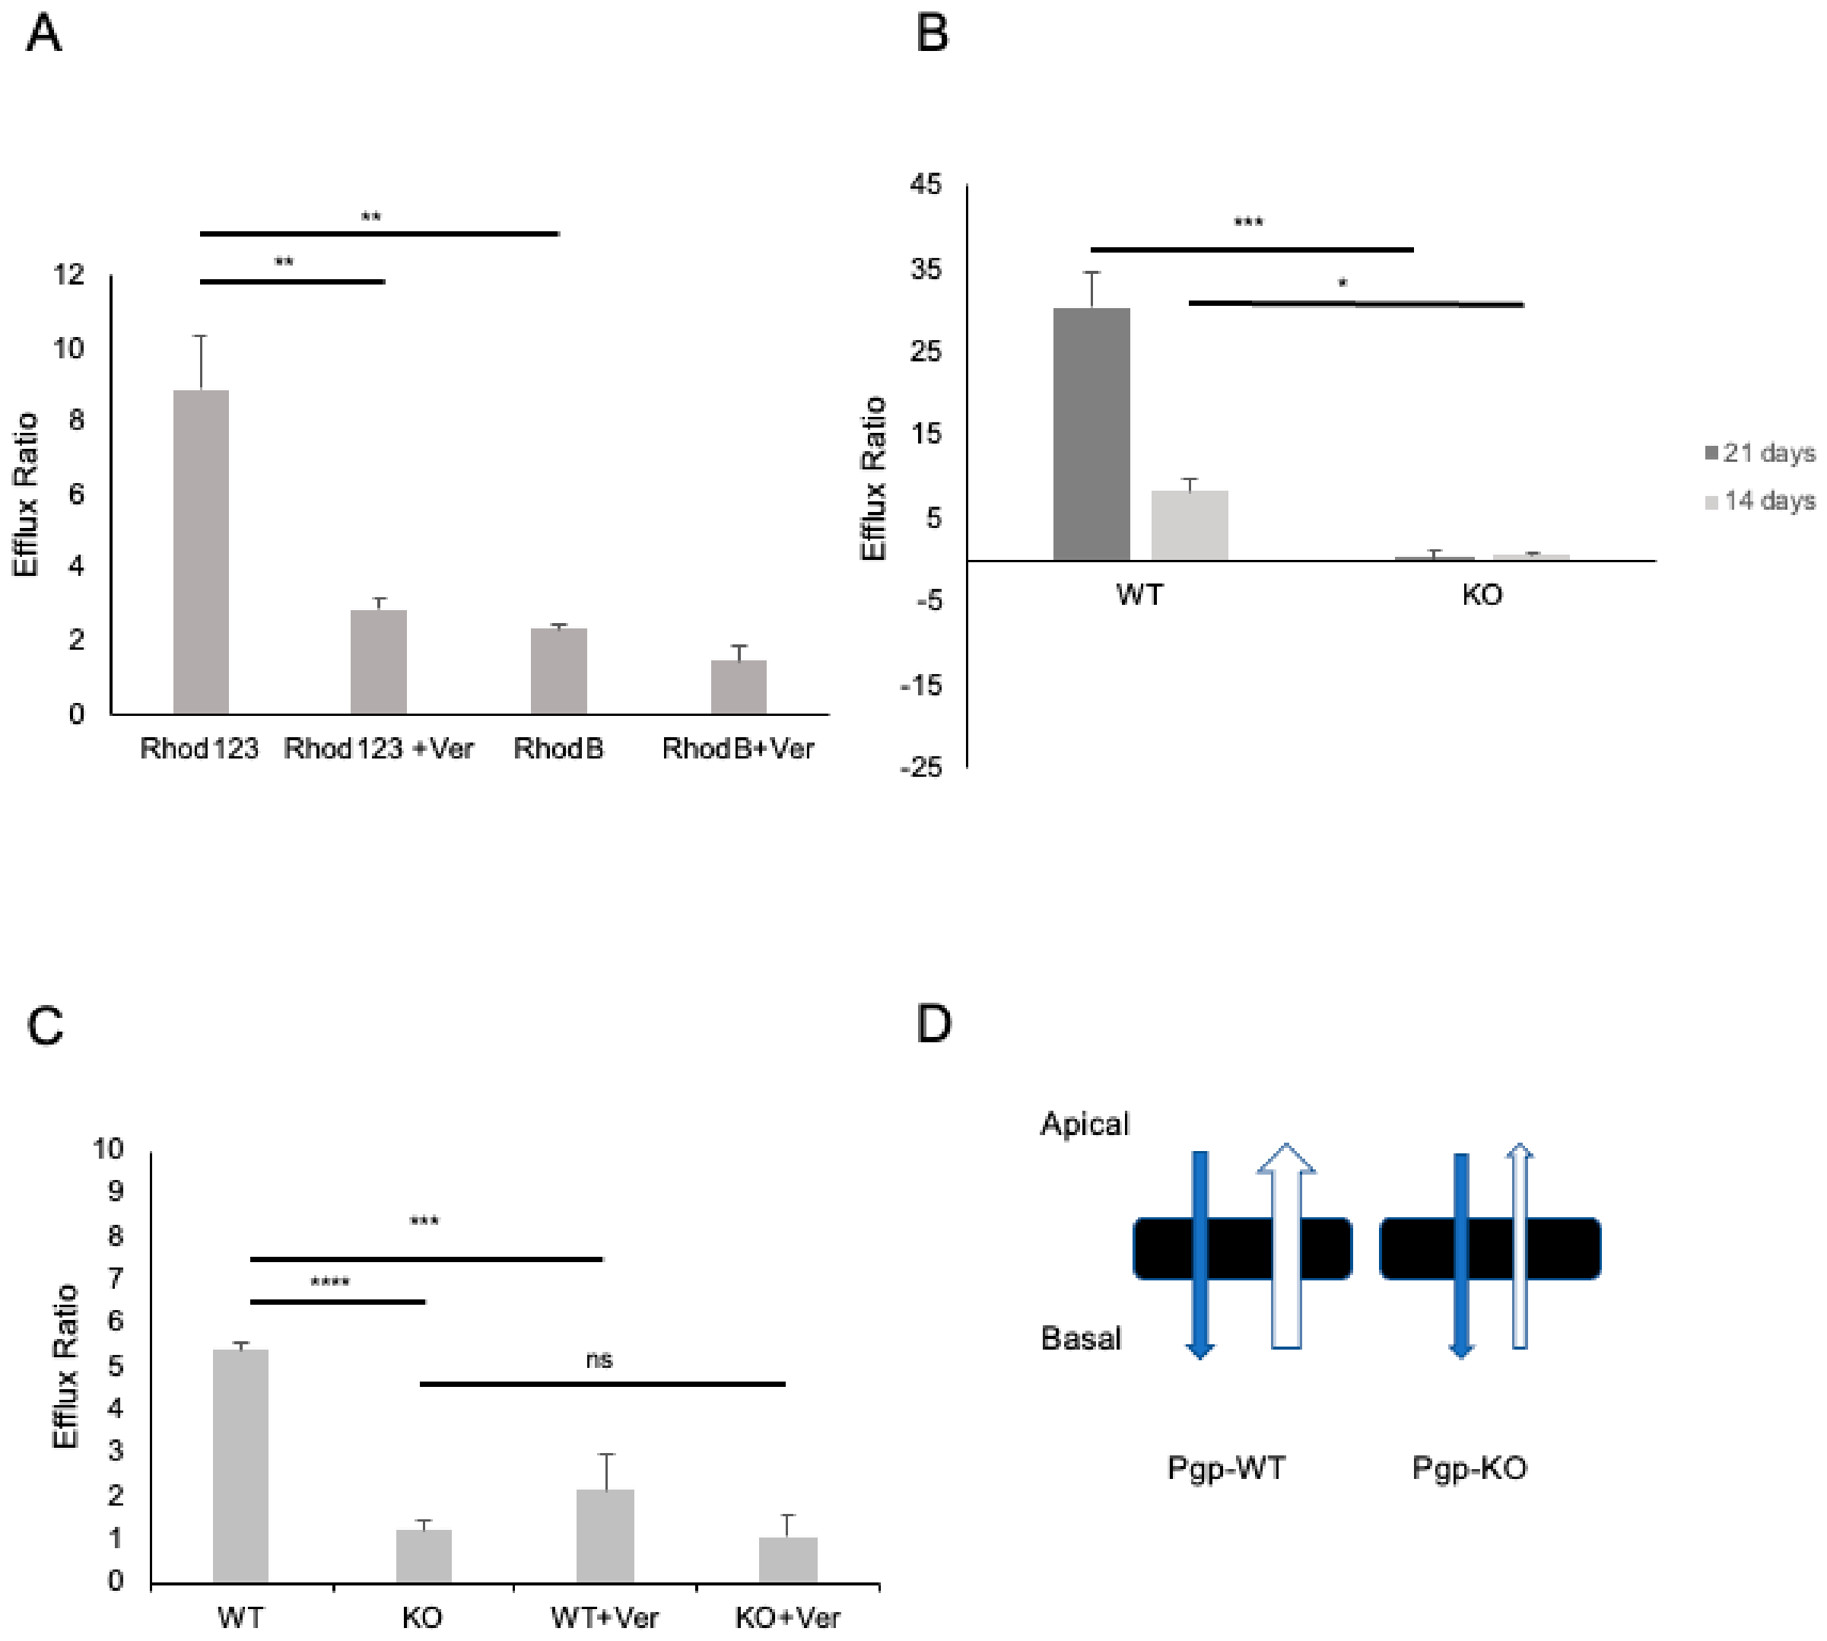
13]. Functionally, the absence of Pgp resulted in a near-complete loss of active efflux capacity, validating this line as a clean background for heterologous expression studies.
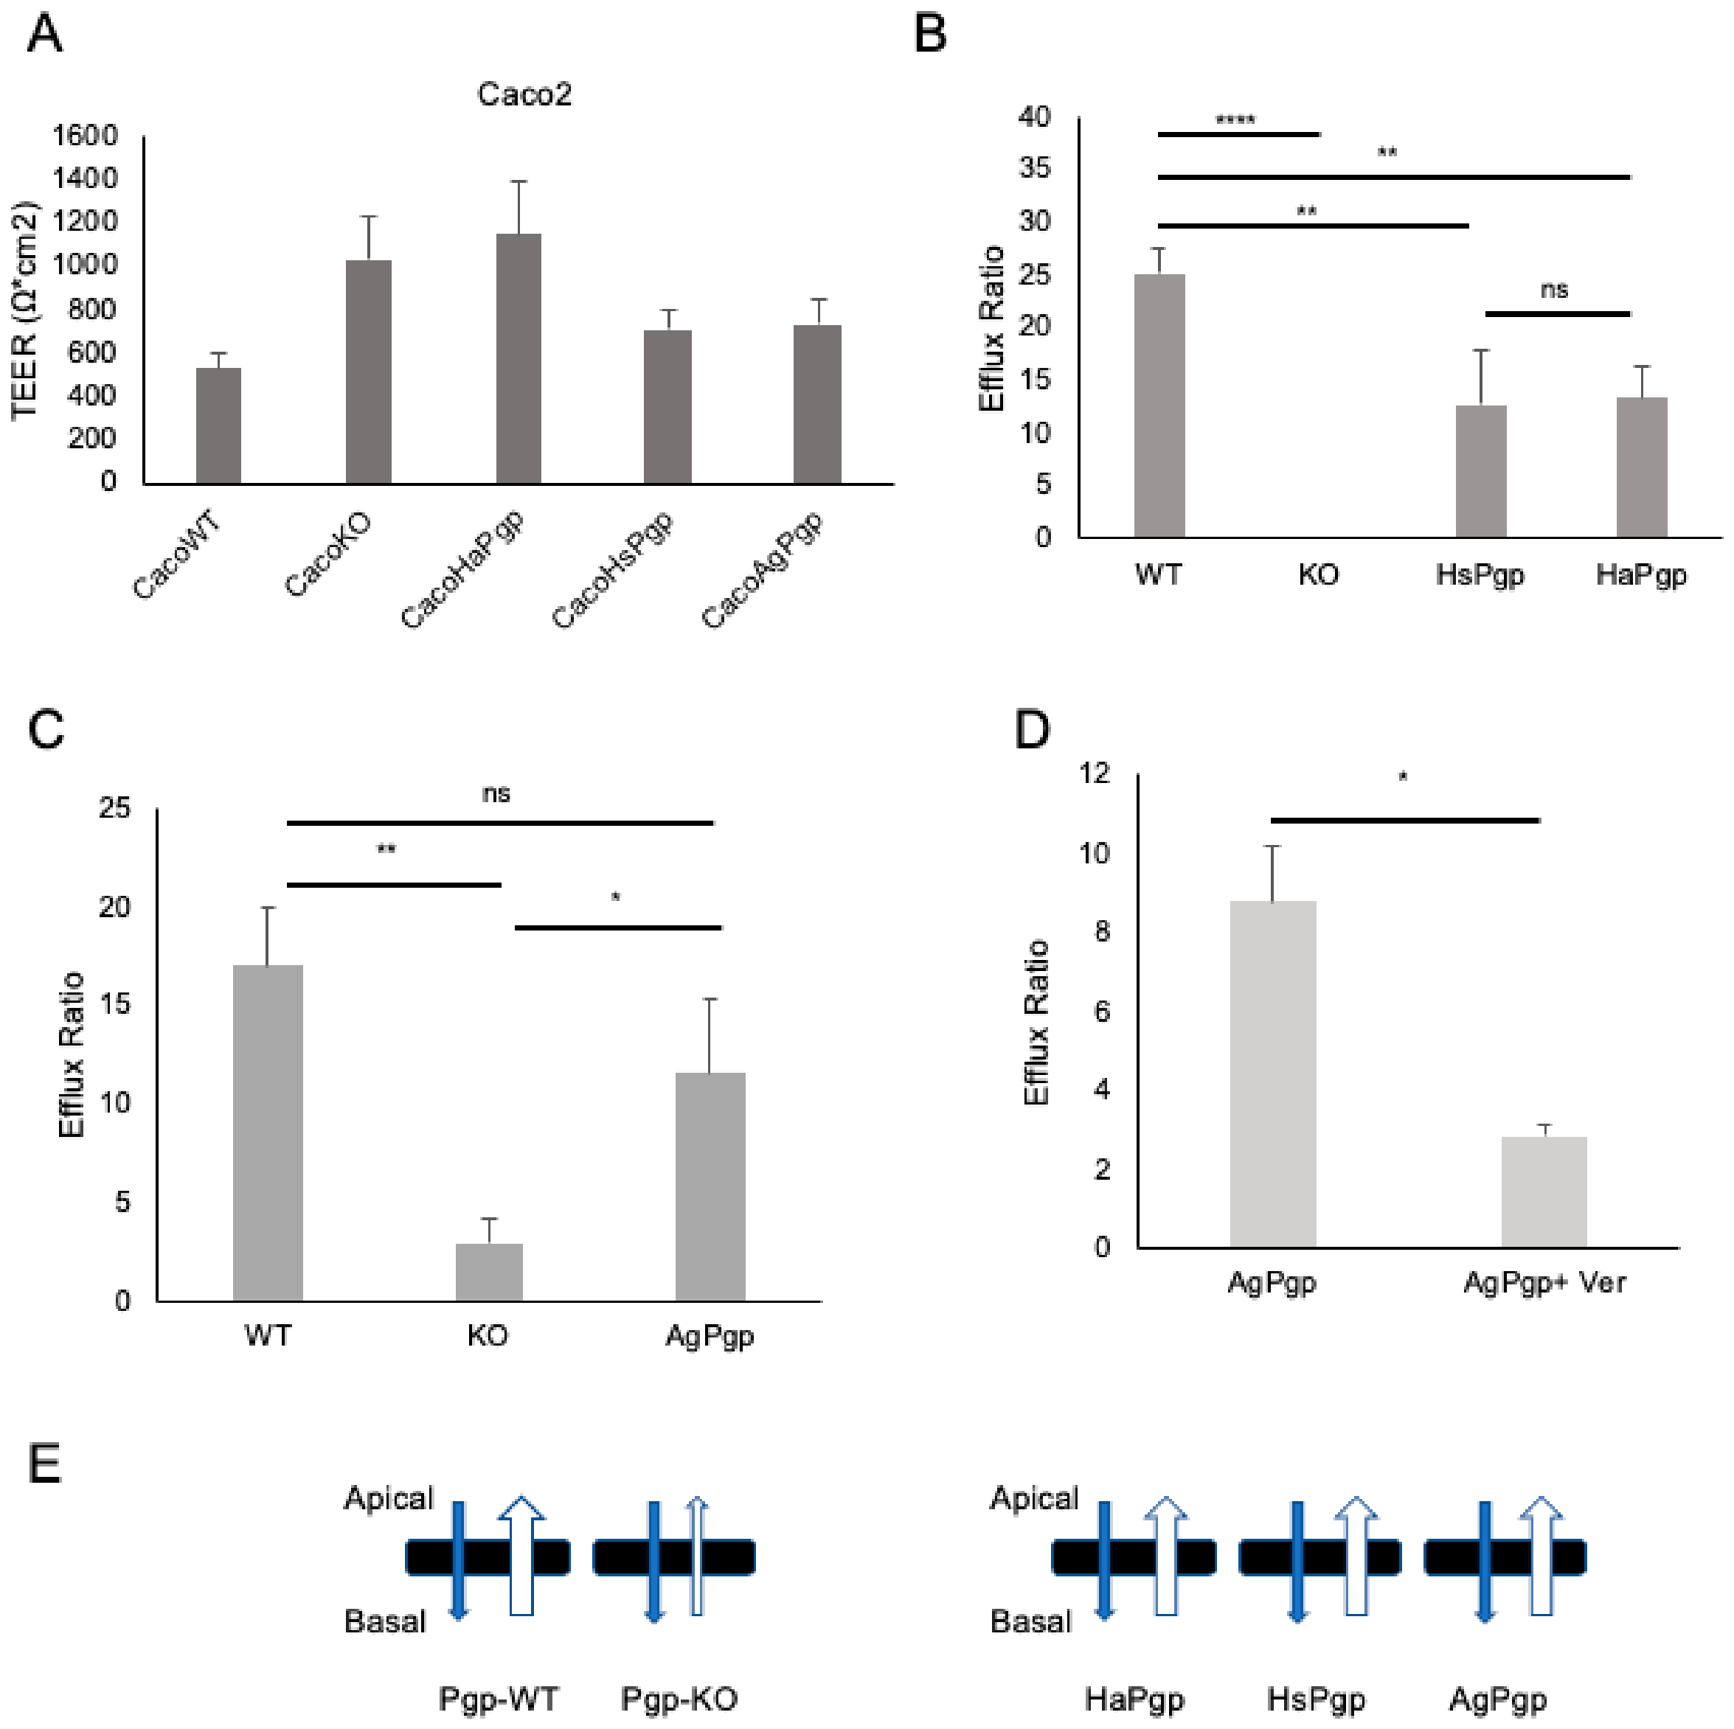
TEER measurements revealed that PgpKO cells exhibited higher TEER values compared to wild-type cells during monolayer formation. This observation suggests that deletion of Pgp does not compromise epithelial integrity; rather, it may enhance tight junction formation and barrier function. However, it is important to consider potential compensatory mechanisms as the knockout of Pgp often triggers the upregulation of alternative efflux transporters (such as BCRP or MRPs) to maintain cellular homeostasis. Similar increases in TEER have been reported in other transporter-deficient epithelial models [
14]. Importantly, all TEER values exceeded the threshold required for reliable permeability assays, ensuring that differences in compound transport were attributable to transcellular mechanisms rather than paracellular leakage.
The testing of fluorescent probes in our system demonstrated that Rhodamine 123 (Rhod123) is a superior Pgp substrate compared to Rhodamine B in Caco-2 wild-type cells. Rhod123 exhibited a markedly higher efflux ratio, which was strongly reduced in the presence of the Pgp inhibitor, Verapamil, confirming its specificity as a Pgp-dependent probe. In contrast, Rhodamine B showed only modest sensitivity to Pgp inhibition. These findings align with prior studies [
15] and justify the use of Rhod123 as a sensitive reporter for subsequent functional assays. Functional validation experiments further confirmed the distinct transport phenotypes of Pgpwild type and PgpKO cells. While Pgpwild type cells exhibited high efflux ratios for Rhod123, PgpKO cells showed nearly equal apical-to-basal and basal-to-apical permeability, consistent with passive diffusion in the absence of active efflux.
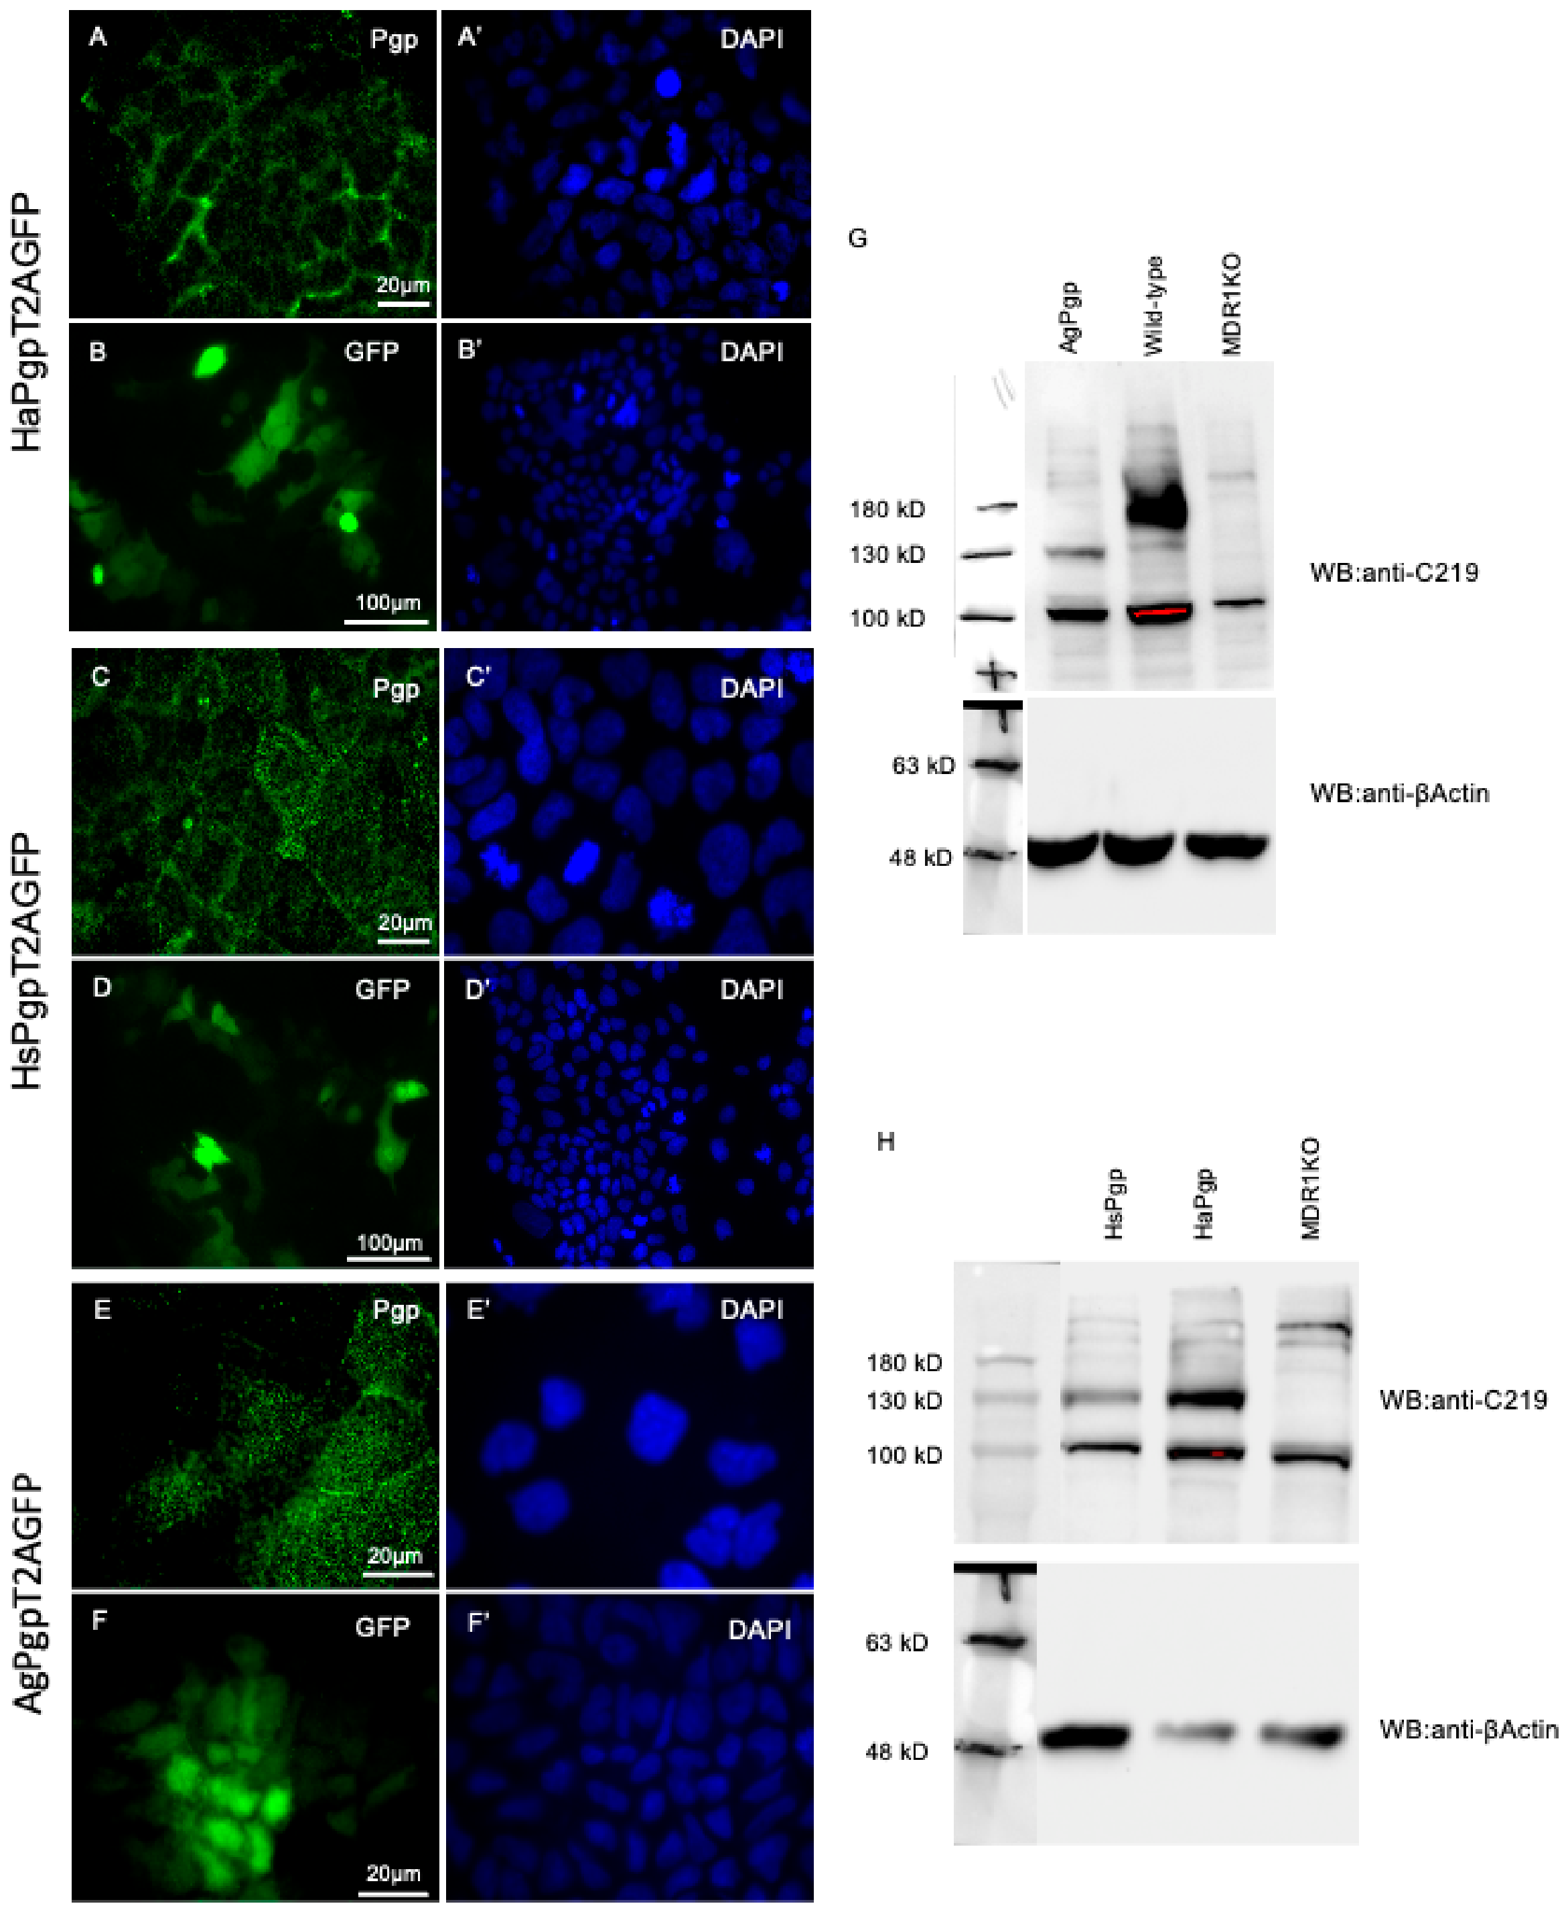
A major advance of this work was the establishment of Caco-2 PgpKO cells stably expressing insect Pgp orthologs. Immunofluorescence and Western blot analyses confirmed robust expression and correct membrane localization of H. armigera, A. gambiae, and human Pgp proteins. Importantly, TEER measurements showed that expression of these transporters did not disrupt epithelial barrier integrity; instead, all engineered lines exhibited equal or higher resistance compared to Pgpwild type cells. Functional efflux assays revealed that H. armigera Pgp can transport Rhod123 with efficiency comparable to human Pgp, albeit at lower absolute efflux ratios than those observed in wild-type Caco-2 cells. The reduced magnitude of efflux in heterologously expressing lines likely reflects differences in expression levels, membrane density, or intrinsic substrate affinity between endogenous human Pgp and the introduced orthologs.
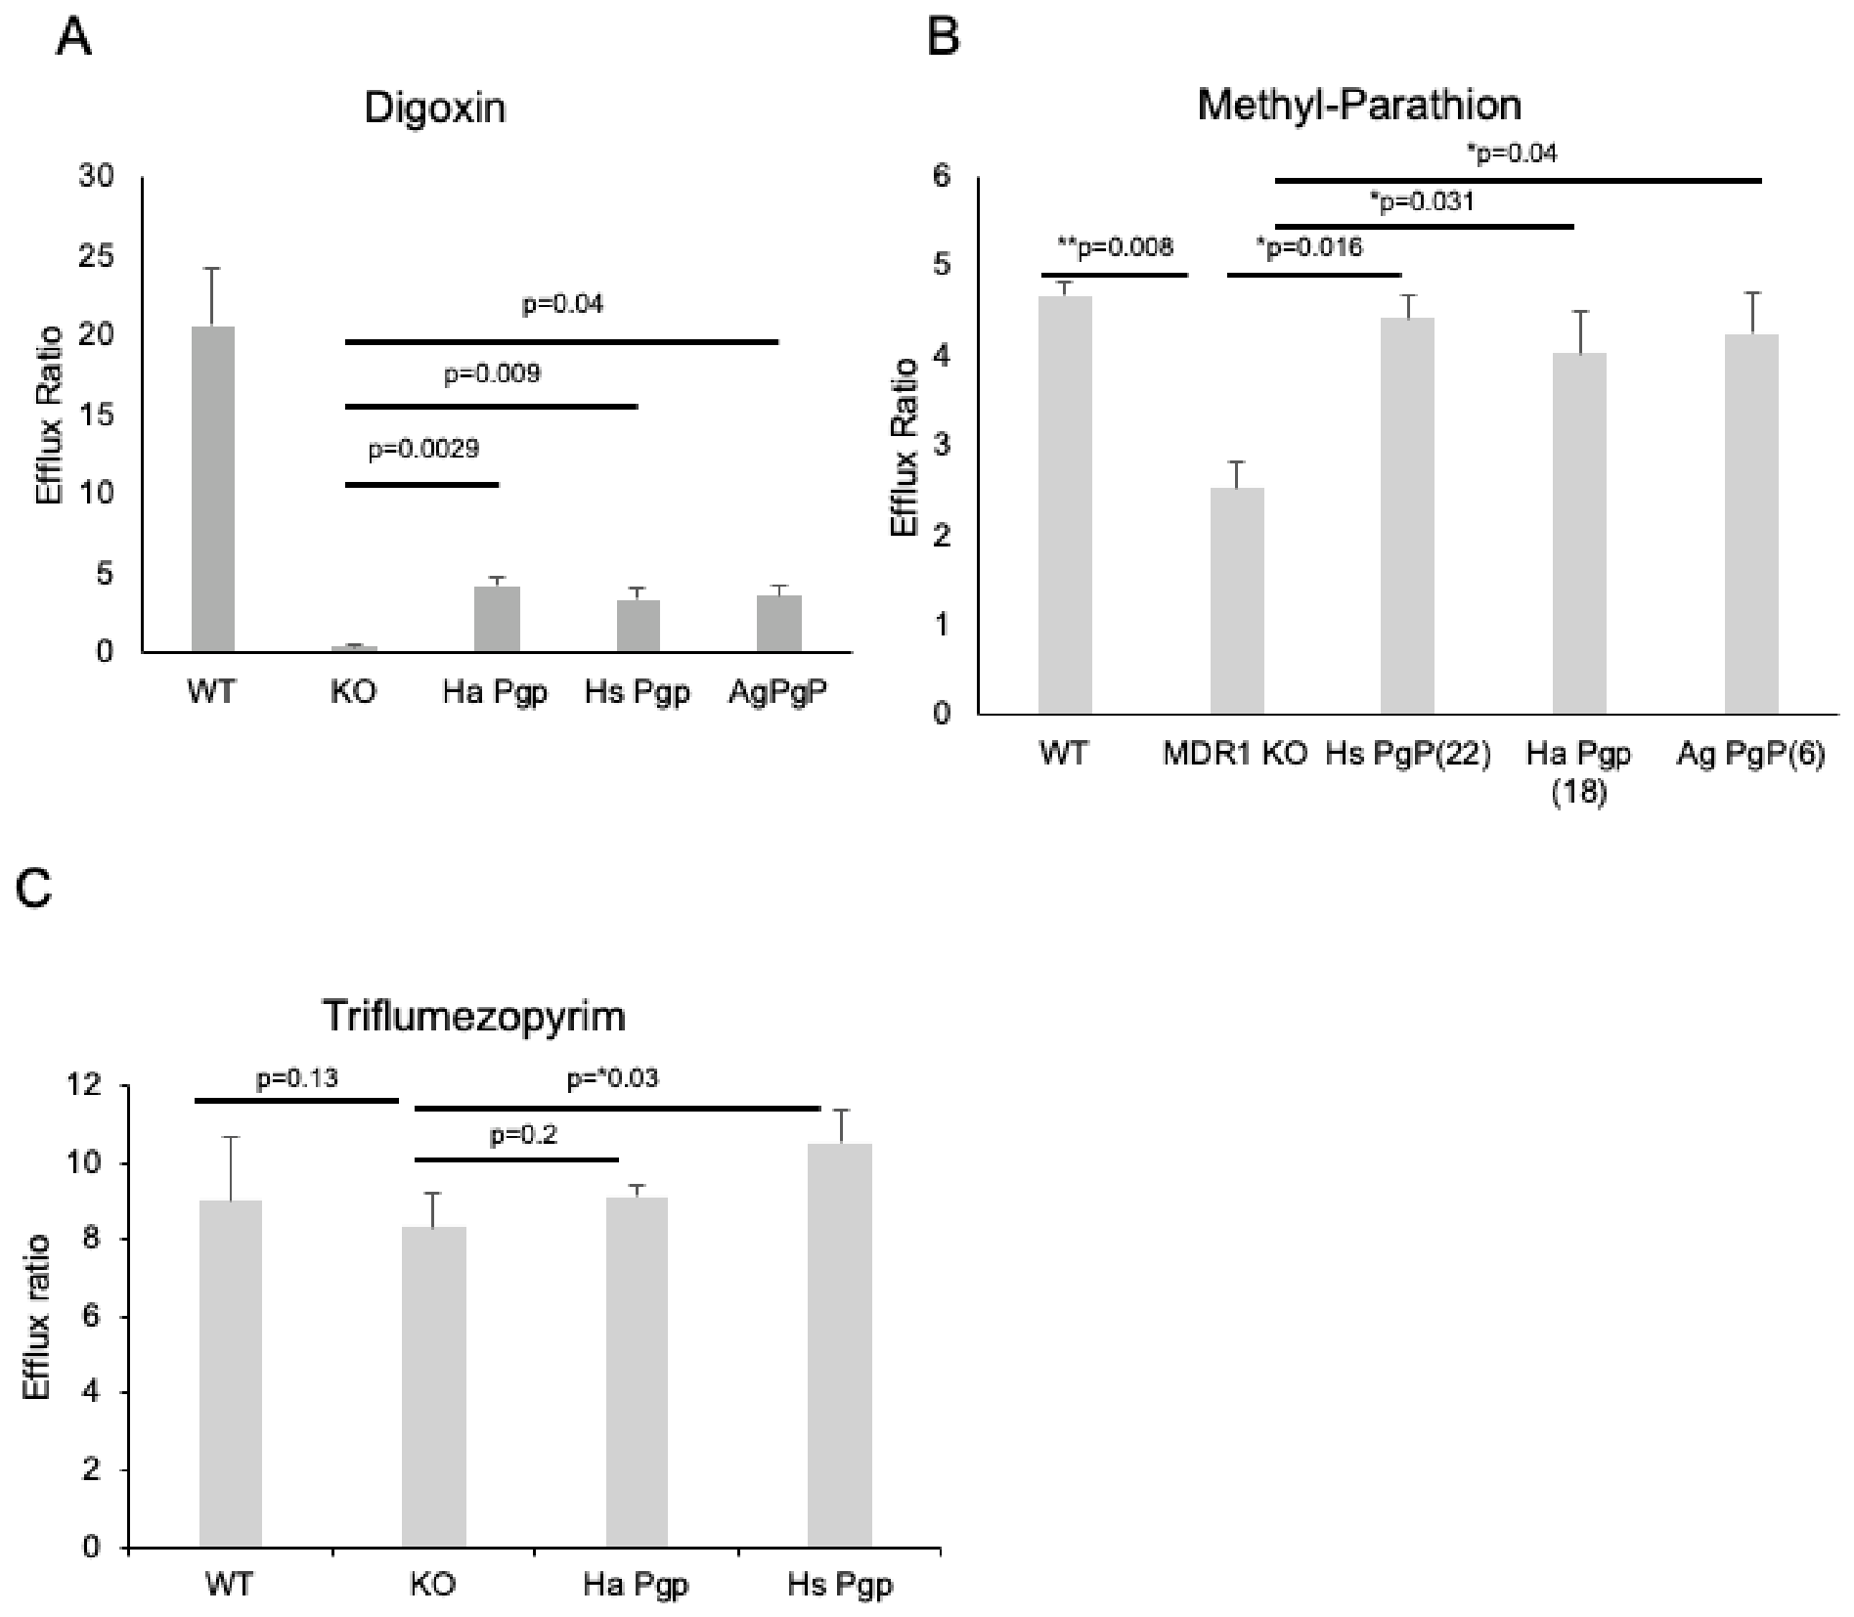
Digoxin, a canonical Pgp substrate, displayed high efflux ratios in Pgpwild type cells and almost complete loss of transport in PgpKO cells, validating the assay’s sensitivity. Partial restoration of Digoxin transport by insect and human Pgp orthologs confirms that these transporters retain the capacity to recognize and efflux structurally diverse substrates.
Methyl parathion, an organophosphate insecticide, showed a clear dependence on Pgp for efflux. The significant reduction in efflux ratio upon Pgp deletion, followed by functional rescue with insect and human Pgp variants, suggests low selectivity. These data are in line with evidence that methyl parathion act as high-affinity inhibitors of P-glycoprotein (Pgp) [
16,
17,
18].
In contrast, Triflumezopyrim exhibited minimal Pgp-dependent transport across all tested cell lines. The lack of significant differences between Pgpwild type and PgpKO cells indicates that this mesoionic insecticide is not a major Pgp substrate. However, Triflumezopyrim exhibited a high baseline efflux ratio of approximately eight across all tested lines. These results indicate that Triflumezopyrim could potentially act as a substrate for alternative active efflux transporters (eg BCRP or MRPs) rather than relying purely on passive diffusion or metabolic detoxification. This distinction requires further experimental verification and highlights the importance of compound-specific transport profiling when assessing resistance risk.
By combining a clean knockout background with heterologous expression of insect and human transporters, this system enables direct functional comparisons that are difficult to achieve in native tissues. Also, the significant reduction in efflux ratios upon Pgp deletion, followed by the functional rescue using insect Pgp variants, could provide mechanistic insight into the role of efflux transporters in insecticide resistance. Over-expression of these transporters in insects could lead to multidrug resistance, where the insect can effectively pump out various classes of insecticides before they reach their target sites.
Despite the versatility of the current Pgp transport assay, certain limitations exist regarding highly lipophilic, poorly water-soluble compounds. For such substances, non-specific binding to the plasticware or their retention by the cell monolayer can result in unreliable estimates of permeability. Similar challenges have been documented in Caco-2 cell-based systems, where the addition of bovine serum albumin (BSA) to the receiver compartment was utilized to maintain sink conditions [
19]. Implementing these steps in our current model could ensure to distinguish Pgp-mediated transport from passive membrane retention.
4. Materials and Methods
4.1. Cell Lines
Caco-2 (CRL2102) was purchased from ATCC and Caco-2 MDR1 KO (MTOX1001) was purchased from Sigma-Aldrich (St. Louis, MO, USA). CRL2102 cells were grown in DMEM 11995 supplemented with 10% fetal bovine serum (FBS) and 0.01 mg/mL apo-transferrin (cat. no. T539). MTOX1001 were cultured in DMEM D5671 supplemented with 20% FBS (only for the first two passages, cat. no. F4135) and then 10% FBS, 2mM glutamine (cat. no. G7513) and gentamycin.
4.2. Chemicals
Chemicals and reagents were purchased from the following providers: Rhod 123 (cat. no. 83702), Rhod B (cat. no. R6626), Verapamil (cat. no. v4629), Lucifer yellow (cat. no. L0259) and glucose (cat. no. G7021) from Sigma-Aldrich (St. Louis, MO, USA); HBSS (cat. no. 14025-050) from Gibco, Thermo Fisher Scientific Waltham, MA, USA; methyl parathion-d6 from LGC Standards, Teddington, UK; Triflumezopyrim from LGC Standards, Teddington, UK; and Digoxin (cat. no. D6003) from Sigma-Aldrich, St. Louis, MO, USA.
4.3. Transient Transfection and Generation of Stable Cell Line
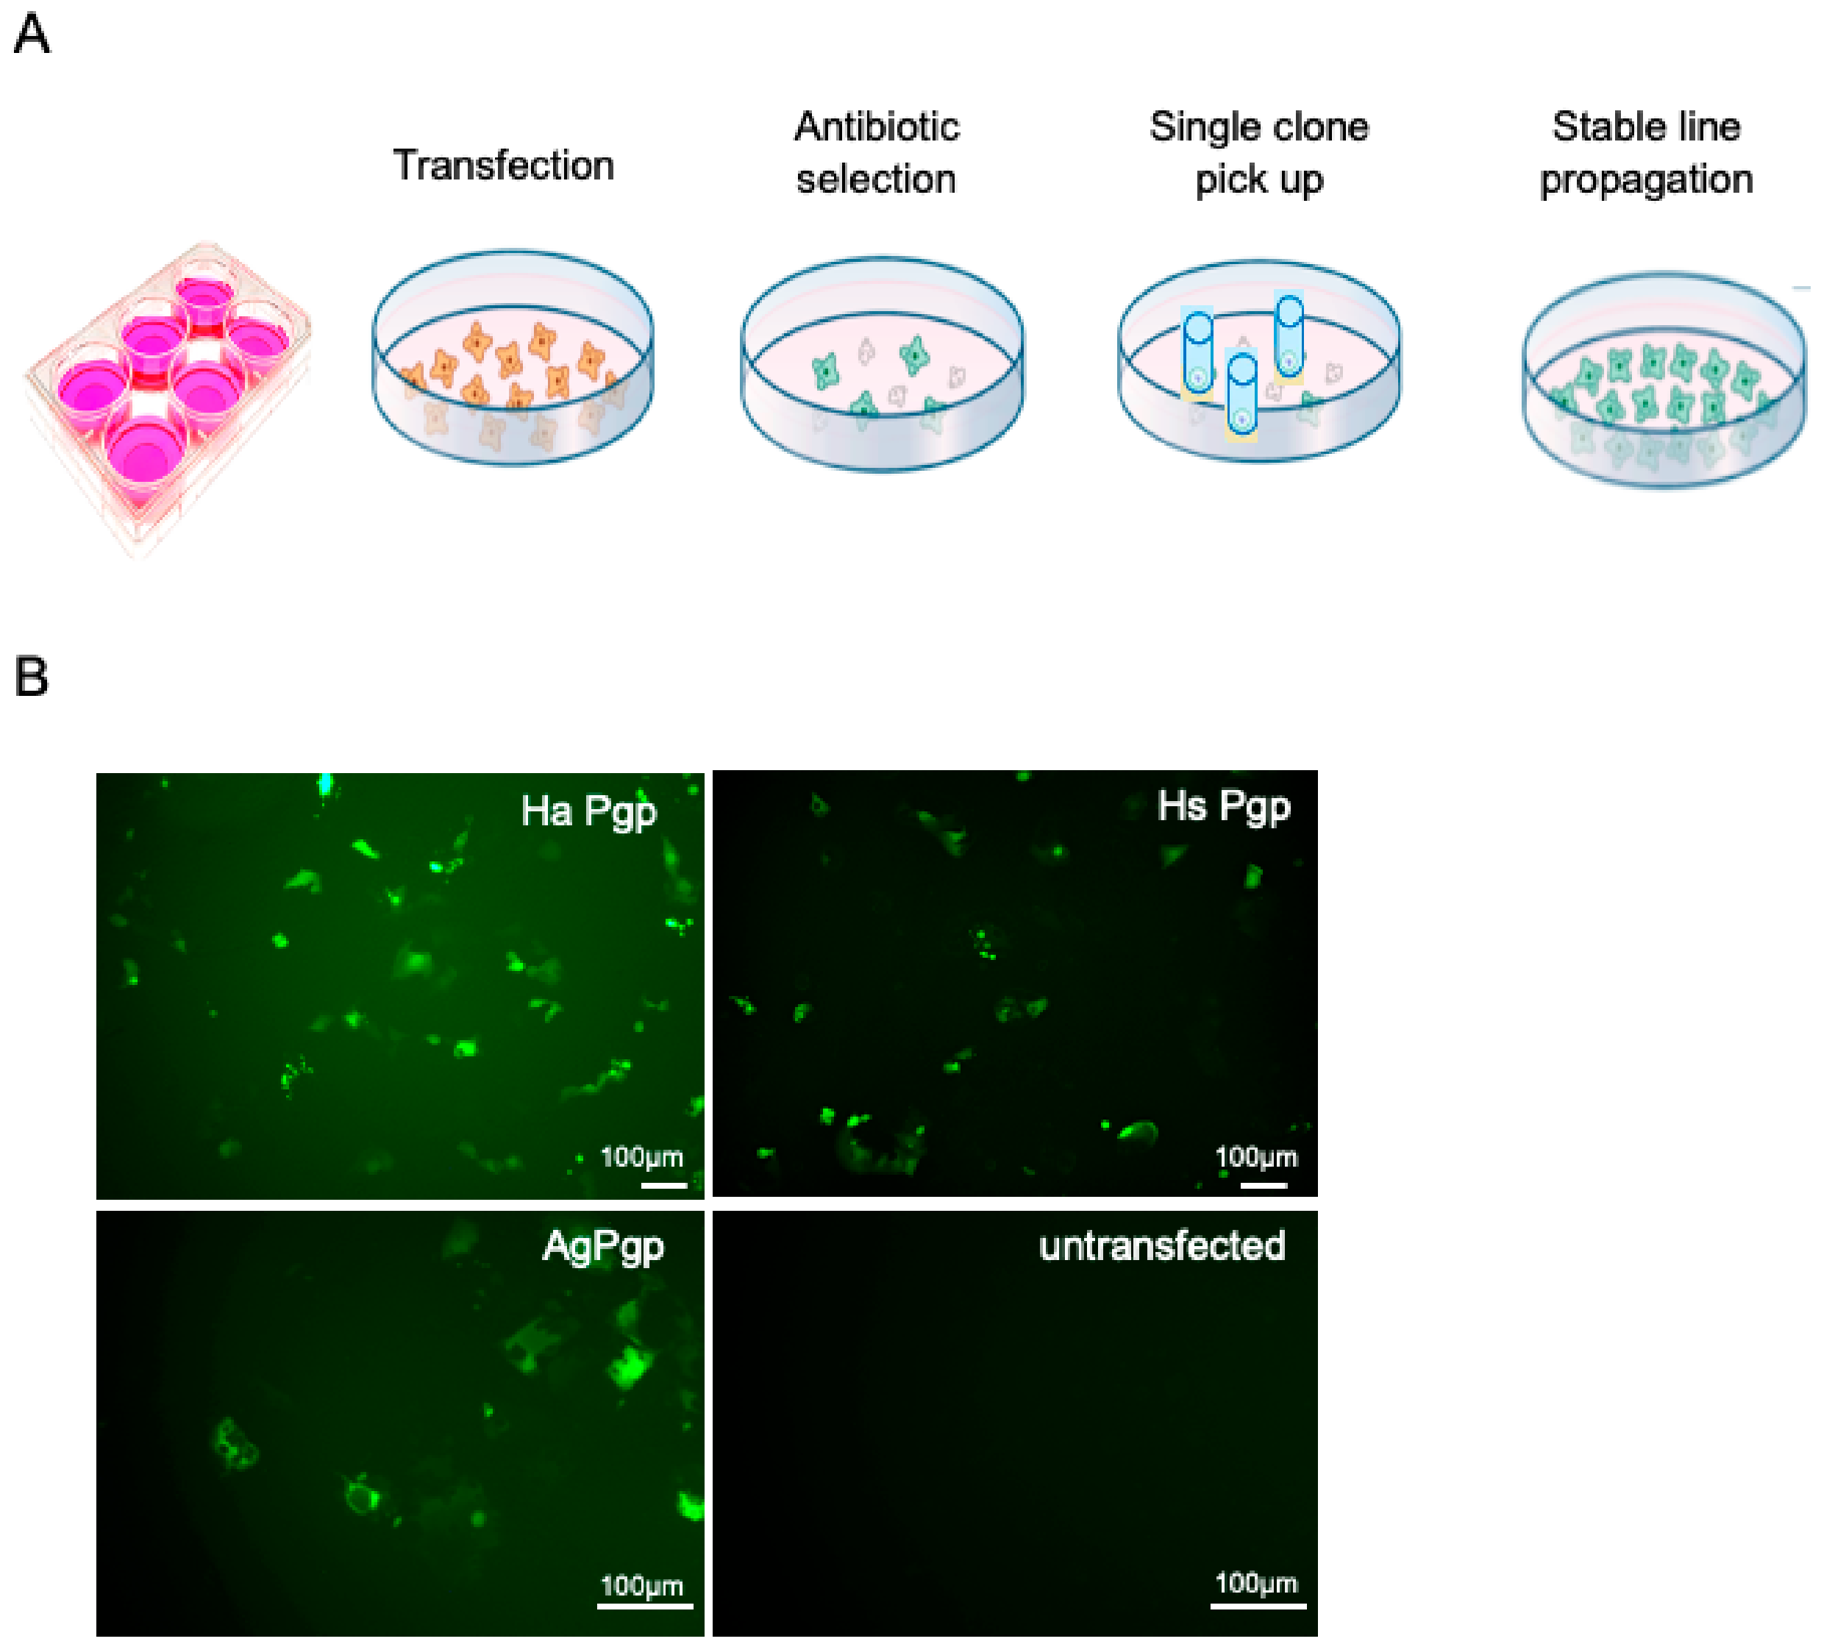
The coding sequence of Helicoverpa armigera (HaOG200306) ABCB7, Anopheles gambiae (AGAP005639) ABCBF and Homo sapiens ABCB1 (NP001335875.1) were synthesized and cloned in pcDNA3.1 vector (Genscript, Piscataway, NJ, USA). Plasmids were linearized with a single cutter enzyme and purified with phenol-chloroform. Afterwards cells were plated in a 6-well plate for transfection. On the next day, 3 μg of linear empty pcDNA3.1 vectors or with vectors containing full-length ABCB7, ABCBF or ABCB1 per well were used along with the Transfex ATCC transfection reagent to transfect the Caco-2 Pgp KO (MTOX1001) line. The medium was changed 24 h post transfection and cells were left to grow for a total of 72 h. Cells were transferred from the 6-well plate to 150 mm plates. Cells from one 6-well plate were transferred to two 150 mm plates. At the same time, we started selection with selection antibiotic using the concentration we have chosen for the specific cell line after titration experiment (G418, 500 μg/mL). For clonal selection, the medium was changed every 3 days. An untransfected cell culture control was transferred from a 6-well to 10 cm plate and subjected to the same antibiotic regime. The control was used to confirm the efficacy of selection, as no colonies were formed under these conditions. The selection period lasted for approximately 20 days. The first few clones started to be visible and were ready to be picked up at around 14–15 days. The single clones were transferred to 12-well plates. As soon as a clone in the 12-well plate became confluent it was transferred to a 25 cm2 flask. When the 25 cm2 flask became confluent cells were frozen in two aliquots and a small part was kept for protein extraction.
4.4. Protein Extraction and Western Blot
Cells were lysed in 10 mM of NaCl, 25 mM of HEPES with a pH of 7.5, 2 mM of EDTA and a mammalian protease inhibitor cocktail. After centrifugation, the pellets were solubilized in 100 mM of NaCl, 25 mM of HEPES with a pH of 7.5, mPIC and 1% (w/v) (3-((3-cholamidopropyl)-dimethylammonio)-1-propanesulfonate, (CHAPS)). Samples were then heated at 65 °C for 10 min using loading buffer with mercaptoethanol. Proteins (30 μg per lane) were separated by sodium dodecyl sulfate polyacrylamide gel electrophoresis (SDS-PAGE; 10% gel) and transferred onto nitrocellulose membrane with 0.2 μm of pore size, with a wet transfer of 2.5 h at 250 mA. Non-specific binding sites were blocked by incubation for 60 min in 4% (w/v) dry milk, 1% BSA in TBS, 150 mM of NaCl, and 50 mM of Tris (pH 7.5) at room temperature. The membrane was incubated with primary antibodies a-Pgp C219 (Thermo Fisher Scientific, Waltham, MA, USA, cat. no. MA1-26528) in dilution of 1:200 and beta-actin D6A8 (Cell Signaling Technology, Danvers, MA, USA; cat. no. 8457) in dilution of 1:1000 in TBS containing 0.3% (v/v) Tween-20 overnight at 4 °C. After rinsing the membrane three times with TBST for 15 min each, secondary antibodies conjugated to horseradish peroxidase were incubated for 1 h at room temperature. After rinsing the membrane three times with TBST for 10 min each, signals were visualized with an enhanced chemiluminescence detection system (Supersignal West femto, Thermo Fisher Scientific, Waltham, MA, USA).
4.5. Immunofluorescence
Caco-2 cells were fixed in 4% PFA for 20 min, permeabilized with 0.2% Triton X-100, and blocked in PBS containing 0.2% horse serum. Immunostainings for Pgp and GFP were performed with a mouse monoclonal P-glycoprotein antibody, MA5-13854 (Invitrogen), at a dilution of 1:50 and a rabbit polyclonal a-GFP antiserum 4B10 (Cell Signaling Technology, Danvers, MA, USA; cat. no. 2955) at a dilution of 1:50, in combination with fluorescently labeled secondary antibodies. Images were obtained with an LSM 510 confocal microscope (Zeiss, Oberkochen, Germany).
4.6. Lucifer Yellow (LY) Quantification
Lucifer yellow (LY) quantification was performed by the addition of 75 μL of 60 μM LY solution (in HBSS with 1% DMSO) to the apical side of each well. The plate was incubated at 37 °C with 5% CO2 for 1 h while shaking (40–50 rpm). During incubation, LY 1:3 serial dilutions were made for standard curves, starting with 60 μM and up to 6.7 μM for a high standard curve. For a low standard curve 1 μM was used as a starting concentration and a series of 1:3 dilutions were followed up to 4.1 nM. Three wells of HBSS with 1% DMSO were included as a blank.
Aliquots from the receiver wells (100 μL) and transwell inserts (50 μL) were transferred to solid black plates; the latter were diluted 1:1 in HBSS with 1% DMSO. Fluorescence intensity was measured via a plate reader using an excitation/emission filter set of 480/530 nm. Then the following calculations were made:
4.7. TEER Assay
The integrity of the monolayers was monitored by measuring transepithelial electrical resistance (TEER) before the bidirectional transport experiments using a EVOM3 with STX2-Plus electrode epithelial voltmeter (World Precision Instruments (WPI), Sarasota, FL, USA). The transporter experiment was only conducted on cell monolayers with TEER values above 300 Ω*cm
2 [
20].
4.8. Surface Treatment for Transwell
Transwell membranes were coated with Collagen I (Ibidi, Gräfelfing, Germany) at a surface concentration of 5 μg/cm2. The Collagen I stock was diluted in 17.5 mM of acetic acid to prevent premature polymerization. Each transwell received 100 μL of the collagen working solution and was incubated for one hour at room temperature. Following incubation, the solution was removed and the membranes were washed three times with DPBS. Coated transwells were either used immediately or air-dried overnight at 4 °C. Prior to cell seeding, the treated membranes were equilibrated with cell-specific media for a minimum of 15 min.
4.9. Transwell Assay and Bidirectional Transport
Permeability assays were conducted in triplicate using HBSS buffer supplemented with 10 mM of D-glucose and 20 mM of HEPES. Test compounds, including Rhodamine 123, Rhodamine B (30 μM), Digoxin, Triflumezopyrim, and methyl parathion (10 μM), were prepared in DMSO (final DMSO concentration of <1% v/v).
4.9.1. Plate Washing
Both the basal and the apical compartment were filled with fresh HBSS buffer. Three washing steps were performed with the following incubation times: For the first wash, incubation was performed for 1 min, then the insert was transferred to a clean buffer and the liquids from both compartments were aspirated. The second wash was performed for 1 min and the final third wash was performed for 30 min at room temperature.
4.9.2. Assay Set-Up
For apical-to-basolateral (A to B) transport, 300 μL of working compound solution was added to the donor (apical) compartment, and 800 μL of blank buffer (HBSS + DMSO) was added to the receiver (basal) compartment. For basolateral-to-apical (B to A) transport, 800 μL of working compound solution was added to the donor (basal) compartment, and 300 μL of blank buffer (HBSS + DMSO) was added to the receiver (apical) compartment. At t0 = 0 h, a 50 μL aliquot was collected from the donor compartment to confirm initial donor concentration (C0). After a 2 h incubation (t2), samples were collected from both compartments for analysis. To prepare for quantification, 100 μL from the receiver wells and 50 μL from the donor inserts (diluted 1:1 in HBSS with 1% DMSO) were transferred to solid black plates. Absorption was measured using a SpectraMax M2e photometer at specific wavelength pairs: 498/530 nm (Rhodamine 123), 546/568 nm (Rhodamine B), and 480/530 nm (Lucifer yellow).
4.10. Transwell Data Analysis
Papp values of the test compounds were determined using the following equation: Papp = ΔQ/Δt × 1/A × C0, where ΔQ/\Δt represents the rate of drug transport across the membrane over the 2 h incubation period. A is the surface area of the transwell insert (0.33 cm2 for standard 24-well inserts). C0 is the initial donor concentration in the donor chamber at t = 0.
4.11. LC/MS
4.11.1. Quantitative Determination of Parathion-Methyl-d6
The quantitative determination of Parathion-methyl-d6 was conducted using reversed phase high-performance liquid chromatography (HPLC) with high-resolution Orbitrap mass spectrometry. More specifically, a microbore C18 reverse phase column (2.1 mm × 10 mm, 3 μm particle diameter, Fortis) was used with a mobile phase composed of H2O with 0.1% formic acid (FA) (Solvent A), and acetonitrile with 0.1% FA (Solvent B). The gradient composition was as follows: From 0 min to 7 min, Solvent A decreased from 95% to 20%, whereas Solvent B increased from 5% to 80%; this composition remained constant for another 2 min, i.e., until 9 min. From 9 to 10 min, Solvent A increased from 20 to 95%, whereas Solvent B decreased from 80% to 5%. This composition remained constant for another 3 min prior to the next injection. Mobile phase flow rate was at 200 μL/min, and samples were injected at a volume of 2 μL.
Analyte detection was carried out using a QExactive Plus Orbitrap mass spectrometer (Thermo Fisher Scientific, Bremen, Germany) operating in its targeted single ion monitoring (tSIM) mode at the mass of protonated Parathion-methyl-d6, which has an elemental composition of [C8H4D6NO5P + H]+ and a m/z of 270.0467 ± 0.0015. Adequate mass accuracy was achieved at an Orbitrap resolving power of 140,000. Mass calibration for the mass spectrometer was conducted daily. Standards were prepared at concentrations ranging from 0.1 to 1.0 μm Parathion-methyl-d6 and all samples were diluted accordingly to have their concentrations fall within this concentration range.
4.11.2. Quantitative Determination of Digoxin
The quantitative determination of Digoxin was conducted using reversed phase HPLC with high-resolution Orbitrap mass spectrometry, using a microbore C18 reverse phase column (2.1 mm × 10 mm, 3 μm particle diameter, Fortis) with a mobile phase consisting of H2O with 0.1% formic acid (FA) (Solvent A), and acetonitrile with 0.1% FA (Solvent B). The gradient composition was as follows: From 0 min to 1 min, Solvent A remained at 90%, whereas Solvent B at 10%. From 1 to 3 min, Solvent A decreased to 10%, whereas Solvent B increased from 10% to 90%; this composition remained constant for another 4 min, i.e., until 7 min. From 7 to 8 min, Solvent A increased from 10 to 90%, whereas Solvent B decreased from 90% to 10%. This composition remained constant for another 3 min until the next injection. Mobile phase flow rate was at 200 μL/min, and samples were injected at a volume of 2 μL.
Digoxin detection was carried out using the QExactive Plus Orbitrap mass spectrometer operating in full MS mode, scanning from 770 to 820 m/z. Digoxin, which has an elemental composition of C41H64O14, was detected as [C41H64O14 + Na]+ with m/z of 803.4188 ± 0.0025. Adequate mass accuracy was achieved, operating at an Orbitrap resolving power of 140,000. Mass calibration for the mass spectrometer was conducted daily during this analysis.
Standards were prepared at concentrations ranging from 0.1 to 1.0 μm Digoxin and all samples were diluted accordingly in order to have their concentrations fall within this linear response range.
4.11.3. Quantitative Determination of Triflumezopyrim
The quantitative determination of Triflumezopyrim was conducted as described above for Digoxin.
Triflumezopyrim (C20H13F14N4O2) detection was carried out using the QExactive Plus Orbitrap mass spectrometer operated in parallel reaction monitoring (PRM) mode with m/z 399.11 being the precursor ion with a 1 m/z isolation window. Fragmentation was carried out in the higher-energy collision dissociation (HCD) at a ce of 27. The reaction product ions were 279.0737 ± 0.0030 and 121.0398 ± 0.0030. Adequate mass accuracy was achieved, operating at an Orbitrap resolving power of 140,000. Mass calibration for the mass spectrometer was conducted daily.
Standards were prepared at concentrations ranging from 0.1 to 1.0 μm Triflumezopyrim and all samples were diluted accordingly to have their concentrations fall within this linear response range.
4.12. Statistical Analysis
All quantitative data are expressed as mean ± standard deviation (SD) from three independent experiments (n = 3). Statistical analyses were performed using GraphPad Prism software (Version 10.0, GraphPad Software, San Diego, CA, USA). Differences between groups were evaluated using a one-way analysis of variance (ANOVA) followed by Tukey’s multiple comparison post hoc test to compare means across all groups. A p-value of <0.05 was considered statistically significant.



 ,
,