1. Introduction
Genome-Wide Association Studies (GWAS) are a firmly established approach for identifying genomic regions that are statistically significantly associated with specific complex and quantitative traits as well as with common disease risk factors in large population case–control studies. A hallmark of this approach is the statistical analysis of the genotypes of all known genetic variants, typically single-nucleotide polymorphisms (SNPs), in the genome of every individual in the case and control cohorts. This analysis identifies variants significantly associated with the phenotype of interest and thereby highlights genomic regions that may influence the phenotype through genes or the regulatory sequences located within those regions.
A SNP significantly associated with a trait pinpoints a region, characterized by linkage disequilibrium (LD) with nearby variants, which harbors a functional variant. However, the proportion of significant disease-associated SNPs that localizes to protein-coding gene sequences is well under 5% [
1], as is expected, given that protein-coding sequences comprise a mere 1.5% of the human genome [
2]. The non-protein-coding nature of the majority of significantly disease-associated variants implies that some of them may reside in long non-coding RNA (lncRNA) genes [
3], whereas others may point to enhancers and other non-coding regulatory sequences that modulate the activity of nearby or distant genes [
4]. A common methodological constraint of most published GWAS-based functional annotation studies is their emphasis on protein-coding genes nearest to the significant variants, which disregards the functional potential of non-coding RNA (ncRNA) genes that may encompass, or be closer to, those variants [
5]. Intergenic variants identified by GWAS are automatically assigned by conventional annotation pipelines to the closest protein-coding gene, frequently perpetuating the incorrect assumption that the closest protein-coding gene, rather than a non-coding gene or regulatory element nearer the actual SNP, is responsible for the phenotype that is significantly associated with that variant. In many cases, especially when the nearest gene is far from the GWAS variant and is separated from the variant by linkage disequilibrium breakpoints, this is likely an incorrect interpretation [
6].
The GWAS paradigm has a lengthy history of identifying genetic variants associated with obesity. An in silico strategy has pinpointed non-coding RNA, in particular microRNA (miRNA)-driven, polymorphisms in obesity. Analyzing genetic variation within miRNA binding sites of mRNA target 3′ untranslated regions identified in GWAS highlighted specific miRNA-mRNA interactions potentially relevant to obesity [
7].
The Encyclopedia of DNA Elements (ENCODE) Consortium, through its Gencode human gene catalog [
8], canvassed all protein-coding and all micro and macro ncRNA genes, and has been central to the discovery of new regulatory mechanisms [
9]. Prior to ENCODE, the FANTOM (Functional Annotation of Mammalian cDNA) Consortium determined that mammalian genomes harbor a greater number of non-coding than coding genes [
10], many of which are primate-specific [
11]. These findings provide a rationale for examining gene structures at human body mass index (BMI)-associated GWAS loci with evolutionary tools capable of highlighting evolutionary novelties. Annotating GWAS loci without restrictive assumptions about conservation can facilitate the discovery of evolutionarily new mechanisms, yield hypotheses for follow-up validation studies, and provide insight into new drivers of old complex traits. Because elevated BMI is closely linked to obesity, diabetes, and broader metabolic dysregulation, these loci may also have implications beyond adiposity. Glucagon-like peptide-1 (GLP1) receptor agonists, the current first-line drugs for diabetes and obesity, have also been shown to delay aging in animal models (Poupon-Bejuit et al. [
12]). These findings point to the interplay of diabetes risk and longevity, as well as to unanticipated benefits of established diabetes drugs such as metformin, which attenuates virus-induced cellular senescence (VIS) in COVID-19 patients [
13]. Severe COVID-19 outcomes are consistently positively correlated with obesity and elevated BMI [
14,
15,
16]. Therefore, COVID-19 severity serves as an additional correlate and associative measure of BMI-related biology.
Obesity and adiposity are distinct yet interconnected complex traits. Obesity, commonly assessed using BMI, is associated with cardiometabolic disease, premature mortality, dyslipidemia, metabolic syndrome, diabetes, cardiovascular disease, and stroke [
17,
18,
19,
20]. There is a substantial genetic component to both obesity and adiposity risk [
21]. But lifestyle and socioeconomic factors also shape risk. This condition is a mounting global challenge that constitutes a substantial portion of the worldwide economic and social burden of common non-communicable diseases [
22]. Their public health burden continues to rise globally, including in China, India and the United States [
22,
23,
24,
25,
26,
27].
Because high BMI intersects with metabolic dysregulation, diabetes, and severe COVID-19 outcomes, BMI-associated loci may also illuminate broader immune–metabolic interfaces [
14,
15,
16]. This reinforces the need for molecular, mechanism-driven interpretation of obesity-associated variation. GWAS has pinpointed numerous variants significantly associated with BMI. Locke et al. [
28] reported 94 BMI-associated variants in 339,244 individuals, and subsequent analyses linked genes near these loci to central nervous system tissues involved in hunger, reward, and energy balance [
28,
29,
30,
31]. The same loci were enriched for promoter, histone, and enhancer marks in neuronal tissues, indicating that regulatory mechanisms may contribute substantially to human adiposity [
28].
Despite these advances, little is known about the underlying putative functional elements. The overwhelming majority of the significant BMI-associated SNPs identified in the Locke et al. GWAS is in non-coding regions [
28]. Of the 94, only two were annotated as missense variants in the exons of protein-coding genes, and an additional one as an exonic synonymous variant. The first two post-genomic decades have revealed that non-protein-coding sequences, including non-coding RNA genes as well as regulatory elements outside of genes, are of seminal regulatory significance [
5,
32]. Nonetheless, these have never been systematically examined genome-wide in the context of BMI. Our study addresses the potential functional roles of non-coding variants by identifying those that putatively contribute or appear likely to contribute to BMI etiology through an assessment of their regulatory potential within the associated loci.
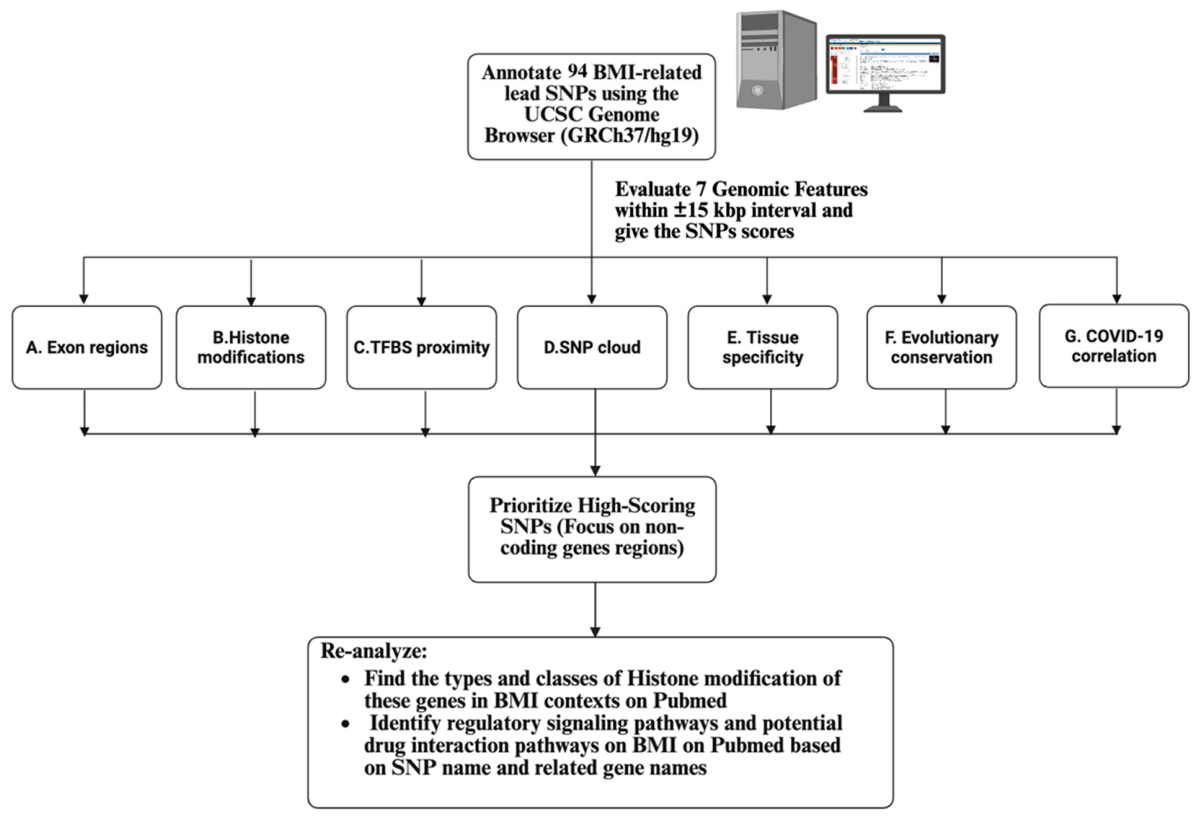
Here, we undertake a comprehensive examination of the BMI-associated genomic regions from Locke et al. [
28], using the UCSC Genome Browser resources [
33], ENCODE, the Epigenome Roadmap, GTEx, FANTOM5, and other published transcriptomic, and epigenomic datasets. Our approach emphasizes the transcriptomic and epigenetic properties of heretofore-ignored non-coding sequences that encompass, or positionally precisely overlap, polymorphisms showing statistically significant genetic risk association with BMI, helping to elucidate the biological meaning of those GWAS-pinpointed variants to an extent that reliance on protein-coding genes cannot accomplish.
2. Results
2.1. Identification of lncRNA-Associated SNPs
In our integrative analysis of 94 BMI-associated SNPs, we identified six as residing within lncRNA genes: rs2245368 and rs2033529 (exonic); as well as rs2836754, rs2815752, rs17203016, and rs7239883 (intronic), sorted in descending order of evaluation scores (
Supplementary Table S2). We prioritized these intragenic variants because SNPs located within lncRNA gene bodies may have more direct functional relevance than variants located only near non-coding regulatory elements, consistent with our previous study of lncRNA-associated variants in common metabolic diseases [
34]. These six variants were therefore selected for further genomic, epigenomic, transcriptomic, and evolutionary annotation.
2.2. Genomic and Epigenomic Annotation of BMI-Associated Genetic Variants
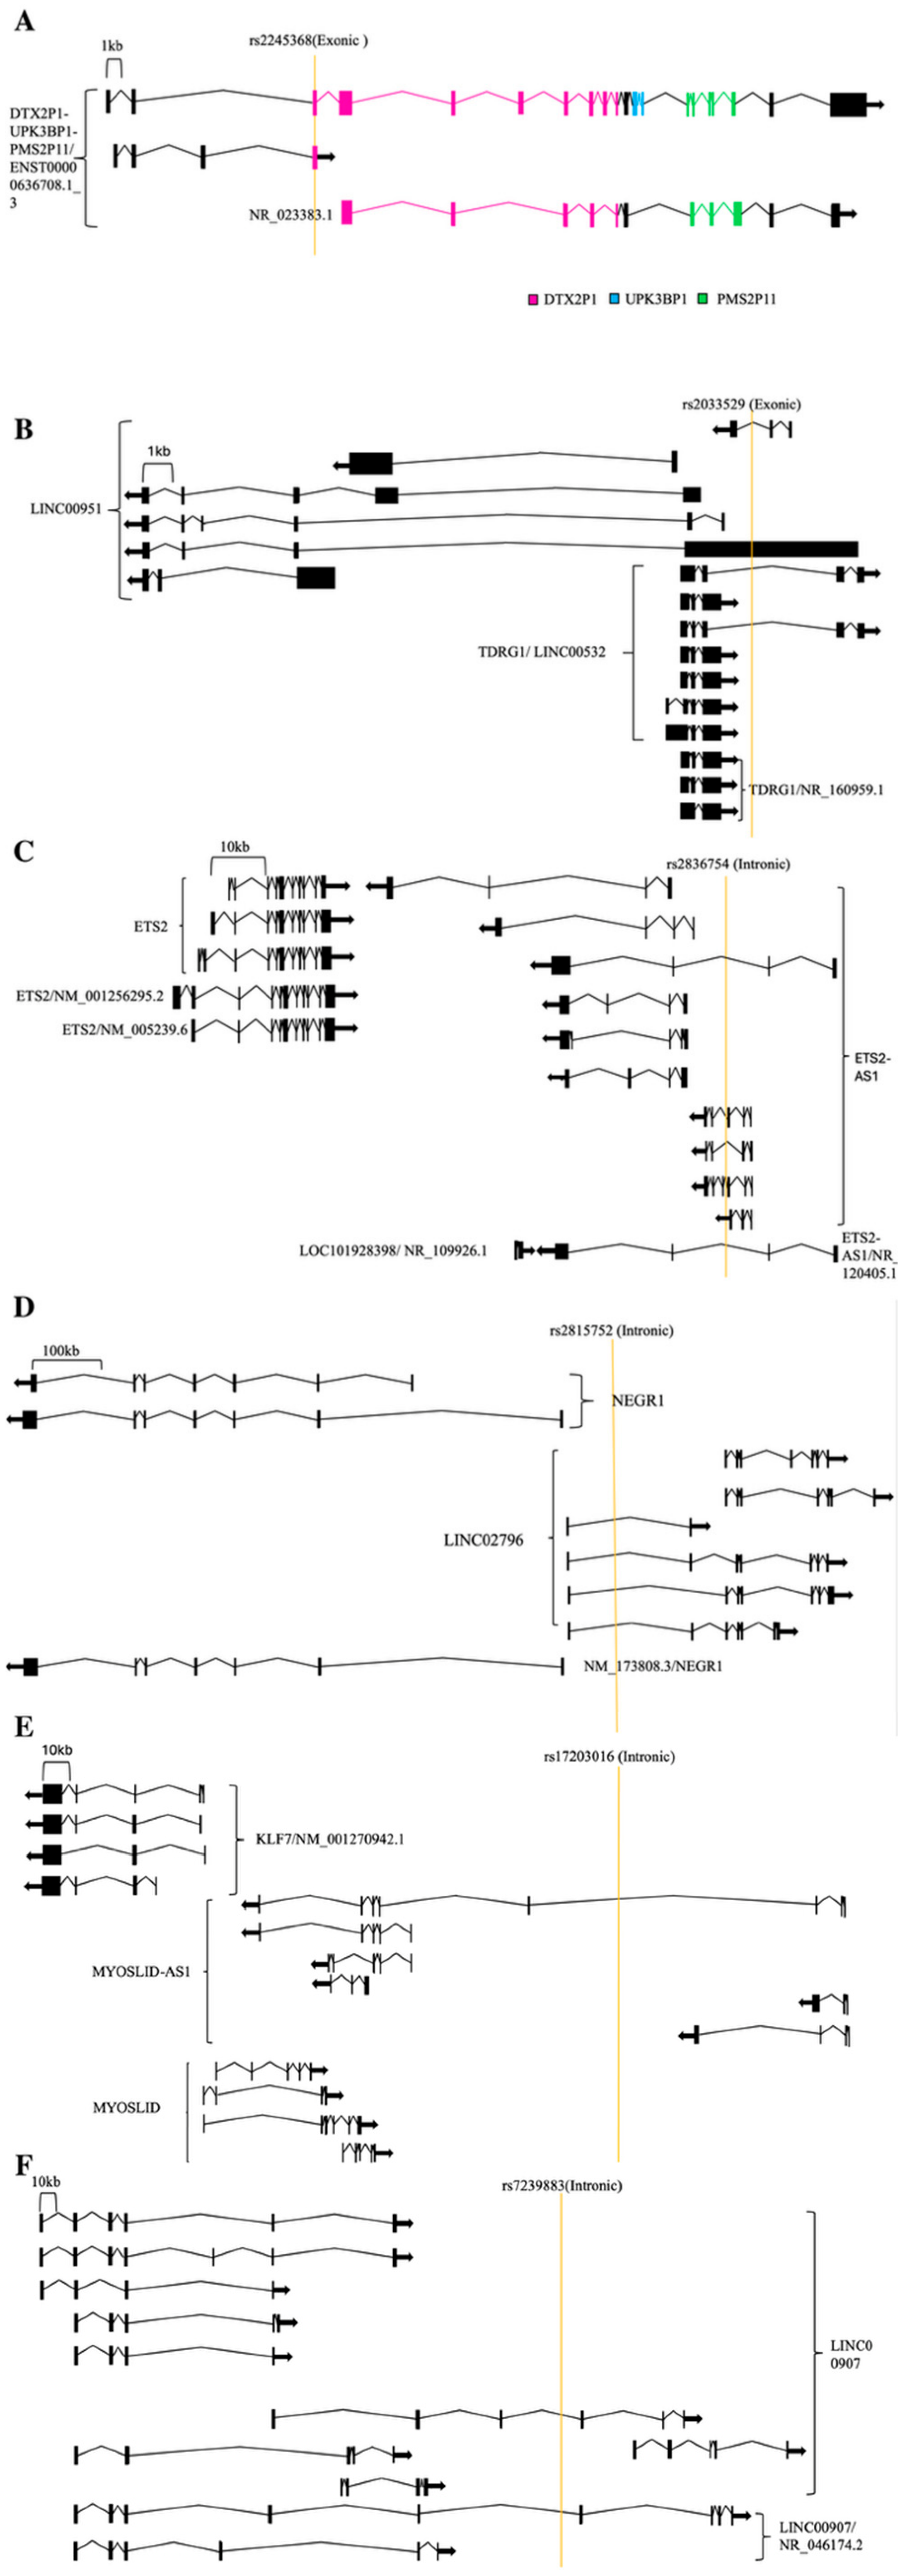
The six lncRNA-intragenic significant BMI-associated SNPs were annotated based on their genomic position, because SNPs in exons of a gene are more likely to point to the direct functional impact of that gene on the phenotype under analysis. The variant rs2245368 was located in an exon of
DTX2P1. This exon is a part of the intergenically spliced transcriptional unit
DTX2P1-UPK3BP1-PMS2P11, which is comprised of three transcribed pseudogenes. A large number of SNPs were observed in
DTX2P1-UPK3BP1-PMS2P11 that were mostly associated with BMI and related traits such as body weight and metabolic syndrome, although the relatively low density of and large spacing between the SNPs did not satisfy our definition of a SNP cloud (
Figure 1). The BMI-associated SNP rs2033529 was located in an exon of the lncRNA gene
LINC00951 and, due to the multiple overlapping genes at this locus, simultaneously resided in an intron of another lncRNA gene (
TDRG1/
LINC00532).
The SNPs rs2836754, rs2815752, rs17203016, and rs7239883 are intronic within the lncRNA genes
ETS2-AS1,
LINC02796,
MYOSLID-AS1, and
LINC00907, respectively. The functional role of the lncRNA
MYOSLID-AS1 (an uncharacterized transcriptional unit that overlaps another lncRNA gene,
MYOSLID, in the antisense orientation) remains largely uncharacterized. This lncRNA gene harbors SNPs associated with systolic blood pressure, sex hormone-binding globulin levels, body height, BMI, and metabolic syndrome. The lncRNA
MYOSLID, the other member of this sense–antisense lncRNA pair, amplifies the vascular smooth muscle differentiation program in a serum response-dependent manner [
35].
The lncRNA ETS2-AS1 contains a cluster of SNPs significantly associated with heel bone mineral density, prostate-specific antigen amount, bone fracture, and BMI. The adjacent ETS2 gene encodes a protooncogene involved in the regulation of telomerase. Lastly, BMI SNP-containing LINC02796 and LINC00907 are novel lncRNAs from high-throughput transcriptome and annotation projects that lack any functional characterization in the literature.
In addition to these six SNPs in lncRNA genes, we considered all SNPs annotated as intronic and intergenic. Among the 94 SNPs, only 3 were located in exons of protein-coding genes, consistent with the known rarity of protein-coding variants in GWAS data [
1]. In contrast, 43 SNPs (the prevalent class) were located in the introns of protein-coding genes, while 42 resided in intergenic regions.
- b.
Epigenomic evidence
Of the 94 loci, 16 had the signal in the Deoxyribonuclease I (DNase I) Hypersensitivity Clusters Track (
Supplementary Table S1), a widely used proxy for open-chromatin regulatory elements including promoters, enhancers, and insulators. We also considered promoter and enhancer histone modification signatures. Only one SNP, rs9374842, resided within a peak for H3K4Me1 in ChIP-seq data from normal human embryonic kidney cells, but there was no peak at the same genomic location for H3K27Ac, the other enhancer-associated epigenetic modification. None of these 94 loci had a signal for H3K4Me3 in ENCODE ChIP-seq data, meaning that there are probably no previously uncharacterized promoters in this SNP set. The clear, above-background, visually apparent H3K4Me1 ChIP-seq peak in the ENCODE Regulation track of the UCSC Genome Browser corresponding to this SNP is illustrated in
Supplementary Figure S1 as an example of how we implemented visual peak calls.
2.3. Transcription Factor Binding Sites (TFBS)
ENCODE TFBS ChIP-seq data showed that, from amongst the 94 loci, 7 had a signal in the ENCODE 338 TFBS track, and 5 of those 7 also had a signal in the ENCODE 161 Consensus TFBS track. All seven SNPs that reside within ENCODE TFBS ChIP-seq signals are intergenic. The variant rs7599312 was informative for two of the seven annotation criteria. In ENCODE ChIP-seq TFBS data, two transcription factors (CTCF and RAD21) bind to the immediate genomic DNA region containing this SNP, and one transcription factor (CTCF) was also identified in the ENCODE 161 Consensus TFBS track (
Supplementary Table S1). The variant rs2176040 was, similarly, informative for two of the seven features, but only one transcription factor (FOXP1) binds the immediate 501-bp genomic DNA interval containing this SNP in the ENCODE 338 dataset, with no transcription factor binding identified in the ENCODE 161 Consensus track. FOXP1 controls adipocyte differentiation [
36], suggesting a possible direct relationship of this binding event to BMI. In contrast, rs13201877 was also informative for only two of the seven features, but notably, numerous transcription factors bound its genomic interval in ENCODE, strongly suggesting a regulatory role or a potential super-enhancer signature, and multiple transcription factors were also identified at this locus in the ENCODE 161 Consensus TFBS track, further supporting its regulatory potential (
Supplementary Table S1). The variant rs1928295 had one transcription factor (GATA2) binding its immediate genomic interval in ENCODE ChIP-seq, and GATA2 was also identified in the ENCODE 161 Consensus TFBS track; GATA2 is an immunomodulator implicated in adipocyte differentiation and obesity-related pathways (
Supplementary Table S1) [
26,
37]. The variant rs3888190 had multiple transcription factors binding its genomic interval in the ENCODE 338 dataset, and one transcription factor (MAFK) identified in the ENCODE 161 Consensus TFBS track (
Supplementary Table S1). Similarly, rs7164727 has multiple transcription factors binding within its genomic interval in the ENCODE 338 dataset, and one transcription factor, TEAD4, identified in the ENCODE 161 Consensus TFBS track; TEAD4 has been reported to repress adipogenesis (
Supplementary Table S1) [
26].
2.4. SNP Clouds
Among the 94 BMI-associated index SNPs, seven had at least one additional significant GWAS variant within 501 bp: rs2815752, rs1514175, rs2867125, rs205262, rs1558902, rs9914578, and rs2075650. However, three of these loci did not meet our definition of a BMI-relevant SNP cloud because their neighboring variants were associated with phenotypes not directly related to BMI. Specifically, rs939582 and rs2867124 near rs2867125 were associated with cigarette smoking; rs2744977 near rs205262 was associated with male-pattern baldness; and rs9914577, rs71902577, and rs539275859 near rs9914578 were associated with immune cell counts. Therefore, four index SNPs met our predefined criterion for inclusion in a BMI-relevant SNP cloud: rs2815752, rs1514175, rs1558902, and rs2075650.
Among the six lncRNA-intragenic SNPs, only rs2815752 met our definition of residing in a SNP cloud. The other SNPs near this index SNP include rs2815753, which is associated with body surface area, and rs2568960, which is associated with depression as well as with insomnia and other sleep disturbances potentially contributing to anxiety, weight gain, diabetes, and cardiometabolic disease progression. This suggests potential for the lncRNA gene LINC02796, which harbors this SNP, to be a direct susceptibility determinant for those conditions. Histone modification patterns and TFBS occupancy in the genomic region containing this SNP indicate tissue-specific regulatory activity, particularly in skeletal muscle, liver, and brain.
Select intronic SNPs in protein-coding genes, such as
ZC3H4 (rs3810291), indicate putative functional potential through regulation by antisense RNAs and super-enhancers, linking transcriptional control to adipogenesis and inflammation [
38]. The 48 SNPs that are located in coding-gene introns and in intergenic regions but have compelling evidence of transcription factor binding and/or histone modifications in ChIP-seq data may influence adiposity by modulating chromatin accessibility, TF binding, and gene expression, collectively shaping gene regulatory networks that impact metabolic traits. The prevalence of histone modifications and TFBS occupancy in BMI-related tissues reinforces the functional significance of these variants and supports their prioritization for experimental validation.
2.5. Tissue Expression and Cell Type Specificity
The lncRNAs containing intragenic BMI SNPs are, intriguingly, mostly expressed in tissues related to BMI. The SNP rs2245368 is located in an exon of the intergenically spliced transcribed pseudogene DTX2P1-UPK3BP1-PMS2P11, which is expressed in metabolic tissues and organs such as fat, small intestine, and stomach, potentially indicative of a connection with BMI regulation. In GTEx RNA-seq data (Release V8), DTX2P1-UPK3BP1-PMS2P11 was also expressed in tissues related to BMI, such as fat, bladder, small intestine, spleen, and stomach. The expression profile of the intergenically spliced DTX2P1-UPK3BP1-PMS2P11 TU, but not of any of its three component pseudogenes, is suggestive of BMI regulation relevance.
The BMI-associated SNP rs2033529 resides in an exon of the lncRNA LINC00951, but its GTEx coverage did not include BMI-relevant tissues or organs, a common expression scenario we witnessed for other SNPs as well. To address this, we established a new scoring criterion: in cases where GTEx is unavailable or uninformative, we examined the EST (Expressed Sequence Tag) track and full-length cDNA (Genbank mRNA) tracks of the UCSC Genome Browser for evidence of transcripts demonstrating overall genomic footprint matching, including exonic overlap and directional consistency, to the lncRNAs’ RefSeq and Gencode reference transcript models. A score of 0.2 was assigned if there was evidence of overlap with either ESTs or cDNAs, while fulfillment of both criteria resulted in a score of 0.5. For LINC00951, ESTs and cDNA libraries yielded a 0.5 score because of their concordance. The SNP rs17203016 resides within MYOSLID-AS1, a testis-specific lncRNA, and thanks to EST support, was scored 0.2. The SNP rs2836754 is intronic to ETS2-AS1, which has liver-specific expression and links to metabolic and bone traits, and has mRNA support but no ESTs (0.2). The SNP rs2815752 is within LINC02796, near a SNP cloud containing additional variants significantly associated with insomnia and obesity (the former being a well-known risk factor for the latter), and has cDNA and EST support, but lacks GTEx data (score 0.5). Finally, rs7239883 in LINC00907 shows liver-specific expression and strong conservation across vertebrates and has only mRNA support (score 0.2). In total, of the original 94 SNPs, 52 SNPs’ nearest or overlapping genes have available GTEx data.
GTEx lacks tissue expression data for certain SNPs’ nearest or overlapping genes. To validate the tissue-specific expression signals inferred from EST and cDNA datasets, we examined whether additional relevant tissues, not captured by previous approaches, could be identified. Among all 94 SNPs, 59 SNPs’ nearest or overlapping genes have FANTOM Consortium promoterome data in the ZENBU Browser [
39,
40], and most of their FANTOM expression profiles were consistent with those inferred from GTEx, EST, and cDNA data wherever those were available.
In total, 59 SNP-containing genes and TUs were analyzed in FANTOM5 Cap Analysis of Gene Expression transcription start site activity data in approximately 1000 cell lines and tissue types (“human hg19 promoterome”) to characterize their promoter activity across a diverse range of tissue types, developmental stages, and cell lineages, including both normal and cancerous samples. It is noteworthy that 9 promoters of genes nearest to or overlapping BMI SNPs exhibited high expression in adipose tissue cells, including mature adipocytes and preadipocytes, which strongly implicates these genes in obesity and BMI regulation, validating our approach of searching for the overlapping or nearest genes and TUs of BMI-associated SNPs and considering these as direct causal candidates regardless of their protein-coding capacity. The screen also revealed that brain regions, specifically substantia nigra—adult, donor10196 (6 occurrences) and optic nerve, donor1 (5 occurrences), along with hematopoietic cell lines, common myeloid progenitors (CMP), donor and neutrophil (PMN), donor1 (each with 4 occurrences), were seen most frequently in the transcriptome data for these BMI SNPs’ nearest genes, appearing more than three times. Substantia nigra is central to drug abuse and dopamine pathways that may be common to drug and food addiction.
For the intergenically spliced transcribed pseudogene which harbors the SNP rs2245368, FANTOM data from the 5′-most TSS indicates expression in epithelial and secretory tissues, including bronchial, tracheal, esophageal and corneal epithelial cells, as well as lipid cells and eosinophils. This extensive distribution highlights the potential role of this variant in maintaining the integrity of the epithelial barrier and the immune interaction on the mucosal surface. Several of these tissues, such as the trachea and esophagus, are also supported by expression data from GTEx (esophagus, salivary gland) and EST (trachea) datasets, indicating independent validation of this lncRNA’s top-expressor tissues with cross-platform consistency.
The SNP rs2033529 resides in a sense–antisense pair of lncRNA genes: TDRG1—LINC00951. There is no FANTOM5 expression data for TDGR1. In the FANTOM5 promoterome, LINC00951 was expressed in adult testis in multiple samples and in various cancer-derived cell lines, including pagetoid sarcoma, adult T-cell leukemia (ATN-1), chondrosarcoma (SW 1353), and chronic myeloid leukemia (K562), which are confirmed by ENCODE data. This expression profile indicates potential roles in germline and malignant environments and may reflect the regulatory flexibility of proliferation and differentiation-related pathways. Importantly, GTEx, EST and cDNA data all supported expression in the testis, again providing strong cross-validation.
The FANTOM5 promoterome of ETS2-AS1, the lncRNA gene that contains the significant BMI-associated SNP rs2836754, shows that it is widely expressed in mesenchymal cell types, including liver, umbilical and adipose-derived mesenchymal stem cells, as well as differentiated cell populations such as subcutaneous adipocytes, aortic smooth muscle cells and cardiac fibroblasts. Additional activity was detected in myeloid progenitor cells, granulocyte–macrophage progenitor cells and chondrocytes, highlighting their potential role in matrix and hematopoietic differentiation [
41]. GTEx supports liver expression of this lncRNA, while cDNA data shows that it is also present in the brain; both are relevant to BMI, the former metabolically and the latter through behavioral aspects of addiction to high-calorie diets.
The variant rs2815752 belongs to the gene pair LINC02796-NEGR1, which has a shared tissue expression, due to its shared bidirectional promoter. FANTOM data shows transcriptional activity in connective tissue and structural cell types, including Achilles tendon, nucleus pulposus, lymph fibroblasts, aortic endothelial cells and chorionic cells, suggesting a role in musculoskeletal and vascular regulation. Other signals were observed in cancer cell lines such as DJM-1 (malignant papillary cyst), PC-14 (lung adenocarcinoma), ECC4 (gastrointestinal cancer), and hematopoietic malignancies (T-CLL series SKW-3), emphasizing the possible association with proliferation dysregulation. EST/cDNA data indicated expression in normal embryonic tissues as well.
Transcriptome data for the lncRNA MYOSLID-AS1 (containing the significant BMI-associated SNP rs17203016) highlights the hematopoietic and immune systems. FANTOM data shows that its transcriptional activity spans multiple myeloid lines, including eosinophils, neutrophils, mast cells, promyelocytes/myeloid cells, and common myeloid progenitor cells, indicating a possible role in granulocyte differentiation and innate immune regulation. Consistent with this, GTEx detected expression of this lncRNA in whole blood.
The expression profile of LINC00907, containing the BMI variant rs7239883, points mainly to cancer. FANTOM data revealed transcriptional activity in retinoblastoma, medulloblastoma, and small cell lung cancer cell lines, highlighting neuroectoderm and neuroendocrine tumors.
FANTOM5 promoterome data demonstrates that BMI SNP-containing lncRNAs and transcriptional units often exhibit distinct expression patterns in metabolic and regulatory tissues, such as adipose tissue, liver, and specific brain regions. These results suggest that a subset of these lncRNAs is expressed in tissues relevant to BMI regulation, supporting their potential roles as functional mediators of obesity-associated genetic risk.
Taken together, FANTOM5 and GTEx results demonstrate that the majority of our prioritized lncRNAs are expressed in metabolically relevant tissues and immune-related biological contexts. By integrating these datasets, our approach accounts for cell-type specificity across multiple BMI-relevant tissues, including adipose, liver, brain, and the immune system, thereby supporting the potential roles of these non-coding transcripts as functional mediators of obesity-associated genetic risk.
2.6. Evolutionary Conservation
The six lncRNA-intragenic SNPs exhibited varying degrees of evolutionary conservation among species. At the SNP rs2245368, the human C allele was observed in all reference assemblies of non-human primates that possess the orthologous sequence fragment. At this locus, T is the risk allele in humans, with its prevalence varying by population. If a human disease-associated allele of a variant was not found as the reference assembly in any closely related species, in a locus that is highly conserved, then the allele is more likely to be disease-causative, and the SNP may contribute to the susceptibility to the associated disease or trait [
42]. By this logic, the apparently human-specific T allele at this locus is a disease candidate. However,
Supplementary Table S1 shows that the T allele is also present in both Neanderthals and Denisovans, indicating that it is not modern-human-specific but instead arose earlier in hominin evolution.
For instance, the rs9540493 locus exhibits a high degree of evolutionary conservation, with the ancestral A allele—the risk allele for high BMI in modern humans—being fixed across Neandertals, Denisovans, and both primate and non-primate mammalian species. We conclude that the ancestral-state variant, which presumably did not cause disease in the common ancestor, any nonhuman primate species, or ancient humans (Denisovans and Neanderthals), is now associated with disease risk in modern humans.
At rs2033529, in most non-human primates, the reference assembly base is A, whereas in humans, the locus harbors an A/G polymorphism, but the risk allele is not consistently reported, as approximately equal numbers of Genome-Wide Association Studies indicate the disease risk allele to be A or G. Both alleles are observed in Neanderthals and Denisovans, demonstrating that this polymorphism was already established before the divergence of modern and archaic human lineages (
Supplementary Table S1).
For rs17203016, in all reference assemblies of non-human primates, the reference base is A, while in humans, the locus is A/G polymorphic, but the risk allele is also not consistently reported in GWAS. We designated G as the risk allele based on the number of distinct published GWAS stating it as such (per the NHGRI-EBI GWAS Catalog track of the UCSC Genome Browser), although the number of GWAS supporting A as the risk allele was only one fewer. The presence of both alleles in Neanderthal and Denisovan genomes suggests that this variation reflects an ancestral hominin polymorphism rather than a modern human-specific mutation (
Supplementary Table S1).
Most non-human primates have C as the reference base at the location orthologous to the SNP rs2836754, where a C/T variant resides in humans, and the risk allele differs between populations.
Supplementary Table S1 indicates that the T allele is also observed in Neanderthals and Denisovans, indicating that it arose prior to the divergence of modern and archaic humans.
For the SNP rs2815752, all non-human primates exhibit G as the reference base at the orthologous genomic location, whereas humans have an A/G variant, with A as the major risk allele. Consequently, A is likely the pathogenic allele, based on published assumptions [
42]. This A allele is also present in Neanderthals and Denisovans, indicating that it is not unique to modern humans (
Supplementary Table S1).
Finally, for the SNP rs7239883, all 100 analyzed vertebrate sequences exhibit a G as the reference base at this highly conserved locus. In humans, the variant is an A/G polymorphism, but the risk allele is not uniformly defined as it varies by population. It is not uncommon for risk alleles to lack uniform definition, because of subpopulation specificity of genetic risk as well as other phenotypes or diseases linked to the same variant in the index population or other populations.
Supplementary Table S1 shows that both alleles are present in Neanderthals and Denisovans, indicating that this polymorphism is shared across hominin lineages.
In
Supplementary Table S1, we list all the sample information of these 94 SNPs from UCSC’s NHGRI-EBI GWAS track, including ethnicity and the corresponding risk allele, and select the risk allele with the largest number of samples as the major risk allele, wherever that is possible. We analyzed the conservation of each BMI disease risk allele in modern humans, Neanderthals, Denisovans, non-human primates, and non-primates. The results indicated that the alleles of these disease-related SNPs were highly conserved across these organisms, because 40 of them have the same alleles in modern humans, Neanderthals, Denisovans, non-human primates, and non-primates. In total, 75 SNPs had their human risk allele as the reference genome assembly base in at least some of the non-primates. For ten SNPs, the human risk allele was only present in modern humans. Four SNPs had the human risk allele as the reference assembly sequence in at least some nonhuman primates (but not in any non-primates). A further five SNPs had the human risk allele detectable in Neanderthals and Denisovans, but not in any nonhuman species extant today, indicating that the appearance of the risk allele pre-dated the origin of ancient humans, and that the risk allele was not unique in modern humans in these cases.
2.7. COVID-19 Associations
The six lncRNA-intragenic SNPs exhibited varying extents of overlap with COVID-19 GWAS v4 tracks, suggesting potential pleiotropic effects related to immune or metabolic regulation. The SNPs rs2245368, rs17203016, and rs2815752 each showed protective (negative) associations with COVID-19 severity and hospitalization in 3 out of 4 sub-tracks and harmful/positive associations in 1, indicating a possible dual role in host susceptibility. The variants rs2033529 and rs2836754 also demonstrated mixed signals across the tracks. In contrast, rs7239883 was not associated with COVID-19 severity. These overlaps point to a shared regulatory landscape between metabolic traits and immune response to viral infection. Non-lncRNA BMI SNPs also contributed to COVID-19 susceptibility. A prime example is rs1928295, predicted to play a key role in the regulation of GATA2. This is supported by clinical evidence, as GATA2 haploinsufficiency has been implicated as a potential underlying factor in critical COVID-19 pneumonia [
43]. Among the 94 SNPs, only 13 had no COVID data, while most of the SNPs with four tracks had protective or negative results. This is surprising because high BMI is a positive correlate of COVID-19 severity.
2.8. High-Scoring Intergenic and Intronic SNPs
Beyond SNPs residing in lncRNA genes, our analysis identified a subset of high-scoring SNPs of particular interest within intergenic and intronic regions. For instance, the intronic SNP rs1928295 (score: 3) presents compelling evidence of residing within a functional regulatory element. ENCODE DNase I hypersensitivity data reveals that this locus is a site of open chromatin in 3 of 125 cell types, a restricted pattern of chromatin accessibility indicating potential cell-type specificity.
Further support for its regulatory function is provided by TFBS predictions. The ENCODE 338 TFBS track identified nine TFs with predicted binding at this locus: GATA2 (Cluster Score: 869/1000), CTCF (196/1000), RCOR1 (378/1000), GATA3 (552/1000), RFX5 (213/1000), RFX1 (33/1000), MXI1 (250/1000), EP300 (249/1000), and RAD21 (65/1000). To enhance confidence in these predictions, we cross-referenced this locus with the more stringent ENCODE 161 Consensus TFBS track. This consensus analysis corroborates the binding of three key TFs: GATA2 (Cluster Score: 1000/1000), CTCF (159/1000), and GATA3 (363/1000). The high-confidence DNase I hypersensitive site (DHS) that overlaps with TFBS predictions, and the high and concordant scores for GATA2 across both the ENCODE 338 (869) and the consensus 161 (1000) tracks, suggest that rs1928295 resides within an active, cell-type-specific regulatory element that is functionally bound by the GATA2 transcription factor. As GATA2 suppresses adipogenesis while activating vascular cells, its inhibition may represent as a novel strategy to reduce obesity-induced inflammation and avert downstream complications such as diabetes and plaque rupture [
44].
The intergenic SNP rs7164727 (score 3) falls within clusters in 4–8 of 125 cell types in ENCODE DNase I hypersensitivity (open chromatin) data. The ENCODE 338 TFBS ChIP-seq track demonstrates the binding of nine TFs at this locus, including ELF1 (ENCODE TFBS cluster score 61/1000), FOS (181/1000), GATA3 (741/1000), CREB1 (234/1000), and NFE2L2 (634/1000). Additionally, the ENCODE 161 Consensus TFBS ChIP-seq track indicates TEAD4 binding (290/1000). Among these, GATA3, NFE2L2, and TEAD4 exhibit the highest scores.
NFE2L2 is a major anti-inflammatory marker, and a variant in this gene modifies the adverse impact of obesity on heart rate variability [
45]. Being overweight is associated with elevated inflammatory markers and autonomous nervous system imbalance. In adipogenesis, multiple transcription factors cooperatively regulate the expression of the PPARG2 gene, a critical step in adipocyte differentiation. Specifically, TEAD4 enhances the occupancy of glucocorticoid receptors (GR) and C/EBPβ at the hotspot region of the PPARG2 promoter, thereby promoting key regulatory events in early adipogenesis [
46].
2.9. CeRNA Network Analysis
Within the well-established competing endogenous RNA (ceRNA) regulatory framework [
47], lncRNAs bind specific miRNAs (through complementary base pairing) to prevent them from downregulating their cognate mRNA targets. Since we prioritized several lncRNA genes that had been previously overlooked as potential contributors to BMI etiology despite containing GWAS significant BMI variants, we tested the hypothesis that these lncRNAs may act as ceRNAs. This would offer a plausible mechanistic explanation for how these non-coding variants exert trans-regulatory effects on distal BMI-related genes.
We investigated the ceRNA crosstalk between SNP-associated lncRNAs and protein-coding genes. Based on predictions from LncBase v3 and TargetScan, we initially identified a broad set of lncRNA–miRNA–mRNA triplets (
Supplementary Tables S3–S5). To characterize the broader regulatory landscape, we first constructed a global ceRNA network using Bgee expression data, retaining components only if their expression scores exceeded 60 in at least one common human tissue. This exploratory model yielded 109 tissue-supported triplets (
Supplementary Figure S1).
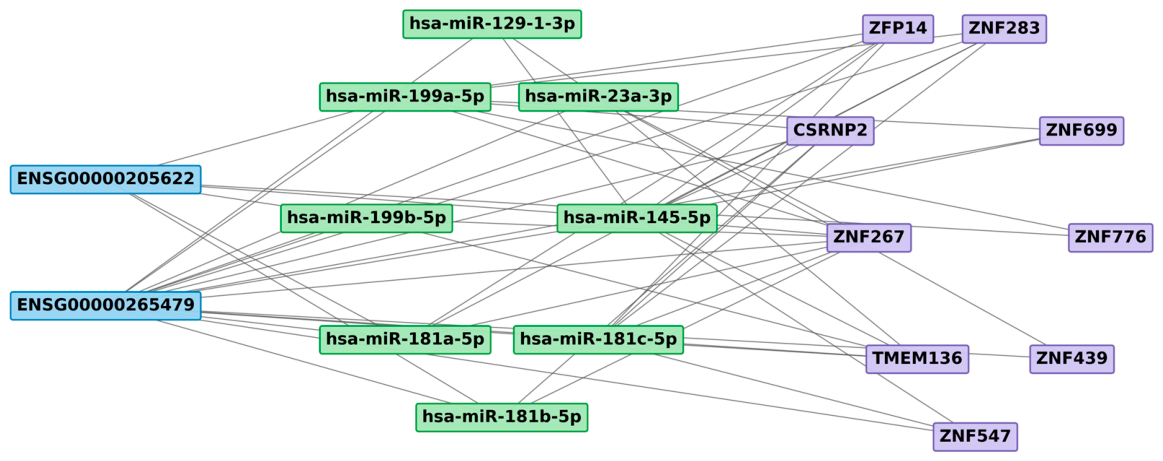
We then focused on a streamlined set of high-confidence interactions supported by GTEx expression data (
Figure 2). In this refined network, lncRNAs and mRNAs were preserved only when transcript expression reached TPM ≥ 1 within the same human tissue to ensure consistent co-expression. This more conservative approach identified a focused set of 21 triplets involving 2 lncRNAs, 8 miRNAs, and 9 mRNAs. A comparison of the two filtering platforms revealed that 17 lncRNA–miRNA–mRNA triplets were consistently preserved in both the Bgee- and GTEx-supported networks (
Supplementary Table S6).
Within this prioritized network, hsa-miR-181a-5p, which interacts with two of our prioritized lncRNAs (ENSG00000265479 and ENSG00000205622), stood out by interacting with three mRNAs (ZFP14, ZNF283, and CSRNP2), suggesting a potential regulatory influence on these targets. Notably, the prioritized lncRNA gene ENSG00000265479 (the DTX2P1 transcribed pseudogene), containing the BMI-associated variant rs2245368, exhibited the strongest centrality, participating in 15 interactions. This may point to the function of this transcribed pseudogene as a microRNA sponge that deflects microRNAs from the mRNAs of its parental genes and suggests its potential role as a functional ceRNA hub within BMI-relevant tissues, providing a specific candidate testable mechanistic pathway for how this intra-lncRNA variant may influence distal gene expression.
3. Discussion
Here, we performed an integrative exploratory annotation of 94 BMI-associated SNPs from Locke et al. [
28], in order to identify variants with direct functional potential, particularly in non-coding regions. The principal result is that several BMI-associated variants are more informatively interpreted through lncRNA genes, local regulatory evidence, tissue-specific expression, and evolutionary context than through nearest protein-coding genes alone.
The majority of published annotations of statistically significant disease-associated genetic variants from GWAS have focused on protein-coding genes nearest to the variants, hence often assigning intergenic SNPs to the nearest coding gene, which may misrepresent functional relevance. In contrast, our approach emphasizes functional signals (transcriptomic and epigenetic), as well as evidence for non-coding RNA transcription, directly at, or overlapping, the actual genomic locations of SNPs. By utilizing contemporary gene catalogs and regulatory element data that were not available when these loci were first identified, we systematically determined the functional potential of each variant. We performed a functional placement of significant BMI-associated variants within specific genomic features, such as lncRNA genes and non-coding regulatory elements, which provides a more precise perspective on their putative regulatory roles.
Gene body localization of a disease-associated genetic variant should not be interpreted as inherently stronger than localization within a non-coding regulatory element. A well-established precedent of this paradigm is the FTO obesity locus, where the intronic variant rs1421085 disrupts ARID5B repressor binding and alters a distal enhancer circuit regulating IRX3 and IRX5 during adipocyte differentiation [
48]. This example illustrates why GWAS loci must be evaluated for distal regulatory effects and motivated our inclusion of histone modification and TFBS annotations. In our dataset, an lncRNA gene body variant is easier to connect to a named transcript, whereas the target gene of a putative regulatory element remains unknown and the variant may act in cis, in trans, or across a long genomic distance. That difference reflects better annotation availability in genic loci and the inherent inability to connect a putative enhancer to a target gene without functional experiments; it does not construe independent evidence that lncRNA-associated variants are more causal.
Our findings align with prior observations that most GWAS variants for complex traits are intergenic or intronic [
1,
49], and support the emerging view that non-coding RNAs, especially lncRNAs, are critical regulators of obesity-related pathways. We identified the lncRNAs
MYOSLID-AS1 (matches 3 of our 7 annotation criteria) and
DTX2P1-UPK3BP1-PMS2P11 (4 out of 7 features) as high-priority candidates for direct causal roles in BMI, as well as in adiposity, metabolism, and postmenopausal osteoporosis [
50]. These results build on and refine previous GWAS annotations [
5,
7,
28] by emphasizing the putative functional relevance of non-coding RNAs rather than merely reflecting LD with nearby protein-coding genes.
Several high-scoring BMI SNPs appear to intersect with immune-related pathways, highlighting potential pleiotropy. For instance, rs2245368 and rs2815752 may contribute to both metabolic regulation and immune function, suggesting shared molecular mechanisms underlying obesity, metabolic syndrome, and susceptibility to severe outcomes from viral infections such as COVID-19. rs2245368 resides in the pseudogene
DTX2P1-UPK3BP1-PMS2P11. Pseudogene-derived lncRNAs are known to regulate inflammatory gene networks and adipogenesis. Therefore, rs2245368 may affect metabolic and immune pathways through cis or trans regulatory effects [
51]. According to GeneCards (17 July 2025; GC07P076959; GIFtS: 19), the most significant TFBS at the
DTX2P1-UPK3BP1-PMS2P11 promoter are for AP-4, ARP-1, Brachyury, C/EBPalpha, Evi-1, GATA-1, GATA-2, GATA-3, HOXA5, and Max1.
We analyzed CAGE (Cap Analysis of Gene Expression) RNA sequencing data from the FANTOM5 Consortium’s expression dataset of approximately 1000 human cell and tissue types, via the ZENBU transcriptome browser [
40]. We did this for all known genes and for all Genbank mRNA- and/or EST-supported transcriptional units that harbored SNPs from the original list of 94. For rs2245368, FANTOM5 data suggests robust transcription (of the intergenically spliced triple pseudogene harboring this SNP) in several epithelial and immune cell types. If rs2245368 resides within cell-type-specific regulatory elements—such as enhancers or promoters active in these cell types—it may influence local gene regulation in a context-dependent manner.
GWAS results, taken alone, inherently overlook tissue-specific regulatory effects. Hence, it is important to assess the expression profile of SNP-harboring coding and non-coding genes with encyclopedic transcriptome reference resources such as GTex and FANTOM: expression in cell or tissue types relevant to the phenotype that the SNP is significantly associated with, in this case, BMI, adds to evidence for the direct functional importance of the SNP. The variant rs2815752 is significantly associated with obesity and related anthropometric and metabolic indices [
52]. In addition, rs2815752 is intronic to the gene
NEGR1, which links metabolic regulation to immune signaling: NEGR1 modulates IL-6 trans-signaling, and loss of
NEGR1 in mice alters adiposity and hepatic lipid accumulation, providing a direct molecular path from a BMI-associated variant to inflammatory and metabolic phenotypes [
53,
54]. This intersection underscores the broader regulatory impact of non-coding variants and their potential involvement in diverse biological processes beyond adiposity. The GWAS COVID-19 v4 track of the UCSC Genome Browser complements our six other scoring criteria, offering additional signals that may uncover novel mechanistic links. Patients with type-2 diabetes and obesity had significantly higher risks of hospitalization and progression to severe COVID-19, suggesting that integrating metabolic disease context enhances our understanding of host susceptibility [
55].
The widespread conservation of many BMI-associated alleles across primates suggests that these variants are often not recent human-specific changes, but instead represent older allelic states embedded in long-standing metabolic or regulatory pathways. By investigating the evolutionary age and diversification of risk alleles—including comparisons between primates, ancient humans, and modern humans—we provide a historical functional context for these variants. However, under modern conditions characterized by calorie-rich diets and sedentary lifestyles, these same variants may predispose individuals to obesity and metabolic disorders. A “thrifty” missense variant in CREBRF (rs373863828) increases BMI while reducing diabetes risk in Samoan populations, exemplifying how adaptive variants can have maladaptive effects in contemporary settings [
56]. Evolutionary pressures have shaped genetic variants that were once beneficial but now contribute to disease susceptibility due to a mismatch between ancestral selection pressures and modern environments [
57].
Our results indicate that BMI-associated variants do not all follow the same evolutionary pattern. The “thrifty gene” hypothesis remains a useful evolutionary framework for considering BMI- and obesity-associated traits [
58], but our data suggest that the underlying genetic architecture is unlikely to be explained by deeply conserved mechanisms alone. The evolutionary conservation patterns of the annotated BMI-associated loci are heterogeneous (
Supplementary Table S1). For example, rs2836754 in LOC400867 shows comparatively deep conservation, with all key gene structure elements retained as far as mouse. By contrast, several prioritized non-coding loci have shallower conservation boundaries. The lncRNA gene containing rs7239883 (
LINC00907) is conserved only within primates, while the novel transcriptional units associated with rs2033529 and rs17203016 show divergence within primates, and between primates and nonprimate mammals, respectively. On a more distant scale, the pseudogene transcriptional unit harboring rs2245368 retains most of its key gene structure elements—splice sites and polyadenylation signal—throughout placental mammals. These findings suggest that BMI-associated loci may include both relatively ancient conserved components and more recently evolved, lineage-specific non-coding regulatory structures. Accordingly, our results support a more nuanced interpretation of evolutionary models such as the thrifty gene hypothesis [
59].
The evolutionary age and stability of these alleles across different lineages implies that these allelic states, which are currently disadvantageous because they may contribute to high BMI in modern humans, may have provided adaptive advantages in the ancestral environment, such as promoting effective energy storage during periods of food shortage, which is consistent with the “thrifty gene” hypothesis [
60]. Secondly, because these alleles are associated with obesity and related metabolic disorders, their persistence in modern humans highlights the evolutionary mismatch between ancient selective stress and contemporary lifestyles. Finally, certain risk alleles are conserved in both modern and ancient humans (Neanderthals and Denisovans). This finding highlights their potential role in basic metabolic pathways and reveals non-coding regulatory elements that may contribute to BMI, which should promote further research on whether these risk alleles were advantageous in ancient humans.
Emerging mechanistic studies suggest that lncRNAs exert regulatory effects in metabolic tissues not merely as transcriptional modulators, but as active participants in post-transcriptional circuitry, through competitive endogenous RNA (ceRNA) mechanisms [
61]. In this model, lncRNAs sequester specific miRNAs based on sequence complementarity, thereby relieving repression of miRNA-targeted mRNAs and enabling coordinated regulation of functional gene modules. Such ceRNA dynamics are increasingly recognized as important regulators of adipocyte differentiation, mitochondrial metabolism, and inflammatory signaling within metabolically active tissues [
62]. Here, the integration of experimentally supported lncRNA–miRNA interactions with TargetScan-derived miRNA–mRNA pairs, followed by stringent tissue co-expression filtering across Bgee and GTEx, revealed 17 co-expressed lncRNA–miRNA–mRNA triplets. Mechanistically, the prominence of hsa-miR-181a-5p—a miRNA family known to regulate immune–metabolic transitions, adipocyte lineage commitment, and cytokine-mediated metabolic stress responses [
63,
64]—suggests that ceRNA interactions may operate at key nodes linking inflammation and energy metabolism. Likewise, ENSG00000265479, which exhibited the highest centrality among lncRNAs, may function as a miRNA sponge that modulates the availability of miR-181 family members across relevant tissues. Downstream, the repeated targeting of zinc-finger transcriptional regulators such as
ZFP14 and
ZNF283 further supports a model in which ceRNA interactions fine-tune chromatin-associated gene expression programs essential for metabolic adaptation. Collectively, these findings highlight a potential lncRNA–miR-181–ZNF regulatory axis, implicating a testable mechanistic link between non-coding RNA dysregulation and BMI-associated metabolic phenotypes.
We present a multidimensional manual annotation using diverse public experimentally derived genomic datasets, including those from the ENCODE Consortium, expression data from Genbank cDNA and EST resources, as well as the FANTOM Consortium, allowing accurate definition of transcribed non-coding and regulatory elements with a consistent and reproducible annotation protocol.
Our scoring system assigns equal weight to each annotation criterion. The seven annotation dimensions represent heterogeneous evidence and are hence unlikely to have equal biological importance. However, no validated benchmark currently provides defensible relative weights for these disparate annotation classes. We therefore retained a simple equal-point additive scheme to make the exploratory prioritization transparent and consistent and to avoid introducing unvalidated differential weights; the equal numerical contributions of each of the seven criteria should not be interpreted as equal strengths of biological importance. The scoring thresholds were not optimized against experimentally validated causal variants, because the number of such noncoding variants in the literature remains small, and because published epigenomic datasets also do not cover all tissues and cell states relevant to BMI. Future refinements to this integrative framework will likely enhance its predictive power as more functional validation data become available.
The inclusion of COVID-19 association as one of our seven prioritization criteria introduces an exploratory cross-trait metric with inherent limitations. Obesity is clinically linked to adverse COVID-19 progression. However, genomic overlap between BMI and COVID-19 GWAS signals does not establish a causal involvement in adipocyte biology or primary energy metabolism. Indeed, our observation of mixed protective and risk direction signals across the COVID-19 association sub-tracks argues against a simple or uniform mechanistic relationship between BMI and COVID-19 severity genetic associations. Therefore, the COVID-19 association criterion is presented solely as an exploratory associative context to highlight potential immuno-metabolic pleiotropy at loci carrying both BMI and COVID-19 signals.
Additionally, although our manual annotation protocol followed standardized criteria, features that rely on visual assessment of peak clarity or background thresholds, which in this analysis are largely limited to ENCODE histone modification ChIP-seq data, inevitably retain a degree of subjective judgment, which represents an inherent limitation regarding inter-observer reproducibility. We defined a clear, well-above background peak call as an ENCODE histone modification signal in the ENCODE Regulation track that was readily visually apparent as a peak flanked by regions of no signal (
Supplementary Figure S2). Future implementations would benefit from transitioning toward automated, threshold-based algorithmic pipelines to standardize feature extraction across genome-scale datasets.
Future research should focus on direct functional validation of highest-scoring lncRNA, intronic, and intergenic SNPs, by siRNA knockdowns and overexpression of transcripts that contain or overlap the SNPs, and also by CRISPR-based genome editing, including knockouts and allele replacement. These studies should be conducted in adipocyte-relevant or other metabolically relevant primary cell models to allow for a definitive assessment of these lncRNAs’ roles in cellular processes governing BMI.
For rs2245368, we hypothesize that the variant may influence BMI-associated biology by altering the expression, splicing, or transcript stability of the DTX2P1-UPK3BP1-PMS2P11 pseudogene-associated transcriptional unit in which it resides. This may be testable by allele-specific genome editing in adipocyte-relevant or other metabolically relevant human cell models, followed by assessment of transcript abundance, isoform usage, nearby gene expression, local chromatin features, and downstream cellular phenotypes. Such experimental data may also support refinement of our prioritization approach, including the development of biologically informed weighted scoring systems based on the relative functional contribution of different annotation features.




 ,
,