1. Introduction
Aqueous metal–air batteries have attracted attention as primary energy-conversion systems because they use oxygen from air as the cathodic active material and metal oxidation as the anodic reaction [
1,
2]. Among various metal–air systems, aluminum–air batteries (AABs) are particularly attractive owing to the high theoretical energy density of aluminum, its low cost, natural abundance, and the recyclability of Al-containing reaction products [
3,
4,
5]. These characteristics make AABs relevant to high-capacity primary power sources, including emergency power supplies and mechanically rechargeable energy systems [
3,
4]. However, the practical performance of AABs remains below theoretical expectations because the Al anode undergoes surface passivation and parasitic corrosion in aqueous electrolytes [
3,
6].
In alkaline media, aluminum can be electrochemically oxidized to soluble aluminate species according to the anodic reaction [
3,
6]:
This reaction enables anodic discharge by dissolving the surface oxide layer and activating the Al electrode. However, the same strongly alkaline environment promotes self-corrosion of Al through reactions involving water and hydroxide ions, which consume active Al without contributing to useful discharge [
3,
6]. The corrosion reaction is commonly accompanied by hydrogen evolution, leading to reduced anodic utilization, lower discharge capacity, and lower practical energy output [
6,
7]. Therefore, controlling the Al/electrolyte interface in alkaline media is a key requirement for improving the electrochemical utilization of Al alloy anodes.
Several strategies have been proposed to mitigate these limitations. Alloying Al with elements such as Mg, Sn, Ga, In, or rare-earth elements can modify the native oxide film and improve anodic activation [
3,
4]. However, alloy design alone cannot fully suppress electrolyte-driven corrosion because the corrosion process is strongly affected by the local chemical environment at the Al/electrolyte interface. Consequently, electrolyte engineering has become an important approach for controlling Al anode corrosion. Water-in-salt electrolytes, hydrogen-bonding additives, organic inhibitors, and interfacial film-forming additives have been reported to reduce the activity of free water molecules, modify the solvation environment, or suppress direct contact between aggressive species and the Al surface [
1,
7,
8]. Our previous study further showed that alkali metal cations can influence anodic corrosion by altering water activity and interfacial resistance in alkaline AAB electrolytes [
9]. Together, these studies indicate that electrolyte composition can regulate both molecular interactions in solution and interfacial electrochemical processes at the Al anode.
Sulfate-containing additives have been reported to influence Al dissolution in alkaline media. Prior studies have discussed competitive adsorption between sulfate and hydroxide ions and possible sulfate-containing interfacial species [
7,
10,
11]. These literature-based pathways indicate that sulfate precursor identity can alter solution composition and interfacial response; however, they do not establish that a chemically defined sulfate-containing film forms under the present conditions. Moreover, the electrochemical response may depend on precursor stoichiometry, acid–base reactions, and the accompanying Na and Al inputs, not solely on the nominal sulfate-group input.
Aluminum sulfate, Al
2(SO
4)
3, and sodium sulfate, Na
2SO
4, provide a useful pair of sulfate precursors for examining formulation-dependent effects. At each matched volume ratio, the formulations were designed to contain the same nominal sulfate-group input and the same nominal NaOH input, but they differed in their formula-based total Na and Al inputs. Under strongly alkaline conditions, Al
2(SO
4)
3 should not be interpreted as producing a known concentration of freely solvated Al
3+ because hydrolysis, aluminate formation, complexation, and acid–base neutralization can occur [
12,
13]. The comparison therefore evaluates sulfate-source formulation as a coupled electrolyte variable rather than isolating a single cation effect or assuming a chemically resolved equilibrium speciation.
In this study, Na
2SO
4- and Al
2(SO
4)
3-containing formulations were compared at stoichiometrically matched nominal sulfate-group inputs to examine sulfate-source-dependent differences in the anodic response of Al–Mg–Sn–Gd–P alloy electrodes in alkaline electrolytes. Galvanostatic discharge, potentiodynamic polarization, potentiostatic electrochemical impedance spectroscopy (PEIS), and scanning electron microscopy/energy-dispersive X-ray spectroscopy (SEM/EDS) were used to evaluate the mass-loss-normalized anodic, polarization-derived apparent corrosion, interfacial impedance, and post-discharge morphological responses. Bulk apparent pH readings were retained only as descriptive electrolyte data and were not interpreted as measurements of local interfacial pH or thermodynamic OH
− activity. The electrolyte formulations and fixed-charge galvanostatic protocol are detailed in
Section 3.2 and
Section 3.3, respectively. This design treats sulfate source as a formulation-level electrolyte variable while distinguishing direct observations from unresolved mechanistic questions.
2. Results and Discussion
2.1. Galvanostatic Anodic Discharge and Mass-Loss-Normalized Anodic Charge in Sulfate-Containing Alkaline Electrolytes
Galvanostatic anodic discharge was used to compare Al–Mg–Sn–Gd–P alloy electrodes in matched Na
2SO
4- and Al
2(SO
4)
3-containing formulations. The three-electrode configuration and the initial morphology of the polished Al alloy surface are shown in
Figure S1a,b, respectively. Each test was conducted at 10 mA cm
−2 over an exposed area of 3.2 cm
2 for 5 h, corresponding to a total current of 32 mA and the same external charge of 160 mAh under every electrolyte condition. The matched formulations had the same nominal sulfate-group input at each volume ratio but different formulation-derived total Na and Al inputs, as detailed in
Section 3.2.
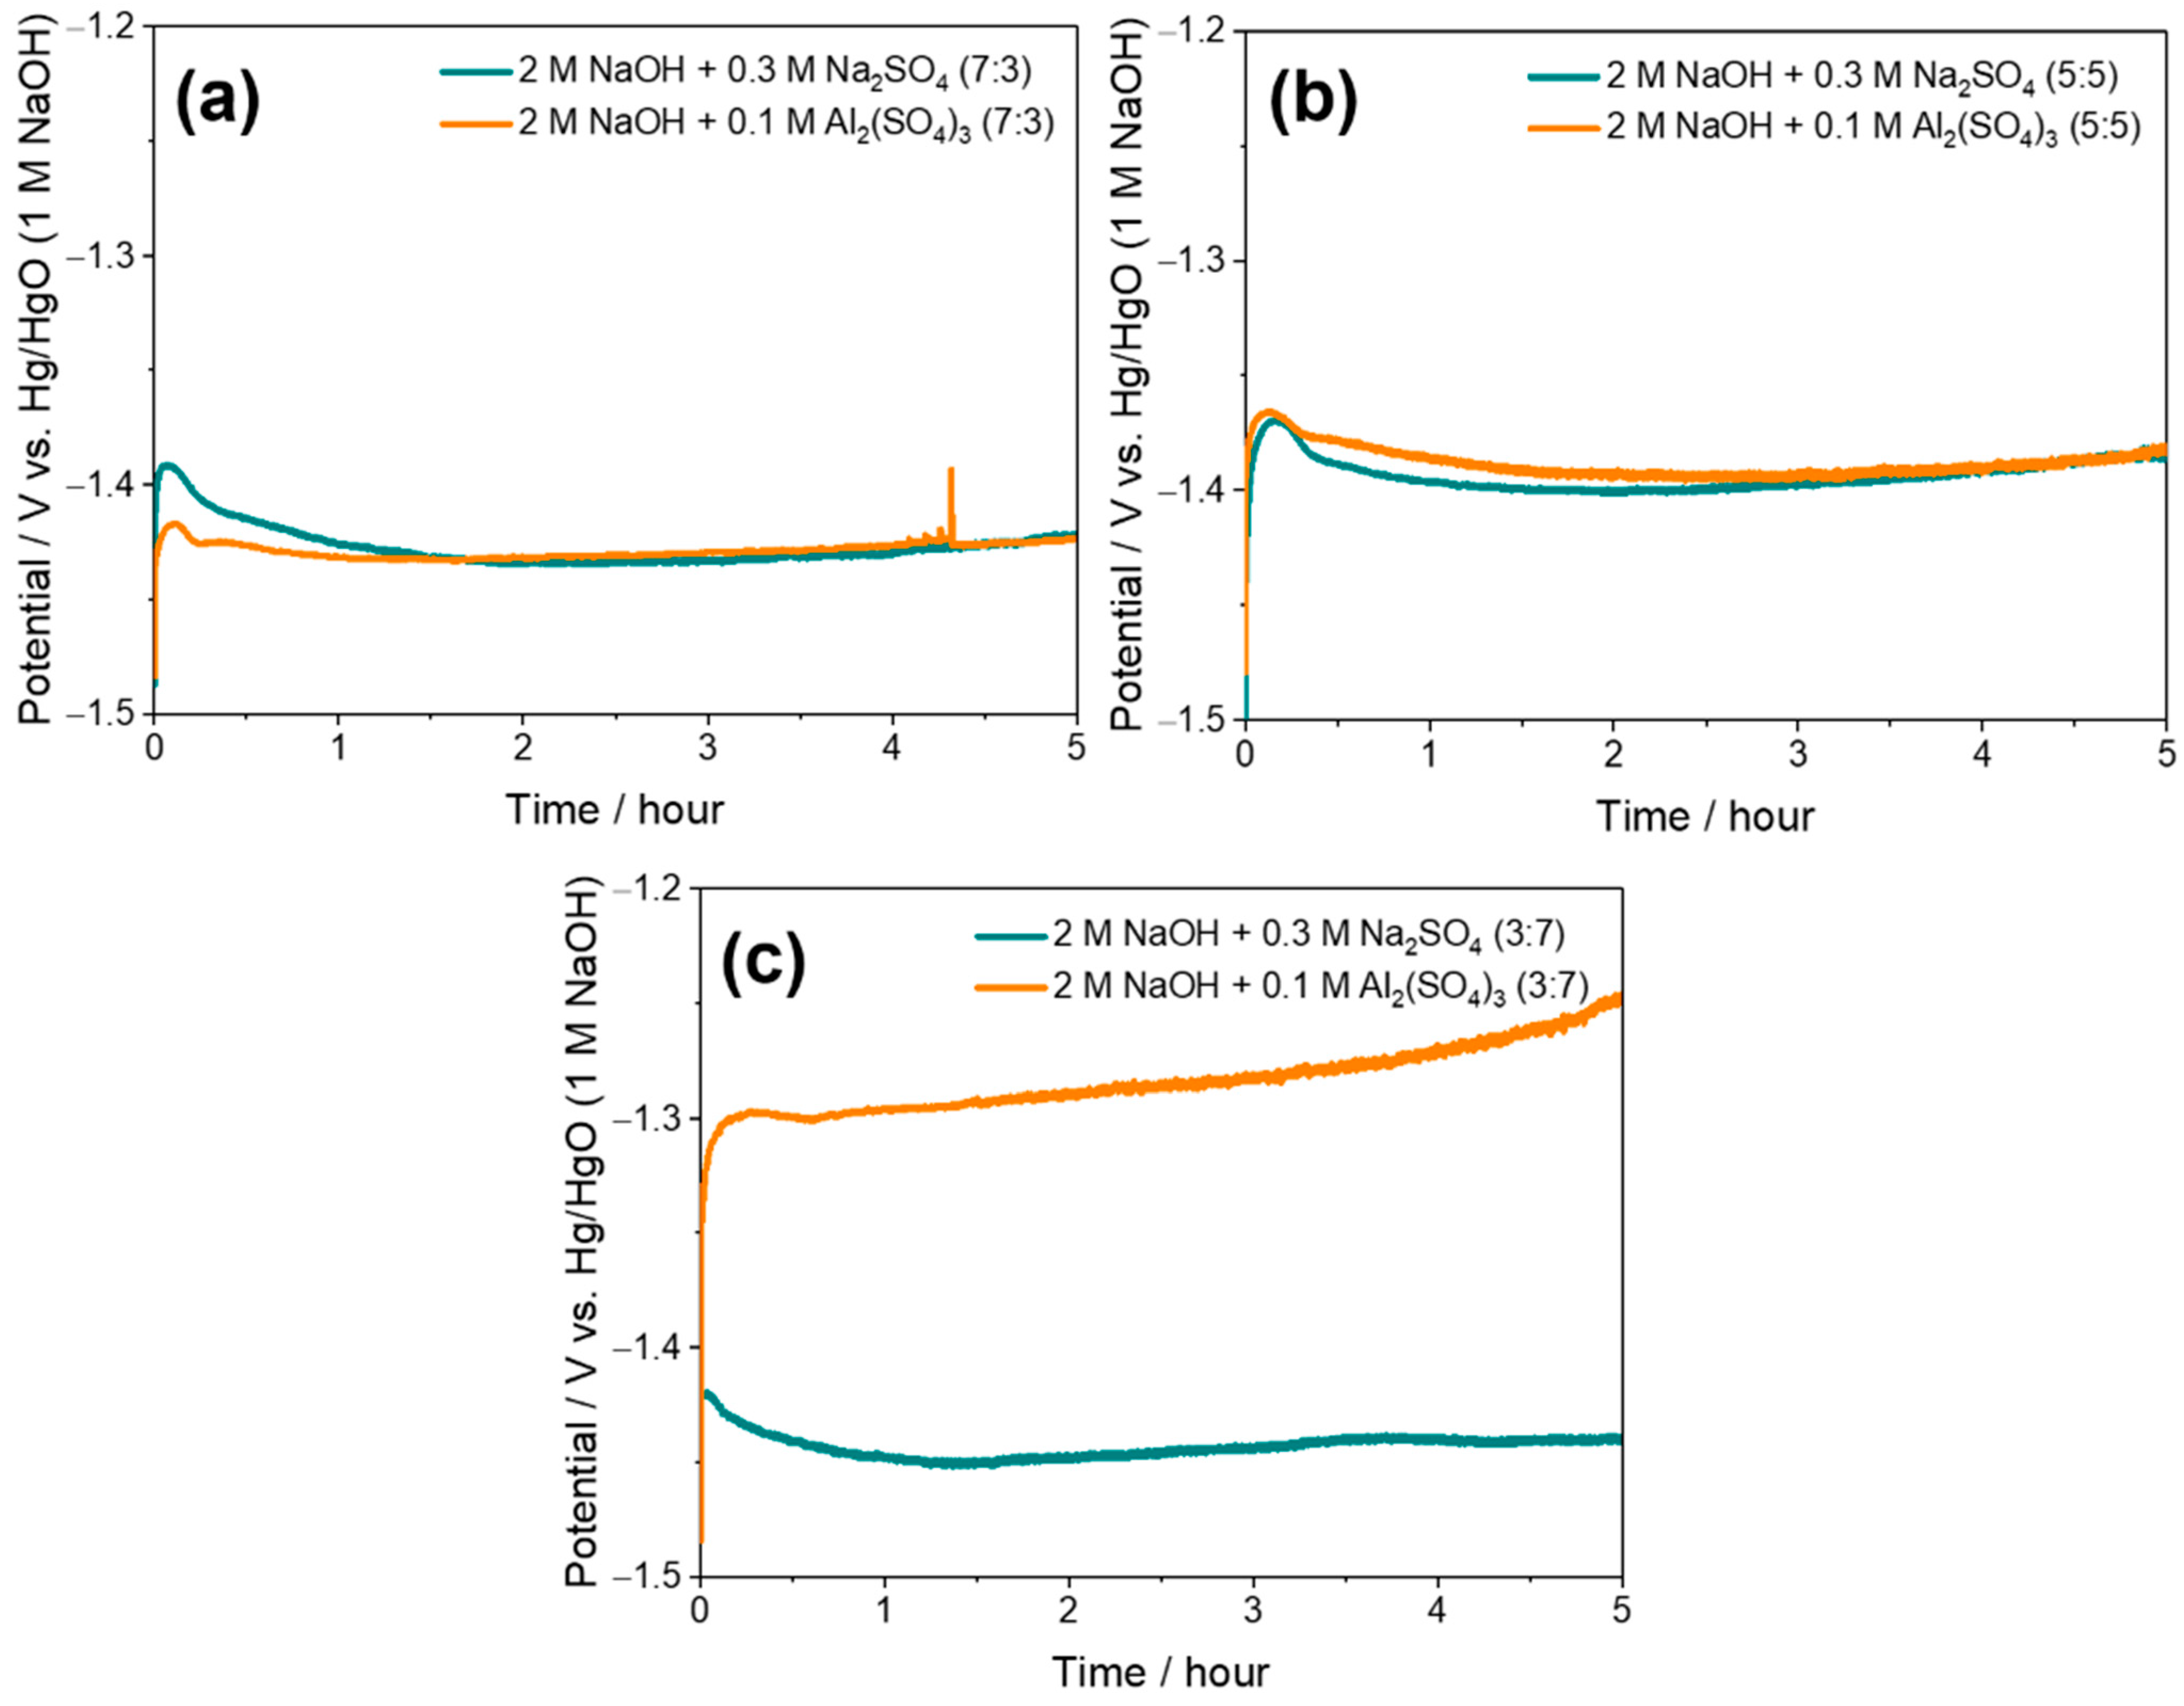
Figure 1a–c show the 5 h galvanostatic anodic discharge curves for the matched 7:3, 5:5, and 3:7 formulation pairs, respectively, and
Table 1 summarizes the corresponding parameters. The mass-loss-normalized anodic charge, Q
Δm, was 507 and 575 mAh g
−1 for N30 and A30, 623 and 902 mAh g
−1 for N50 and A50, and 917 and 1894 mAh g
−1 for N70 and A70, respectively. The average anode potential remained between −1.44 and −1.39 V vs. Hg/HgO (1 M NaOH) in the Na
2SO
4-containing formulations and shifted from −1.43 to −1.28 V vs. Hg/HgO (1 M NaOH) with increasing Al
2(SO
4)
3-solution fraction. Because the same external charge was passed in every test, differences in Q
Δm arise from the retained net-mass normalization rather than differences in total charge.
The higher QΔm values in the Al2(SO4)3-containing series support an operational formulation-to-formulation comparison under an identical external charge. QΔm is not interpreted as conventional battery capacity, current efficiency, or Faradaic efficiency because the net mass change does not partition useful electrochemical Al oxidation from hydrogen-evolution-associated corrosion, dissolution of alloy constituents, or retention and removal of surface products. In addition, the matched pairs differed in formulation-derived Na and Al inputs despite having the same nominal sulfate-group input. The discharge data therefore establish a sulfate-source-dependent mass-loss-normalized anodic response without isolating a single ionic or mechanistic contribution.
2.2. Potentiodynamic Polarization-Derived Apparent Corrosion Response
Potentiodynamic polarization measurements were conducted to compare the polarization-derived apparent corrosion response of the Al alloy electrodes.
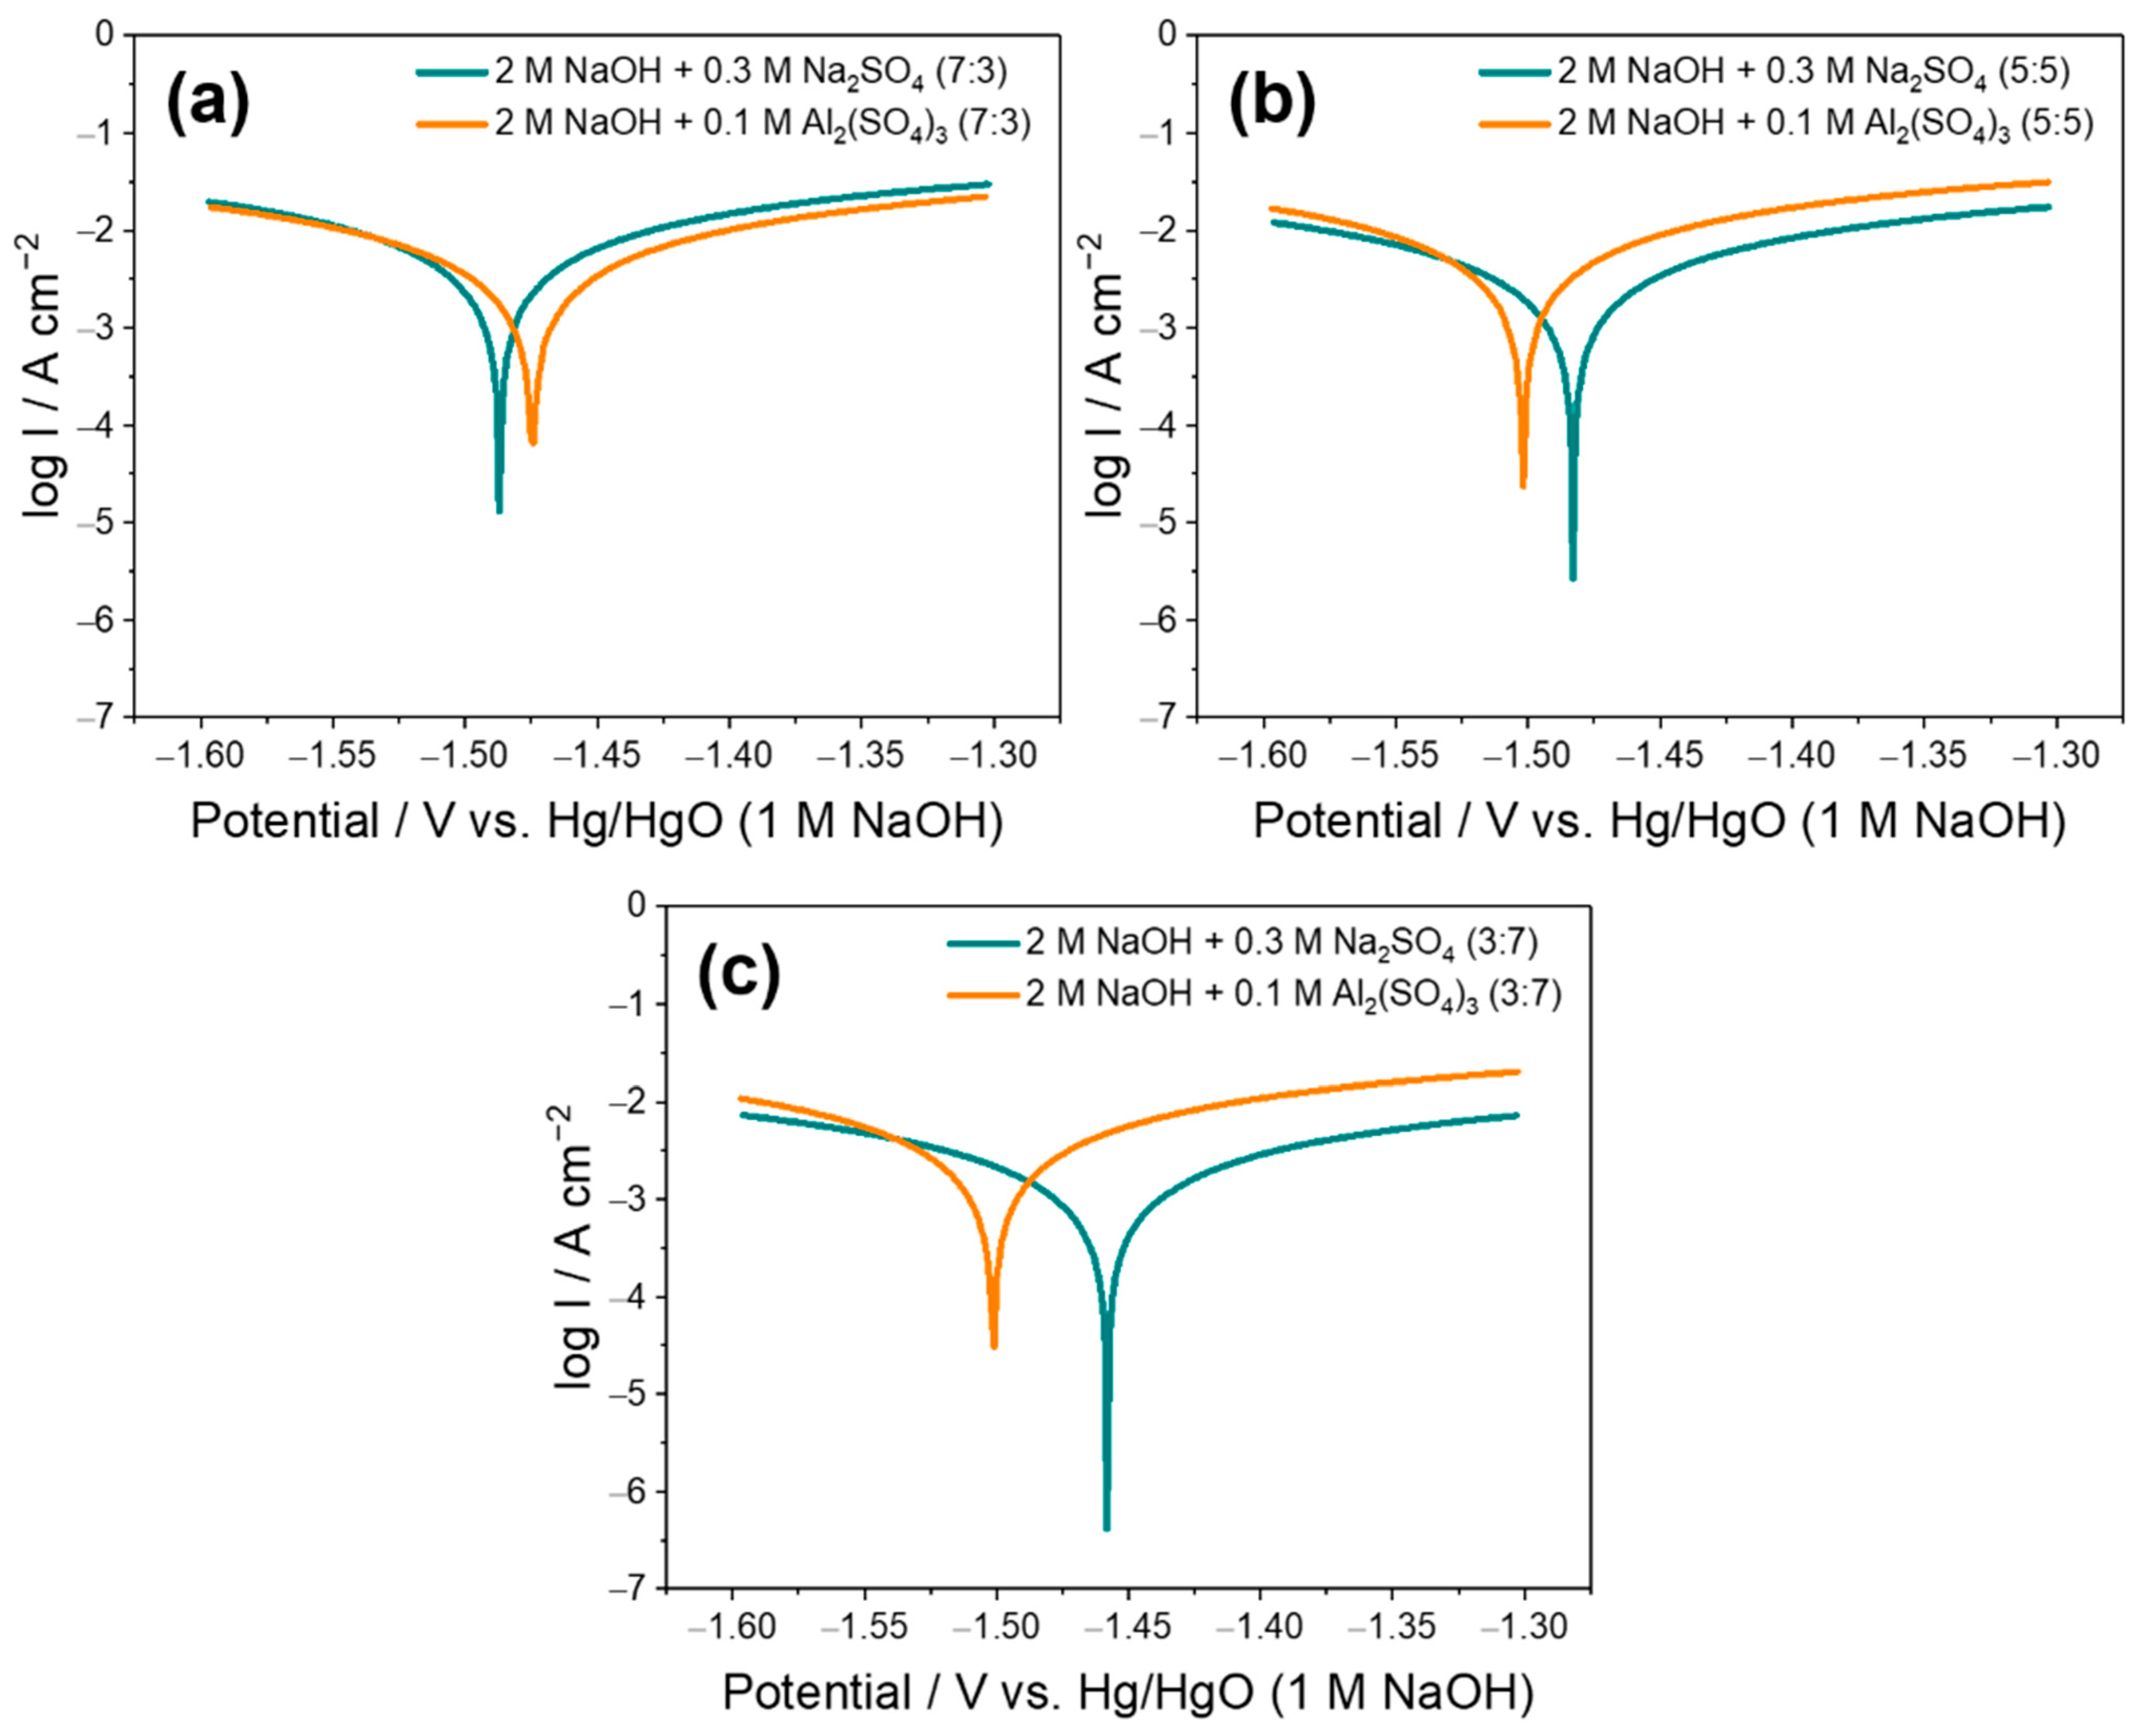
Figure 2a–c show the curves for the matched 7:3, 5:5, and 3:7 formulation pairs, and
Table 2 summarizes the corresponding parameters [
14].
For all matched volume ratios, the Al2(SO4)3-containing formulations showed lower polarization-derived apparent corrosion current densities (Icorr) and higher polarization resistances (Rp) than the corresponding Na2SO4-containing formulations. Replacing Na2SO4 with Al2(SO4)3 decreased Icorr from 20.52 to 15.63 mA cm−2 at 7:3, from 18.97 to 12.02 mA cm−2 at 5:5, and from 11.84 to 6.479 mA cm−2 at 3:7. In parallel, Rp increased from 2.545 to 3.151 Ω cm2, from 2.634 to 4.270 Ω cm2, and from 4.087 to 8.643 Ω cm2, respectively. At the 3:7 ratio, the corrosion potential (Ecorr) shifted from −1.498 to −1.455 V vs. Hg/HgO (1 M NaOH).
The lower Icorr and higher Rp values establish a lower polarization-derived apparent corrosion response for the Al2(SO4)3-containing formulations under the applied analysis conditions. These parameters reflect the coupled anodic and cathodic polarization response but do not directly quantify hydrogen evolution, mass-loss corrosion rate, or useful-current efficiency. Their co-variation with QΔm is therefore treated as a parallel electrochemical observation rather than proof of a common causal mechanism.
2.3. Electrochemical Impedance Response of the Al Alloy/Electrolyte Interface
PEIS was conducted to compare the interfacial electrochemical response of the Al alloy electrodes.
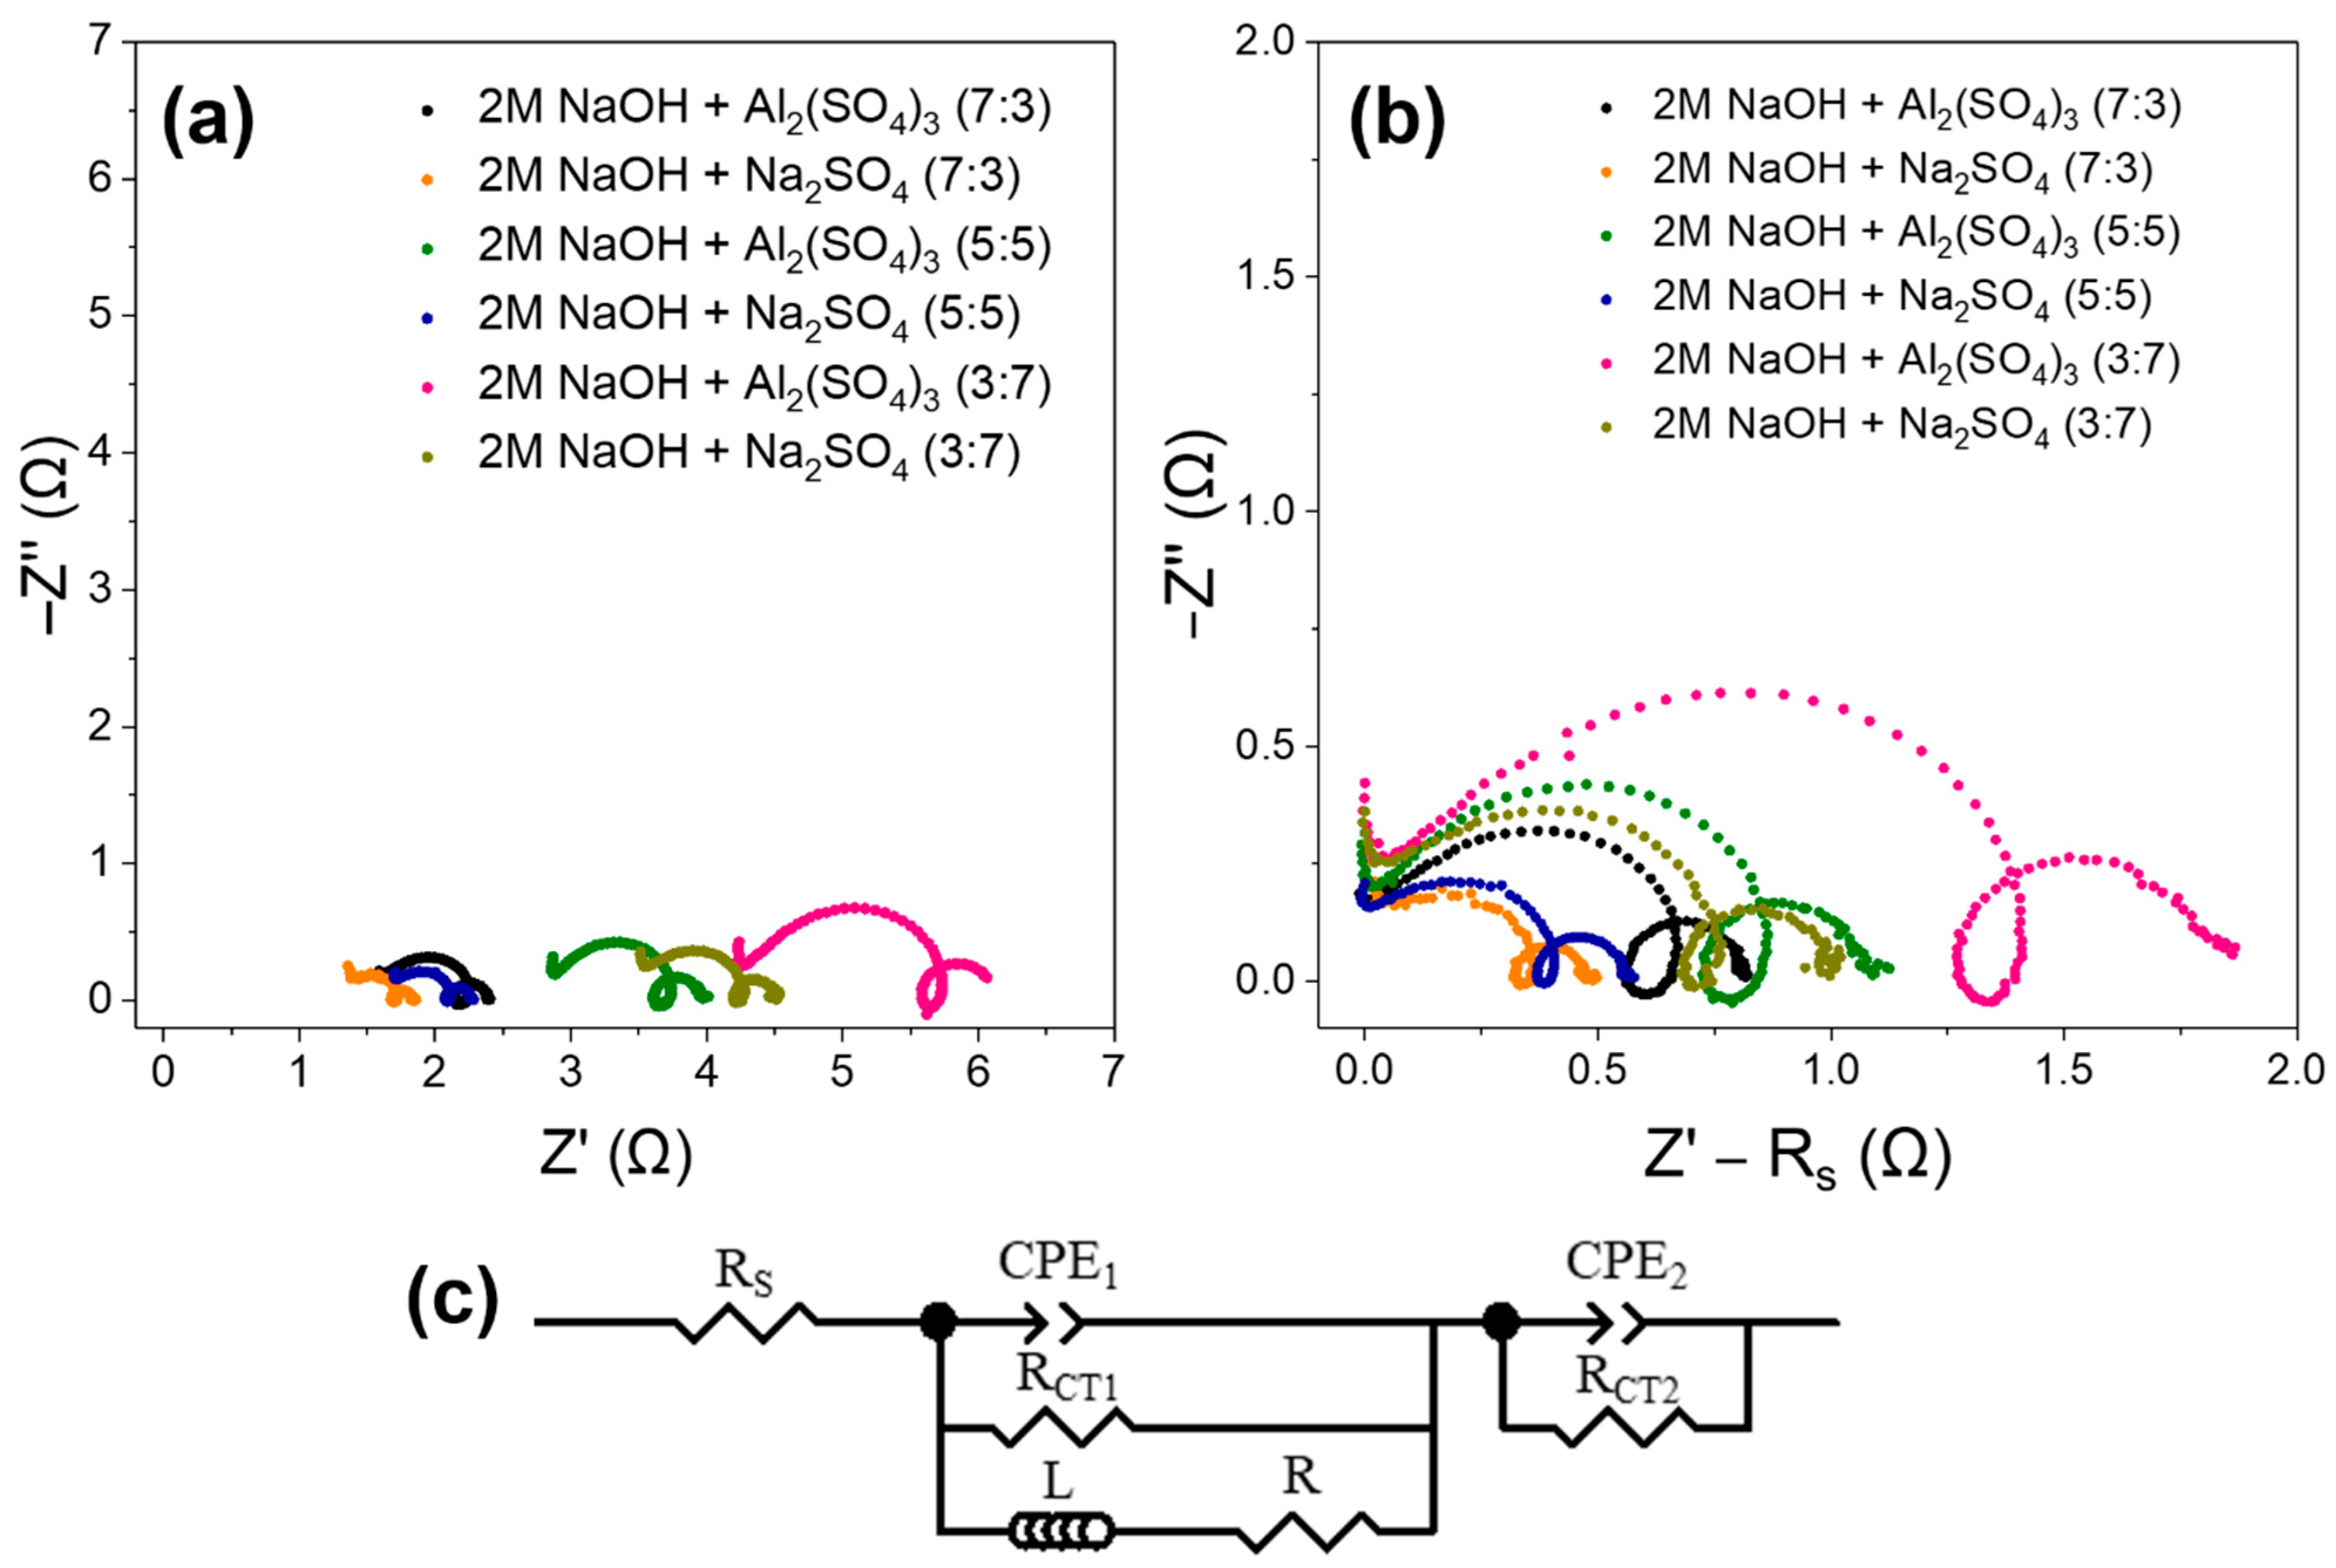
Figure 3a presents the raw Nyquist spectra, whereas
Figure 3b presents the corresponding R
s-subtracted spectra. For each spectrum, R
s was determined from the high-frequency real-axis intercept and the real component was corrected according to Z′
corr = Z′ − R
s, while Z″ was unchanged.
Figure 3c presents an equivalent-circuit representation used to guide qualitative interpretation.
The Al
2(SO
4)
3-containing formulations showed larger observed impedance arcs than the matched Na
2SO
4-containing formulations. The present PEIS data therefore show a sulfate-source-dependent difference in interfacial impedance response. Because PEIS is not chemical-state-resolved, the larger response is not attributed to a distinct film, a specific sulfate-containing species, or suppression of a particular corrosion pathway. Charge-transfer and adsorbed-intermediate processes are treated only as literature-consistent possibilities [
15,
16], and the analysis is restricted to qualitative comparison of the measured spectra. Quantitative fitting parameters were not used as primary mechanistic evidence. The directly supported finding is the formulation-dependent difference in interfacial impedance response, not the chemical identity of its origin.
2.4. Post-Discharge Surface Morphology
The post-discharge morphology of the Al alloy electrodes was examined by SEM to evaluate electrolyte-dependent surface evolution.
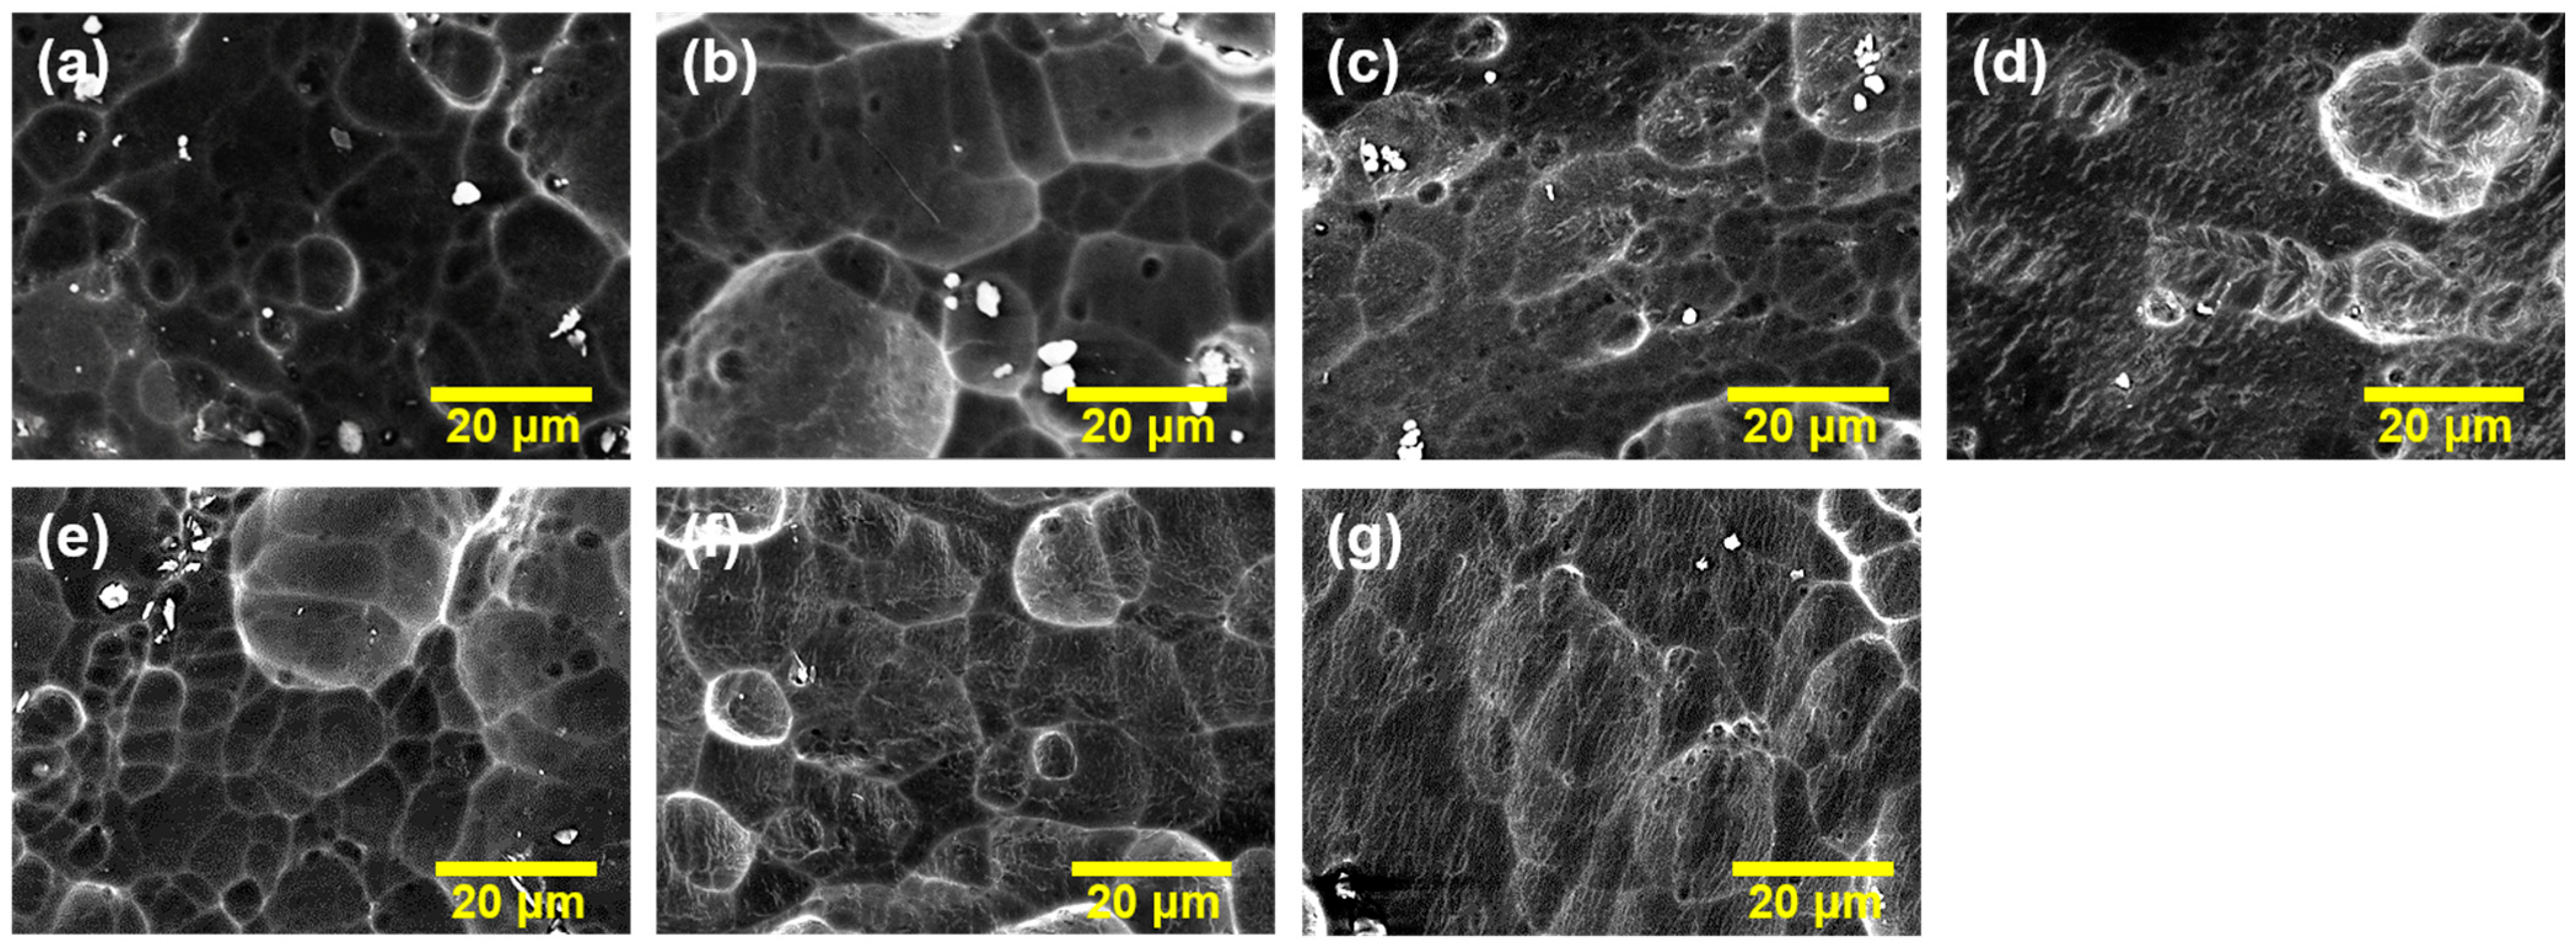
Figure 4 compares the morphologies obtained after discharge in 2 M NaOH and in the sulfate-containing alkaline electrolytes, enabling sulfate-source effects to be assessed across the matched electrolyte series. The polished pristine Al alloy exhibited a relatively smooth morphology without large cracks or corrosion pits, as shown in
Figure S1b. After discharge in 2 M NaOH, the surface exhibited pits and cracks, consistent with localized Al dissolution in strongly alkaline media [
3,
6].
The SEM observations showed formulation-dependent differences in post-discharge surface morphology, but the present surface SEM data do not establish a discrete layer or its chemical state, bonding, phase, thickness, or continuity.
Figure S2 provides qualitative SEM/EDS elemental-distribution data for selected pristine and 1 h-discharge samples; these samples do not constitute a complete matched Na
2SO
4/Al
2(SO
4)
3 comparison and represent a different electrochemical history from the 5 h SEM samples in
Figure 4. Accordingly, the EDS data are treated only as qualitative elemental-distribution evidence [
17].
2.5. Bulk Apparent pH Readings as Descriptive Electrolyte Parameters
The bulk apparent pH readings of the base solution, additive stock solutions, and final mixed electrolytes are summarized in
Table 3. The 0.3 M Na
2SO
4 stock solution gave a reading of 6.79, whereas the 0.1 M Al
2(SO
4)
3 solution gave a reading of 3.15. After mixing with 2 M NaOH, all final electrolytes remained strongly alkaline. The Na
2SO
4-containing formulations gave readings of 13.63, 13.59, and 13.49 at 7:3, 5:5, and 3:7, respectively, whereas the corresponding Al
2(SO
4)
3-containing formulations gave readings of 13.59, 13.49, and 13.20.
The readings were obtained in concentrated alkaline matrices with different ionic compositions and were retained only to document one measured property of the tested formulations. They were not used to establish a causal relationship with QΔm, the polarization-derived parameters, or the PEIS response. No pH-matched or statistical relationships were inferred from these readings.
The local interfacial pH during polarization and galvanostatic discharge was not measured and may differ from the bulk value because of reaction fluxes and mass transport. Because the revised interpretation does not rely on a causal local-pH mechanism, no near-surface simulation was introduced. Spatially resolved pH measurements and experimentally validated reaction–transport modeling would be appropriate for a separate mechanistic study.
2.6. Integrated Phenomenological Interpretation and Limitations
Across the matched formulations, the Al2(SO4)3-containing series generally exhibited higher QΔm, lower polarization-derived apparent Icorr, higher Rp, larger interfacial impedance responses, and distinct post-discharge morphologies relative to the corresponding Na2SO4-containing series. These concurrent differences establish sulfate-source-dependent co-variation under the tested conditions but do not identify a unique causal sequence.
The matched formulations contained the same nominal sulfate-group inputs but different formulation-derived Na and Al inputs, and the contributions of these coupled variables were not independently separated. In addition, the PEIS spectra were obtained after 1 h immersion at OCP, whereas the main SEM images were obtained after 5 h of galvanostatic discharge. The two measurements therefore represent different electrochemical histories and should not be interpreted as observations of the same chemically defined interface.
The present measurements did not establish the presence of a distinct interfacial film or identify a sulfate bonding state, an Al-containing sulfate phase, or a layer thickness. The results are therefore interpreted as formulation-dependent electrochemical and morphological responses without assigning sulfate adsorption, Al-containing hydroxo/sulfate species, or film formation as the mechanism.
3. Materials and Methods
3.1. Materials and Electrode Preparation
The Al–Mg–Sn–Gd–P alloy specimens were supplied by ALUS Co., Ltd. (Cheonan, Republic of Korea). The nominal composition of the alloy was Al–Mg–Sn–Gd–P, with respective weight percentages of 99.312, 0.56, 0.01, 0.024, and 0.004 wt%, identical to that used in our previous study [
9]. The alloy specimens were cut into rectangular electrodes with dimensions of 1.0 cm × 1.5 cm × 0.4 cm. Before electrochemical measurements, the native oxide layer on the electrode surface was removed by mechanical polishing using a polishing machine (RB209 MINIPOL; R&B Inc., Daejeon, Republic of Korea) and a polishing cloth (MPC-8A-Toplap; R&B Inc., Daejeon, Republic of Korea). The polished electrodes were ultrasonically cleaned in ethanol (94.5%; Daejung, Siheung, Republic of Korea) for 30 min and then dried in an oven at 60 °C for 1 h. Sodium hydroxide (NaOH, ACS reagent, ≥97.0%, pellets; Sigma-Aldrich, St. Louis, MO, USA), sodium sulfate (Na
2SO
4, ACS reagent, ≥99.0%, anhydrous, granular; Sigma-Aldrich, St. Louis, MO, USA), and aluminum sulfate octadecahydrate (Al
2(SO
4)
3·18H
2O, 98%; Sigma-Aldrich, St. Louis, MO, USA) were used as received. Distilled water (HPLC grade; Burdick & Jackson, Muskegon, MI, USA) was used to prepare all aqueous solutions.
3.2. Preparation of Electrolytes
The base solution was 2 mol dm
−3 NaOH. Two sulfate-containing additive stock solutions were prepared separately: 0.3 mol dm
−3 Na
2SO
4 and 0.1 mol dm
−3 Al
2(SO
4)
3. The Al
2(SO
4)
3 solution was prepared from Al
2(SO
4)
3·18H
2O, and the stated molarity denotes the nominal concentration of Al
2(SO
4)
3 formula units. The two stock solutions therefore contained the same nominal sulfate-group concentration of 0.30 mol dm
−3 before mixing. The base solution was mixed with each stock solution at NaOH:additive-solution volume ratios of 7:3, 5:5, and 3:7. The resulting formulations were denoted N30, N50, and N70 for Na
2SO
4 and A30, A50, and A70 for Al
2(SO
4)
3; the numbers indicate the additive-solution volume percentage. At each matched ratio, the N and A formulations had the same nominal NaOH and sulfate-group inputs but different formula-based total Na and Al inputs, as summarized in
Table 4. These values are formulation-derived nominal inputs and do not represent measured total-element concentrations, free-ion concentrations or activities, residual OH
− concentration, ionic strength, or equilibrium speciation after mixing, hydrolysis, complexation, aluminate formation, and acid–base neutralization.
3.3. Galvanostatic Anodic Discharge Measurements
Galvanostatic anodic discharge measurements were conducted using a battery-test system (WBCS 3000; WonATech, Seoul, Republic of Korea) in a beaker-type three-electrode cell. The polished Al alloy electrode was the working electrode, a Pt mesh electrode (002250; ALS Co., Ltd., Tokyo, Japan) was the counter electrode, and an Hg/HgO/OH
− reference electrode filled with 1 M NaOH (RE-61AP, 013694; ALS Co., Ltd., Tokyo, Japan) was the reference electrode. The cell configuration is shown in
Figure S1a. The exposed area was 3.2 cm
2. Discharge was conducted at 10 mA cm
−2 for 5 h, corresponding to 32 mA and 160 mAh.
Before discharge, the pre-discharge open-circuit potential was measured. During discharge, the anode potential was recorded versus Hg/HgO (1 M NaOH). After discharge, the Al alloy electrodes were rinsed with distilled water, dried at 60 °C for 1 h, and weighed. The net post-discharge mass decrease, Δm, was obtained from the difference between the initial and final electrode masses. The mass-loss-normalized anodic charge was calculated using Equation (2):
where Q
Δm is the mass-loss-normalized anodic charge (mAh g
−1), j is the discharge current density (mA cm
−2), A is the exposed area (cm
2), t is the discharge time (h), and Δm is the net post-discharge electrode mass decrease (g). Q
Δm is retained as an operational metric normalized by the net post-discharge electrode mass decrease and is not interpreted as conventional battery capacity, current/Faradaic efficiency, direct useful-Al-oxidation fraction, or corrosion loss.
3.4. Potentiodynamic Polarization Measurements
Potentiodynamic polarization measurements were performed using an electrochemical workstation (WBCS 3000; WonATech, Seoul, Republic of Korea) in the same beaker-type three-electrode cell used for galvanostatic discharge measurements.
The polished Al alloy electrode was the working electrode, a Pt mesh electrode was the counter electrode, and the Hg/HgO/OH
− reference electrode filled with 1 M NaOH described in
Section 3.3 was the reference electrode. The exposed working-electrode area was 1.0 cm
2.
The polarization scan was started at −1.50 V vs. Hg/HgO (1 M NaOH) and recorded at 1 mV s−1. Ecorr, Icorr, and Rp were obtained by Tafel extrapolation using the same fitting procedure and potential-window criteria for all formulations.
The polarization resistance was calculated using the Stern–Geary relationship:
where β
a and β
c are the anodic and cathodic Tafel slopes, respectively, and I
corr is the polarization-derived apparent corrosion current density. The absolute Tafel-slope values were used in Equation (3). The resulting I
corr and R
p values were used only as polarization-derived apparent parameters for comparing the tested formulations.
3.5. Potentiostatic Electrochemical Impedance Spectroscopy
PEIS was conducted using an electrochemical workstation (ZIVE SP1; WonATech, Seoul, Republic of Korea) in the same three-electrode cell. Before each measurement, the Al alloy electrode was immersed under open-circuit conditions for 1 h at room temperature. PEIS was then performed with the DC bias set to the OCP measured after the 1 h immersion period using a sinusoidal potential perturbation of 5 mV over 100 kHz to 0.1 Hz. For every formulation, the absolute difference between the PEIS OCP and the corresponding pre-discharge OCP was 2 mV or lower.
The impedance spectra were presented as Nyquist plots and interpreted qualitatively using an equivalent-circuit representation. For
Figure 3b, R
s was obtained from the high-frequency real-axis intercept of each raw spectrum and subtracted from Z′ according to Z′
corr = Z′ − R
s, while Z″ was unchanged. This representation was only used to guide qualitative assignment of the impedance features; quantitative fitting parameters were not used as primary mechanistic evidence. The analysis was restricted to comparative interfacial impedance responses and did not determine film composition or chemical state.
3.6. Surface Morphology and Elemental Distribution Analysis
The surface morphology was examined by SEM (SIGMA 360; Carl Zeiss AG, Oberkochen, Baden-Württemberg, Germany). The polished pristine electrode and post-discharge electrodes were compared after the discharged samples had been rinsed with distilled water and dried at 60 °C. EDS (XFlash 7; Bruker Corporation, Billerica, MA, USA) mapping was performed on selected pristine, treated, and post-discharge samples. SEM/EDS was only used for representative morphology and qualitative elemental-distribution analysis and not to determine bonding, valence state, phase, film thickness, continuity, or the chemical origin of the impedance response.
3.7. Bulk Apparent pH Measurements
The bulk pH readings of the base solution, additive stock solutions, and final mixed electrolytes were obtained at room temperature using a pH meter (FP20; Mettler Toledo, Columbus, OH, USA). The same measurement protocol was applied to all solutions. Because the measurements were made in concentrated NaOH/sulfate matrices, the values are only reported as bulk apparent pH readings. They are not interpreted as thermodynamic OH− activities, local interfacial pH values, or acid-neutralizing alkalinities and are not used as mechanistic evidence for the electrochemical conclusions.
4. Conclusions
This study compared Na2SO4- and Al2(SO4)3-containing alkaline formulations at matched nominal sulfate-group inputs but different formulation-derived Na and Al inputs. Under the identical external charge of 160 mAh, the Al2(SO4)3-containing series showed higher QΔm values, including an increase from 917 to 1894 mAh g−1 for the matched 3:7 pair. Potentiodynamic polarization further showed that the polarization-derived apparent Icorr decreased from 11.84 to 6.479 mA cm−2, while Rp increased from 4.087 to 8.643 Ω cm2 for the same pair. The Al2(SO4)3-containing series also showed larger interfacial impedance responses and distinct representative post-discharge morphologies. These results identify sulfate-source formulation as a practical electrolyte-design variable associated with distinct mass-loss-normalized anodic, polarization-derived apparent corrosion, impedance, and morphological responses under matched nominal sulfate-group input.
The observations do not isolate the contribution of a single Na- or Al-containing species, establish a protective film or sulfate bonding state, or define a common causal mechanism. Bulk apparent pH readings were measured as descriptive electrolyte properties but were not used to establish causality. Future work can address the unresolved origin of these responses through complete Al mass/charge-balance measurements, spatially resolved interfacial-pH measurements with validated reaction–transport modeling, and surface-sensitive chemical-state analysis. These analyses concern mechanistic questions beyond the comparative scope of the present study.