Article

Discovery and Comprehensive Characterization of Pseudomonas sp. MUP55: Taxonomy, Massetolide-Mediated Biocontrol, and Regulatory and Antimicrobial Contributions of the pvf Cluster


1
Bioplastics Innovation Hub, Food Futures Institute, Murdoch University, Murdoch, WA 6150, Australia
2
The Australian National Phenome Centre and Computational and Systems Medicine, Health Futures Institute, Murdoch University, Harry Perkins Building, Perth, WA 6150, Australia
*
Author to whom correspondence should be addressed.
Int. J. Mol. Sci. 2026, 27(15), 6749; https://doi.org/10.3390/ijms27156749
Submission received: 29 June 2026 / Revised: 25 July 2026 / Accepted: 25 July 2026 / Published: 28 July 2026
(This article belongs to the Special Issue Molecular Advances in Plant–Microbial Interaction)

Abstract

Pseudomonas sp. MUP55, isolated from rainfall water in Western Australia, was characterized by polyphasic taxonomy and functional assays. Whole-genome and 16S rRNA phylogeny placed Pseudomonas sp. MUP55 in the Pseudomonas fluorescens species group. Massetolide A/D was identified as the leading candidate bioactive compound(s), consistent with its biosynthetic gene cluster, GNPS library matching, and loss of activity in regulatory mutants. The strain showed broad-spectrum antimicrobial activity against bacterial (Escherichia coli and Xanthomonas campestris) and fungal (Fusarium oxysporum and Rhizoctonia solani) plant pathogens. GacA regulates Massetolide production: a P58L mutation abolished synthesis and reduced biocontrol efficacy. Metabolomic and transcriptomic analysis of a ΔpvfC mutant revealed that the pvf cluster regulates specialized metabolism while also contributing to secreted growth-inhibitory activity. The pvf cluster differentially regulates dual siderophore systems and uncouples the co-regulated small RNAs rsmY and rsmZ in the Gac/Rsm cascade. Deletion of pvfC partially reduced the growth-inhibitory activity of Pseudomonas sp. MUP55 supernatants against bacterial pathogens, indicating that pvfC also influences secreted antimicrobial activity beyond its global regulatory role. These findings establish Pseudomonas sp. MUP55 as a taxonomically novel, mechanistically characterized biocontrol agent with potential for sustainable agriculture.

1. Introduction

Plant pathogens pose a significant threat to global food security, necessitating the development of sustainable control strategies. Among potential biocontrol agents, the genus Pseudomonas, first proposed by Migula in 1894 [1], has emerged as particularly promising due to its diverse antimicrobial capabilities and widespread distribution in agricultural ecosystems [2,3,4,5,6]. Members of this genus exhibit remarkable metabolic and genetic heterogeneity, with DNA G + C contents ranging from 58 to 69 mol% [3,7], and produce various bioactive compounds, including virulence factors, pigments, and motility-enhancing agents [8,9,10].
Within Pseudomonas, the P. fluorescens species group has garnered particular attention for its plant-beneficial properties [11,12]. This group comprises numerous strains that demonstrate robust biocontrol activities through the production of secondary metabolites, including antimicrobial compounds, siderophores, and various enzymes. Notable examples include P. simiae WCS417, which effectively suppresses soil-borne pathogens like Gaeumannomyces graminis var. tritici and Fusarium oxysporum [13,14,15,16], and Pseudomonas lactis SS101, which produces cyclic lipopeptide surfactants effective against various plant pathogens [13,14,15,16].
Recent advances in genomic technologies have revealed considerable complexity within the P. fluorescens species group taxonomy [11]. Current classification recognizes distinct subgroups based on multilocus phylogenetic analyses, yet rapid genome sequencing efforts continue to uncover novel diversity [11]. This expanding genomic landscape, coupled with frequent lack of species assignment and potential misclassification of isolates, has highlighted the need for comprehensive characterization of newly isolated strains, particularly those exhibiting promising biocontrol properties.
Cyclic lipopeptides (CLPs) are among the most important bioactive compounds in Pseudomonas-mediated biocontrol. Massetolide A, produced by P. lactis SS101, stands out as a particularly important CLP. It exhibits potent antimicrobial activity against various phytopathogens, promotes induced systemic resistance in plants, and contributes to bacterial motility and biofilm formation [17,18]. The gene cluster responsible for Massetolide biosynthesis was first identified in P. lactis SS101 [19] and has subsequently been documented in numerous other beneficial Pseudomonas strains [18,20], highlighting its evolutionary conservation and ecological significance. Production of Massetolide A is primarily regulated through the Gac/Rsm signal transduction pathway, whereby GacS phosphorylates GacA, which then induces expression of small RNA genes (rsmY and rsmZ), sequestering translational repressors of key biosynthetic regulators [18,20].
Beyond the Gac/Rsm pathway, recent investigations have identified alternative quorum-sensing-like systems in various Pseudomonas strains. The pvf gene cluster, comprising a non-ribosomal peptide synthetase (NRPS, pvfC), a diiron N-oxygenase (pvfB), and two genes of unknown function (pvfA and pvfD), has been implicated in virulence and secondary metabolite production in Pseudomonas entomophila [21,22]. Homologous clusters in Burkholderia cenocepacia H111 (the ham cluster) produce valdiazen, a valinol-containing diazeniumdiolate that signals the expression of over 100 genes [23]. In Pseudomonas syringae pv. syringae, a homologous cluster produces leudiazen, which regulates mangotoxin production [24]. These studies have focused primarily on regulatory roles, while direct antimicrobial functions have remained largely unexplored, particularly in beneficial biocontrol strains.
In this study, we report the first comprehensive characterization of Pseudomonas sp. MUP55, and our data support the classification of Pseudomonas sp. MUP55 as a distinct species within the P. fluorescens group. Through a combination of genomic, metabolomic, phenotypic, and transcriptomic approaches, we identify Massetolide A as the primary bioactive compound and characterize its biosynthetic gene cluster; show the critical role of the GacA protein in Massetolide production through mutant analysis; demonstrate direct pathogen suppression; and uncover the dual role for the pvf cluster in the global regulation of specialized metabolism and in influencing secreted growth-inhibitory activity. The integrated dataset provides a comprehensive analysis of a beneficial Pseudomonas species.

2. Results

2.1. Genomic Characterization of Pseudomonas sp. MUP55

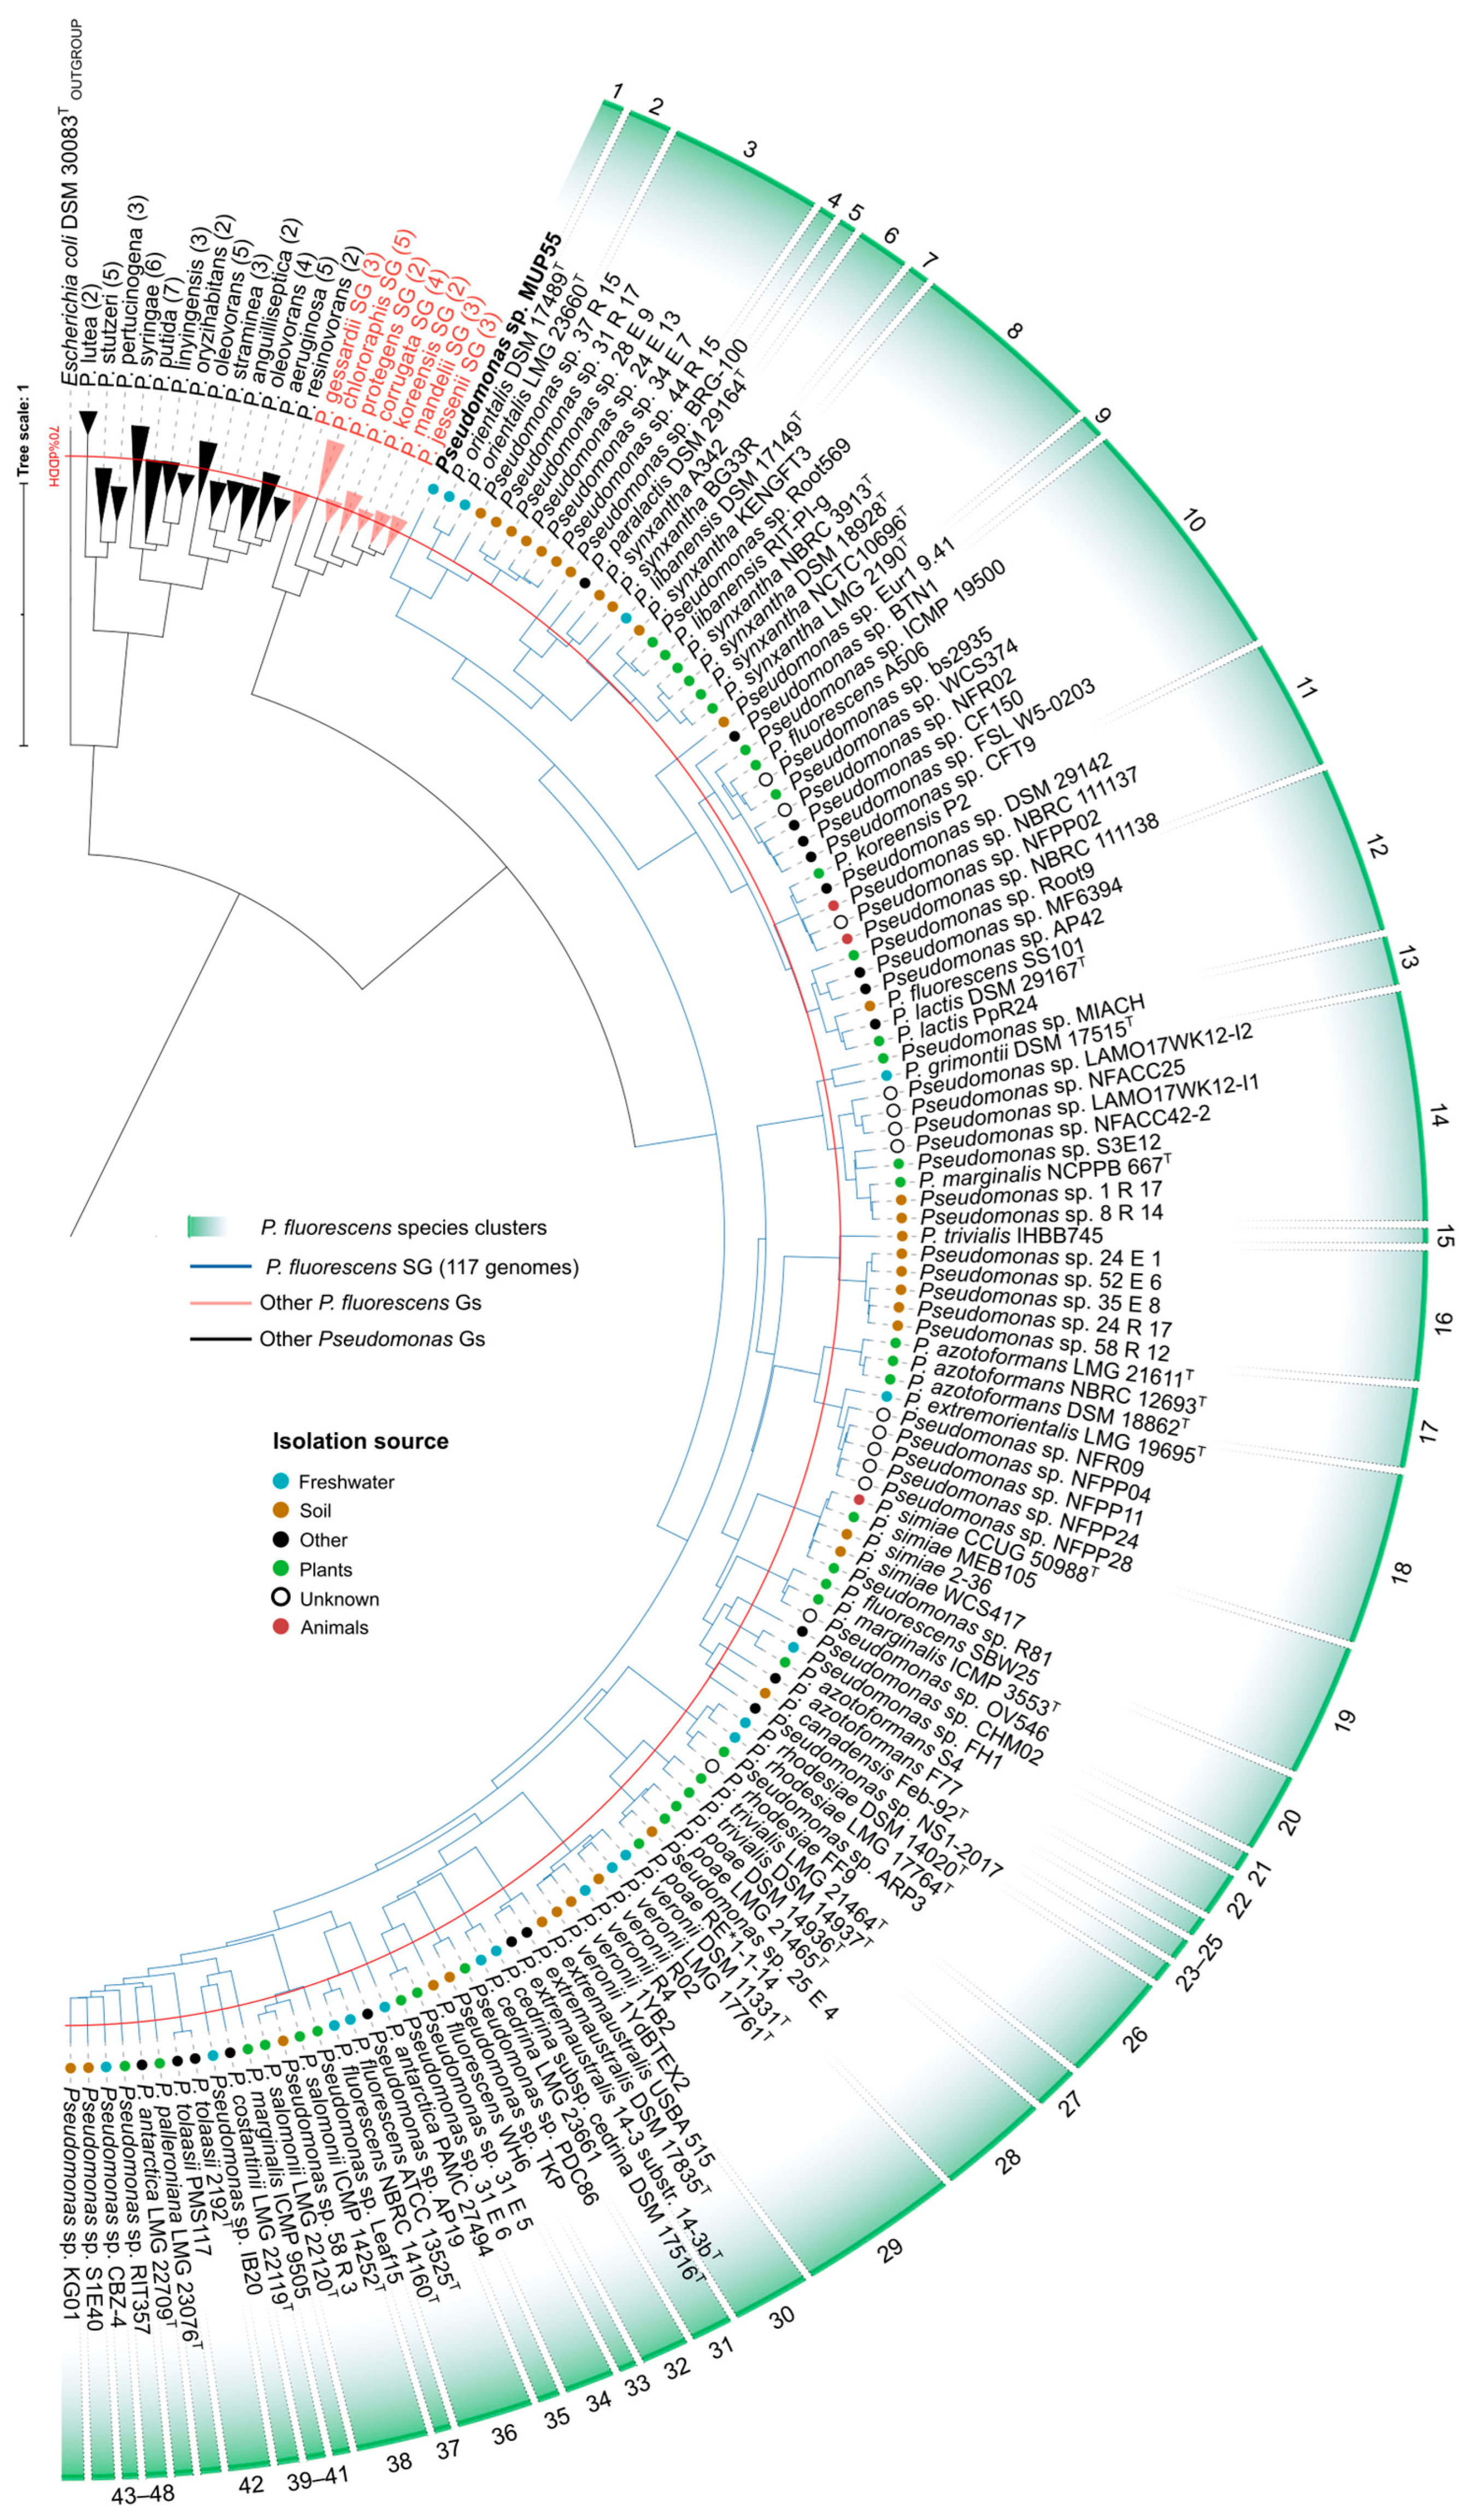
Our phylogenomic analysis establishes Pseudomonas sp. MUP55 as a species within the P. fluorescens group, with dDDH values significantly below the 70% threshold when compared to all 117 analyzed genomes. The online tool AutoMLST [25] was used to identify the closest species to Pseudomonas sp. MUP55. Among the top 997 genomes, we calculated intergenomic distances using the GBDP [26] algorithm, with the genome of Pseudomonas sp. MUP55 as a query, to select closely related genomes. Our findings indicate that a distance threshold of 0.138 unambiguously separates genomes, including Pseudomonas sp. MUP55, assigned to the P. fluorescens species group (SG) (Supplementary Table S1), resulting in 117 genomes putatively belonging to the P. fluorescens SG. These genomes were further analyzed to calculate pairwise GBDP intergenomic distances, corroborating their phylogenomic subgroup classification. The resulting phylogenomic tree (Figure 1; Supplementary Table S2) shows that the P. fluorescens SG forms a monophyletic group within the P. fluorescens species complex, with its closest neighboring subgroup being the P. gessardii SG. This phylogeny is consistent with previous analyses of the P. fluorescens species complex [27], but substantially expands the number of genomes belonging to the P. fluorescens SG.
The clustering analysis of intergenomic distances (Figure 1; Supplementary Table S2) reveals that at the species level (dDDH ≥ 70%, corresponding to a distance threshold of T = 0.036), the P. fluorescens SG comprises 48 distinct species clusters. Notably, 22 of these clusters are represented by only a single genome, including Pseudomonas sp. MUP55, indicating a potential for uncovering further diversity within this group. Additionally, the phylogenetic analysis of the P. fluorescens SG identified instances where genomes have been incorrectly assigned to SG clusters or remain unclassified. These genomes require reclassification or formal naming, especially for novel species. The strain Pseudomonas sp. MUP55 exhibited low relatedness with all other genomes in the P. fluorescens SG, with dDDH values significantly below the 70% species delineation threshold (Figure 1; Supplementary Table S2).
To further support this classification, we calculated ANI and dDDH values, together with genome size and GC content, for Pseudomonas sp. MUP55 against its 17 closest type strains identified via TYGS (Supplementary Table S3). The closest relative, by both metrics, was Pseudomonas orientalis DSM 17489 (dDDH formula d4 = 41.3%, ANI = 91.9%), both well below the recognized species thresholds (dDDH ≥ 70%; ANI ≥ 95–96%), corroborating that Pseudomonas sp. MUP55 represents a distinct species.

2.2. LC-MS and Molecular Networking Identify Massetolide A/D as the Leading Candidate Bioactive Compound

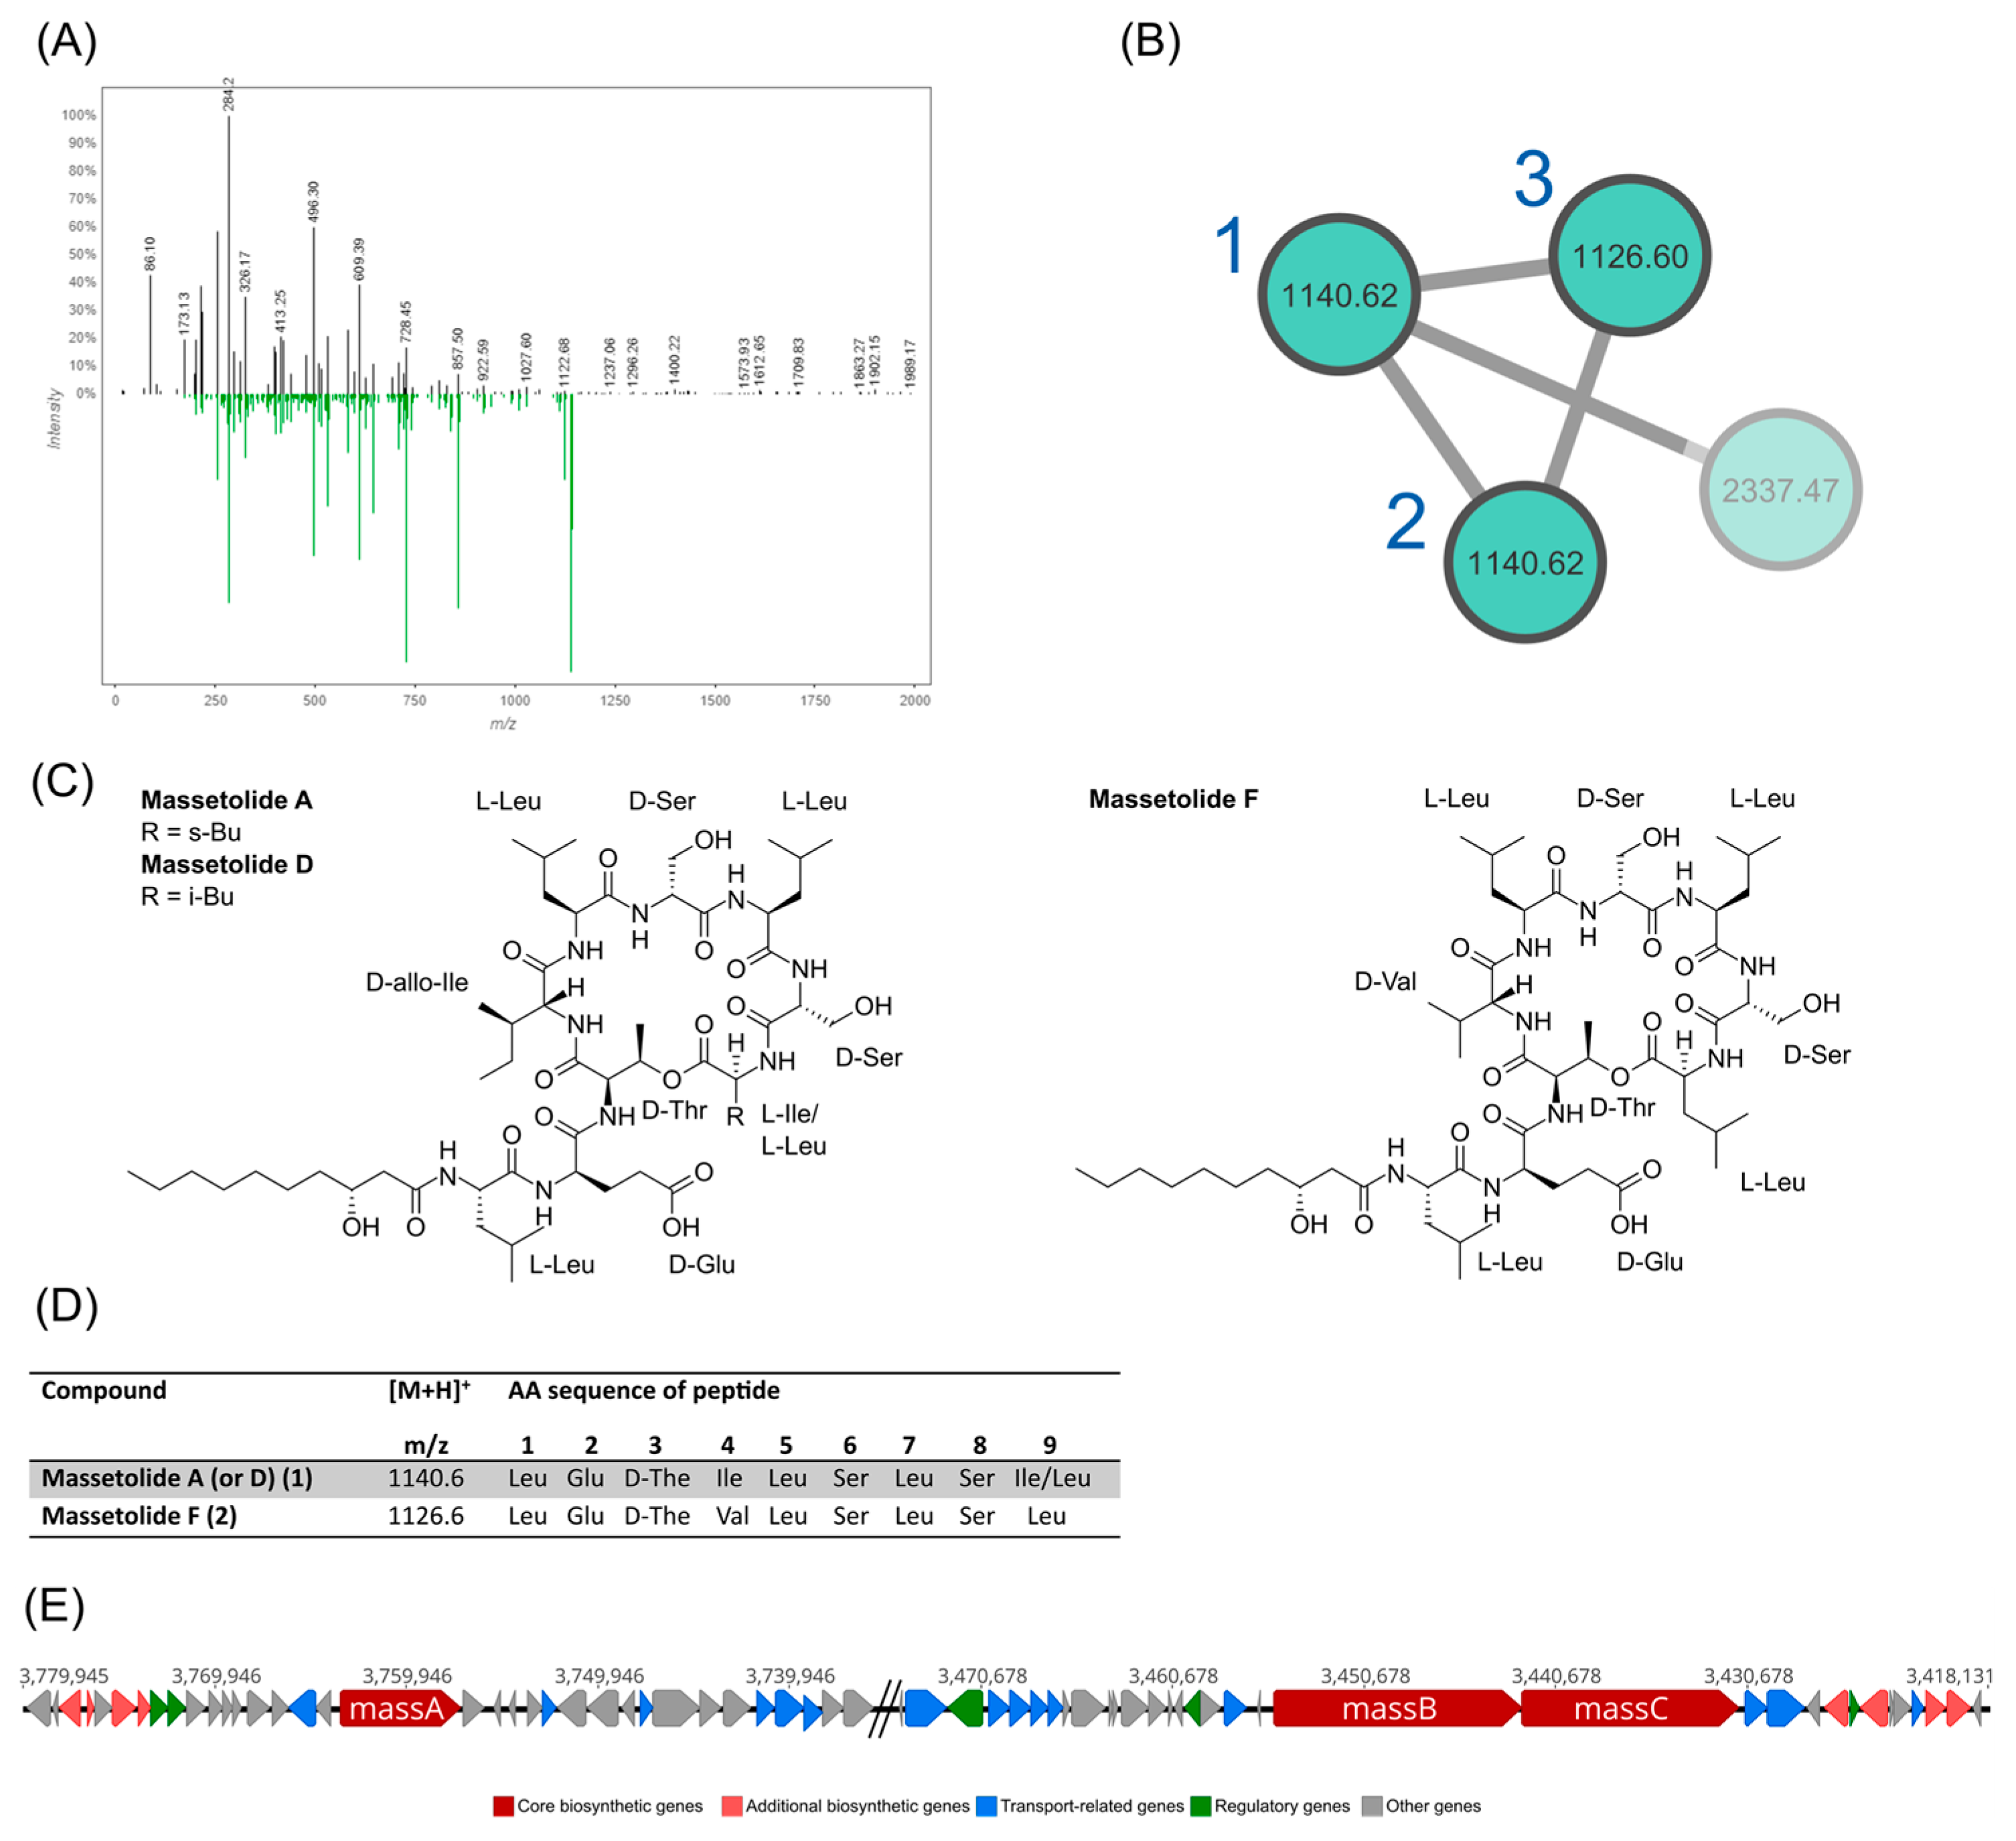
To identify the metabolite responsible for Pseudomonas sp. MUP55’s antimicrobial activity, the culture supernatant was characterized by mass spectrometry and molecular networking. LC-MS and GNPS molecular networking identified two related nodes matching library reference spectra for Massetolide A/D (m/z = 1140.6 [M + H]+; the Ile/Leu isomers could not be distinguished by the available MS/MS fragmentation data), together with a minor feature matching Massetolide F (m/z = 1126.6) (Figure 2A,B), present in the supernatant of Pseudomonas sp. MUP55 (Figure 2C,D). Massetolide A is known for its biocontrol properties, particularly against phytopathogens [19,28]; given the mass and fragmentation similarity between Massetolide A and D, we cannot rule out that both nodes represent the same isomer or a mixture of the two.
The biosynthesis of Massetolide A involves non-ribosomal peptide synthetases (NRPSs) encoded by a specific gene cluster in Pseudomonas strains [19,28]. Genomic analysis of Pseudomonas sp. MUP55 using antiSMASH [29,30] identified a biosynthetic gene cluster (BGC) containing the core biosynthetic genes massA, massB, and massC, along with transport-related and regulatory genes (Figure 2E). This BGC matches previously reported Massetolide A BGCs from P. lactis SS101 and related strains. The detection of Massetolide F alongside the ambiguous Massetolide A/D signal is consistent with some flexibility in the NRPS machinery, though we cannot confirm from the current data whether distinct A and D isomers are genuinely co-produced.

2.3. GacA Regulates Massetolide Production and Biocontrol Efficacy

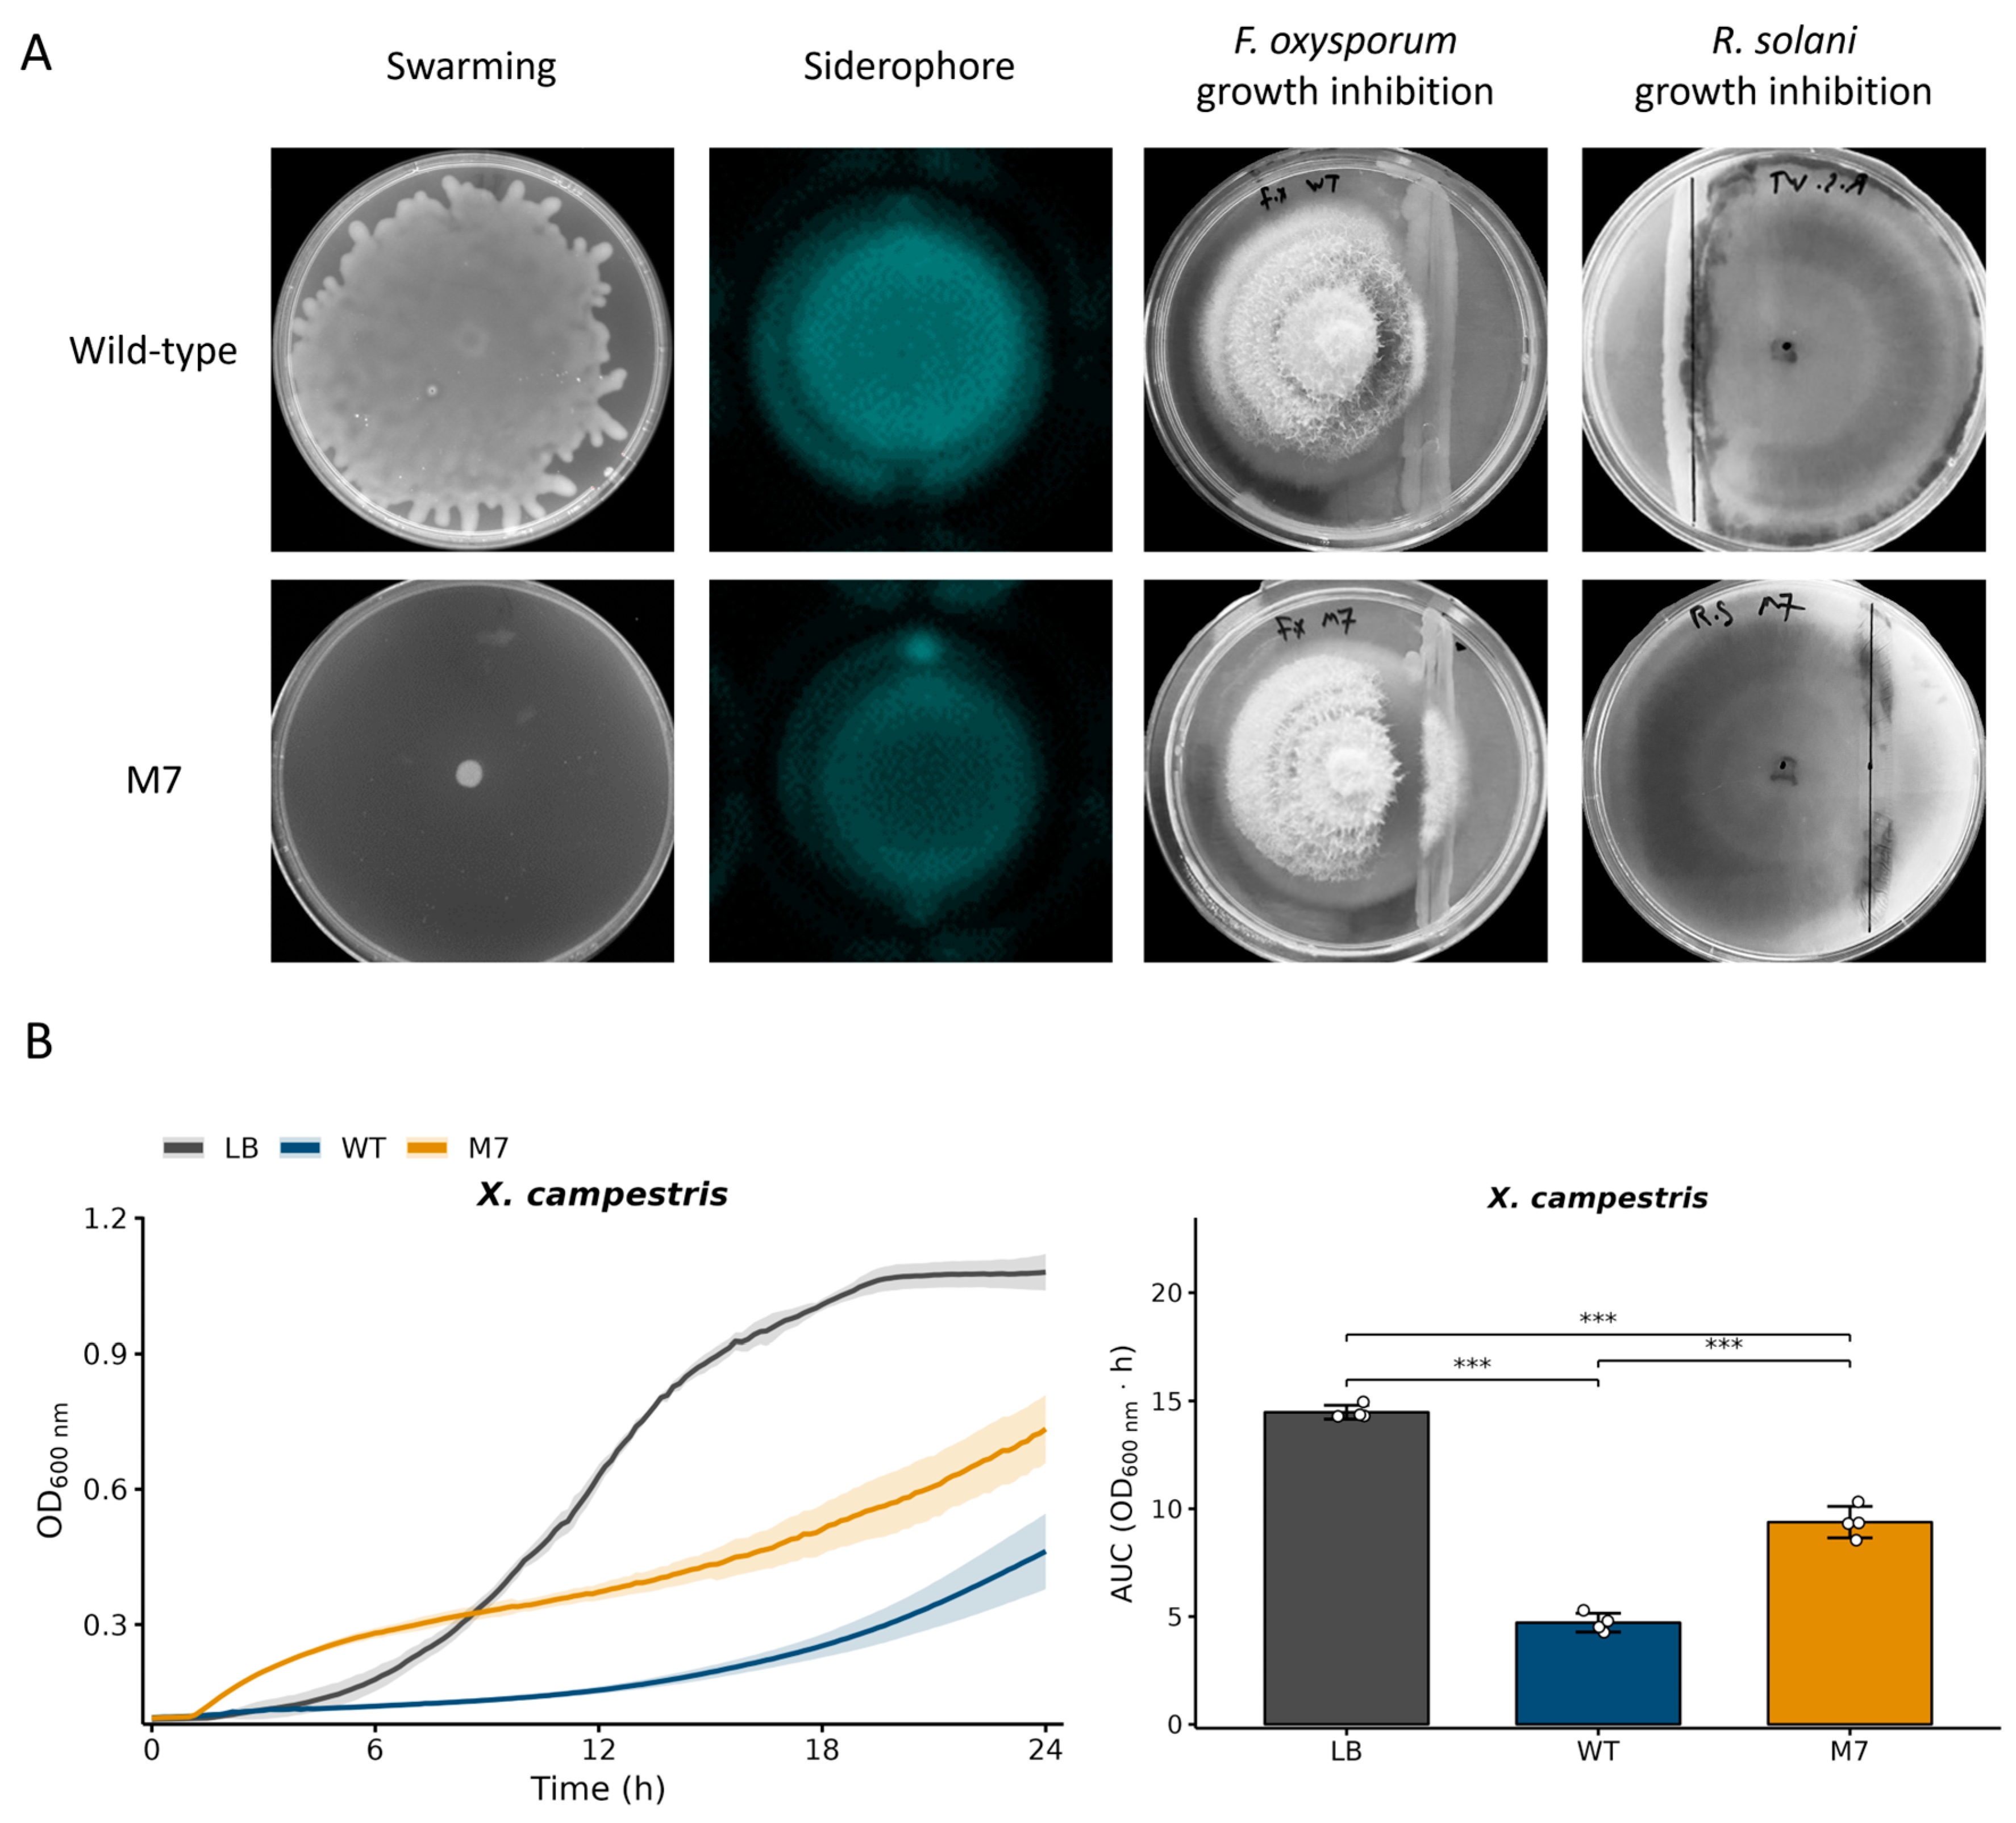
To identify regulatory determinants of biocontrol activity, swarming-deficient mutants were generated by successive subculturing on swarming plates over five cycles [31]. After five cycles, cells were spread on 1.5% LB agar, and colonies were screened for loss of swarming. Successive subculturing yielded ten swarming-attenuated mutants (M1–M10) exhibiting a range of swarming phenotypes, from partial reduction to complete loss. Mutant M7 was selected for in-depth characterization based on the complete absence of swarming motility (0% of WT diameter (Figure 3A)). Siderophore production in M7, quantified by fluorescence intensity at 405 nm, was 63% of the WT intensity (Figure 3A).
Antifungal activity revealed the most striking differences. Based on three biological replicates (SD = 0.5% for all conditions), the WT achieved 42% inhibition of radial growth of F. oxysporum and 50% inhibition of Rhizoctonia solani. In contrast, the M7 mutant showed only 12.5% inhibition against F. oxysporum and complete loss of activity against R. solani (0%; Figure 3A). Welch’s two-tailed t-tests (df = 4) confirmed both differences were highly significant (F. oxysporum: t = 72.26, p = 2.2 × 10⁻⁷; R. solani: t = 122.47, p = 2.7 × 10⁻⁸). Antibacterial activity was evaluated using cell-free supernatants of the WT and M7 strains against Xanthomonas campestris, with LB-only as the non-inhibitory control (Figure 3B). Against X. campestris, the supernatants were clearly separable. WT supernatant reduced AUC by 67%, while M7 supernatant produced only a 35% reduction, with the WT–M7 difference itself highly significant (Figure 3B). M7 therefore exhibits a substantial but partial loss of inhibitory activity against X. campestris.
LC-MS analysis confirmed complete absence of Massetolide A and related variants in M7 supernatants. Whole-genome sequencing of M7 identified a P58L point mutation in GacA, the response regulator of the GacS/GacA two-component system and the only variant detected relative to the wild-type genome [31]. This single amino acid change in the signal receiver domain of GacA is sufficient to abolish Massetolide biosynthesis, establishing GacA as an essential positive regulator of Massetolide production in Pseudomonas sp. MUP55.

2.4. Pseudomonas sp. MUP55 Supernatant Exhibits Bacteriostatic Activity Against E. coli

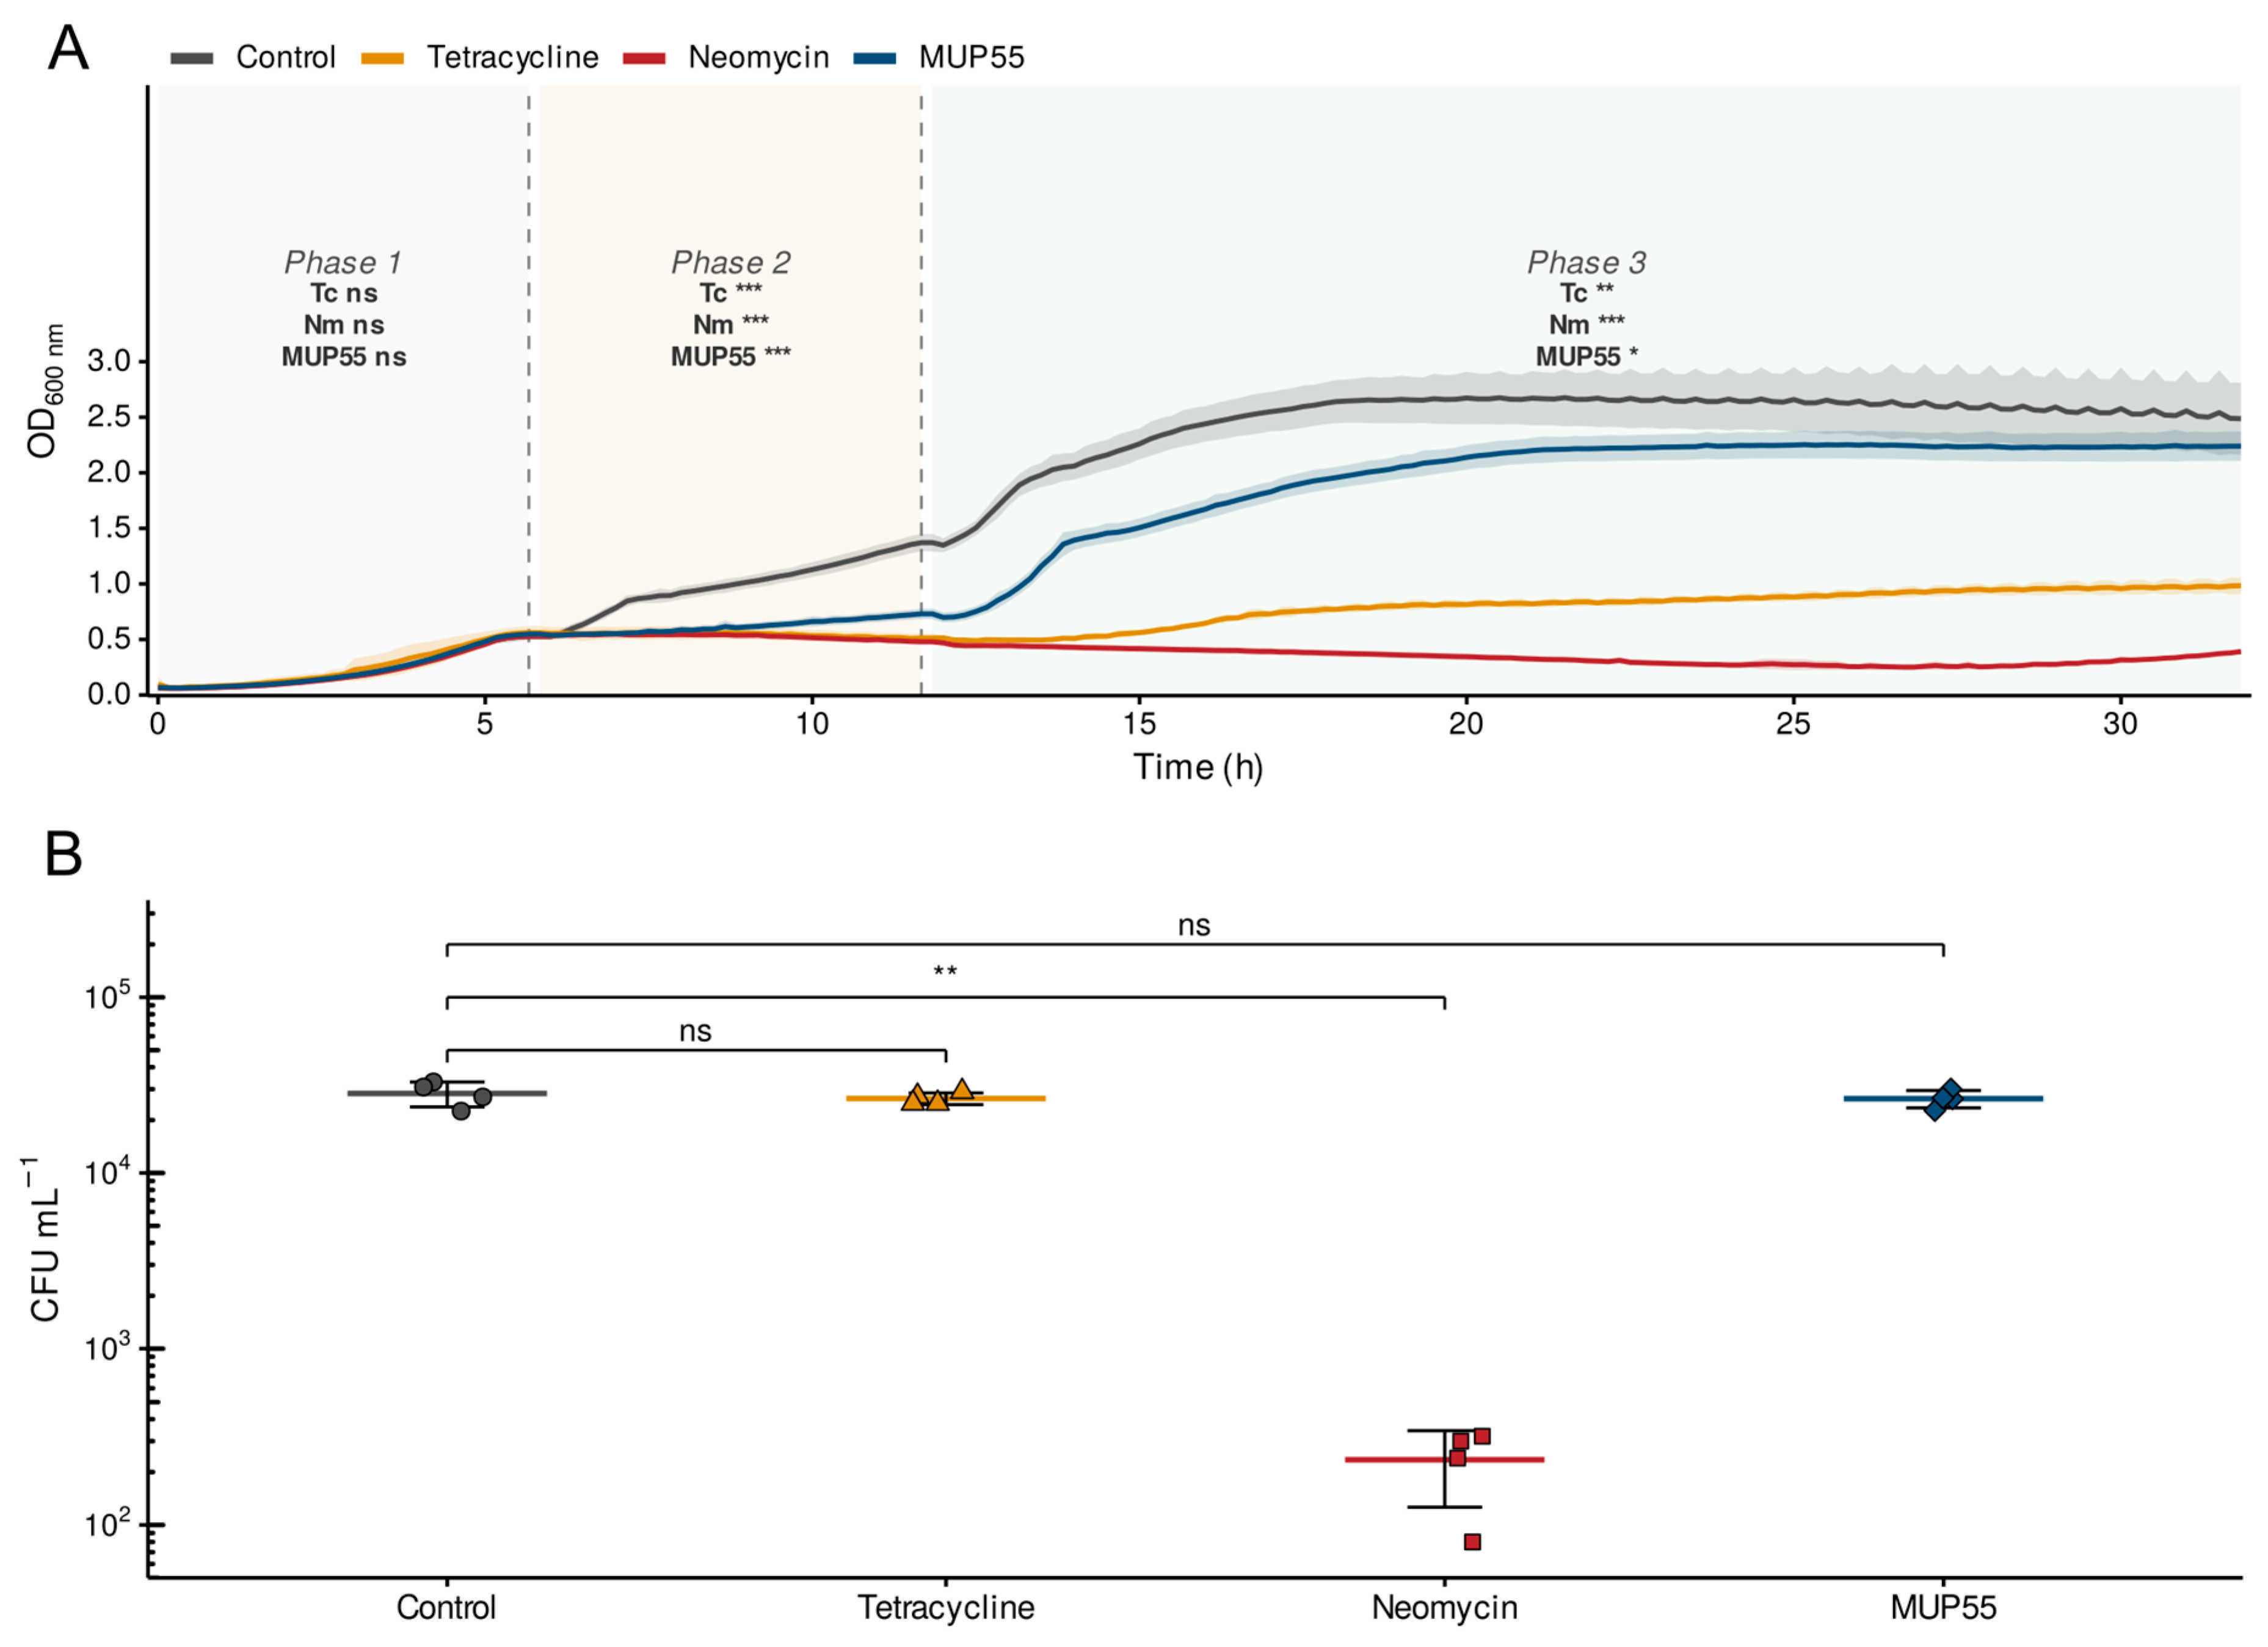
Having identified Massetolide A/D as the leading candidate antimicrobial determinant of Pseudomonas sp. MUP55, we next characterized the mode of this inhibition. To determine whether the inhibitory activity of Pseudomonas sp. MUP55 supernatant is bactericidal or bacteriostatic, a distinction rarely investigated in biocontrol studies, a three-phase optical density assay was combined with a post-treatment colony-forming unit (CFU) recovery readout, with tetracycline (bacteriostatic [32]) and neomycin (bactericidal [33]) included as reference antibiotics [34]. Escherichia coli was first grown in LB to mid-exponential phase (Phase 1); diluted into fresh medium containing either LB only (control), tetracycline, neomycin, or sterile Pseudomonas sp. MUP55 supernatant; and incubated for a further 6 h (Phase 2, treatment exposure). Cells were then pelleted, washed in fresh LB to remove residual treatment, standardized to OD600 nm = 0.2, and (i) returned to fresh LB to monitor regrowth (Phase 3, post-wash recovery) and (ii) plated on LB agar for CFU enumeration (Figure 4A).
During Phase 1, all four arms grew identically, confirming a uniform starting culture. During Phase 2, growth was significantly suppressed in all three treatments relative to the control, establishing that Pseudomonas sp. MUP55 supernatant inhibited active growth to an extent comparable to both reference antibiotics. The mean Phase 2 AUC for MUP55-treated cultures was 3.59 ± 0.21 versus 5.72 ± 0.34 for control, corresponding to a 37% reduction in total growth.
The post-wash readouts then resolved the static-versus-cidal question. Following the wash, neomycin-treated cultures yielded 235 CFU/mL, a 3-log reduction relative to control (2.83 × 10⁵ CFU/mL), confirming bactericidal activity. In contrast, both tetracycline-treated (2.65 × 10⁵ CFU/mL) and MUP55-treated (2.65 × 10⁵ CFU/mL) cultures recovered CFU counts statistically indistinguishable from the control (Figure 4B), indicating that cells exposed to Pseudomonas sp. MUP55 supernatant remained viable. Consistent with this, in Phase 3, the MUP55-exposed cells resumed growth and reached a final OD600 nm of 2.25, approaching the control endpoint of 2.65, whereas neomycin-treated cells failed to recover and tetracycline-treated cells exhibited only partial recovery within the observation window. Together, the equivalence in CFU recovery and the resumption of exponential growth after washout demonstrate that Pseudomonas sp. MUP55 supernatant exerts a bacteriostatic rather than bactericidal effect on E. coli.

2.5. pvfC Contributes to Secreted Growth-Inhibitory Activity

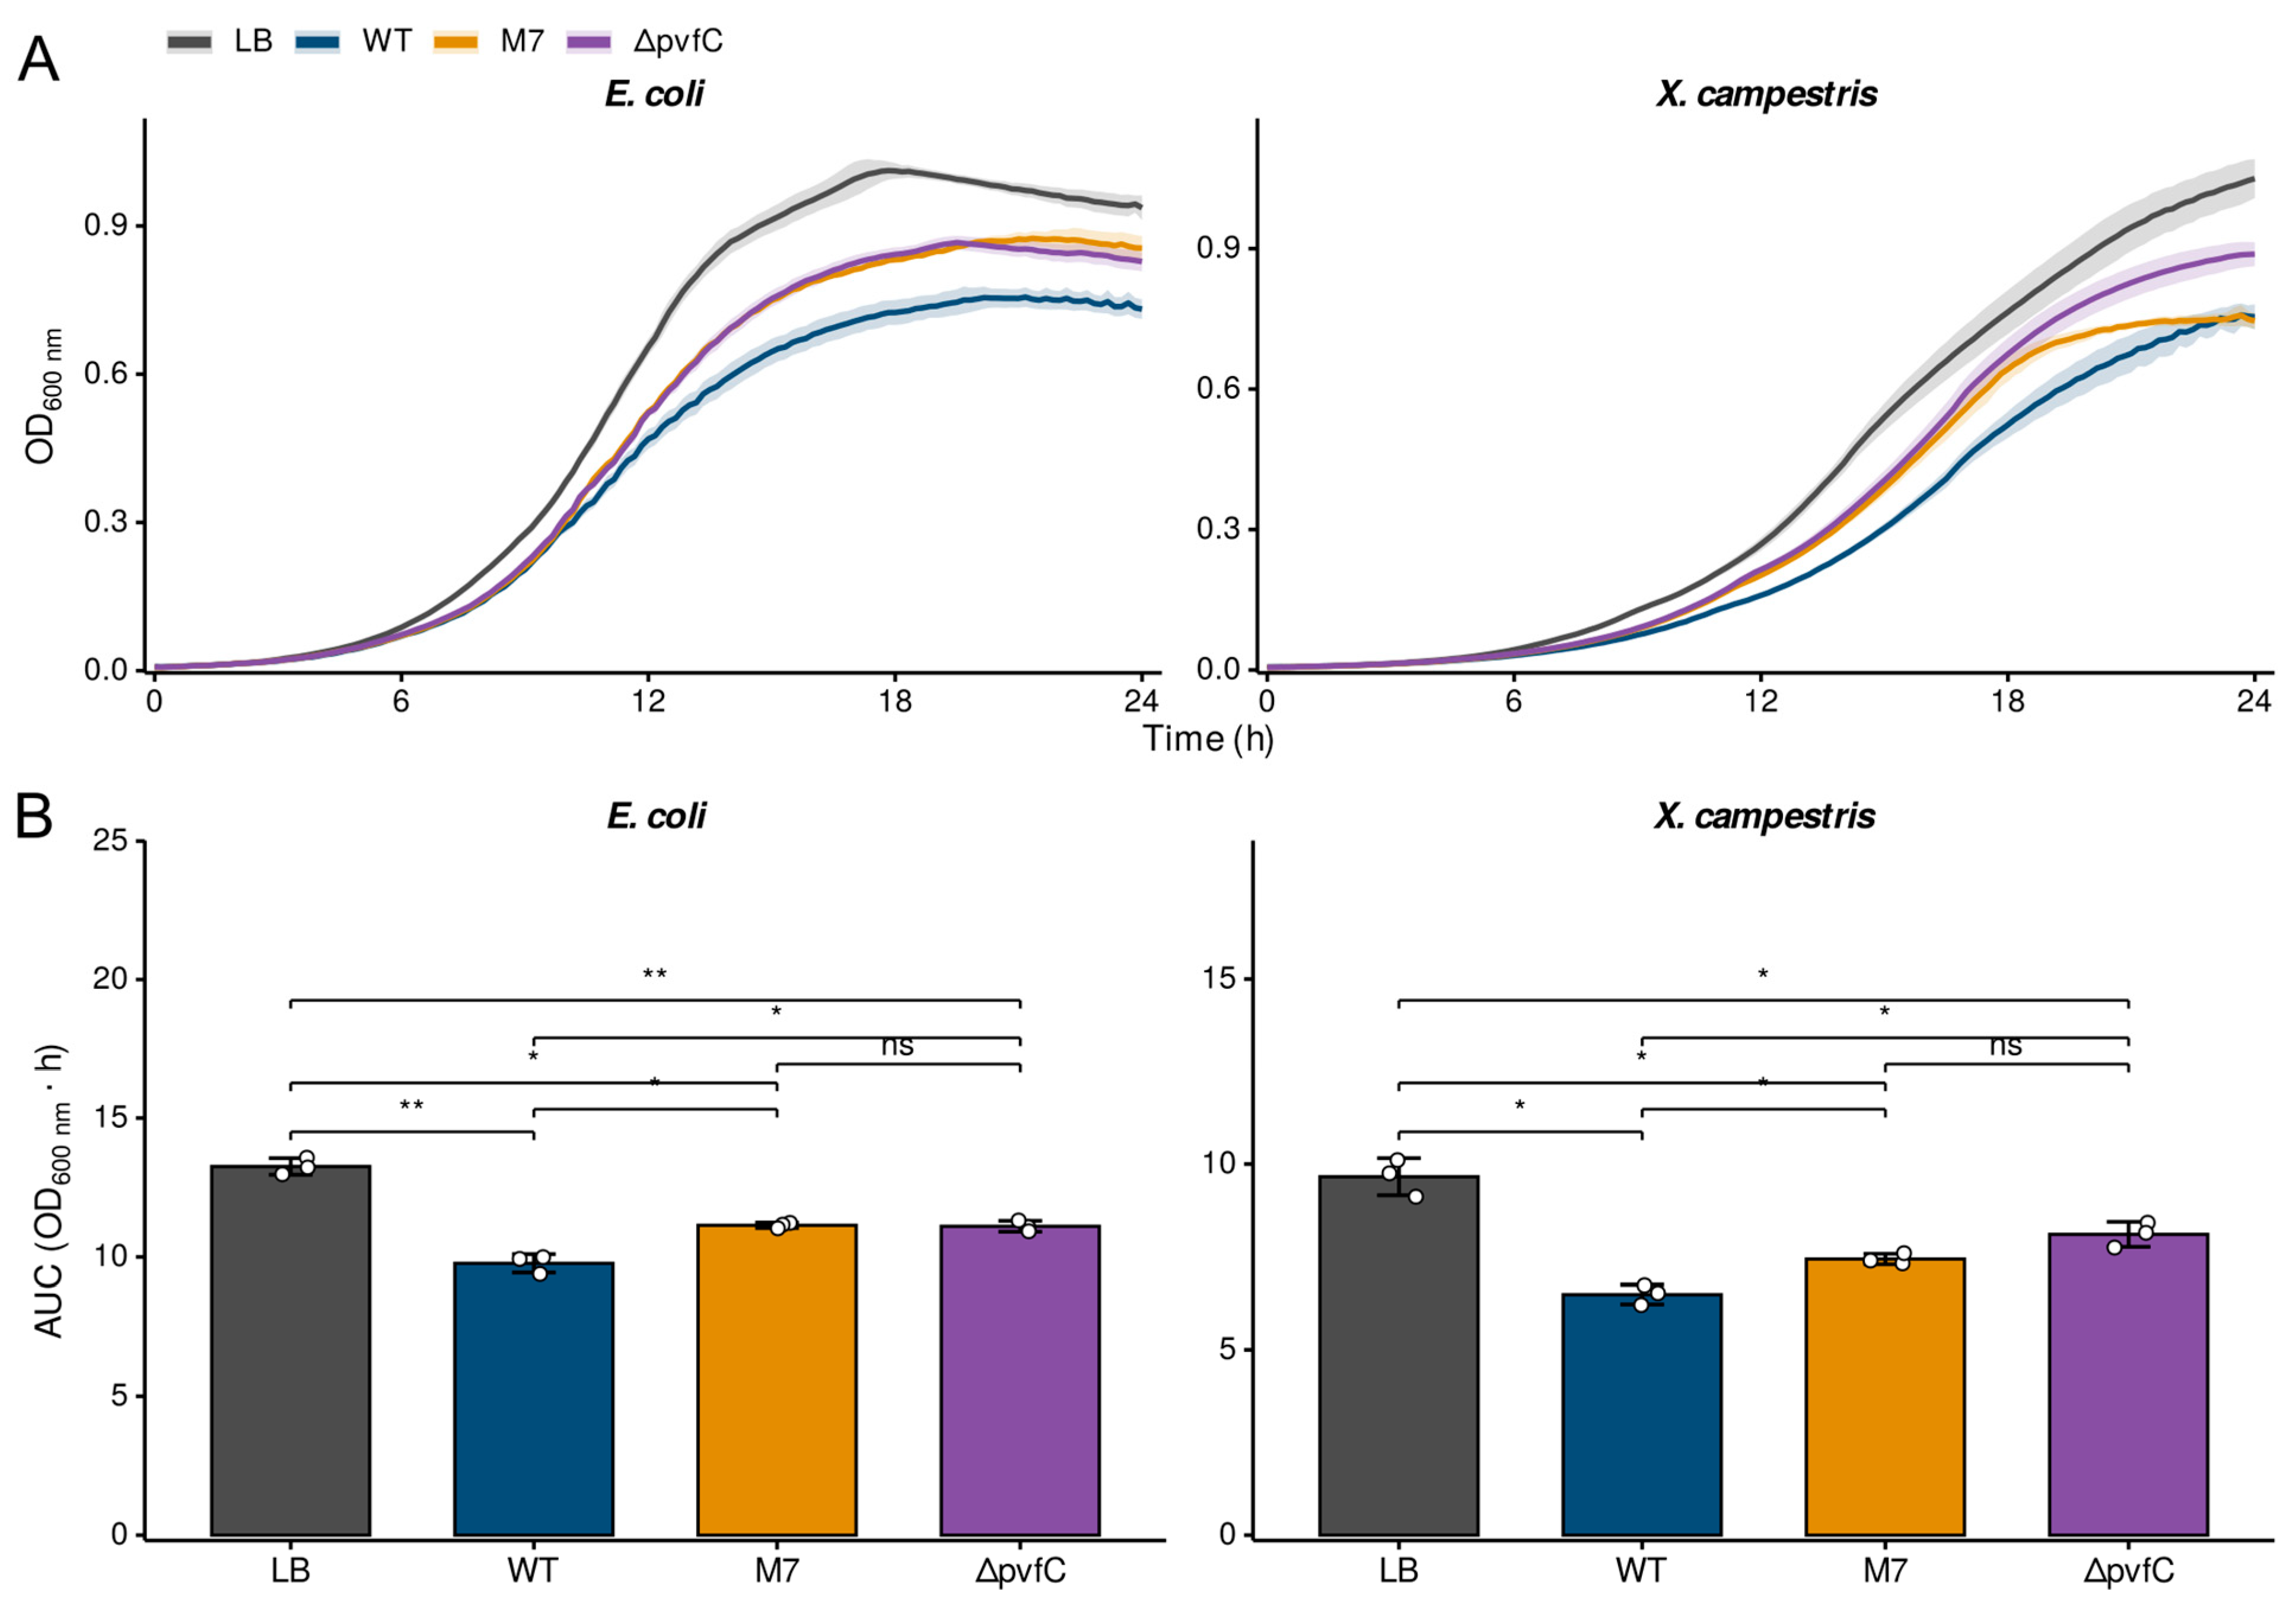
The incomplete loss of antibacterial activity in M7, despite the complete absence of Massetolide, indicated that additional secreted compounds contribute to inhibition. To dissect the contribution of pvfC-cluster products to the inhibitory secretome of Pseudomonas sp. MUP55, growth of E. coli and X. campestris was monitored over 24 h in 1:1 v/v dilutions of cell-free supernatants of WT, M7, and ΔpvfC into LB, alongside an LB-only control (Figure 5). Total growth per replicate was summarized as the trapezoidal area under the OD600 nm curve (AUC, 0–24 h). All three supernatants significantly inhibited E. coli growth relative to the LB control (Figure 5A,B), consistent with the bacteriostatic effect characterized in the preceding section. WT supernatant was the most potent, while M7 supernatant and ΔpvfC supernatant each produced significantly less inhibition than WT (WT vs. M7 p_adj = 0.026; WT vs. ΔpvfC p_adj = 0.022). M7 and ΔpvfC supernatants were statistically indistinguishable from each other (p_adj = 0.80). The combined effect, that loss of Massetolide (in M7) or loss of pvfC (in ΔpvfC) reduces inhibitory activity to a similar partial extent, while WT remains substantially more potent than either single mutant, is consistent with Massetolide and pvfC-cluster products contributing overlapping but distinct antimicrobial activities against E. coli. X. campestris showed the same qualitative pattern (Figure 5A,B). All three supernatants inhibited X. campestris growth relative to LB (WT 32.8%, M7 23.0%, and ΔpvfC 16.1% reduction in AUC; all p_adj < 0.05). WT supernatant was significantly more inhibitory than M7 (p_adj = 0.045) and ΔpvfC (p_adj = 0.017); the M7-versus-ΔpvfC comparison did not reach significance after correction (p_adj = 0.060). As for E. coli, the WT supernatant exceeded both single-mutant supernatants in inhibitory activity, and neither single mutation abolished inhibitory activity entirely.

2.6. The pvf Signaling Pathway Is Associated with Broad Transcriptional Changes

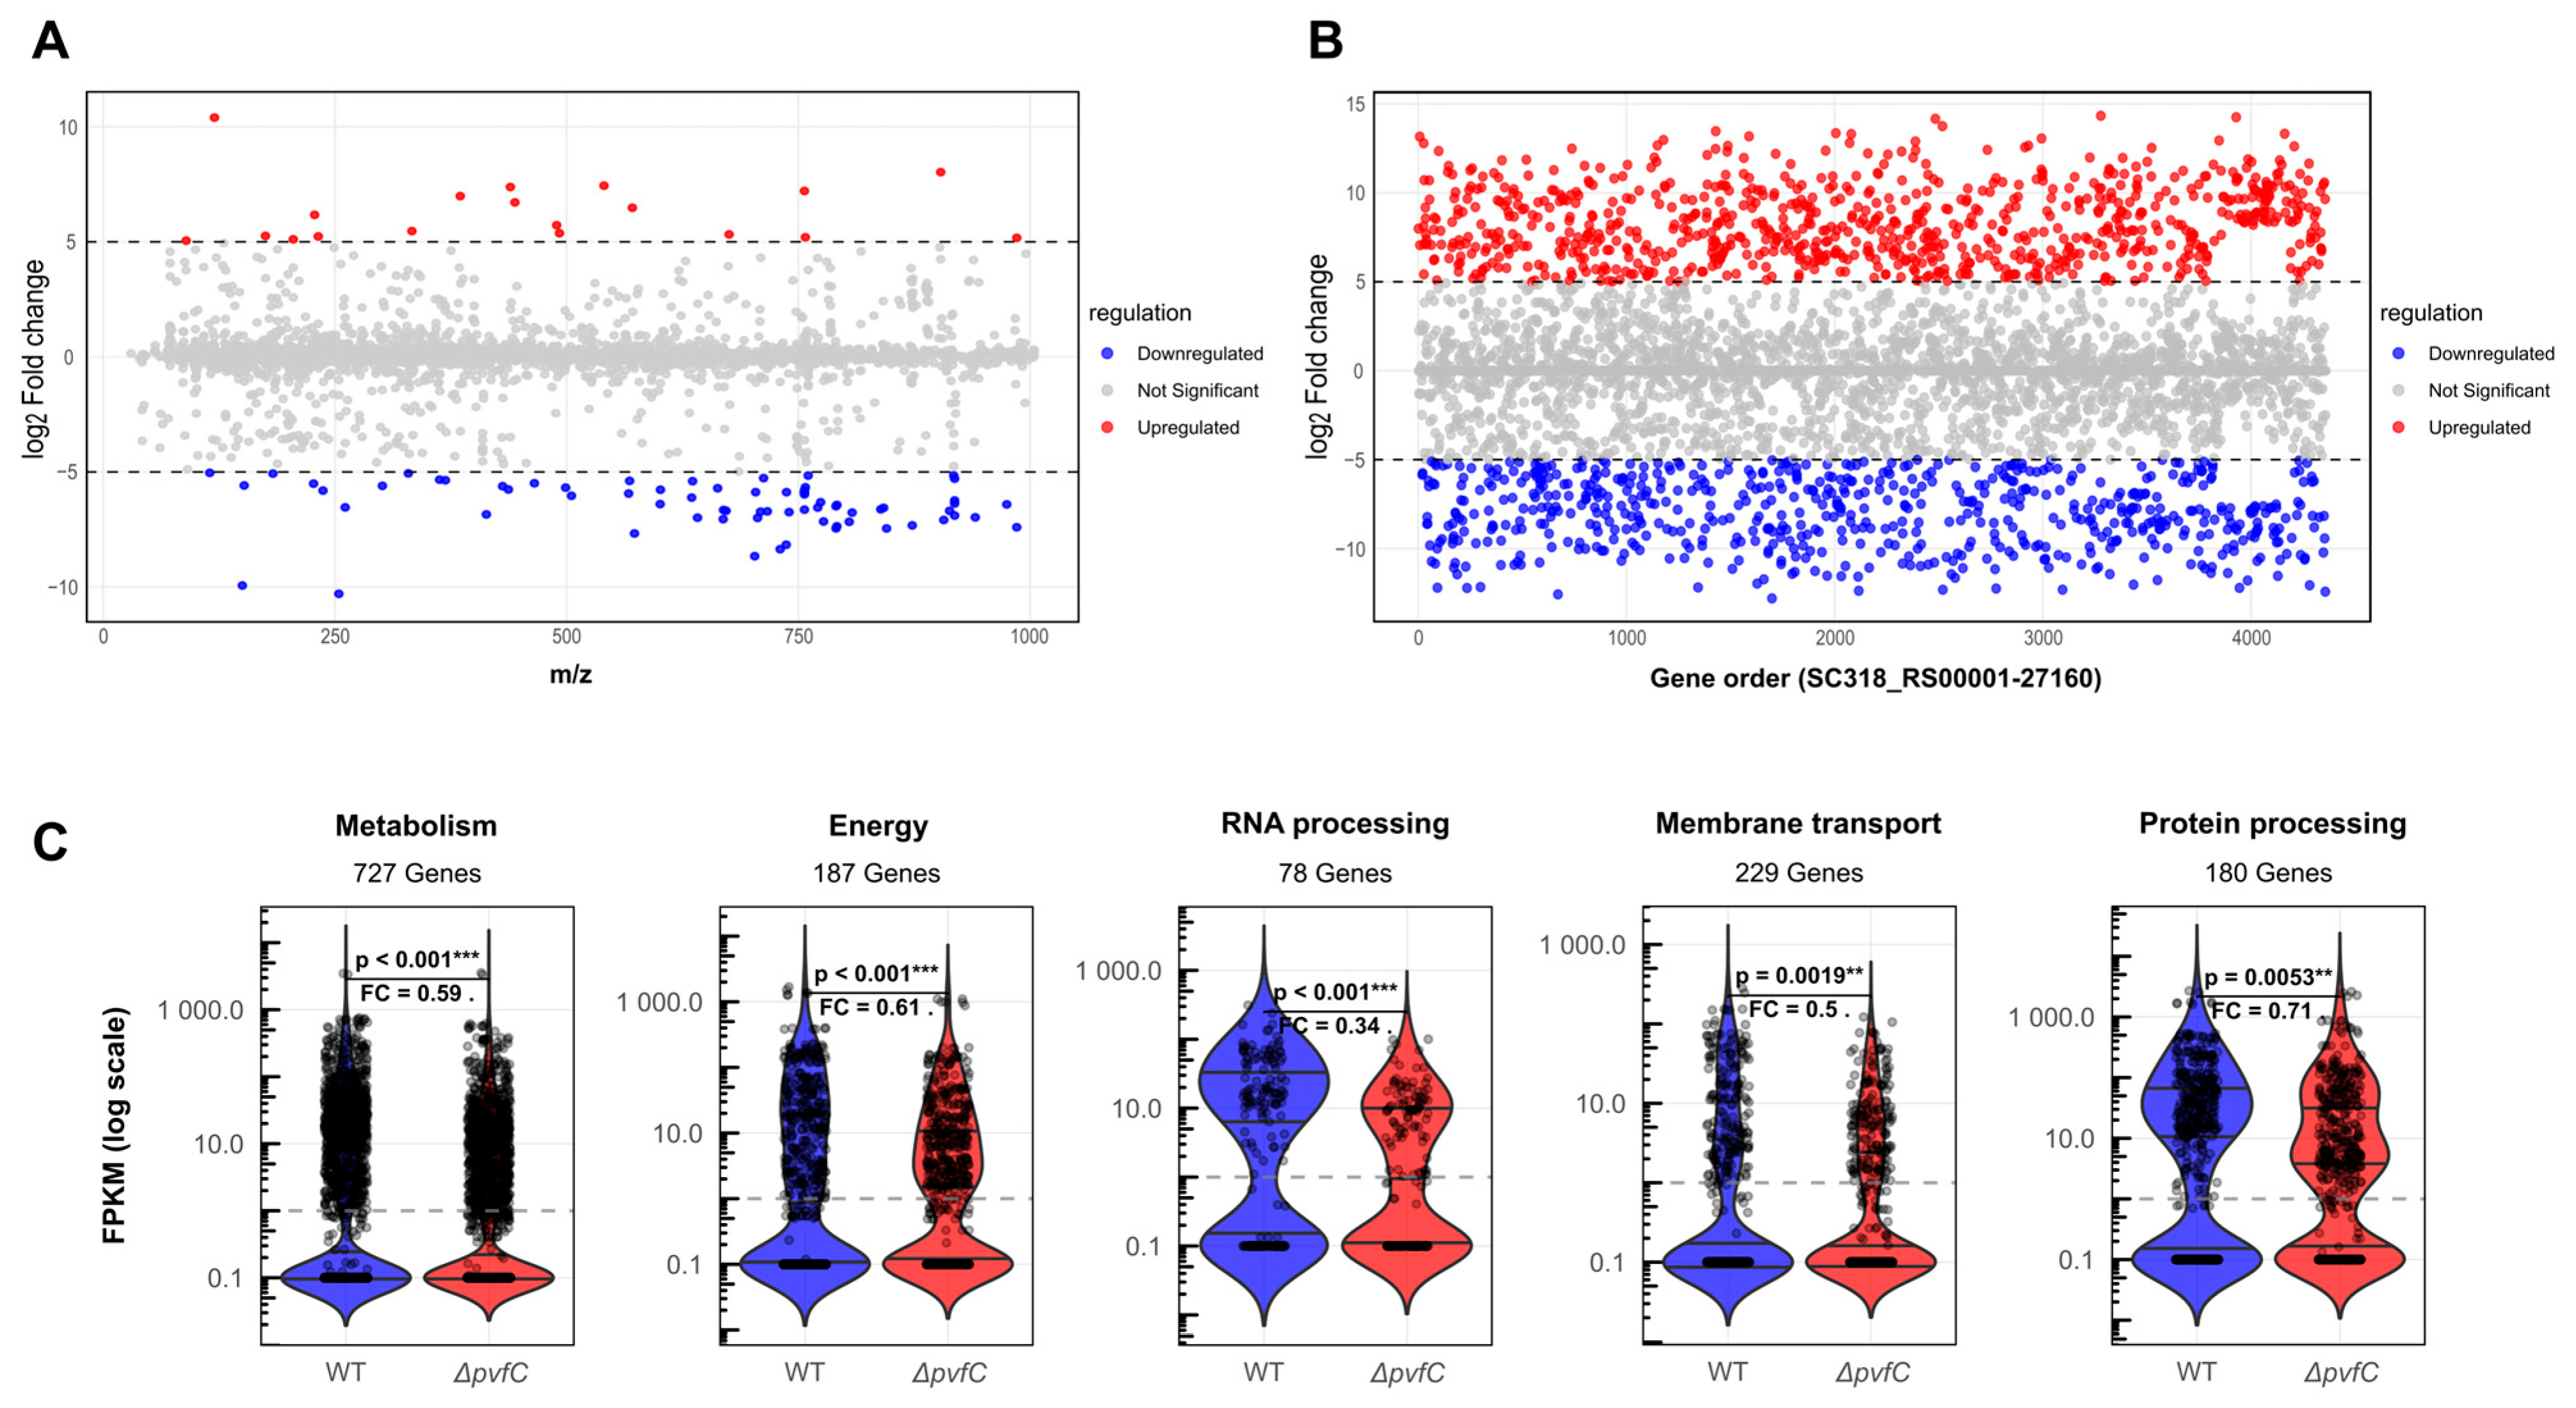
Comparative metabolomics (XCMS) and transcriptomics comparing WT and ΔpvfC strains revealed extensive transcriptional changes associated with loss of the pvf signal (Figure 6). PvfC itself is an enzyme required for biosynthesis of the pvf signaling molecule; the broad transcriptional impact described below reflects the downstream consequences of losing this signal, which may include loss of the signal itself, secondary physiological effects, altered growth state, and indirect regulatory cascades, rather than direct transcriptional regulation by PvfC. Of 1413 metabolite features detected, 70 were downregulated and 19 upregulated in ΔpvfC (Figure 6A); these features were flagged using an uncorrected, exploratory significance threshold and represent candidates for follow-up rather than statistically confirmed differentially abundant metabolites. Of 4359 genes with measurable expression, 848 showed upregulation and 647 showed downregulation in ΔpvfC compared to WT, with log2 fold changes ranging from −12.80 to +14.33 (Figure 6B).
Functional categorization across five major cellular function categories revealed statistically significant expression differences (Figure 6C). The most dramatic changes were observed in RNA processing genes (78 genes), where expression in the ΔpvfC strain was reduced to approximately one-third of WT levels. Significant downregulation was also observed in metabolism (727 genes), energy metabolism (187 genes), membrane transport (229 genes), and protein processing (180 genes) categories, indicating a broad regulatory impact of pvfC on essential cellular functions.

2.7. PvfC Differentially Regulates Dual Siderophore Systems

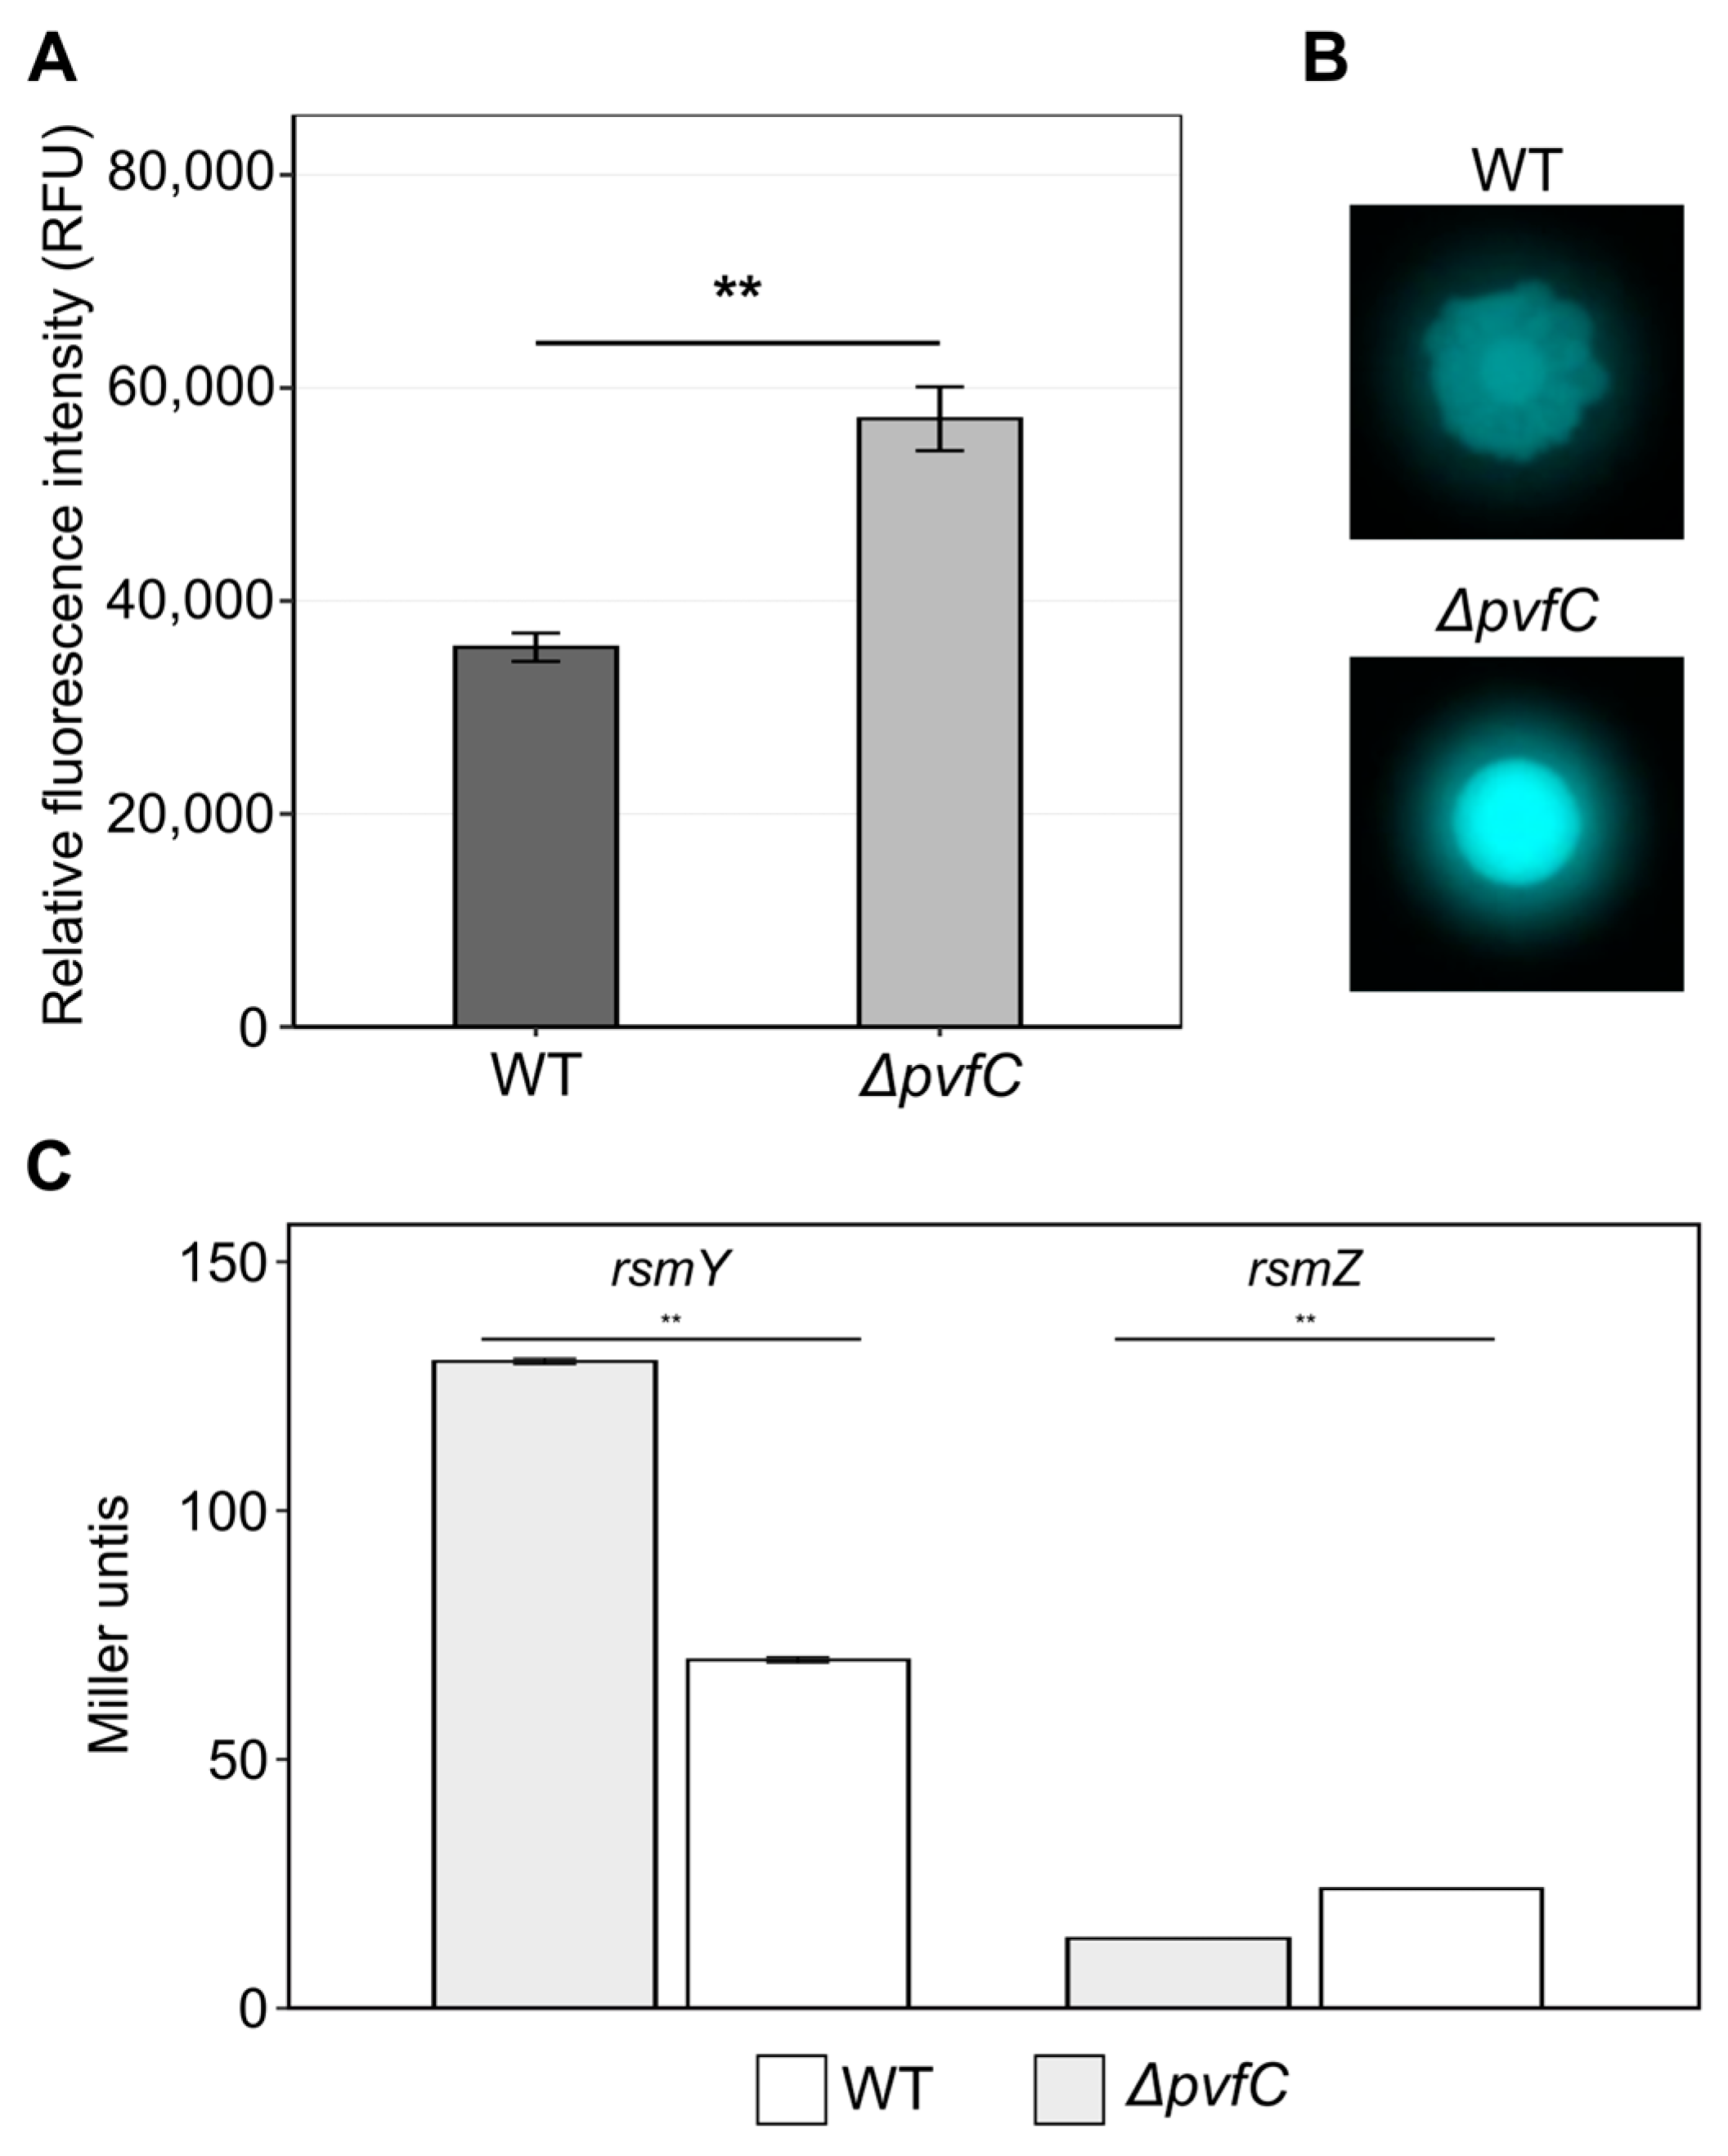
A striking example of pvfC’s regulatory role was observed in siderophore production. The ΔpvfC mutant exhibited significantly increased fluorescence compared to WT (Figure 7A,B), indicating altered siderophore production. Genomic analysis confirmed that Pseudomonas sp. MUP55 possesses two distinct siderophore biosynthetic pathways: NRPS-independent (producing a triabactin-like compound [35]), and the NRPS-dependent pyoverdine system (Table 1).
Transcriptomic profiling showed that PvfC reciprocally regulates the two siderophore systems. The triabactin-like gene trbA was strongly and significantly induced in ΔpvfC (log2FC +11.0, padj = 1.3 × 10⁻¹¹); trbC showed a similarly large nominal increase (log2FC +11.2) that narrowly missed conventional significance after correction (padj = 0.053), whereas the core pyoverdine biosynthesis and uptake genes were repressed in ΔpvfC (pyoverdine NRPS −8.1, fpvA −6.6, PvdM −5.2 log2FC; only minor accessory genes such as the PvdJ/PvdD/PvdP-like protein were elevated, +1.7). Because pyoverdine fluorescence reports the iron-free (apo) form and is quenched upon Fe3+ binding, the increased fluorescence of the mutant most likely reflects an enlarged apo-pyoverdine pool rather than greater pyoverdine synthesis: reduced expression of the ferripyoverdine receptor fpvA would limit reuptake of iron-loaded pyoverdine and favor extracellular accumulation of the fluorescent apo form, while the post-transcriptional action of the pvf/Gac–Rsm system means pyoverdine output need not track transcript abundance. PvfC therefore appears to reshape the iron-acquisition strategy in Pseudomonas sp. MUP55, derepressing the triabactin-like system while repressing pyoverdine biosynthesis and uptake, rather than uniformly increasing siderophore production (Table 1).

2.8. PvfC Modulates the Massetolide Regulatory Network and Uncouples rsmY and rsmZ

Transcriptomic analysis revealed nominal expression changes in several genes associated with the Massetolide biosynthetic regulatory network (Table 2), although most did not reach statistical significance after correction for multiple testing (padj < 0.05). The transcriptional regulators luxR1 (log2FC = 1.68; padj = 0.61) and luxR2 (log2FC = 8.97; padj = 0.12) trended toward upregulation in the ΔpvfC strain, and the anti-sigma factor gene prtR trended toward downregulation (log2FC = −10.69; padj = 0.064), approaching but not reaching significance. If genuine, these trends would be consistent with a model in which reduced prtR expression contributes to luxR2 upregulation, given the previously reported regulatory relationship between prtR and luxR2 [18]; however, this should be treated as a hypothesis for future validation rather than an established regulatory link.
To further investigate effects on the Gac/Rsm regulatory pathway, expression of rsmY and rsmZ was measured using β-galactosidase reporter assays (promoter::lacZ fusions). Remarkably, rsmY expression increased significantly in the ΔpvfC mutant compared to WT, while rsmZ expression decreased significantly (Figure 7C). This uncoupling of two typically co-regulated small RNAs represents a novel regulatory mechanism by which pvfC influences the Gac/Rsm pathway, suggesting that PvfC interacts with specific regulatory components that differentially target rsmY and rsmZ. Of the Massetolide NRPS structural genes, massB was significantly downregulated in ΔpvfC (log2FC = −2.38, padj = 0.042), while massA showed a large nominal fold-change (log2FC = 6.06) that could not be reliably assessed due to exclusion by independent filtering, and massC showed no notable change. The significant change in massB indicates that PvfC’s influence on the Massetolide biosynthetic gene cluster may not be limited to upstream signaling components as previously proposed, and that a direct or indirect effect on at least one structural gene cannot be excluded (Table 2).

3. Discussion

The isolation of Pseudomonas sp. MUP55 from rainwater in Western Australia and its classification as a distinct species within the P. fluorescens SG highlights the untapped microbial diversity present in non-soil environmental sources. The singleton status of Pseudomonas sp. MUP55 at the dDDH ≥ 70% threshold, alongside 21 other singleton clusters among the 48 species clusters identified, highlights how substantially the true diversity of this group remains uncharted.
The identification of Massetolide A/D as the leading candidate bioactive compound(s), supported by LC-MS, GNPS molecular networking, and antiSMASH BGC annotation, is consistent with the established role of this cyclic lipopeptide class as a key antimicrobial in plant-beneficial Pseudomonas strains [17,18]. The two isomers could not be distinguished by the available MS/MS fragmentation data; this, together with the detection of a minor Massetolide F feature, is consistent with some flexibility in the NRPS machinery, though we cannot confirm from the current data whether both isomers are genuinely co-produced or represent a single compound matched ambiguously to both library entries. The bacteriostatic, rather than bactericidal, mode of action demonstrated against E. coli is a distinction rarely investigated in biocontrol studies; whether this holds for other pathogens remains an important open question.
The GacA P58L mutation, sufficient to abolish Massetolide biosynthesis entirely and substantially reduce biocontrol efficacy, confirms GacS/GacA as an essential regulatory axis for CLP production in Pseudomonas sp. MUP55. The proline substitution at position 58 of the receiver domain likely disrupts the conformational change required for downstream signal transduction, consistent with spontaneous loss-of-function gac mutations documented in P. protegens under swarming selection [30]. The partial retention of antibacterial activity against X. campestris in M7 despite complete Massetolide loss indicates that additional GacA-independent antimicrobial compounds are produced by Pseudomonas sp. MUP55, warranting further chemical characterization. As M7 arose by spontaneous mutation and was not genetically complemented, attribution of these phenotypes to the P58L substitution, although it was the only genomic change detected relative to the wild type, would be strengthened in future work by complementation or by a defined Massetolide-biosynthesis mutant. A defined biosynthesis mutant would also separate the lipopeptide’s direct contribution from the broader GacA regulon, since the antifungal activity was scored in a live dual-culture format that additionally reflects siderophore, volatile, and competitive effects, whereas the antibacterial activity was assessed with cell-free supernatant. The ΔpvfC mutant used throughout this study was similarly not genetically complemented; as with M7, causal attribution of pvfC-dependent phenotypes should be treated as correlative pending complementation or equivalent confirmatory evidence.
A significant contribution of this study is evidence that the pvf cluster of Pseudomonas sp. MUP55 contributes both to the regulation of specialized metabolism and to secreted growth-inhibitory activity. While prior work on pvf homologues in P. entomophila [21,22], B. cenocepacia [23], and P. syringae [24] has focused primarily on regulatory signaling roles, the partial but reproducible reduction in inhibitory potency of ΔpvfC supernatants against both E. coli and X. campestris indicates that pvfC contributes to the secreted antimicrobial phenotype of Pseudomonas sp. MUP55, in addition to its broader regulatory functions; we have not isolated or directly tested a pvf-derived metabolite for antimicrobial activity, and a more parsimonious interpretation, that pvfC deletion alters production of other secreted inhibitory metabolites such as Massetolide A/D, cannot be excluded. Disentangling the direct biosynthetic contribution from indirect effects mediated by pvfC’s global regulatory role will require dedicated biochemical characterization of pvf-dependent metabolites in future work.
The global transcriptomic impact of pvfC deletion, affecting over a third of expressed genes, places the pvf cluster in a regulatory tier above most characterized secondary metabolite gene clusters, although we note that most of the individual regulatory genes examined in this network did not themselves reach statistical significance after correction for multiple testing (Table 2), and the effect of pvfC deletion on this specific regulatory cascade should be interpreted as a trend rather than an established result. Most striking is the uncoupling of rsmY and rsmZ, two small RNAs generally treated as functionally redundant outputs of the Gac/Rsm pathway [18,20]. The opposing direction of their expression changes in ΔpvfC, alongside a nominal, though not statistically significant, downregulation of the anti-sigma factor prtR (log2FC = −10.69, padj = 0.064) and a corresponding nominal upregulation of luxR2 (log2FC = 8.97, padj = 0.12), is consistent with a model in which the pvf cluster interfaces with the Gac/Rsm cascade through a component that selectively influences rsmZ but not rsmY transcription; however, this specific link should be treated as a hypothesis for future validation rather than a demonstrated mechanism. Because the rsmY/rsmZ uncoupling itself rests on promoter–reporter fusions, direct quantification of the two small RNAs would be valuable to confirm it, alongside validation of the prtR/luxR1/luxR2 trend. Notably, of the Massetolide biosynthetic genes, massB was significantly downregulated in ΔpvfC (log2FC = −2.38, padj = 0.042), indicating that pvfC’s influence on the Massetolide gene cluster may not be confined to upstream signaling components as initially proposed, and that a direct or indirect effect on at least one structural gene cannot be excluded. The bidirectional control of dual siderophore systems, simultaneously suppressing the NRPS-independent pathway while sustaining the NRPS-dependent pathway, further shows how the pvf cluster coordinates competing iron acquisition strategies, likely optimizing competitive fitness under the iron-limiting conditions of the rhizosphere.
Several limitations should be considered when interpreting these findings. Neither the GacA P58L mutant (M7) nor the ΔpvfC mutant was genetically complemented, so phenotypic attributions for both remain correlative rather than causal. Evidence for the antimicrobial contribution of the pvf cluster and of Massetolide A/D is indirect, relying on loss-of-function phenotypes rather than direct testing of purified compounds. The rsmY/rsmZ uncoupling and the prtR/luxR1/luxR2 regulatory trend rest on promoter–reporter and transcriptomic data, respectively, that would benefit from direct transcript-level validation. Finally, taxonomic characterization of Pseudomonas sp. MUP55, while supported by dDDH, ANI, and phenotypic/chemotaxonomic data, has not yet been extended to a full comparative phenotypic panel beyond antimicrobial traits.

4. Materials and Methods

4.1. Culture Conditions

Pseudomonas sp. MUP55 and X. campestris pv. campestris (WAC14181) were routinely cultured in LB medium at 28 °C (200 rpm). E. coli DH5α (New England Biolabs, Notting Hill, VIC, Australia) was grown in LB medium at 37 °C (200 rpm) for routine culture; for the antimicrobial, bacteriostatic, and supernatant-inhibition assays, it was incubated at 28 °C to match the other test strains. F. oxysporum (WAC10262) and R. solani (WAC14439) were cultured on PDA (Becton Dickinson Difco, Macquarie Park, NSW, Australia) at 28 °C. X. campestris, F. oxysporum, and R. solani isolates were obtained from the Western Australian culture collection (WAC), Department of Primary Industries and Regional Development (DPIRD) Diagnostics and Laboratory Services, in accordance with Australian biosecurity restrictions on the importation of plant-pathogenic strains. All experiments were conducted in triplicate unless otherwise stated.

4.2. Genome Sequencing and Comparative Genomics

High-molecular-weight genomic DNA was extracted using the Qiagen MagAttract HMW DNA Kit (Qiagen, Clayton, VIC, Australia) from a logarithmic-phase culture, obtained by subculturing a saturated overnight culture and incubating for a further 6 h prior to extraction. ONT libraries were prepared according to the ONT 1D ligation library preparation protocol (SQK-LSK109) and sequenced with a FLO-MIN-106D flow cell (R9.4.1) on a MinION platform, yielding 337,900 reads (1.2 Gb total; mean read length ~3551 bp), corresponding to ~202× coverage of the 5,948,019 bp genome. Guppy v3.2.6 was used for base calling (read-pass-filter quality score cutoff = 7). Long reads were assembled using Flye v2.9 (10 iterations, default parameters), producing a single circular chromosome. BUSCO v5.3.2 assessed assembly completeness (99.9%). The whole-genome sequence was deposited in GenBank under accession CP138214, and raw reads under SRR26637682. ANIb was determined using FastANI [36], dDDH using GGDC formula 2 (https://ggdc.dsmz.de). Phylogenomic analyses used autoMLST [25] and GBDP [26] with E. coli DSM 30083T as outgroup; trees were visualized in iTOL v6 [37].

4.3. Genome-Based Taxonomic Analysis

The autoMLST tool determined the 997 closest genomes to Pseudomonas sp. MUP55. Intergenomic distances were calculated using GBDP at http://ggdc.dsmz.de. Pairwise distances of the 117 putative P. fluorescens SG genomes, together with 81 genomes from outside the species group (198 in total), were transformed into a distance matrix and used to build a neighbor-joining phylogenomic tree using Shiny [38]. Additionally, Whole-genome-based species delimitation was additionally performed using the Type (Strain) Genome Server (TYGS; /tygs.dsmz.de) [39]. Closest type strain genomes were identified in two complementary ways: first, all genomes in the TYGS database were compared against the Pseudomonas sp. MUP55 genome via the MASH algorithm [40], and the ten type strains with the smallest MASH distances were selected; second, 16S rDNA gene sequences were extracted from the Pseudomonas sp. MUP55 genome, using RNAmmer v1.2 [41] and BLASTed v2.16.0 [42], against the 16S rDNA sequences of the 24,577 type strains in the TYGS database, from which the top 50 matches by bitscore were used to calculate precise intergenomic distances via the GBDP approach under the “coverage” algorithm and distance formula d5 [26], yielding a further ten closest type strains. Pairwise genome comparisons among the resulting set were conducted using GBDP under the “trimming” algorithm and distance formula d5 [26], with 100 distance replicates per comparison. Digital DDH values (formulae d0, d4, and d6) and confidence intervals were calculated using the recommended settings of the GGDC 4.0 [26]. ANI was calculated using FastANI [36] for the same comparator set. Species-level clustering used a 70% dDDH radius [26].

4.4. Phenotypic and Chemotaxonomic Characterization

Growth of Pseudomonas sp. MUP55was assessed in LB medium across a temperature range of 4–37 °C, at pH values from 5.0 to 8.0 in increments of 0.5, and at NaCl concentrations from 0 to 4% (w/v) in increments of 0.5%. Carbon source utilization and chemical sensitivity were assessed using Biolog GEN III MicroPlates (Biolog, Hayward, CA, USA), and assimilation and enzymatic activity were assessed using API 20NE strips (bioMérieux, Nürtingen, Germany). Cellular fatty acid, polar lipid, and respiratory quinone composition were determined by the Identification Service, Leibniz-Institut DSMZ (Braunschweig, Germany), using their standard chemotaxonomic identification protocols.

4.5. Bacteriostatic/Bactericidal Differentiation Assay

E. coli was grown in LB to mid-exponential phase (Phase 1, 6 h, 28 °C, 900 rpm) in a Varioskan LUX Multimode Microplate Reader (ThermoFisher, Scoresby, VIC, Australia) and then diluted into fresh medium containing one of four treatments: LB only (control), tetracycline (10 µg/mL, bacteriostatic reference), neomycin (50 µg/mL, bactericidal reference), or sterile Pseudomonas sp. MUP55 supernatant (1:1 v/v with LB; prepared by centrifugation at 10,000× g for 5 min followed by 0.22 µm filter sterilization). OD600 nm was recorded at 10 min intervals for a further 6 h (Phase 2, treatment exposure). Cells were then harvested by centrifugation (10,000× g, 2 min), washed twice with fresh LB to remove residual treatment, and the pellets resuspended and standardized to OD600 nm = 0.2. A 50 μL aliquot of each suspension was spread on LB agar and incubated for 18 h at 28 °C for CFU enumeration. The remaining suspensions were returned to the plate reader in fresh LB and monitored for a further 20 h (Phase 3, post-wash recovery). For visualization of continuous growth dynamics, OD600 nm traces were blank-subtracted, and per-replicate scaling factors were applied at each phase transition to compensate for the dilution and wash steps. The assay was performed in four biological replicates. Statistical comparisons were computed on the area under the raw, unscaled OD600 nm curve; the per-replicate scaling described above was applied for visualization only. Treatments were compared to control by Welch’s t-test with Holm correction for multiple comparisons, and CFU/mL counts were compared to control by the same procedure.

4.6. Successive Swarming and Mutant Generation

Successive swarming was performed as previously described [31]. Briefly, Pseudomonas sp. MUP55 was inoculated at the center of 0.5% LB agar plates. After 24 h, cells from the colony edge were transferred successively to new swarm plates for 5 cycles. After 5 cycles, cells were washed and spread on 1.5% LB agar. Colonies were screened for loss of swarming. For swarming motility assays, cultures grown for 18 h were spotted on 0.5% LB plates and incubated at 28 °C for 24 h. Siderophore production was assessed in 96-well plate format (200 µL culture per well), with relative fluorescence intensity measured at 405 nm using a Varioskan LUX plate reader; uninoculated medium served as a blank control for background fluorescence. The ΔpvfC mutant was constructed by homologous recombination using the suicide vector pJQ200 [43]. Upstream and downstream flanking regions of pvfC were amplified by PCR (upstream forward: 5′-[TCTAGATGGGGCACACGACGCATCTG]-3′; upstream reverse: 5′-[AAGCTTGCTTCCTGCAGCACCCCGAT]-3′; downstream forward: 5′-[ACTAGTGGATGAGTGCCCAGCAGCGT]-3′; downstream reverse: 5′-[GGATCCGAGCGAGGAAGTCCACCGGC]-3′) and cloned into pJQ200 using XbaI/HindIII/SpeI/BamHI. The recombinant plasmid was transferred to Pseudomonas sp. MUP55 by conjugation via E. coli ST18 [44]. Transconjugants were selected on LB + gentamicin (30 µg/mL) and confirmed by PCR.

4.7. Inhibition of Phytopathogens In Vitro

Pseudomonas sp. MUP55 and mutant strains were cultured in LB for 48 h to maximize the concentration of secreted secondary metabolites, consistent with reports that antimicrobial secondary metabolite production in Pseudomonas spp. peaks during the transition from late-exponential to stationary growth phase [45,46] (10,000× g, 5 min) and supernatants filtered–sterilized (0.22 µm). E. coli and X. campestris were inoculated in LB with sterile supernatant (1:1 v/v) and OD600 measured over 24 h. For antifungal assays on PDA, bacteria were streaked 2 cm from center; 1 h later, a 5 mm fungal plug was placed at center. Inhibition was assessed after 6 days (F. oxysporum) and 4 days (R. solani). PIRG (percentage inhibition of radial growth, %) = [1 − (fungal growth near bacteria/fungal growth on opposite side)] × 100%. Cell-free supernatants from 48 h cultures of WT Pseudomonas sp. MUP55, M7, and WT ΔpvfC were prepared via centrifugation (10,000× g, 5 min) and filter sterilization (0.22 µm). E. coli and X. campestris cells in the exponential phase were inoculated in either supernatant: fresh LB at 1:1 v/v or in LB only. OD600 nm was monitored at 10 min intervals for 24 h in a Varioskan LUX Multimode Microplate Reader (ThermoFisher) at 28 °C, with continuous shaking. Two sterile LB blank wells were monitored throughout the run and remained below OD600 nm 0.09, and the mean blank trajectory was subtracted from all wells per timepoint. Total growth per replicate was summarized as the trapezoidal area under the blank-subtracted OD600 nm curve (0–24 h). Within each target, the six pairwise supernatant comparisons (LB vs. WT, LB vs. M7, LB vs. ΔpvfC, WT vs. M7, WT vs. ΔpvfC, and M7 vs. ΔpvfC) were tested by Welch’s two-sample t-test and Holm-corrected to control the family-wise error rate.

4.8. Metabolomic Analysis

Cyclic lipopeptides were extracted from 48 h culture supernatants using ethyl acetate (1:1.1 v/v, 2 h). Reversed-phase LC used a Waters Acquity I-class UPLC system with HSS-T3 column (1.8 µm, 2.1 × 100 mm). Mobile phase: A (99.9% H2O + 0.1% formic acid) and B (99.9% MeCN + 0.1% formic acid); flow rate, 0.25 mL/min; gradient from 100% A to 95% B over 30 min; column temperature, 40 °C. MS was acquired on a Bruker Impact II QToF (ESI positive mode; full scan 80–2000 m/z; Auto MS/MS; capillary 4.5 kV; drying gas 12.0 L/min; drying temperature 250 °C). Classical molecular networking was performed via GNPS (http://gnps.ucsd.edu) with min pairs cosine 0.7, topK 10, and minimum matched fragments 20. BGC identification used antiSMASH [29,47]. Untargeted comparative metabolomic profiling of this cyclic-lipopeptide-enriched extract was performed on three biological replicates per strain using XCMS with centWave peak detection, obiwarp retention time correction and Welch’s t-tests, applying a fold-change threshold of 2 and an exploratory significance threshold of p < 0.1, appropriate to untargeted profiling. Features with maximum ion intensity <5000 were filtered out. Given the exploratory, hypothesis-generating purpose of this screen, correction for multiple testing (e.g., Benjamini–Hochberg FDR) was not applied to the resulting feature list; the 1413 features identified (Section 2.6) represent candidates for downstream targeted follow-up, as was subsequently performed for Massetolide A/D via GNPS molecular networking and antiSMASH BGC annotation, rather than confirmed differentially abundant metabolites.

4.9. RNA Extraction and Transcriptomic Analysis

WT and ΔpvfC strains were grown in parallel in LB at 28 °C, with shaking at 200 rpm, for 24 h to stationary phase, when Pseudomonas secondary metabolite biosynthetic and Gac/Rsm-regulated programs are most active [20]. Cultures were then normalized to OD600 = 1.0 to standardize cell input across samples and harvested for RNA extraction. Total RNA was extracted from frozen lysates using the Qiagen RNeasy kit according to the manufacturer’s protocol. RNA quality was assessed by Agilent RNA TapeStation (all samples RIN > 6.5). DNase treatment and ribosomal RNA depletion were performed prior to cDNA conversion using an adapted Smart-seq assay with SuperScript™ IV Reverse Transcriptase (ThermoFisher). Full-length cDNAs were amplified using KAPA HiFi DNA Polymerase (Roche Biosystems, Roche, Sydney, NSW, Australia). Libraries were prepared using NEBNext® Ultra™ II FS DNA Library Prep Kit (New England Biolabs), and four biological replicates of each strain were sequenced on Illumina NovaSeq 6000 (150 bp PE) (Illumina, Melbourne, VIC, Australia), yielding an average of 32 million PE reads per sample. The two strains showed comparable growth in LB and were harvested at matched optical density and growth phase.
Read processing and quantification were performed with the nf-core RNA-seq pipeline (version 3.7) within Nextflow (version 22.04.0) [48], using the default star_salmon route: adapter and quality trimming with Trim Galore, v2.2.0, alignment to the Pseudomonas sp. MUP55 reference genome (GenBank CP138214) with STAR [49], and transcript-level quantification with Salmon [50]. Gene-level length-scaled counts were generated via tximport. Differential expression analysis was carried out in R v4.4.2 using DESeq2 v1.46.0 (Bioconductor 3.20 [51]), which applies the median-of-ratios method for between-sample normalization and fits a negative binomial generalized linear model to the count data [52]. Significance was assessed using the Wald test, with p-values adjusted for multiple testing by the Benjamini–Hochberg procedure. Genes with an adjusted p-value < 0.05 and |log2 fold change| ≥ 1 were considered differentially expressed.
For the functional category analysis, genes were assigned to one of five high-level functional Superclasses (Metabolism, Energy, RNA processing, Membrane transport, Protein processing) using the BV-BRC functional annotation framework [53]. Genes assigned to multiple Superclasses were included in all relevant categories. Within-category differences in expression between WT and ΔpvfC were tested using paired Wilcoxon signed-rank tests (p < 0.05); where the assumptions of the paired Wilcoxon test could not be met, paired t-tests were used.

4.10. β-Galactosidase Reporter Assays

Promoter regions of rsmY and rsmZ were transcriptionally fused to lacZ in reporter plasmids and introduced into Pseudomonas sp. MUP55 WT and the ΔpvfC mutant, both of which lack endogenous β-galactosidase activity [54]. β-Galactosidase activity was quantified by a one-step assay [55]: overnight cultures were diluted and grown to OD600 = 1.0. A 500 µL volume was lysed by adding 10 µL of 0.1% SDS and 10 µL of chloroform (vortex 15 s). The mixture was incubated at 37 °C after adding 100 µL of 4 mg/mL ONPG (o-nitrophenyl-β-d-galactopyranoside; Sigma-Aldrich, Bayswater, VIC, Australia). OD420 nm was measured. Activity (Miller units) = (1000 × OD420)/T/OD600; T = reaction time (min).

4.11. Statistical Analysis

All experiments were performed with at least three biological replicates unless otherwise stated, and data are presented as mean ± standard deviation (SD). Growth-inhibition and bacteriostatic assays were compared on the area under the OD600 nm curve using Welch’s t-test with Holm correction for multiple comparisons. Transcriptomic functional-category comparisons used paired Wilcoxon signed-rank tests. Differential gene expression was assessed in DESeq2 using the Wald test with Benjamini–Hochberg correction (adjusted p < 0.05, |log2 fold-change| ≥ 1), and comparative metabolomics used Welch’s t-tests with a fold-change threshold of 2 (exploratory p < 0.1) [56]. Unless otherwise indicated, p < 0.05 was considered statistically significant. All analyses were performed in R (version 4.4.2).

5. Conclusions

This study provides a comprehensive polyphasic characterization of Pseudomonas sp. MUP55, isolated from rainwater in Western Australia. Whole-genome-based taxonomic analyses, including dDDH, ANI, and phenotypic and chemotaxonomic profiling, support classification of Pseudomonas sp. MUP55 as a distinct species within the P. fluorescens group. Pseudomonas sp. MUP55 produces Massetolide A/D as a leading candidate antimicrobial compound, contributing to both antibacterial and antifungal biocontrol activity, although the two isomers could not be conclusively distinguished by the available mass spectrometry data, and their individual contributions remain to be confirmed with purified standards. Transcriptomic and metabolomic analyses of a ΔpvfC mutant revealed that the pvf gene cluster contributes to both the regulation of specialized metabolism and to secreted growth-inhibitory activity, including an uncoupling of the small RNAs rsmY and rsmZ within the Gac/Rsm regulatory cascade. Several individual regulatory genes examined in this network did not reach statistical significance after correction for multiple testing, and these findings should be interpreted as hypotheses for future validation rather than established mechanisms. Collectively, these results position Pseudomonas sp. MUP55 as a taxonomically novel and mechanistically well-characterized candidate biocontrol agent, while highlighting specific directions for future work, including genetic complementation of the GacA and pvfC mutants, direct testing of purified Massetolide A/D, and transcript-level validation of the proposed pvf–Gac/Rsm regulatory link.

Supplementary Materials

The following supporting information can be downloaded at: https://www.mdpi.com/article/10.3390/ijms27156749/s1.

Author Contributions

Conceptualization, H.A.; methodology, H.A. and S.S.; validation, H.A., S.S., D.V.M. and C.S.; formal analysis, H.A. and S.S.; investigation, H.A. and S.S.; writing—original draft preparation, H.A.; writing—review and editing, J.B. and C.E.Y.; visualization, H.A.; supervision, D.V.M. and C.S. All authors have read and agreed to the published version of the manuscript.

Funding

This research was funded by Murdoch International Postgraduate Scholarship and top-up scholarship through the CSIRO-Murdoch University-Industry Bioplastics Innovation Hub.

Institutional Review Board Statement

Not applicable.

Informed Consent Statement

Not applicable.

Data Availability Statement

The genome sequence of Pseudomonas sp. MUP55 was deposited in GenBank under accession CP138214, with raw reads under SRA accession SRR26637682. RNA-seq data were deposited in the NCBI Sequence Read Archive under BioProject accession PRJNA1497945 (BioSample accessions SAMN61825623–SAMN61825630); per NCBI guidance, this BioProject accession should be cited in place of individual run accessions for improved searchability in Entrez.

Conflicts of Interest

The authors declare no conflicts of interest.

References

  1. Migula, W. Über ein neues system der bakterien. In Arbeiten aus dem Bakteriologischen Institut der Technischen Hochschule zu Karlsruhe; Bakteriologischen Institut der Technischen Hochschule zu Karlsruhe: Karlsruhe, Germany, 1894. [Google Scholar]
  2. Parte, A.C. LPSN—List of prokaryotic names with standing in nomenclature. Nucleic Acids Res. 2014, 42, D613–D616. [Google Scholar] [PubMed]
  3. Palleroni, N.J.  Pseudomonas. In Bergey’s Manual of Systematics of Archaea and Bacteria; John Wiley & Sons: Hoboken, NJ, USA, 2015; p. 1. [Google Scholar]
  4. Alattas, H.; Ardley, J.; Swift, R.; Kant, P.; Jackson, S.; Biddulph, B.; Bekuma, A.; Zandberg, J.; Abraham, S.; Tiwari, R.; et al. Complete Genome Sequence of the Ice-Nucleation-Active Pseudomonas syringae pv. pisi Isolate MUP32, Isolated from Frost-Damaged Pea (Pisum sativum subsp. arvense cv. Dundale) in New South Wales. Microbiol. Resour. Announc. 2023, 12, e01276-22. [Google Scholar] [CrossRef] [PubMed]
  5. Alattas, H.; Ardley, J.; O’Dea, M.; Swift, R.; Jackson, S.; Biddulph, B.; Bekuma, A.; Zandberg, J.; Abraham, S.; Tiwari, R.; et al. Complete Genome Sequence of the Ice-Nucleation-Active Pseudomonas syringae Strain MUP17, Isolated from the Frost-Damaged Barley Cultivar Hordeum vulgare cv. La Trobe. Microbiol. Resour. Announc. 2023, 12, e01215-22. [Google Scholar] [CrossRef] [PubMed]
  6. Alattas, H.; Ardley, J.; Swift, R.; Jackson, S.; Biddulph, B.; Bekuma, A.; Zandberg, J.; Abraham, S.; Tiwari, R.; Reeve, W. Complete Genome Sequence of the Ice-Nucleation-Active Pseudomonas syringae Strain MUP20, Isolated from Frost-Damaged Wheat (Triticum aestivum cv. Scepter) in Western Australia. Microbiol. Resour. Announc. 2023, 12, e01275-22. [Google Scholar] [CrossRef] [PubMed]
  7. Peix, A.; Ramírez-Bahena, M.-H.; Velázquez, E. Historical evolution and current status of the taxonomy of genus Pseudomonas. Infect. Genet. Evol. 2009, 9, 1132–1147. [Google Scholar] [CrossRef] [PubMed]
  8. Drenkard, E.; Ausubel, F.M. Pseudomonas biofilm formation and antibiotic resistance are linked to phenotypic variation. Nature 2002, 416, 740–743. [Google Scholar] [CrossRef] [PubMed]
  9. Khalifa, A.B.H.; Moissenet, D.; Thien, H.V.; Khedher, M. Virulence factors in Pseudomonas aeruginosa: Mechanisms and modes of regulation. Ann. Biol. Clin. 2011, 69, 393–403. [Google Scholar] [CrossRef]
  10. Stover, C.; Pham, X.; Erwin, A.; Mizoguchi, S.; Warrener, P.; Hickey, M.; Brinkman, F.S.L.; Hufnagle, W.O.; Kowalik, D.J.; Lagrou, M.; et al. Complete genome sequence of Pseudomonas aeruginosa PAO1, an opportunistic pathogen. Nature 2000, 406, 959–964. [Google Scholar] [CrossRef] [PubMed]
  11. Mulet, M.; Lalucat, J.; García-Valdés, E. DNA sequence-based analysis of the Pseudomonas species. Environ. Microbiol. 2010, 12, 1513–1530. [Google Scholar] [CrossRef] [PubMed]
  12. Alattas, H.; Glick, B.R.; Murphy, D.V.; Scott, C. Harnessing Pseudomonas spp. for sustainable plant crop protection. Front. Microbiol. 2024, 15, 1485197. [Google Scholar] [CrossRef] [PubMed]
  13. Lamers, J.; Schippers, B.; Geels, F. Soil-borne diseases of wheat in the Netherlands and results of seed bacterization with pseudomonads against Gaeumannomyces graminis var. tritici, associated with disease resistance. Cereal breeding related to integrated cereal production. In Proceedings of the Conference of the Cereal Section of EUCARPIA (European Association for Research on Plant Breeding), Wageningen, The Netherlands, 24–26 February 1988; pp. 134–139. [Google Scholar]
  14. Pieterse, C.M.J.; Berendsen, R.L.; de Jonge, R.; Stringlis, I.A.; Van Dijken, A.J.H.; Van Pelt, J.A.; Van Wees, S.C.; Yu, K.; Zamioudis, C.; Bakker, P.A. Pseudomonas simiae WCS417: Star track of a model beneficial rhizobacterium. Plant Soil 2021, 461, 245–263. [Google Scholar]
  15. Park, Y.-S.; Dutta, S.; Ann, M.; Raaijmakers, J.M.; Park, K. Promotion of plant growth by Pseudomonas fluorescens strain SS101 via novel volatile organic compounds. Biochem. Biophys. Res. Commun. 2015, 461, 361–365. [Google Scholar] [CrossRef] [PubMed]
  16. Fang, Y.; Wu, L.; Chen, G.; Feng, G. Complete genome sequence of Pseudomonas azotoformans S4, a potential biocontrol bacterium. J. Biotechnol. 2016, 227, 25–26. [Google Scholar] [CrossRef] [PubMed]
  17. Tran, H.; Ficke, A.; Asiimwe, T.; Höfte, M.; Raaijmakers, J.M. Role of the cyclic lipopeptide massetolide A in biological control of Phytophthora infestans and in colonization of tomato plants by Pseudomonas fluorescens. New Phytol. 2007, 175, 731–742. [Google Scholar] [CrossRef] [PubMed]
  18. Song, C.; Aundy, K.; van de Mortel, J.; Raaijmakers, J.M. Discovery of new regulatory genes of lipopeptide biosynthesis in Pseudomonas fluorescens. FEMS Microbiol. Lett. 2014, 356, 166–175. [Google Scholar] [CrossRef] [PubMed][Green Version]
  19. De Bruijn, I.; de Kock, M.J.; de Waard, P.; van Beek, T.A.; Raaijmakers, J.M. Massetolide A biosynthesis in Pseudomonas fluorescens. J. Bacteriol. 2008, 190, 2777–2789. [Google Scholar] [CrossRef] [PubMed]
  20. Zhou, L.; Höfte, M.; Hennessy, R.C. Does regulation hold the key to optimizing lipopeptide production in Pseudomonas for biotechnology? Front. Bioeng. Biotechnol. 2024, 12, 1363183. [Google Scholar] [CrossRef] [PubMed]
  21. Acken, K.A.; Li, B. Pseudomonas virulence factor controls expression of virulence genes in Pseudomonas entomophila. PLoS ONE 2023, 18, e0284907. [Google Scholar] [CrossRef] [PubMed]
  22. Vallet-Gely, I.; Opota, O.; Boniface, A.; Novikov, A.; Lemaitre, B. A secondary metabolite acting as a signalling molecule controls Pseudomonas entomophila virulence. Cell. Microbiol. 2010, 12, 1666–1679. [Google Scholar] [CrossRef] [PubMed]
  23. Jenul, C.; Sieber, S.; Daeppen, C.; Mathew, A.; Lardi, M.; Pessi, G.; Hoepfner, D.; Neuburger, M.; Linden, A.; Gademann, K.; et al. Biosynthesis of fragin is controlled by a novel quorum sensing signal. Nat. Commun. 2018, 9, 1297. [Google Scholar] [CrossRef] [PubMed]
  24. Sieber, S.; Mathew, A.; Jenul, C.; Kohler, T.; Bär, M.; Carrión, V.J.; Cazorla, F.M.; Stalder, U.; Hsieh, Y.-C.; Bigler, L. Mitigation of Pseudomonas syringae virulence by signal inactivation. Sci. Adv. 2021, 7, eabg2293. [Google Scholar] [CrossRef] [PubMed]
  25. Alanjary, M.; Steinke, K.; Ziemert, N. AutoMLST: An automated web server for generating multi-locus species trees highlighting natural product potential. Nucleic Acids Res. 2019, 47, W276–W282. [Google Scholar] [CrossRef] [PubMed]
  26. Meier-Kolthoff, J.P.; Auch, A.F.; Klenk, H.-P.; Göker, M. Genome sequence-based species delimitation with confidence intervals and improved distance functions. BMC Bioinform. 2013, 14, 60. [Google Scholar] [CrossRef]
  27. Garrido-Sanz, D.; Meier-Kolthoff, J.P.; Göker, M.; Martín, M.; Rivilla, R.; Redondo-Nieto, M. Genomic and Genetic Diversity within the Pseudomonas fluorescens Complex. PLoS ONE 2016, 11, e0150183, Correction in PLoS ONE 2016, 11, e0153733. [Google Scholar] [CrossRef] [PubMed]
  28. Gerard, J.; Lloyd, R.; Barsby, T.; Haden, P.; Kelly, M.T.; Andersen, R.J. Massetolides A−H, Antimycobacterial Cyclic Depsipeptides Produced by Two Pseudomonads Isolated from Marine Habitats. J. Nat. Prod. 1997, 60, 223–229. [Google Scholar] [CrossRef] [PubMed]
  29. Blin, K.; Shaw, S.; Augustijn, H.E.; Reitz, Z.L.; Biermann, F.; Alanjary, M.; Fetter, A.; Terlouw, B.R.; Metcalf, W.W.; Helfrich, E.J.N.; et al. antiSMASH 7.0: New and improved predictions for detection, regulation, chemical structures and visualisation. Nucleic Acids Res. 2023, 51, W46–W50. [Google Scholar] [CrossRef] [PubMed]
  30. Mitra, S. Metagenomic Data Analysis; Springer: Berlin/Heidelberg, Germany, 2023. [Google Scholar]
  31. Song, C.; Kidarsa, T.A.; van de Mortel, J.E.; Loper, J.E.; Raaijmakers, J.M. Living on the edge: Emergence of spontaneous gac mutations in Pseudomonas protegens during swarming motility. Environ. Microbiol. 2016, 18, 3453–3465. [Google Scholar] [CrossRef] [PubMed]
  32. Grossman, T.H. Tetracycline antibiotics and resistance. Cold Spring Harb. Perspect. Med. 2016, 6, a025387. [Google Scholar] [CrossRef] [PubMed]
  33. Maggs, D.J. Chapter 3—Ocular Pharmacology and Therapeutics. In Slatter’s Fundamentals of Veterinary Ophthalmology, 4th ed.; Maggs, D.J., Miller, P.E., Ofri, R., Eds.; W.B. Saunders: Saint Louis, MO, USA, 2008; pp. 33–61. [Google Scholar]
  34. Oweda, M.; Tanyous, J.N.; Hamed, M.; El-Hadidi, M. (Eds.) Potential probiotics for viral triggered type 2 diabetes. In 2021 3rd Novel Intelligent and Leading Emerging Sciences Conference (NILES); IEEE: New York, NY, USA, 2021. [Google Scholar]
  35. Grosse, C.; Brandt, N.; Van Antwerpen, P.; Wintjens, R.; Matthijs, S. Two new siderophores produced by Pseudomonas sp. NCIMB 10586: The anti-oomycete non-ribosomal peptide synthetase-dependent mupirochelin and the NRPS-independent triabactin. Front. Microbiol. 2023, 14, 1143861. [Google Scholar] [CrossRef] [PubMed]
  36. Jain, C.; Rodriguez-R, L.M.; Phillippy, A.M.; Konstantinidis, K.T.; Aluru, S. High throughput ANI analysis of 90K prokaryotic genomes reveals clear species boundaries. Nat. Commun. 2018, 9, 5114. [Google Scholar] [CrossRef] [PubMed]
  37. Letunic, I.; Bork, P. Interactive Tree of Life (iTOL) v6: Recent updates to the phylogenetic tree display and annotation tool. Nucleic Acids Res. 2024, 52, W78–W82. [Google Scholar] [CrossRef] [PubMed]
  38. Chang, W.; Cheng, J.; Allaire, J.; Sievert, C.; Schloerke, B.; Aden-Buie, G.; Xie, Y.; Allen, J.; McPherson, J.; Dipert, A.; et al. Shiny: Web Application Framework for R. 2021; R Package Version 4.4.2; RStudio: San Francisco, CA, USA, 2022; Volume 1. [Google Scholar]
  39. Meier-Kolthoff, J.P.; Göker, M. TYGS is an automated high-throughput platform for state-of-the-art genome-based taxonomy. Nat. Commun. 2019, 10, 2182. [Google Scholar] [CrossRef] [PubMed]
  40. Ondov, B.D.; Treangen, T.J.; Melsted, P.; Mallonee, A.B.; Bergman, N.H.; Koren, S.; Phillippy, A.M. Mash: Fast genome and metagenome distance estimation using MinHash. Genome Biol. 2016, 17, 132. [Google Scholar] [CrossRef] [PubMed]
  41. Lagesen, K.; Hallin, P.; Rødland, E.A.; Stærfeldt, H.-H.; Rognes, T.; Ussery, D.W. RNAmmer: Consistent and rapid annotation of ribosomal RNA genes. Nucleic Acids Res. 2007, 35, 3100–3108. [Google Scholar] [CrossRef] [PubMed]
  42. Camacho, C.; Coulouris, G.; Avagyan, V.; Ma, N.; Papadopoulos, J.; Bealer, K.; Madden, T.L. BLAST+: Architecture and applications. BMC Bioinform. 2009, 10, 421. [Google Scholar] [CrossRef]
  43. Quandt, J.; Hynes, M.F. Versatile suicide vectors which allow direct selection for gene replacement in Gram-negative bacteria. Gene 1993, 127, 15–21. [Google Scholar] [CrossRef] [PubMed]
  44. Thoma, S.; Schobert, M. An improved Escherichia coli donor strain for diparental mating. FEMS Microbiol. Lett. 2009, 294, 127–132. [Google Scholar] [PubMed]
  45. Schnider-Keel, U.; Seematter, A.; Maurhofer, M.; Blumer, C.; Duffy, B.; Gigot-Bonnefoy, C.; Reimmann, C.; Notz, R.; DéfAgo, G.; Haas, D.; et al. Autoinduction of 2, 4-diacetylphloroglucinol biosynthesis in the biocontrol agent Pseudomonas fluorescens CHA0 and repression by the bacterial metabolites salicylate and pyoluteorin. J. Bacteriol. 2000, 182, 1215–1225. [Google Scholar] [CrossRef] [PubMed]
  46. Wu, X.; Liu, J.; Zhang, W.; Zhang, L. Multiple-level regulation of 2, 4-diacetylphloroglucinol production by the sigma regulator PsrA in Pseudomonas fluorescens 2P24. PLoS ONE 2012, 7, e50149. [Google Scholar] [CrossRef] [PubMed]
  47. Boctor, J. Plastivore: Identification and Functional Characterization of Plastic Degrading Lipase and Carboxylesterase Enzyme Families from Galleria mellonella. Master’s Thesis, The American University in Cairo, Cairo, Egypt, 2023. [Google Scholar]
  48. Ewels, P.A.; Peltzer, A.; Fillinger, S.; Patel, H.; Alneberg, J.; Wilm, A.; Garcia, M.U.; Di Tommaso, P.; Nahnsen, S. The nf-core framework for community-curated bioinformatics pipelines. Nat. Biotechnol. 2020, 38, 276–278. [Google Scholar] [CrossRef] [PubMed]
  49. Dobin, A.; Davis, C.A.; Schlesinger, F.; Drenkow, J.; Zaleski, C.; Jha, S.; Batut, P.; Chaisson, M.; Gingeras, T.R. STAR: Ultrafast universal RNA-seq aligner. Bioinformatics 2013, 29, 15–21. [Google Scholar] [PubMed]
  50. Patro, R.; Duggal, G.; Love, M.I.; Irizarry, R.A.; Kingsford, C. Salmon provides fast and bias-aware quantification of transcript expression. Nat. Methods 2017, 14, 417–419. [Google Scholar] [CrossRef] [PubMed]
  51. Huber, W.; Carey, V.J.; Gentleman, R.; Anders, S.; Carlson, M.; Carvalho, B.S.; Bravo, H.C.; Davis, S.; Gatto, L.; Girke, T.; et al. Orchestrating high-throughput genomic analysis with Bioconductor. Nat. Methods 2015, 12, 115–121. [Google Scholar] [CrossRef] [PubMed]
  52. Boctor, J.; Oweda, M.; El-Hadidi, M. Comprehensive Guideline for Microbiome Analysis Using R. In Metagenomic Data Analysis; Mitra, S., Ed.; Springer: New York, NY, USA, 2023; pp. 393–436. [Google Scholar]
  53. Olson, R.D.; Assaf, R.; Brettin, T.; Conrad, N.; Cucinell, C.; Davis, J.J.; Dempsey, D.M.; Dickerman, A.; Dietrich, E.M.; Kenyon, R.W.; et al. Introducing the Bacterial and Viral Bioinformatics Resource Center (BV-BRC): A resource combining PATRIC, IRD and ViPR. Nucleic Acids Res. 2023, 51, D678–D689. [Google Scholar] [PubMed]
  54. Li, H.; Xia, Y.; Tian, Z.; Jin, Y.; Bai, F.; Cheng, Z.; Swietnicki, W.; Wu, W.; Pan, X. Dihydrolipoamide Acetyltransferase AceF Influences the Type III Secretion System and Resistance to Oxidative Stresses through RsmY/Z in Pseudomonas aeruginosa. Microorganisms 2022, 10, 666. [Google Scholar] [CrossRef] [PubMed]
  55. Schaefer, J.; Jovanovic, G.; Kotta-Loizou, I.; Buck, M. Single-step method for β-galactosidase assays in Escherichia coli using a 96-well microplate reader. Anal. Biochem. 2016, 503, 56–57. [Google Scholar] [CrossRef] [PubMed]
  56. Ebaid, M.; Boctor, J.N.; Husien, S.; Abdelaal, R.; Gazar, S.E.; Badr, N.H.; Farag, M.A. Advanced formulations and gut microbiota modulation shape the prebiotic and metabolic health effects of allium phytochemicals. Discov. Food 2026, 6, 165. [Google Scholar] [CrossRef]
Figure 1. Phylogenetic tree of Pseudomonas fluorescens species clusters and related Pseudomonas groups. The circular tree represents 117 P. fluorescens SG (species group) genomes, along with other P. fluorescens and Pseudomonas groups. Branch colors indicate species classification: P. fluorescens SG (dark blue), other P. fluorescens groups (light blue), and other Pseudomonas groups (black). Colored dots at branch tips denote isolation sources: fresh water (blue), soil (brown), plants (green), animals (red), other (black), and unknown (white). The superscript T indicates type strains. The tree demonstrates the genetic diversity within P. fluorescens and its adaptation to various environmental niches. The scale bar represents genetic distance.
Ijms 27 06749 g001
Figure 2. Massetolide production in Pseudomonas sp. MUP55. (A) LC-MS results from the supernatant compared to a Massetolide A reference, using GNPS. Mirror plot comparing the experimental spectrum (top) with the matched reference library spectrum (bottom, inverted); shared fragment ion m/z peaks indicate the spectral similarity used to assign compound identity. (B) The molecular network of identified Massetolides; nodes 1 and 2 both match library spectra for Massetolide A/D (isomers not distinguished by available MS/MS data), and node 3 represents Massetolide F. The blurred node is for an unidentified compound. (C) Chemical structures of Massetolide A and D, illustrating the Ile/Leu substitution that distinguishes the two isomers (not resolved in this analysis). (D) Table showing the mass-to-charge ratio ([M + H]+) and amino acid sequence of Massetolide A (or D) and Massetolide F. (E) The biosynthetic gene cluster and structural analysis of Massetolides in Pseudomonas sp. MUP55. Genomic organization of the Massetolide biosynthetic gene cluster in Pseudomonas sp. MUP55. The cluster includes core biosynthetic genes (massA, massB, and massC), additional biosynthetic genes, transport-related genes, regulatory genes, and other genes.
Ijms 27 06749 g002
Figure 3. Comparative analysis of wild-type Pseudomonas sp. MUP55 and the mutant M7 strain. (A) Phenotypic characterization of wild-type (WT) and M7 mutant strains. Swarming motility assay on 0.5% LB agar plates after 24 h. Siderophore production visualized under UV light. Inhibition of F. oxysporum growth after 6 days. Inhibition of R. solani growth after 4 days. The M7 mutant shows reduced swarming motility, decreased siderophore production, and diminished antifungal activity compared to the WT strain. The differences between WT and M7 were significant for both pathogens (Welch’s t-test, p < 0.0001. (B) Growth of X. campestris in the presence of cell-free supernatants from the WT strain, the M7 mutant, or LB-only control (n = 4 biological replicates per condition); OD600 nm was monitored over 24 h. Lines show the mean and shaded ribbons the SD. Total growth per replicate was summarized as the area under the curve (AUC) and compared by Welch’s t-test with Holm correction for the three pairwise comparisons within each pathogen (*** p < 0.001). Per-panel significance annotations show WT vs. control, M7 vs. control, and WT vs. M7.
Ijms 27 06749 g003
Figure 4. Pseudomonas sp. MUP55 supernatant is bacteriostatic against E. coli. (A) Continuous OD600 nm trajectory across initial growth (Phase 1), treatment exposure (Phase 2), and post-wash recovery (Phase 3) for E. coli in LB only (control), tetracycline (10 µg/mL, bacteriostatic reference), neomycin (50 µg/mL, bactericidal reference), or sterile Pseudomonas sp. MUP55 supernatant. Curves show mean ± SD (n = 4 replicates); traces were normalized across phases for the dilution and wash steps to produce a continuous trajectory. Dashed vertical lines mark phase transitions; per-phase comparisons (Tc, Nm, and MUP55 vs. control) by Welch’s t-test on AUC with Holm correction are shown above each phase (*** p < 0.001, ** p < 0.01, * p < 0.05, and ns = not significant). (B) CFU/mL recovered on LB agar after the wash step (n = 4); mean is shown as the horizontal crossbar with SD whiskers, with individual replicates overlaid. Welch’s t-test vs. control with Holm correction: ** p < 0.01, and ns = not significant. Tetracycline and MUP55 supernatant produce CFU count indistinguishable from control, while neomycin reduces viability by ~3 log10, distinguishing the bacteriostatic mode of action of Pseudomonas sp. MUP55 supernatant from the bactericidal control.
Ijms 27 06749 g004
Figure 5. Cell-free supernatants of WT, M7, and ΔpvfC differentially inhibit the growth of E. coli and X. campestris. Cell-free supernatants of WT MUP55, the gacA-P58L mutant M7, and WT ΔpvfC were diluted 1:1 v/v into fresh LB, inoculated with E. coli or X. campestris, and growth was monitored at OD600 nm every 10 min over 24 h in a plate reader at 28 °C with continuous shaking. (A) Mean OD600 nm trajectories; shaded ribbons show ±SD. (B) Total growth per replicate, summarized as the trapezoidal AUC of the OD600 nm curve over 0–24 h; bars show mean ± SD with individual replicate values overlaid. The six pairwise supernatant comparisons within each target were tested by Welch’s t-test with Holm correction for multiple comparisons (** p_adj < 0.01, * p_adj < 0.05, and ns = not significant).
Ijms 27 06749 g005
Figure 6. Metabolomic and transcriptomic analysis comparing WT and ΔpvfC strains. (A) Comparative cell-free metabolites WT and ΔpvfC strains. Scatter plot of the log2 fold change (ΔpvfC/WT) (y-axis) between the mean intensity of the metabolites and the m/z (x-axis). Each feature is defined as an ion with a unique m/z and retention time; often, a compound will be represented by multiple features. (B) Differential gene expression analysis comparing WT and ΔpvfC strains. The scatter plot displays log2 fold change (ΔpvfC/WT) (y-axis) for each gene (x-axis, ordered by gene ID from SC318_RS00001 to SC318_RS27160). Each point represents an individual gene, with positive values indicating higher expression in the ΔpvfC mutant relative to WT strain, and negative values indicating lower expression. The dashed horizontal line at y = 0 represents no change in expression between conditions. (C) Different expression between WT and ΔpvfC strains across five functional categories. Metabolism, energy, RNA processing, membrane transport, and protein processing, *** p < 0.001, ** p < 0.01.
Ijms 27 06749 g006
Figure 7. Relative fluorescence intensity (RFU) comparison between the WT and ΔpvfC strains, and the expression of rsmY and rsmZ promoters in a β-galactosidase assay. (A) The RFU between the WT and ΔpvfC strains. (B) Fluorescence intensity comparison between the WT and ΔpvfC colonies after 48 h of growth in LB agar plate. (C) The expression of rsmY and rsmZ promoters in a β-galactosidase assay. The white and the gray bars represent the WT and ΔpvfC, respectively. ** p < 0.05 by ANOVA.
Ijms 27 06749 g007
Table 1. Differential gene expression between WT and ΔpvfC strains for the siderophore pathways. Log2fold changes are expressed as ΔpvfC/WT.
The NRPS-Independent Siderophore Pathway
Locus TagGeneFunctionlog2Fold(ΔpvfC/WT)padj
SC318_RS18895trbAIucA/IucC family protein10.970751.28 × 10−11
SC318_RS18905trbCTonB-dependent receptor11.154050.053
The NRPS-Dependent Siderophore Pathway
SC318_RS10910-Non-ribosomal peptide synthase/polyketide synthase−8.123848.21× 10−5
SC318_RS10920fpvATonB-dependent siderophore receptor−6.63132.42 × 10−4
SC318_RS10945-Pyoverdine-tailoring dipeptidase-like protein PvdM−5.22578NA
SC318_RS10950-PvdJ/PvdD/PvdP-like protein1.6818543.35 × 10−3
SC318_RS10955-Fic family protein−8.721943.23 × 10−6
Borderline—just above the padj < 0.05 threshold; interpret with appropriate caution. Excluded by DESeq2 independent filtering (low mean count); padj not calculated.
Table 2. Differential gene expression between WT and ΔpvfC strains for genes involved in Massetolide biosynthesis and regulation.
Locus TagGeneFunctionlog2Fold(ΔpvfC/WT)padj
SC318_RS15655gacSSignal transduction histidine-protein kinase1.380.456
SC318_RS09875gacAGacA response regulator0.650.914
SC318_RS16815luxR1Transcriptional regulator1.680.614
SC318_RS15380luxR2Transcriptional regulator8.970.120
SC318_RS16810massANon-ribosomal peptide synthetase6.06NA
SC318_RS15400massBNon-ribosomal peptide synthetase−2.380.042 *
SC318_RS15395massCNon-ribosomal peptide synthetase2.72NA
SC318_RS16820pleCEfflux transporter outer membrane subunit−1.690.264
SC318_RS16275prtRTransmembrane regulatory gene (anti-sigma factor)−10.690.064
* Significant at padj < 0.05. Excluded by DESeq2 independent filtering (low mean count); padj not calculated.
Disclaimer/Publisher’s Note: The statements, opinions and data contained in all publications are solely those of the individual author(s) and contributor(s) and not of MDPI and/or the editor(s). MDPI and/or the editor(s) disclaim responsibility for any injury to people or property resulting from any ideas, methods, instructions or products referred to in the content.