1. Introduction
Butyrophilins (BTNs) constitute a group of transmembrane proteins that belong to the immunoglobulin superfamily and are structurally homologous with immune-regulatory B7 family proteins. BTNs participate in modulating immune responses via costimulatory or inhibitory signals and have been linked to autoimmune inflammatory diseases and lipid metabolism [
1,
2,
3,
4,
5]. The human genome harbors 13 BTN/BTN-like (BTNL) genes [
6], among which BTNL9 has attracted attention, owing to its distinctive structural and functional features. BTNL9 has been demonstrated to function as a negative regulator of T cell activation in Jurkat T cells and murine models [
7,
8]. The IgV1 domain of BTNL9 has the capacity to interact with and bind to CD8 T cells, B cells, and NK cells, thereby suppressing immune responses [
9]. Most BTN/BTN-like genes possess distinct IgV, IgC, and SPRY/B30.2 domains. While BTNL9 presents with one IgV domain, it lacks a clear IgC domain, unlike the highly structurally similar BTNL3 and BTNL8. Moreover, the absence of two critical cysteine residues at positions 173 and 227, which are crucial for the stabilization of the IgC domain through disulfide bonding, indicates that BTNL9 might not have a typical immunoglobulin structure [
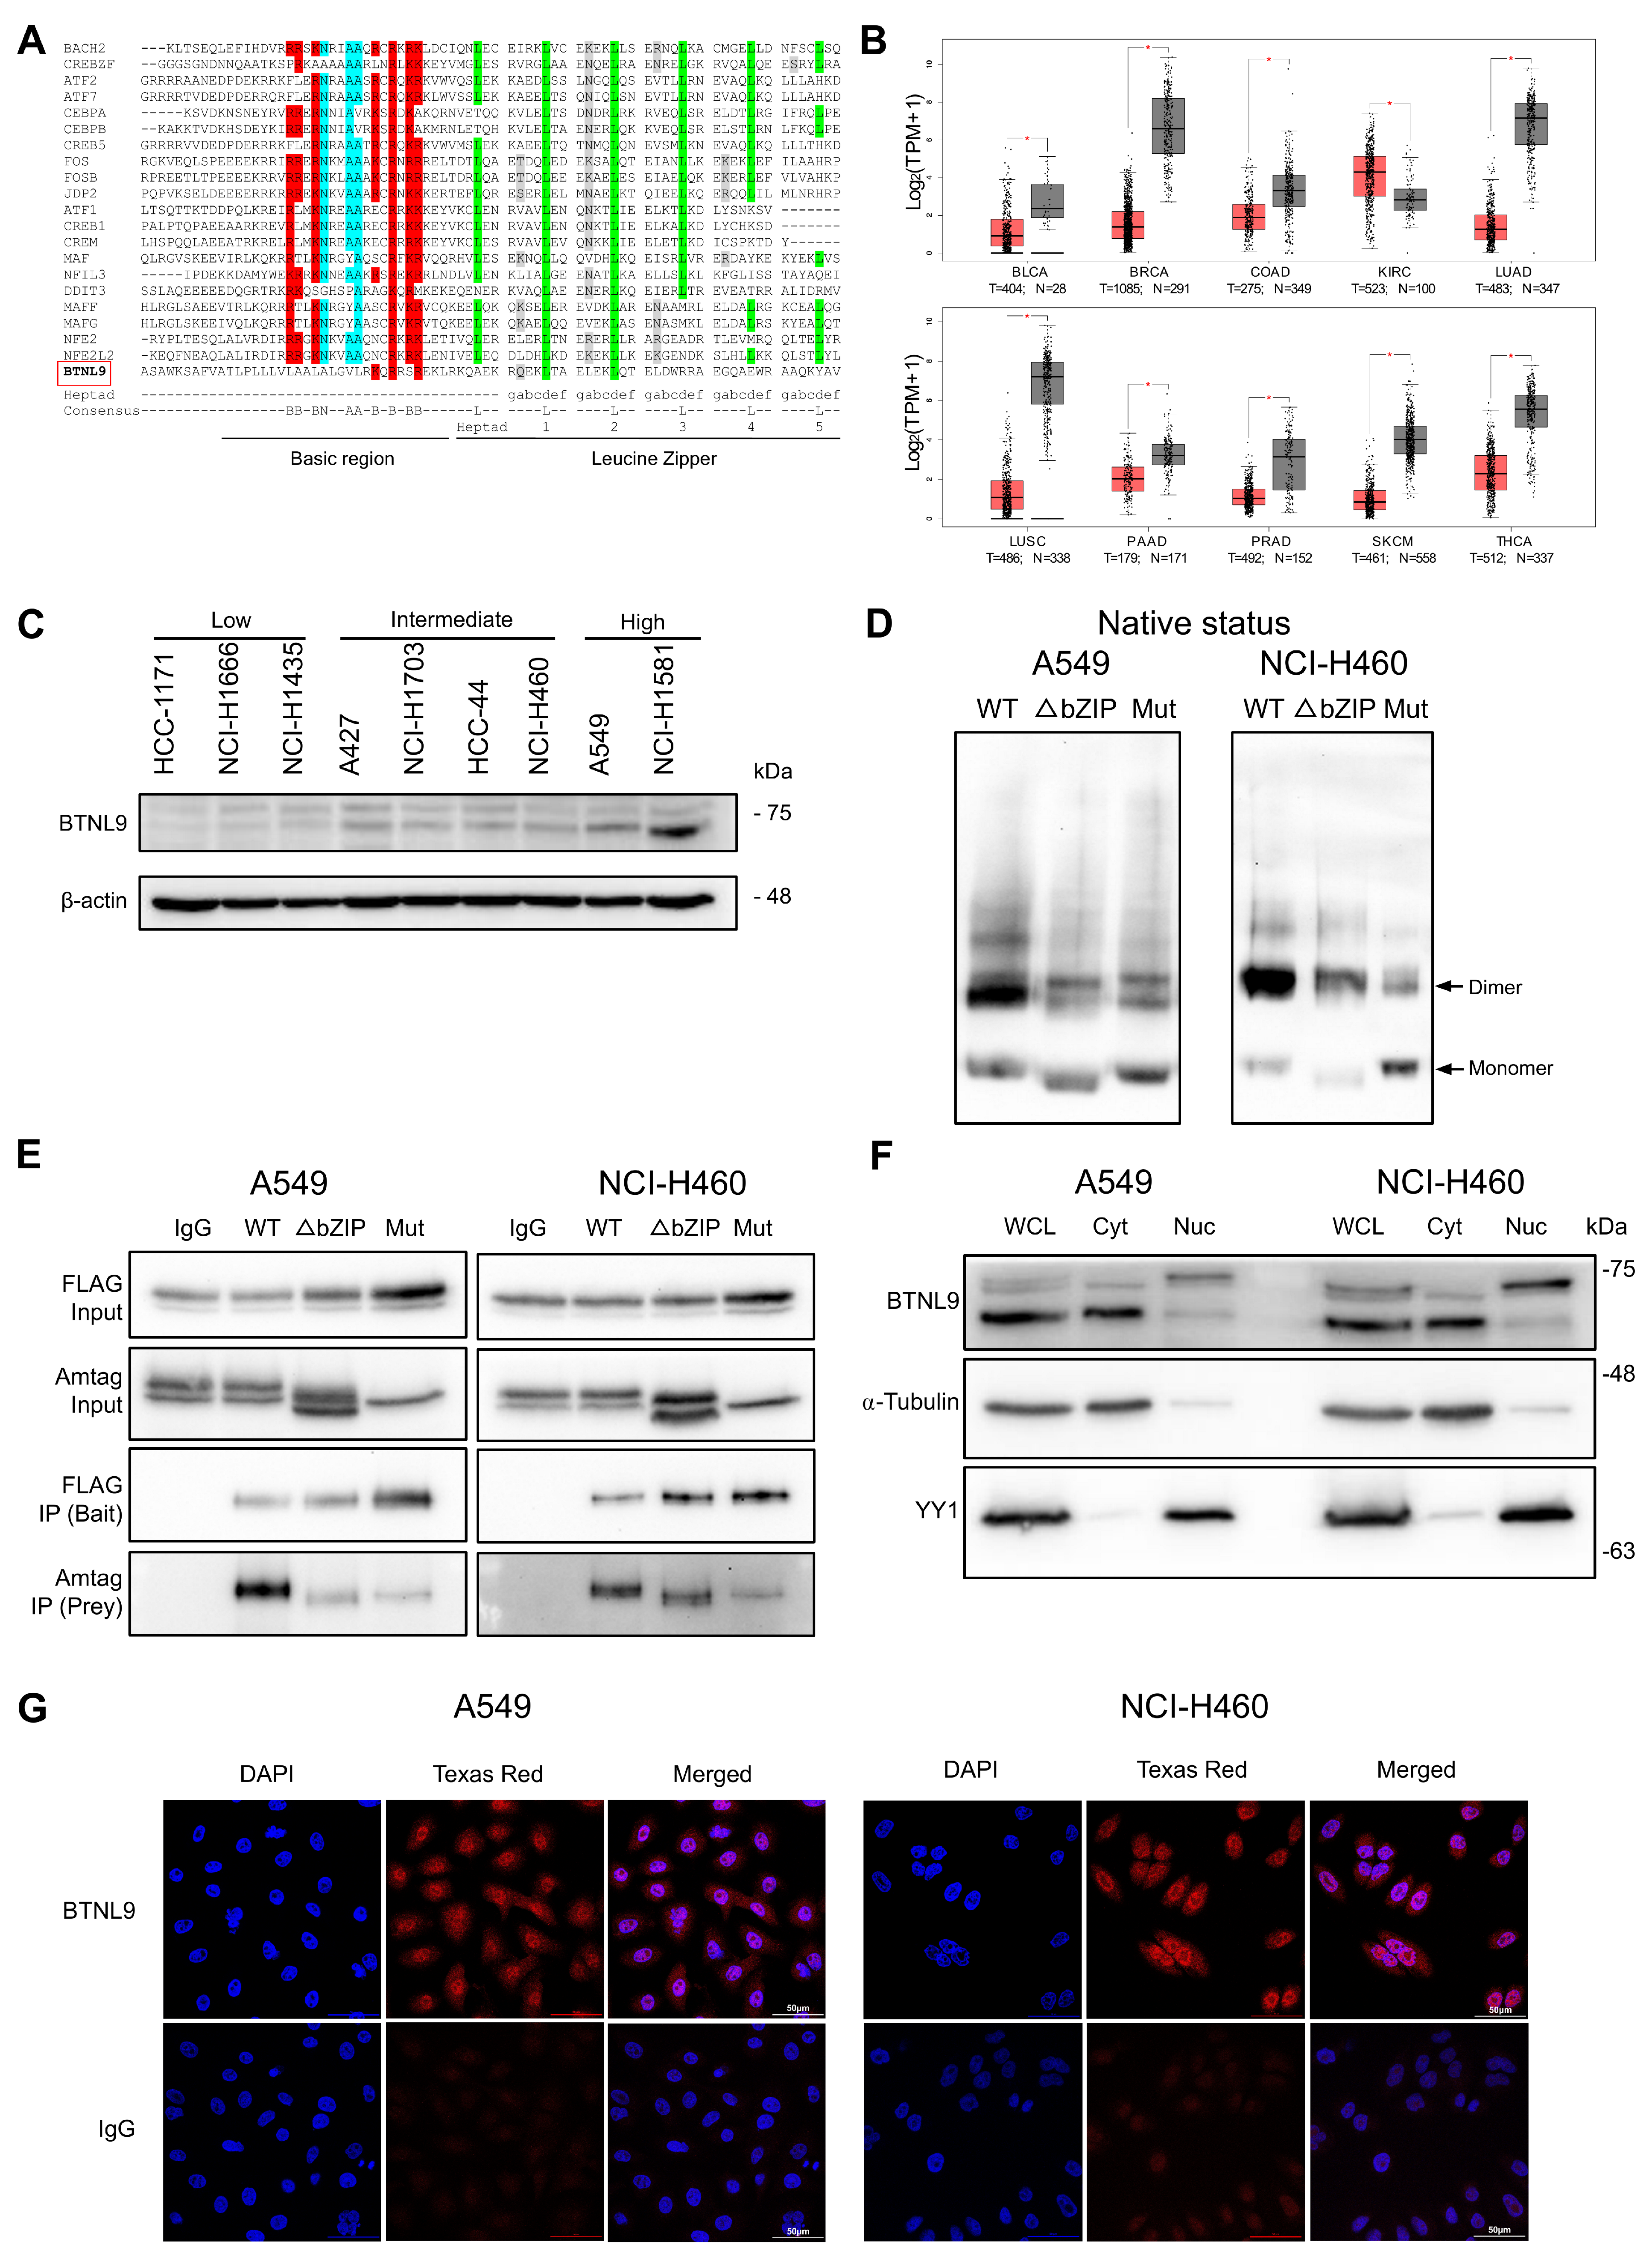
6]. Another unique feature of the protein sequence of BTNL9 is that it exhibits a basic leucine zipper domain (bZIP domain), a common feature among transcription factors, but has just a single leucine heptad repeat that encompasses a coiled-coil region (current data in this study). In addition to these unique structural features of BTNL9, recent in vitro studies have revealed that it has inhibitory effects on cell proliferation, invasion, and migration in melanoma and breast cancer cell lines [
10,
11]. Further, transcriptomics data mining has suggested a link between higher BTNL9 expression and good prognosis of lung, breast, bone, colon, colorectal, pancreatic and thyroid cancer, as well as indicating its potential role in tumor suppression [
12,
13,
14,
15,
16,
17,
18,
19,
20,
21,
22,
23].
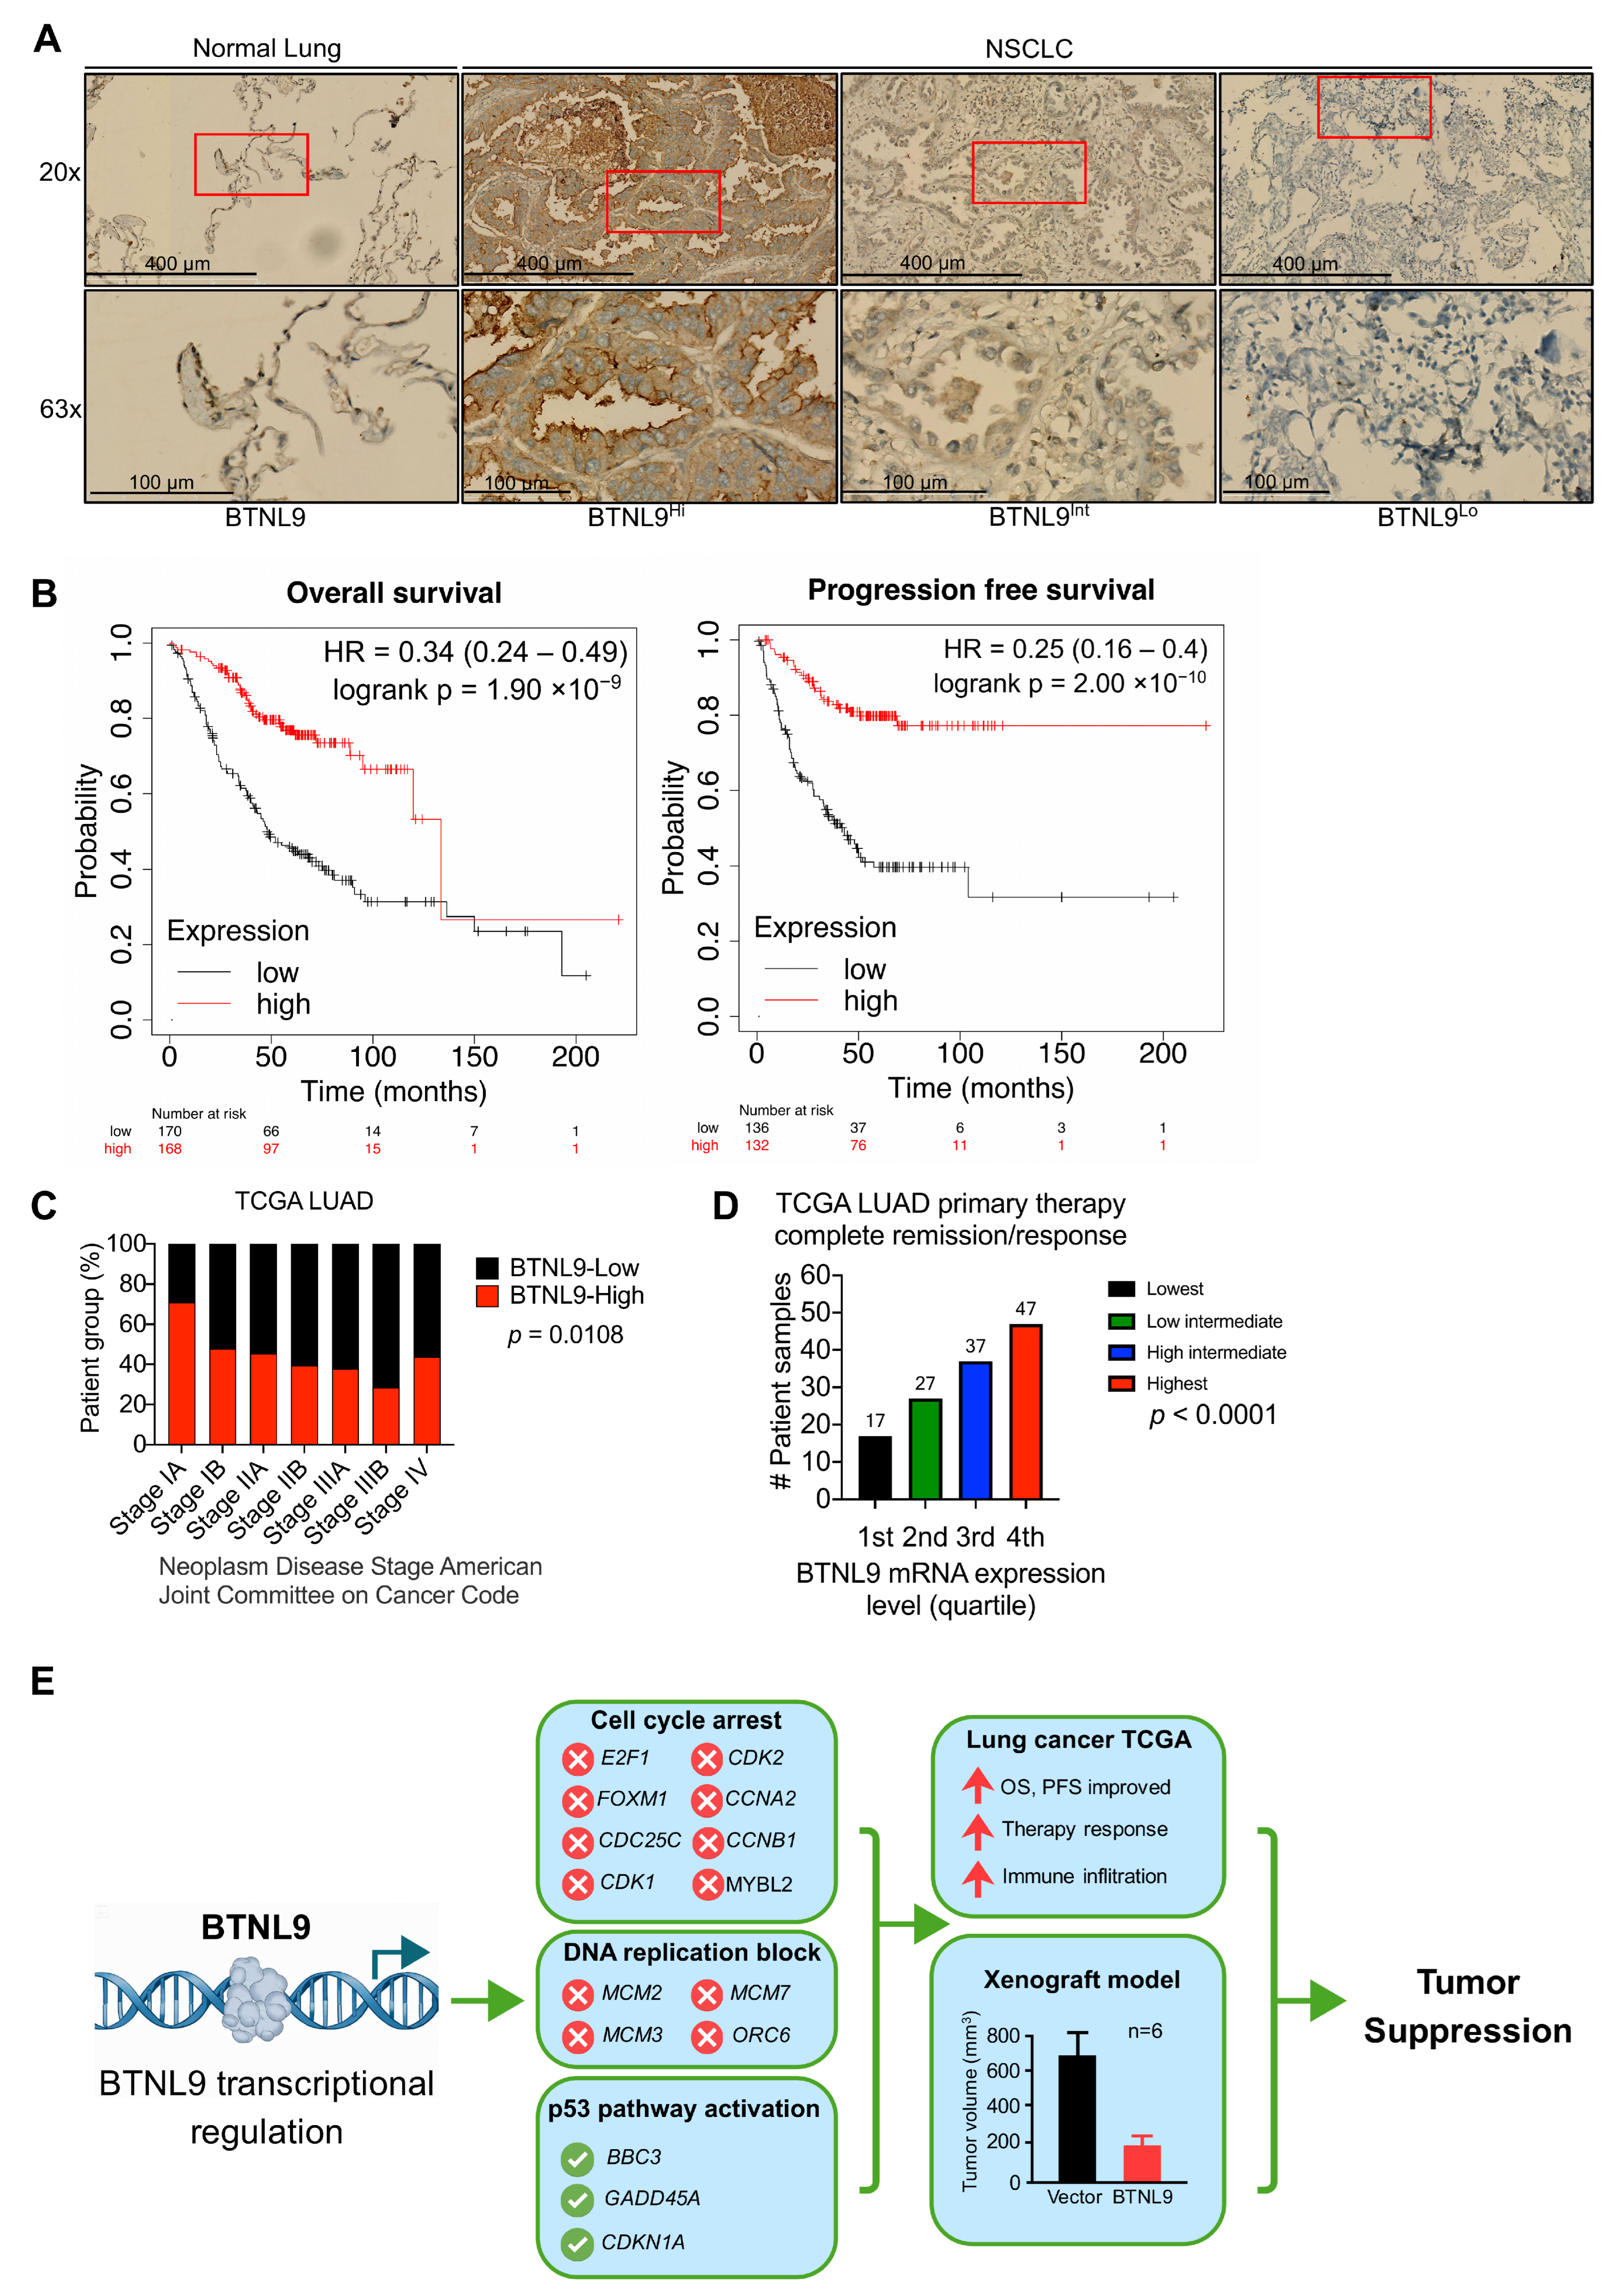
In this study, we provide evidence supporting that BTNL9 acts as a non-canonical transcriptional regulator in non-small cell lung cancer (NSCLC). It includes a global mapping of BTNL9’s binding sites and its active involvement in regulating genes critical for DNA replication and the cell cycle. Furthermore, BTNL9 appears to steer genes tied to p53-regulated transcription in a p53-dependent manner. Using a xenograft model, we showed that BTNL9 inhibits tumor growth in vivo. We also demonstrated that BTNL9 protein level in cancer cells is associated with etoposide and bortezomib treatment sensitivity. Analysis of clinical data from NSCLC patients revealed that a high level of BTNL9 expression was associated with improved survival outcomes and higher rates of complete remission in those undergoing primary treatment. Overall, our study offers a deeper understanding of transcriptional regulation and tumor suppression dynamics, hinting at a broader mechanism for cancer control.
3. Discussion
In this study, our data support a potential role for BTNL9 as a transcriptional regulator with tumor-suppressive activity in NSCLC. Importantly, the term “transcriptional regulator” is broader than the classical definition of a sequence-specific DNA-binding transcription factor and may include chromatin-associated regulatory proteins, transcriptional co-regulators, cofactor-associated regulatory complexes and long non-coding RNA that modulate gene expression without necessarily directly binding DNA motifs [
34,
35,
36,
37,
38]. In the present study, BTNL9 demonstrated nuclear localization, reproducible chromatin occupancy by ChIP-seq with ChIP-qPCR validation, and coordinated regulation of transcriptional programs identified by RNA-seq, collectively supporting its involvement in transcriptional regulatory processes.
Subcellular fractionation analysis revealed at least three distinct BTNL9 protein bands in NSCLC cell lines, with the highest molecular weight band predominantly localized in the nuclear fraction and the remaining two bands were found mostly in the cytoplasmic fraction. This distribution pattern was accompanied by contextual analysis of predicted NLS motifs across known BTNL9 transcript variants, suggesting that differential nuclear targeting may contribute to the observed subcellular distribution. Despite the presence of predicted NLS motifs within these potential isoforms, the two smaller bands remained predominantly cytoplasmic, and whether these variants may translocate to the nucleus under specific physiological or stress-associated conditions remains to be determined. It is important to note that this subcellular distribution pattern represents a descriptive observation, and the precise identity of the nuclear band and its correspondence to specific BTNL9 transcript variants remains to be directly confirmed through future isoform-specific studies. The transcriptional regulatory function demonstrated in the present study reflects the activity of the overexpressed full-length BTNL9 construct and does not depend on the identity of specific endogenous isoforms. Given the presence of up to 10 reported BTNL9 transcript variants, future studies involving mass spectrometry-based isoform characterization and isoform-specific knockdown approaches will be necessary to determine which transcript variants correspond to the observed protein bands and to clarify their individual functional contributions to transcriptional regulation.
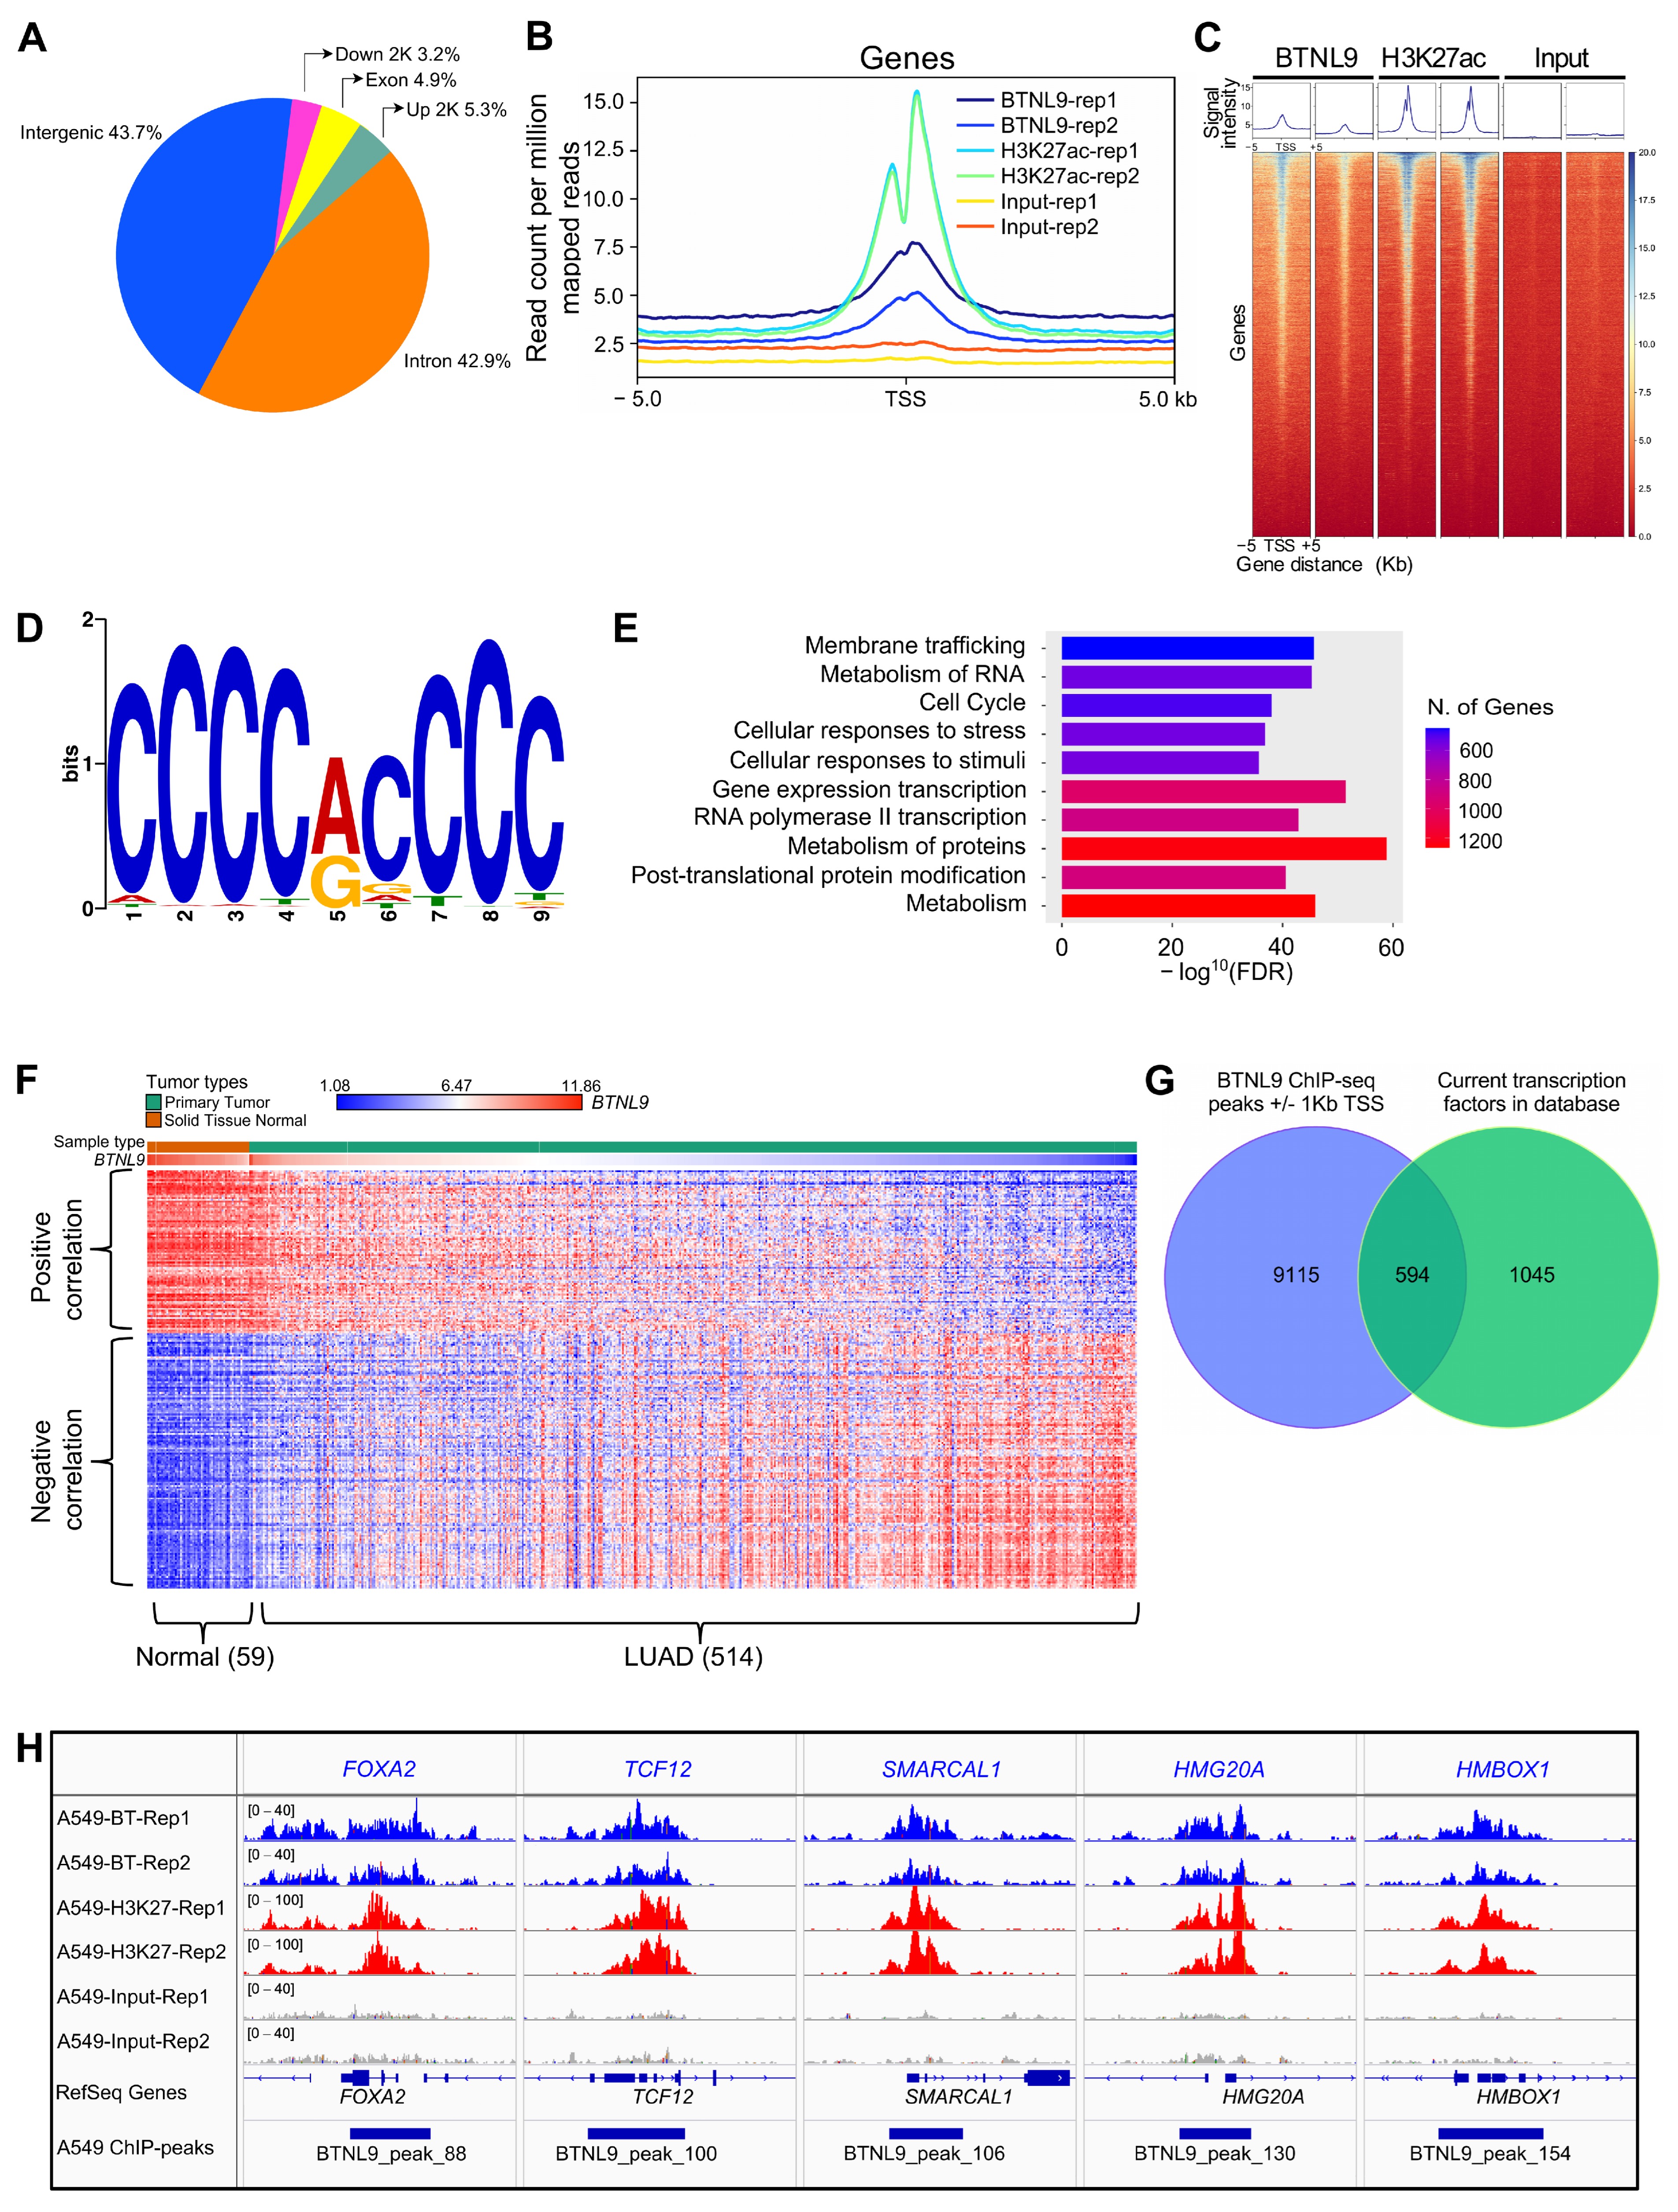
Multiple lines of evidence support a transcriptional regulatory role for BTNL9. Domain analysis revealed a bZIP_GCN4-like region, a structural motif typical of DNA-binding and dimerization domains. Coiled-coil predictions and native PAGE demonstrated that BTNL9 forms homodimers, and co-immunoprecipitation assays confirmed that the bZIP-like region is required for self-association. Immunofluorescence further indicated nuclear localization consistent with chromatin access. ChIP-seq and ChIP-qPCR analyses showed BTNL9 enrichment at promoter regions of genes such as BBC3, CDKN1A, E2F1, and MCM7, all of which contain predicted BTNL9-associated motifs. A DNA-protein pulldown assay using a biotinylated E2F1 promoter fragment demonstrated selective BTNL9 enrichment. Notably, ChIP-derived motif analysis identified a conserved cytosine-rich sequence enriched within BTNL9-associated promoter regions, suggesting a potential sequence preference for genomic association.
Although BTNL9 contains only a single leucine heptad repeat and exhibits a less canonical basic region compared with classical bZIP transcription factors, its genomic distribution supports a broader regulatory role. In this study, 87% of the identified ChIP peaks were located within the intronic and intergenic regions, a pattern commonly observed for transcription factors involved in enhancer activity, long-range chromatin regulation [
39,
40], or non-coding RNA-associated mechanisms [
41]. These possibilities warrant further investigation. Collectively, these findings support a model in which BTNL9 acts as a non-canonical transcriptional regulator with locus-specific genomic engagement and the capacity to repress key cell cycle-related genes. While direct DNA-binding mechanisms remain to be elucidated through EMSA, promoter-reporter assays, and motif-mutation analyses, we acknowledge that the biotinylated promoter pulldown assay was performed using nuclear extract, and therefore indirect association of BTNL9 with the E2F1 promoter fragment via bridging proteins cannot be formally excluded at this stage. Our ChIP-seq and ChIP-qPCR data collectively establish that BTNL9 is functionally associated with transcriptional regulation, though whether this reflects direct sequence-specific DNA contact or indirect chromatin association through protein–protein interactions remains an important open question for future investigation. It is important to note that the chromatin occupancy analyses presented in this study were performed under AM-tagged BTNL9 overexpression conditions, employing a commercially validated ChIP-grade anti-AM-tag antibody, an approach specifically recommended for low-abundance chromatin-associated proteins lacking validated ChIP-grade antibodies. Confirmation of endogenous physiological BTNL9 chromatin occupancy will require future studies employing validated endogenous ChIP-grade antibodies or CRISPR-based endogenous epitope tagging strategies, which will be valuable for defining the full physiological chromatin occupancy landscape of BTNL9.
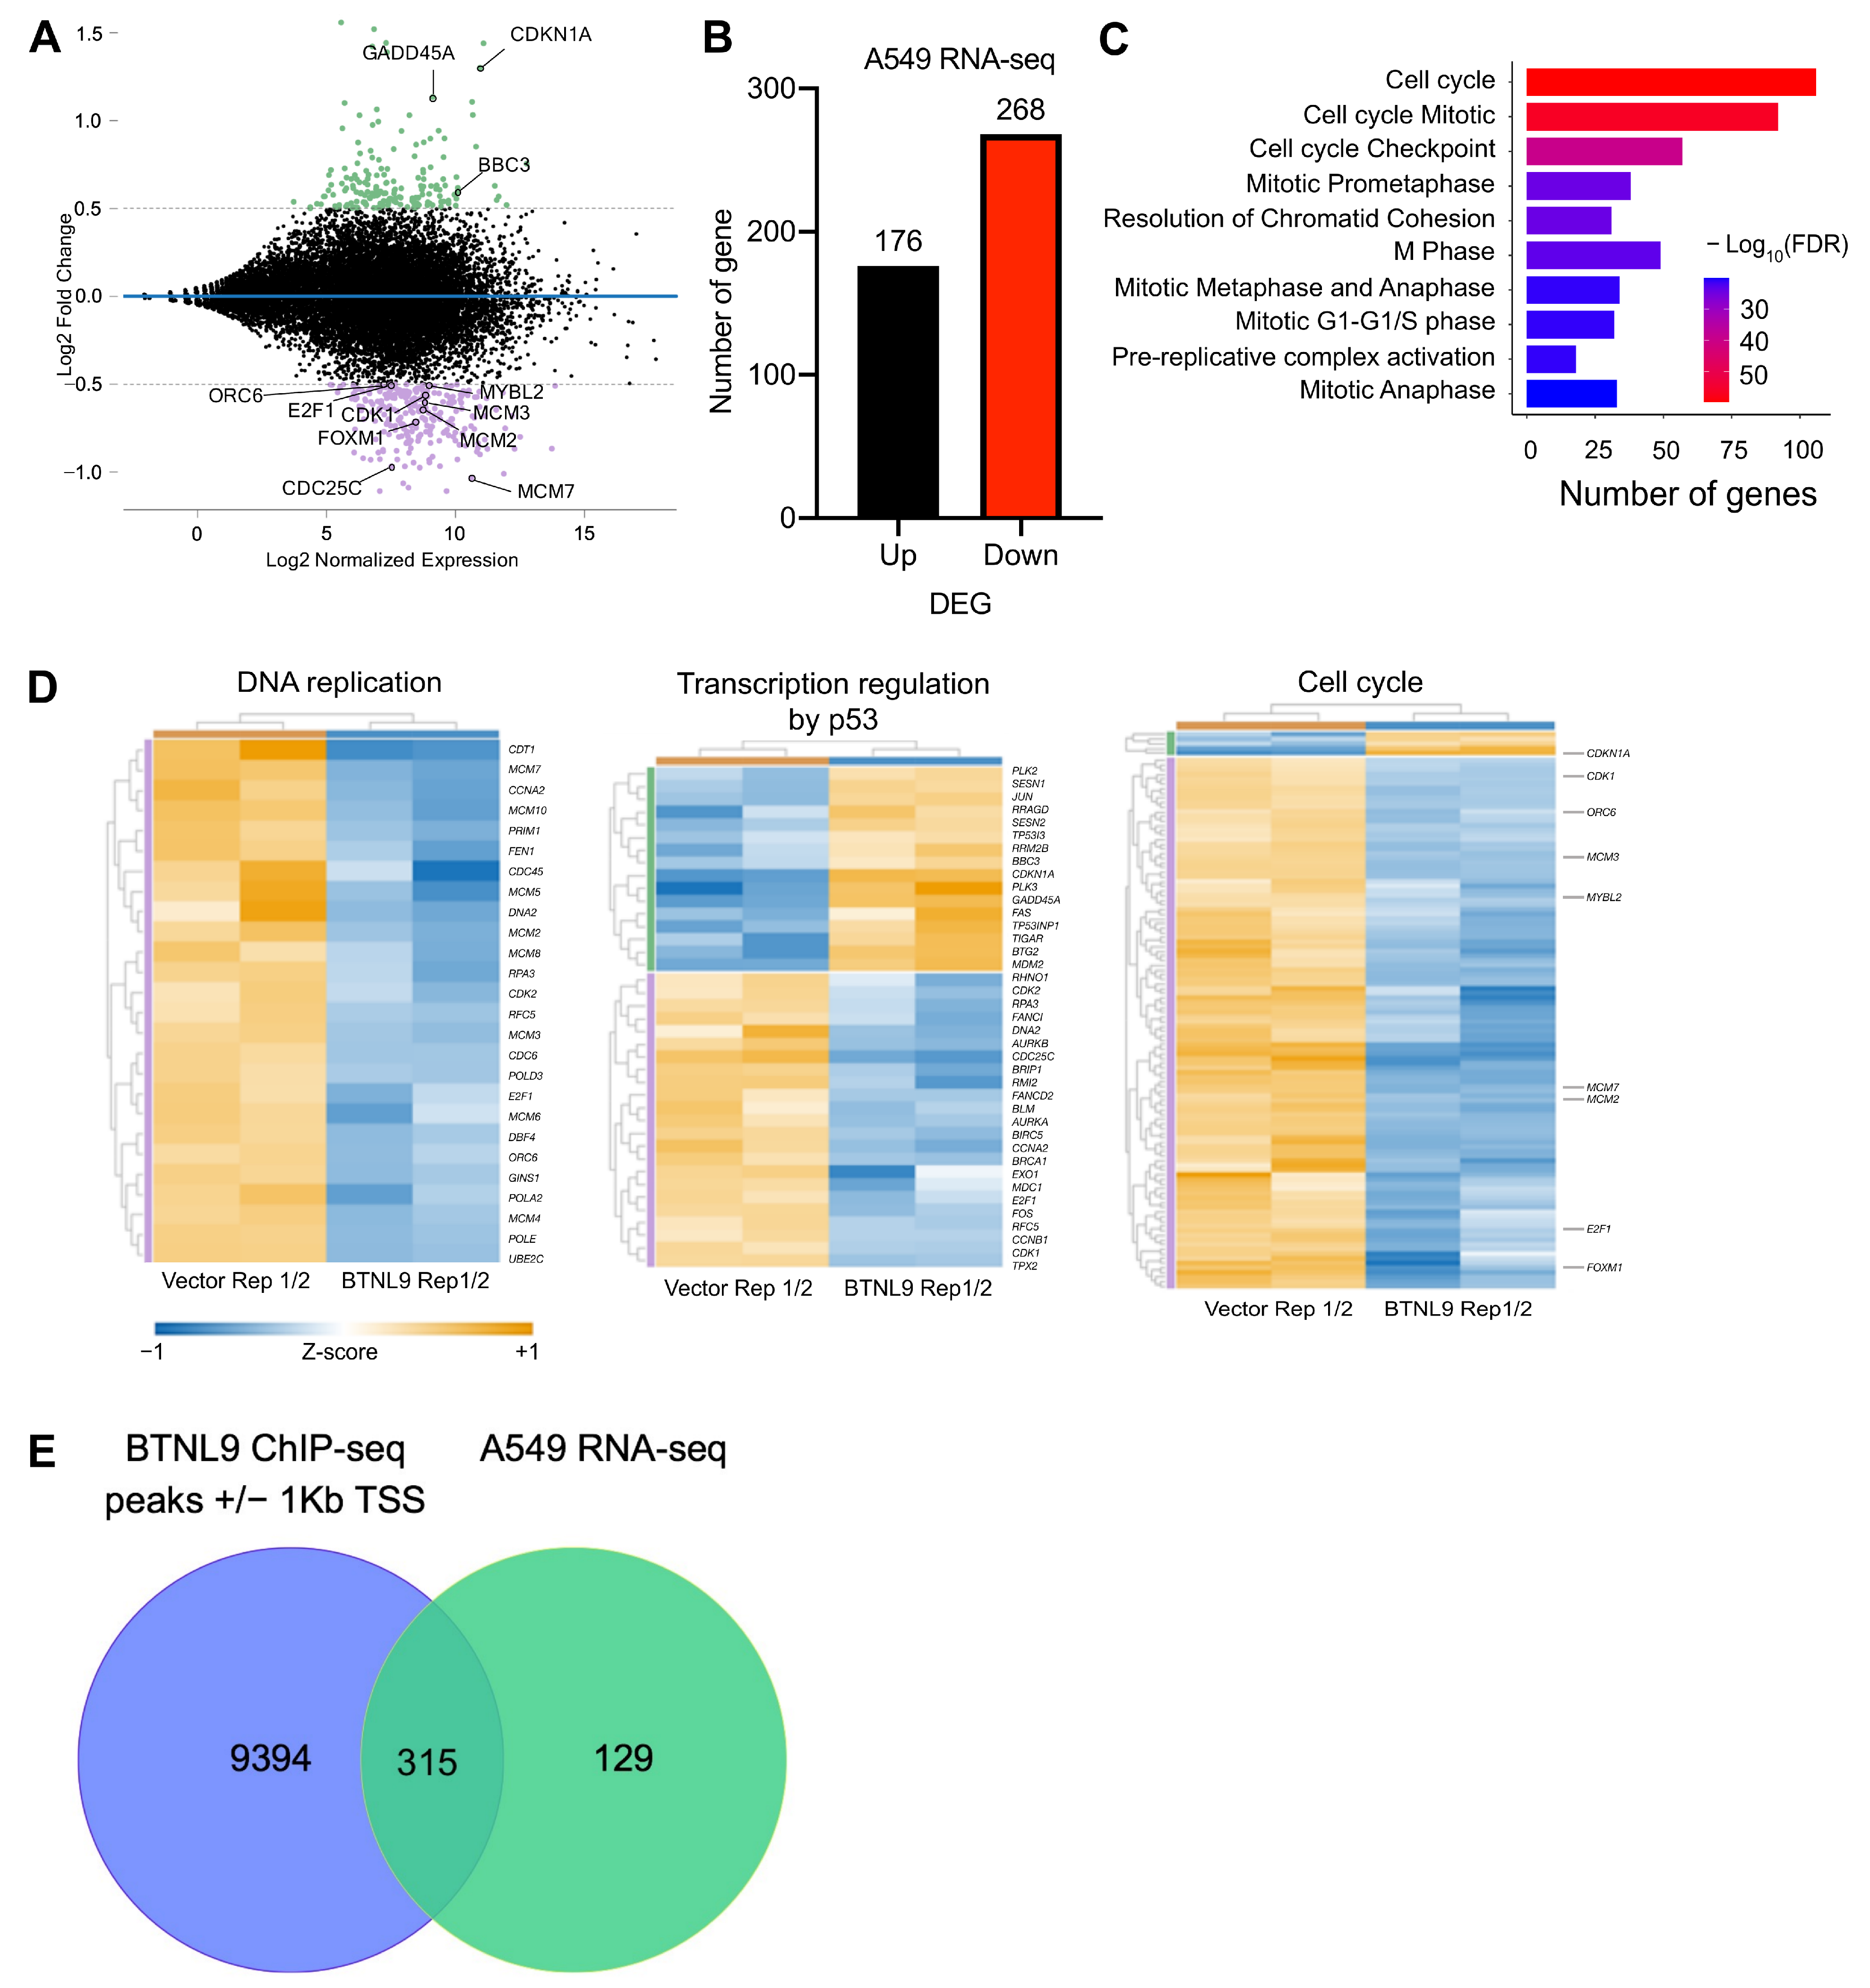
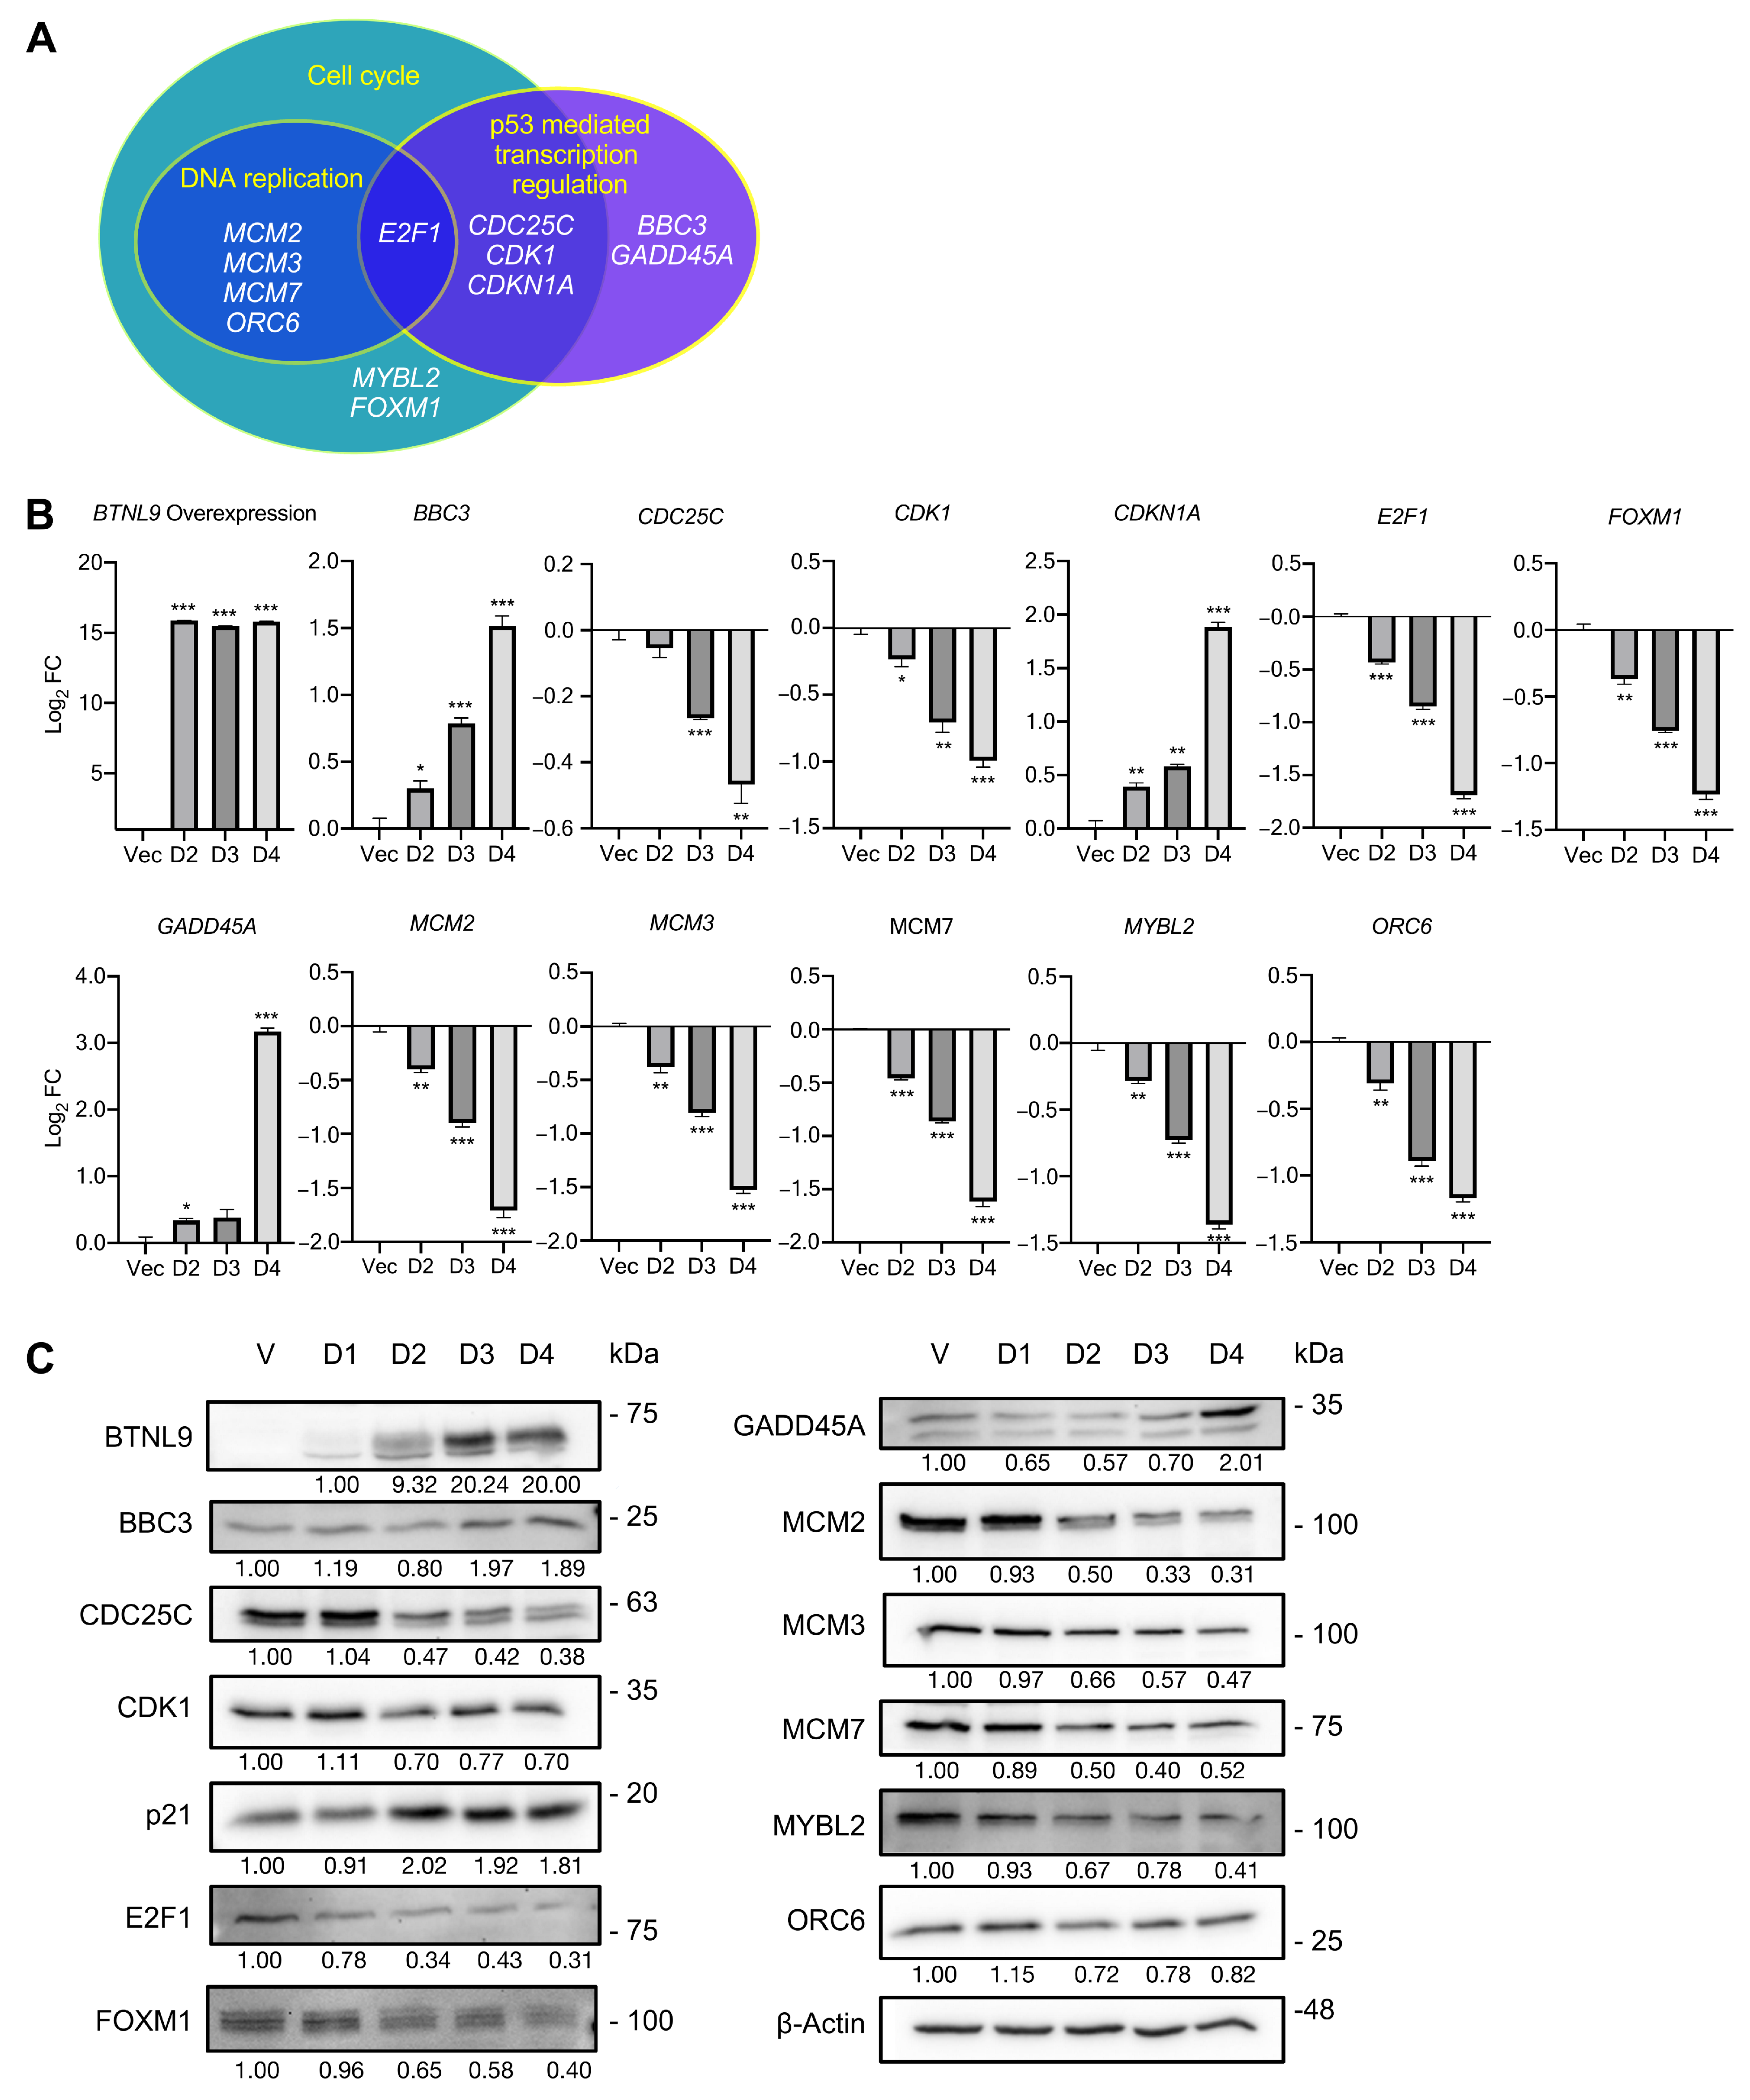
RNA-seq analysis further suggested that BTNL9 overexpression is associated with altered expression of genes involved in several biological pathways, including cell cycle regulation, a p53-mediated transcriptional regulation program, and DNA replication. These findings identified candidate pathways potentially relevant to the tumor-suppressive functions of BTNL9 and provided a framework for subsequent experimental validation. Specifically, BTNL9 overexpression was associated with coordinated downregulation of multiple MCM family genes, DNA replication licensing factors, and cell-cycle-associated genes, suggesting a potential role in regulating genomic stability and cell-cycle progression. In addition, the RNA-seq dataset identified a subset of p53-associated genes whose expression was altered following BTNL9 overexpression, raising the possibility of functional interplay between BTNL9-mediated transcriptional regulation and p53 signaling pathways. Similar p53-associated regulatory mechanisms have been reported for NF-Y, TFE3, TFEB, FOXD3, and EYA4, which contribute to tumor-suppressive responses through modulation of p53-dependent transcriptional programs [
42,
43,
44,
45]. Importantly, many of the key genes selected for validation in this study represent well-established regulators of tumorigenesis. For example, multiple MCM family members have been proposed as sensitive markers of premalignant lung lesions and are closely linked to tumor progression [
46,
47,
48]. Furthermore, several genes downregulated following BTNL9 overexpression, including
CDC25C,
CDK1,
E2F1,
FOXM1,
MCM2, and
MCM7, have previously been identified as therapeutic targets in cancer [
49,
50,
51,
52,
53,
54]. Although the RNA-seq experiment was performed as a discovery-oriented transcriptomic screen, the transcriptional changes observed in key target genes were independently supported by RT-qPCR, Western blot, ChIP-seq, and ChIP-qPCR analyses, providing convergent evidence for the biological relevance of the validated BTNL9-regulated gene network.
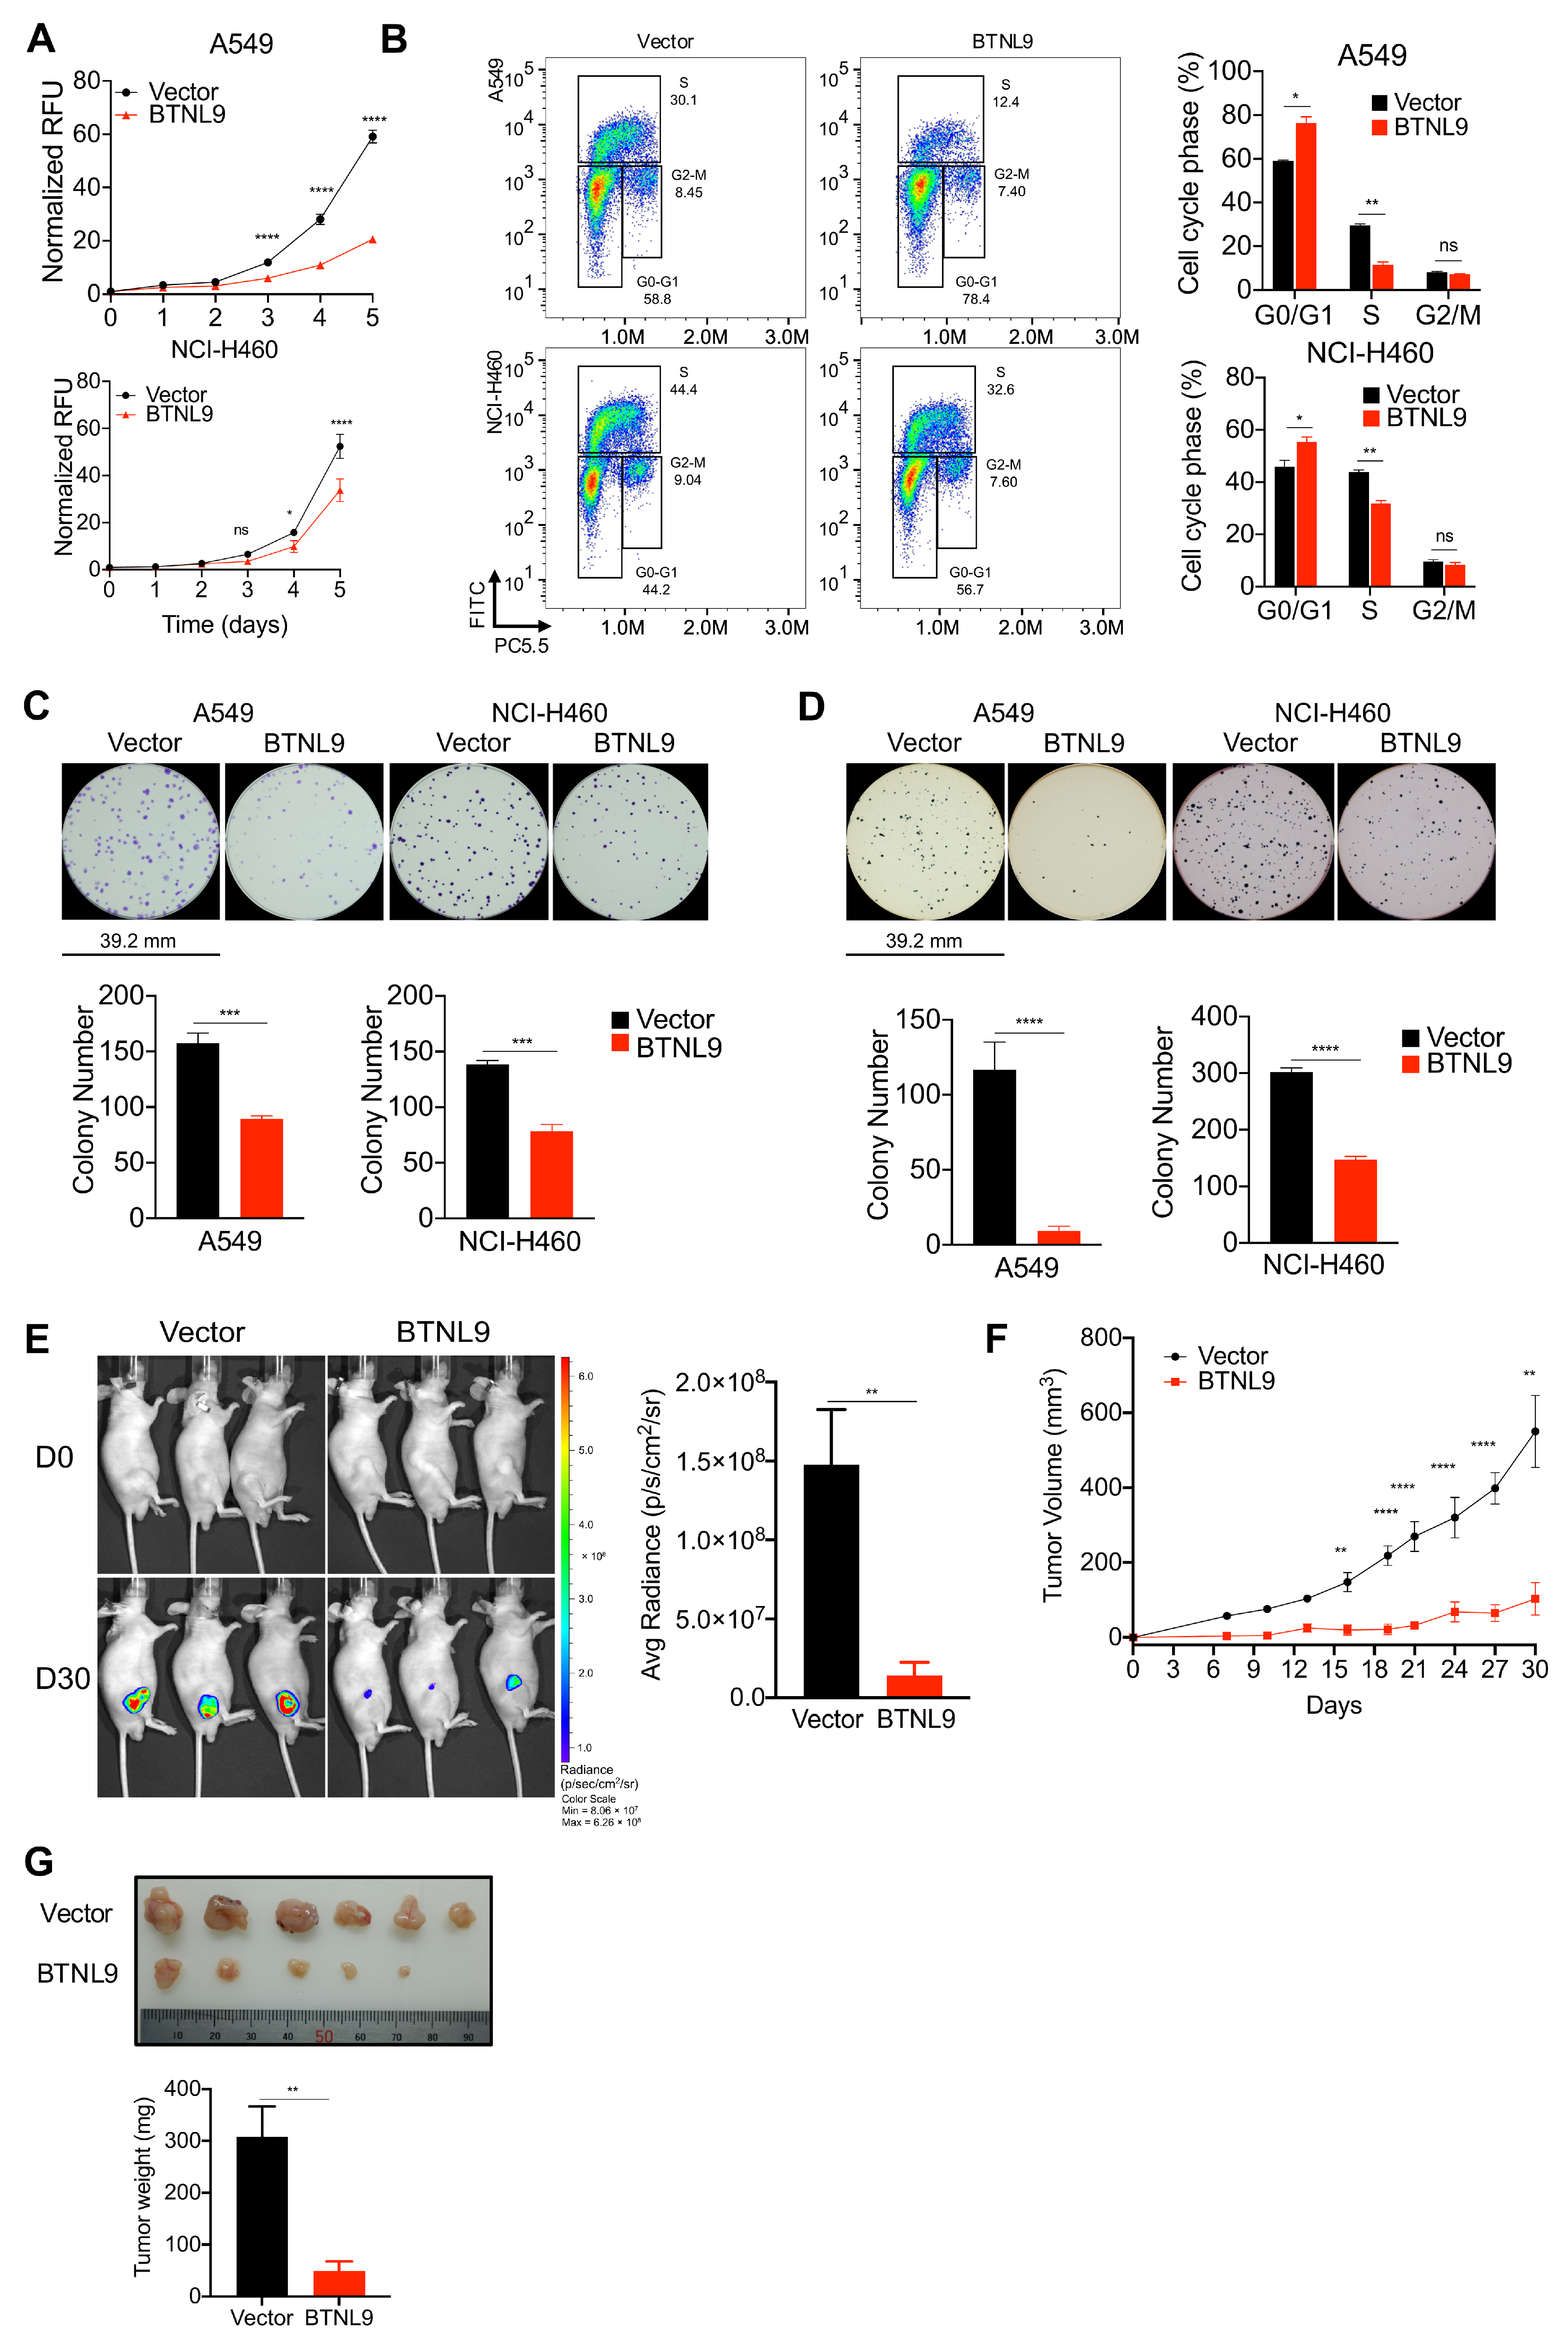
Through our xenograft model, we established BTNL9’s role as a tumor suppressor, consistent with its transcriptional and translational repression of genes involved in cell proliferation and DNA replication. Analysis of TCGA datasets further supports this function, showing that BTNL9 downregulation is associated with tumor progression and poorer clinical outcomes. Importantly, survival analyses revealed that patients with higher BTNL9 expression exhibited significantly better overall and disease-free survival in LUAD, and these associations remained robust in multivariate Cox regression models after controlling for age, gender, smoking history, and tumor stage. This indicates that BTNL9 is an independent prognostic factor in LUAD, consistent with our mechanistic findings involving FOXM1 and cell cycle regulation. In contrast, BTNL9 expression did not reach statistical significance in LUSC, highlighting biological differences between adenocarcinoma and squamous cell carcinoma and suggesting that BTNL9’s prognostic utility may be restricted to LUAD. Beyond lung cancer, associations observed in breast, liver, renal, and pancreatic cancers suggest that BTNL9 may have broader relevance as a biomarker, warranting further validation. In addition, BTNL9 expression was associated with complete remission rates after primary treatment, suggesting potential utility as a predictive biomarker for therapeutic response.
Given the molecular heterogeneity of NSCLC, it is important to evaluate the role of BTNL9 across distinct oncogenic subtypes. In the present study, we employed two genetically distinct NSCLC models, A549 (LUAD, harboring KRAS G12S) and NCI-H460 (LCLC, harboring KRAS Q61H), and observed consistent tumor-suppressive effects of BTNL9 in both cell lines, suggesting that its activity is retained in these KRAS-mutant backgrounds. Although TCGA analyses were conducted in both the LUAD and LUSC cohorts, cell-based validation was limited to these two models, as commonly used LUSC cell lines frequently harbor TP53 mutations that are incompatible with the p53-dependent mechanistic framework of this study. Future investigations should extend these findings to other molecularly defined subtypes, including EGFR- and ALK-driven NSCLC, as well as p53 wild-type LUSC models, to determine whether the tumor-suppressive activity and predictive value of BTNL9 are preserved across diverse oncogenic backgrounds and treatment settings. Such subtype-specific validation will be critical for defining the broader clinical relevance of BTNL9 and its potential utility as a biomarker in precision oncology.
The tumor immune microenvironment orchestrates a complex interplay between tumor cells and infiltrating immune populations. This dynamic interaction determines the balance between anti-tumor and pro-tumor immunity, thereby influencing tumor progression and therapeutic efficacy [
55,
56,
57]. Our TCGA analyses of LUAD and LUSC demonstrated a substantial correlation between BTNL9 expression and increased infiltration of immune populations linked to anti-tumor activity, including cytotoxic T cells, NK cells, and B cells. These findings further suggest that BTNL9 may contribute to clinical prognosis and treatment responsiveness through modulation of the immune microenvironment. Further studies are required to elucidate the mechanisms by which BTNL9 may promote immune cell recruitment or retention within tumors. However, such investigations are complicated by structural differences between human and murine BTNL9 proteins, including poor conservation of the putative bZIP domain region in the murine ortholog, which may limit functional comparability across species (
Figure S7H). Accordingly, conventional mouse models may not fully recapitulate human BTNL9 biology. Future studies would benefit from patient-derived models or ex vivo human immune co-culture platforms, which provide a genuinely human biological context to more accurately define the immunoregulatory role of BTNL9.
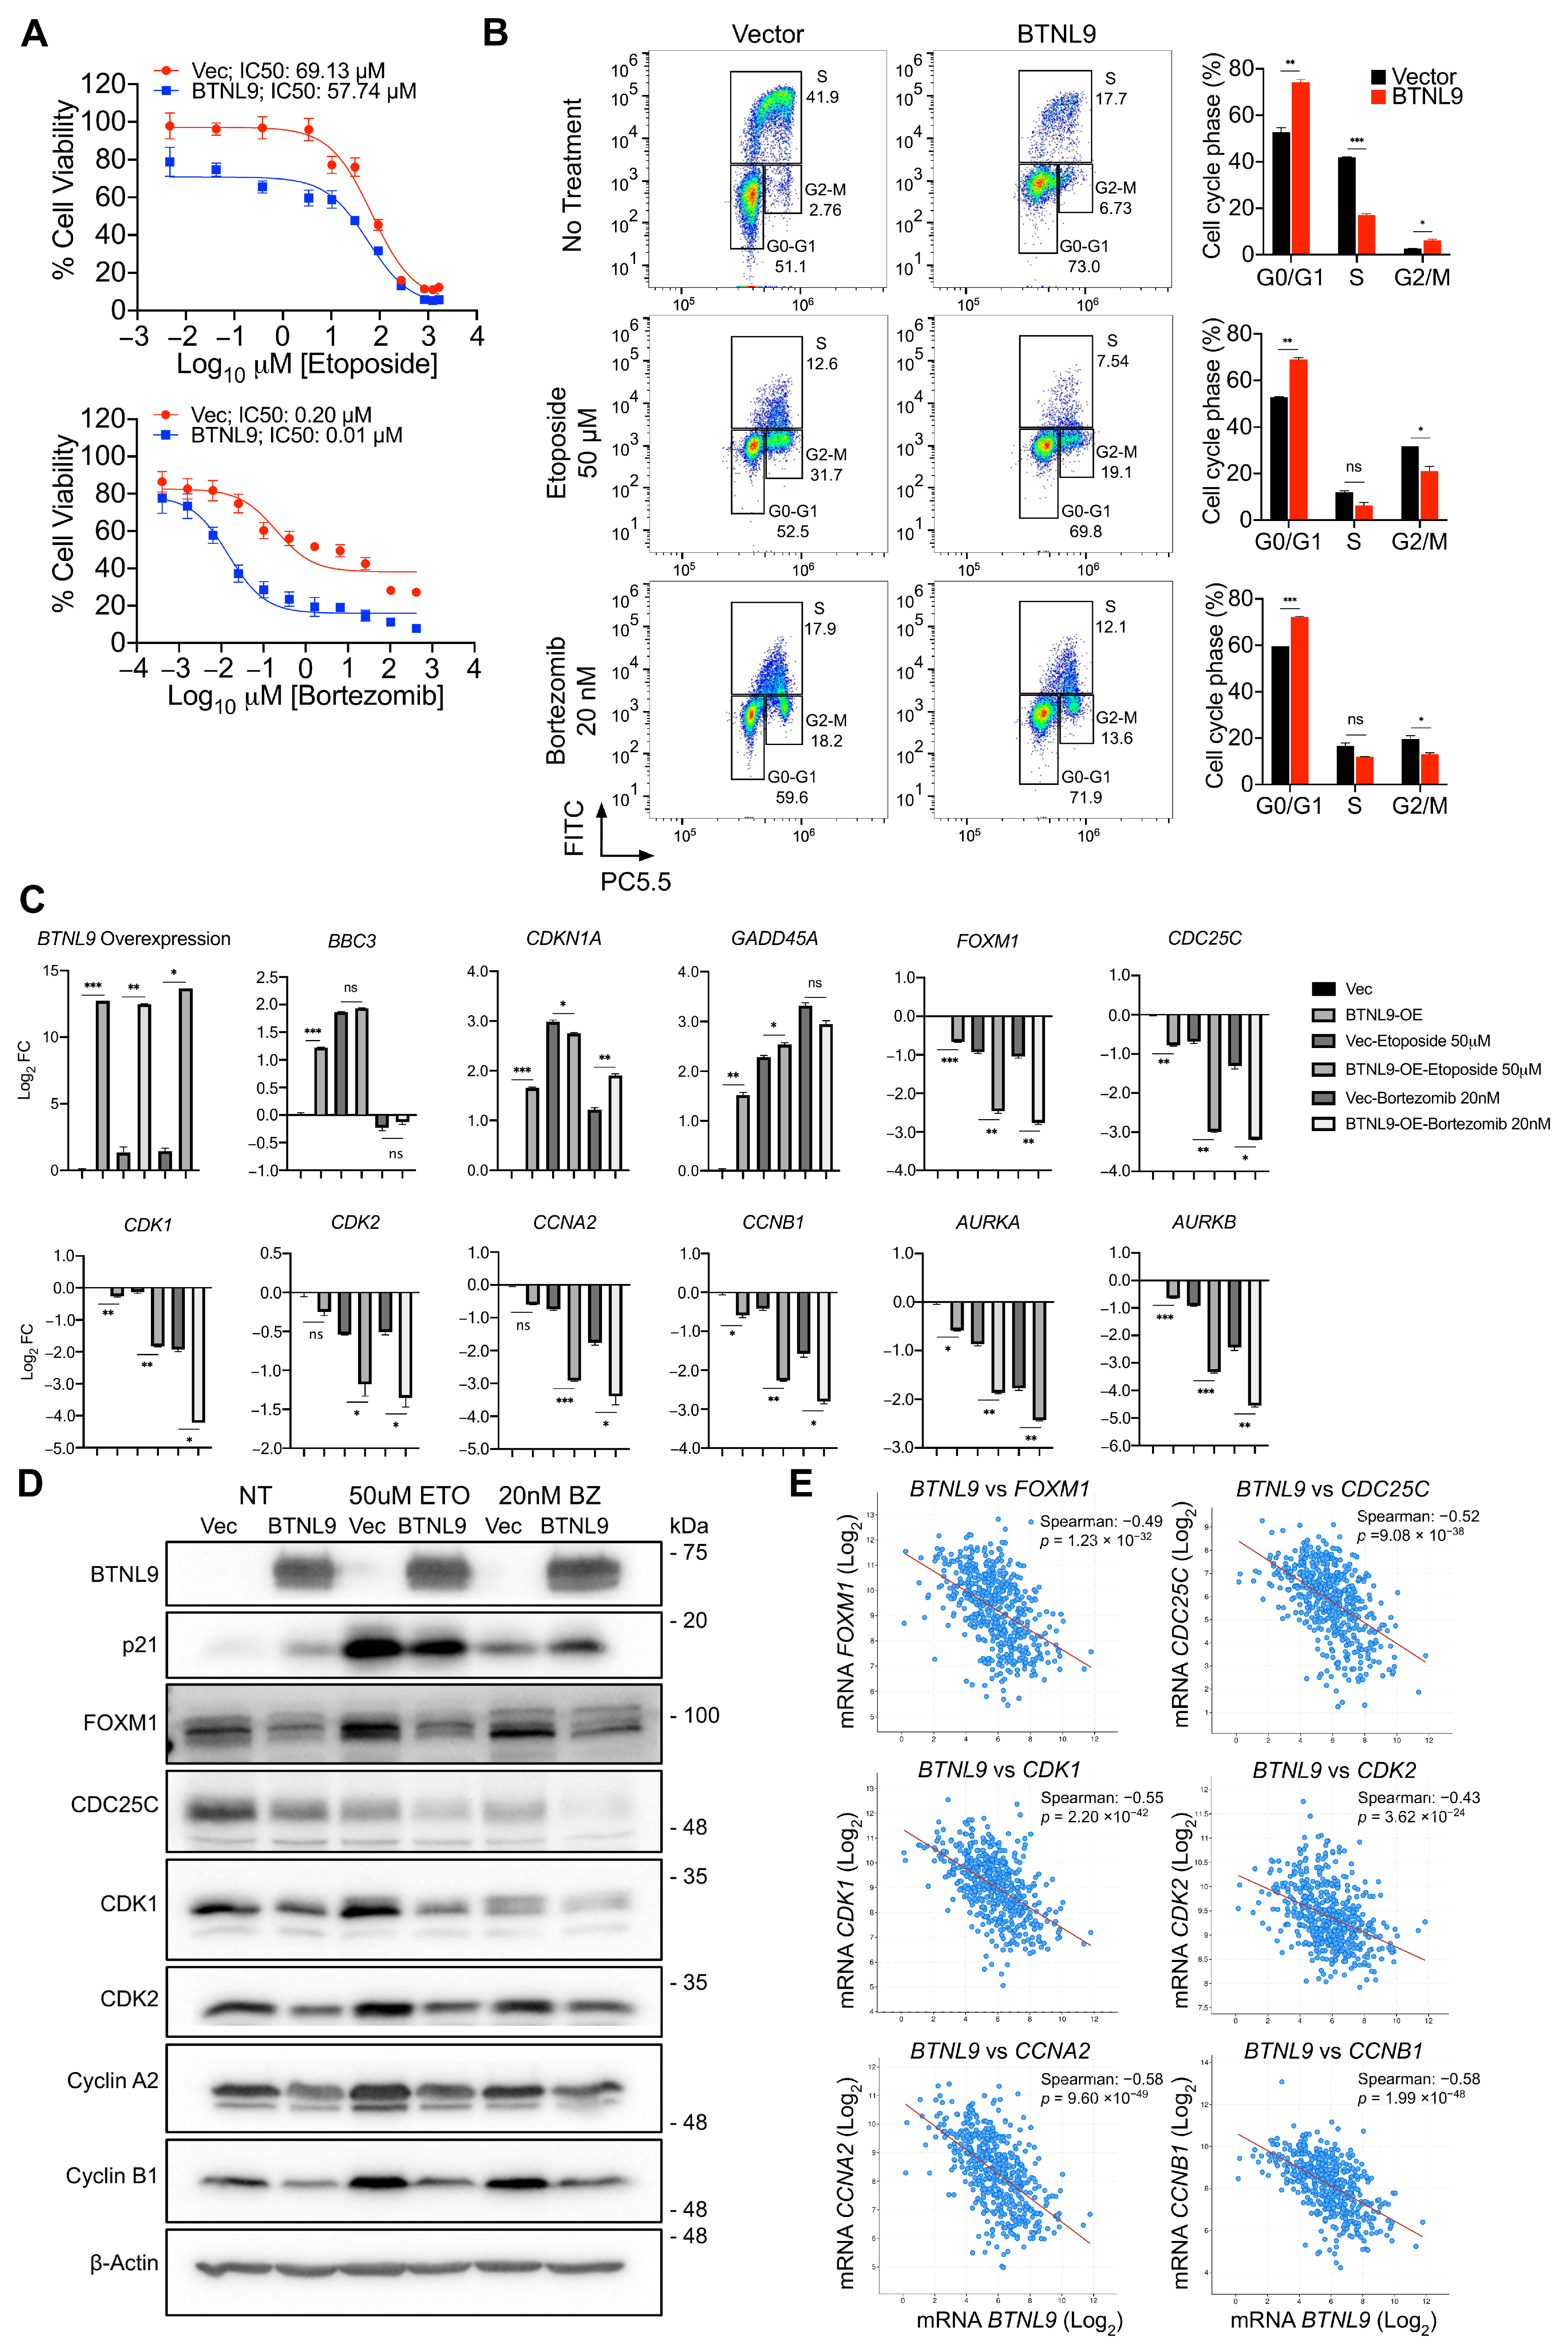
To examine whether the BTNL9 protein level affected treatment efficacy, we selected etoposide and bortezomib as representative agents acting through DNA damage and proteotoxic stress pathways, respectively. Extending these observations to therapeutic response, we found that modulation of BTNL9 expression enhances sensitivity to both etoposide and bortezomib, albeit with distinct response profiles from both NSCLC cell lines. Although bortezomib is not a standard therapeutic agent for NSCLC, its well characterized ability to induce proteotoxic stress and disrupt cell cycle regulation makes it a useful mechanistic tool for interrogating BTNL9-dependent vulnerabilities. We also note that basal cell cycle distributions, particularly the G2/M fraction in asynchronous cultures, showed modest variability between independent experiments, likely reflecting differences in growth conditions and expression levels. Nevertheless, the overall suppressive effect of BTNL9 on cell cycle progression was consistently observed. One of these regulators, FOXM1, is a transcription factor that plays a pivotal role in cell cycle progression, especially during the G1/S and G2/M transition and mitotic progression [
58,
59,
60]. Its activation is also involved in the phosphorylation of CDK1, CDK2, and Cyclin B1 (
CCNB1) and Aurora kinase B (
AURKB) [
61,
62]. A negative correlation between BTNL9 and these key cell cycle regulators in LUAD TCGA data further supports the role of BTNL9 in their suppression. These findings suggest that BTNL9 expression levels in cancer cells play a crucial role in determining treatment efficacy. Based on this novel discovery, we propose that BTNL9 could serve as an important biomarker for guiding treatment selection. Future studies using in vivo drug-response models will be valuable to further assess the translational relevance of BTNL9-mediated chemosensitivity.
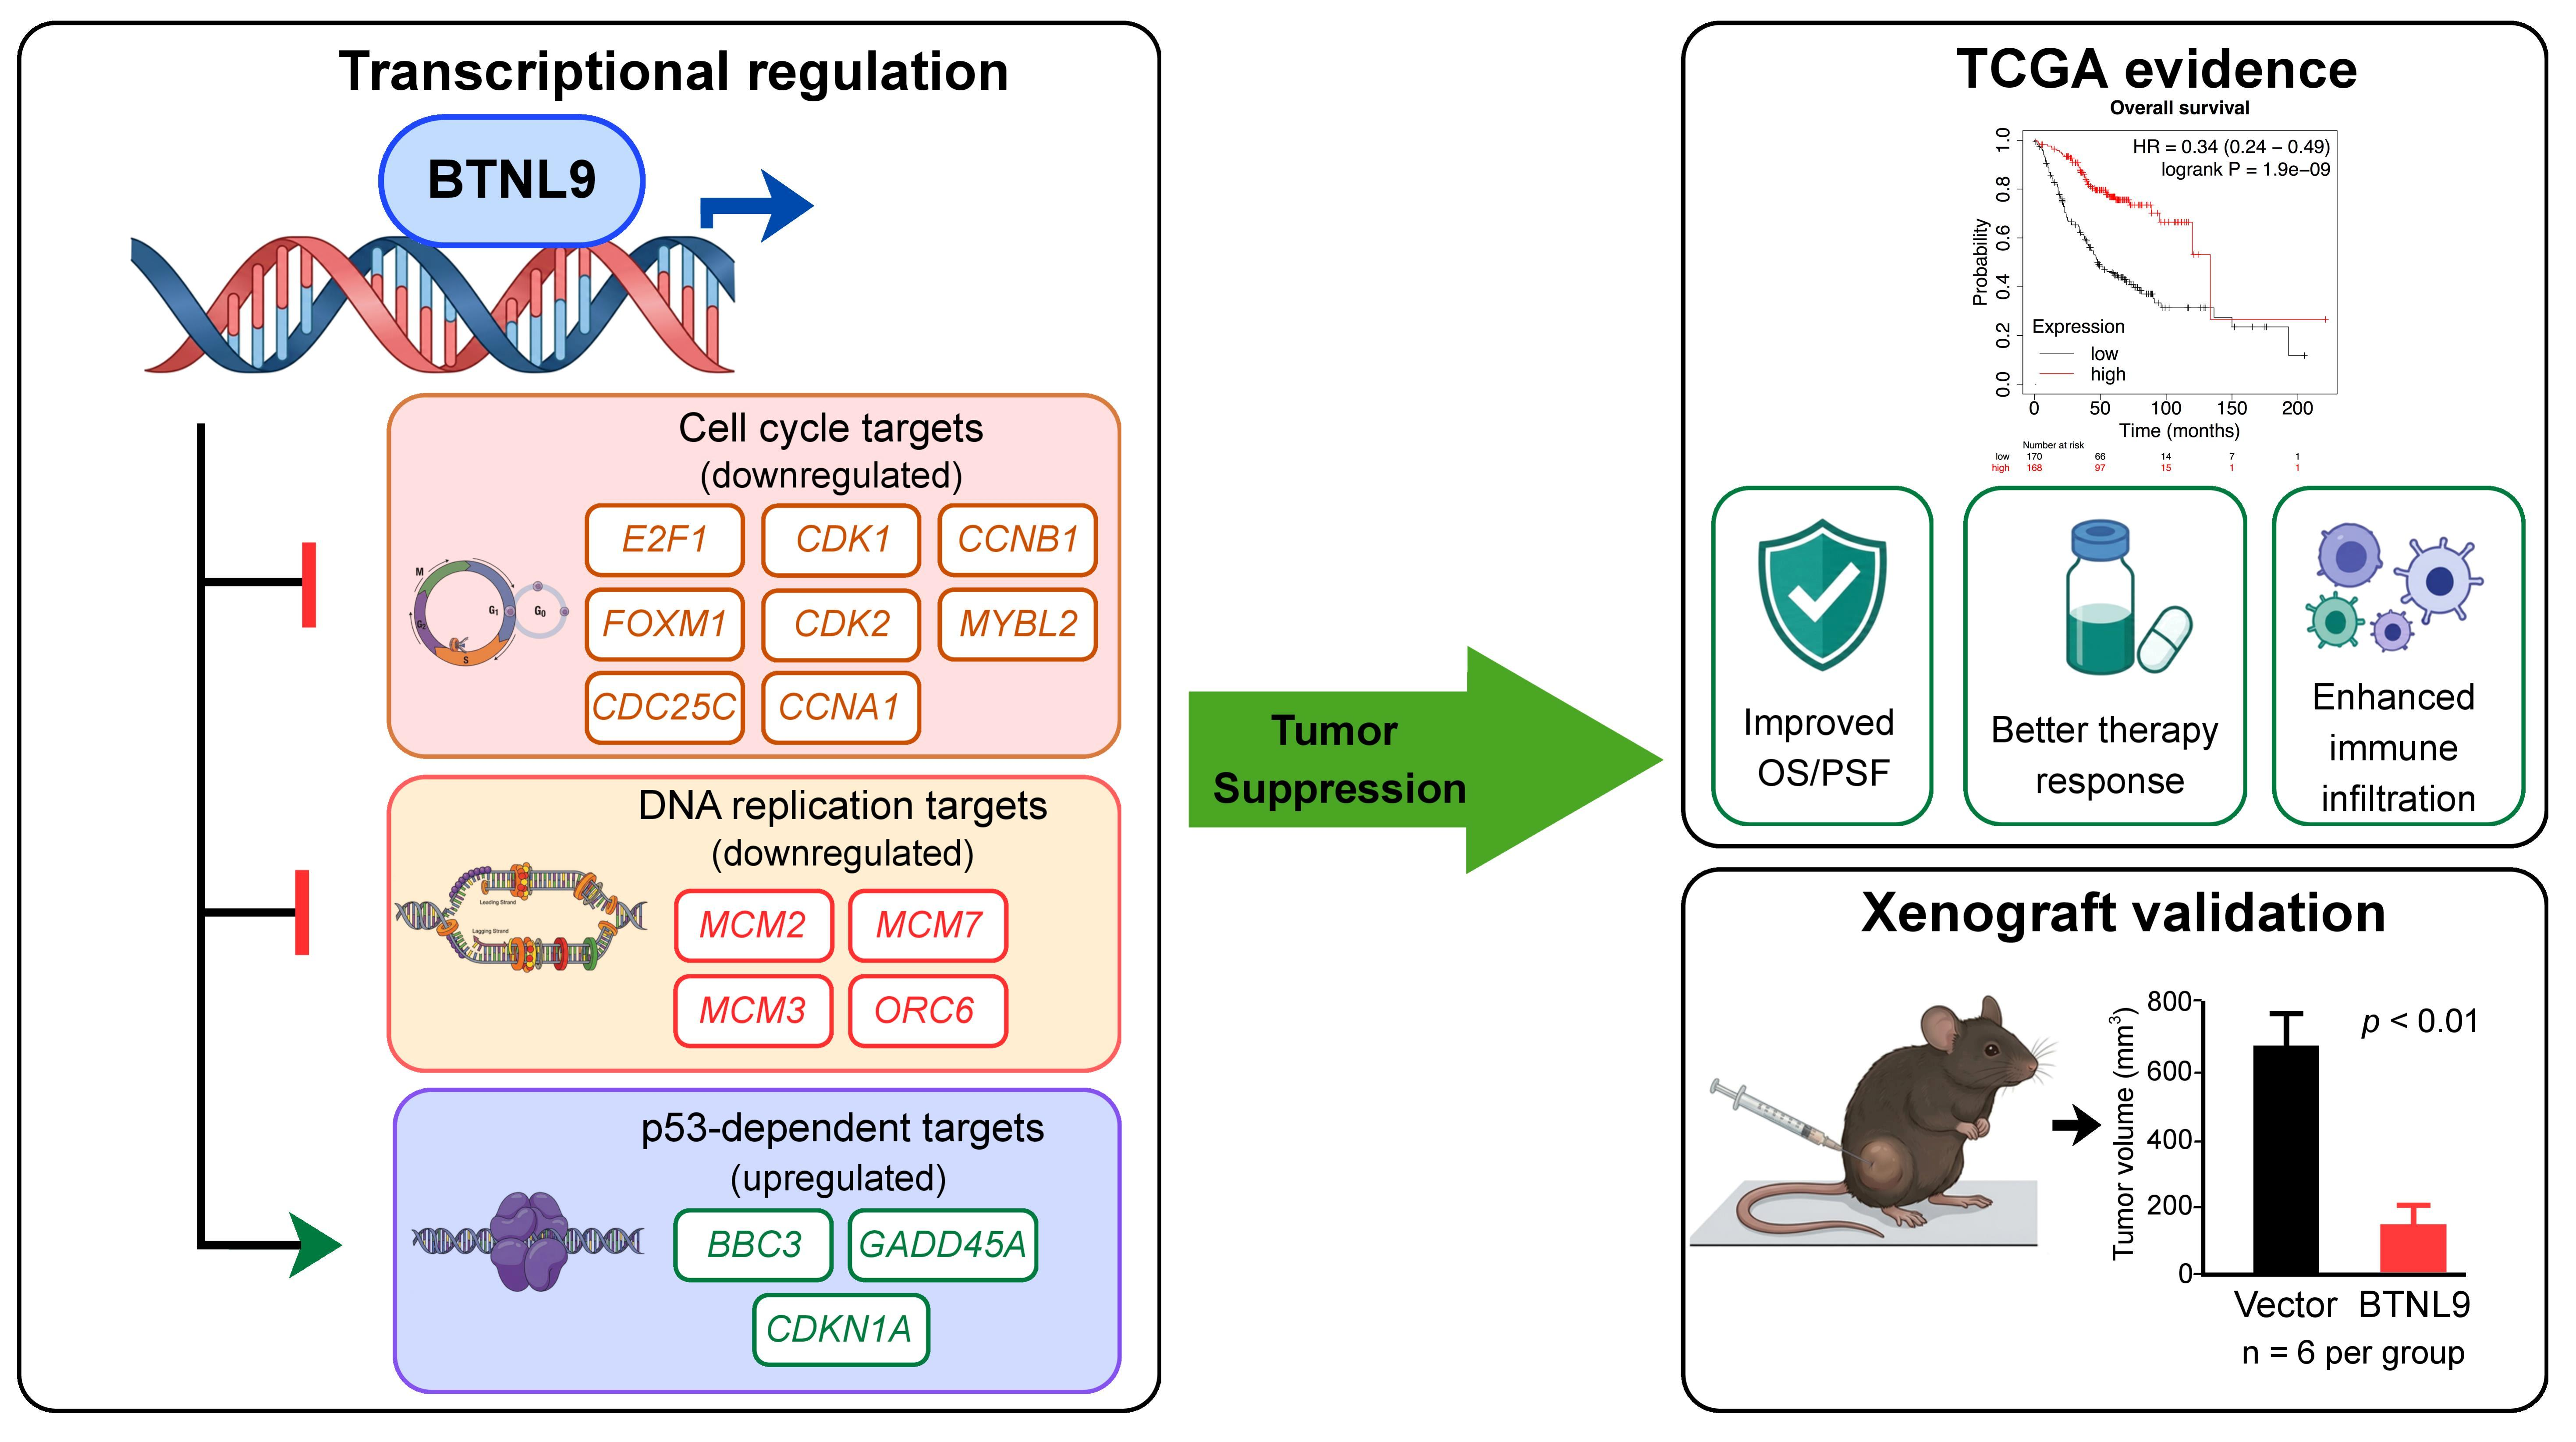
In summary, this study provides multiple lines of evidence supporting BTNL9 as a non-canonical transcriptional regulator with tumor-suppressive functions in NSCLC (
Figure 7E). Our findings highlight several unique features of BTNL9, including its isoform-specific subcellular localization, homodimerization capacity, and locus-specific genomic association, which together offer new insight into its potential role in cancer biology. While these results suggest that BTNL9 influences key transcriptional regulation in cell cycle progression and stress responses, further mechanistic studies are required to define its gene-specific regulatory roles. It is noteworthy that the majority of BTNL9-associated ChIP-seq peaks reside in intronic and intergenic regions, consistent with the genome-wide distribution patterns commonly observed for chromatin-associated transcriptional regulators. While the present study focused on promoter-proximal BTNL9 occupancy to establish its core transcriptional regulatory function, the potential roles of distal BTNL9-associated chromatin regions including putative enhancer elements and long-range regulatory interactions represent an important avenue for future investigation. Elucidating how BTNL9 expression is controlled in cancer may provide important insights into tumor biology and its potential as a therapeutic target.
4. Materials and Methods
4.1. Human Lung Tumor and Adjacent Samples
Patients’ clinical unstained slides were obtained from Inje Biobank of Inje University Busan Paik Hospital, a member of Korea Biobank Network with Institutional Review Board regulations and approval (IRB #2023-09-012).
4.2. In Vivo Xenograft Mouse Model
The animal study was approved by the Institutional Animal Care and Use Committee of Inje University under the project title” Study of BTNL9 cancer suppression mechanism” (Institutional Review Board# 2022-010), and fully complied with the accepted standards for the care and use of laboratory animals. Four-week old male BALB/C nude mice (Japan SLC) were used for the subcutaneous tumor growth assay. Mice were housed in a 12 h light/12 h dark cycle at 22 °C and 50–60% humidity. Each mouse was subcutaneously injected in the flank with 100 µL of A549 transduced cells (5 × 10⁶) suspended in Matrigel Basement Membrane Matrix (BD Bioscience, San Jose, CA, USA, #356234). Mice were randomly grouped into two (BTNL9 overexpression and empty vector control), each including 6 mice. The experiment was repeated twice (yielding a total of 12 mice per group) to minimize in vivo bias and outliers. Prior to the in vivo study, a plasmid expressing firefly luciferase marker was transfected into A549 cells, which were then selectively cultured with the antibiotic hygromycin B. Once a stable cell line was established, these cells were transduced with either empty vector control or BTNL9-OE lentivirus. At post-transduction 3 days, we implanted these cells subcutaneously into BALB/c nude mice. Tumor volume was measured in every 3 days by an investigator blinded for both experimental groups. Tumor volume was calculated as V = (L × W2)/2, where L is tumor length and W is tumor width in millimeters (mm). The imaging was conducted and captured by In Vivo Imaging Systems (IVIS) at the start (Day 0) and end of the experiment (Day 30) using 30 mg/mL of D-Luciferin (GoldBio, St. Louis, MO, USA, #LUCK-1G). Mice were euthanized using CO2 and the tumors were excised for visual and weight-based assessments.
4.3. Non-Small Cell Lung Cancer Cell Lines and Cell Culture
Human lung carcinoma cell lines A549 (KCLB) and NCI-H460 (KCLB) were cultured in RPMI-1640 medium (Cytiva, Marlborough, MA, USA, #SH30027), and HEK-293T (ATCC) was cultured in Dulbecco’s Modified Eagle Medium (DMEM) supplemented with 10% fetal bovine serum (FBS) (Cytiva, #SH30919.03) and 1% penicillin/streptomycin (Cytiva, #SV30010). All the cell lines were maintained at 37 °C with 5% CO2 and sub-cultured upon reaching approximately 80% confluency.
4.4. Plasmid Construction of Human BTNL9
A codon-optimized human
BTNL9 cDNA (RefSeq: NM_152547.5) was synthesized and cloned into the pcDNA3.1(+) vector backbone (Invitrogen, Waltham, MA, USA) and used as a template for subsequent plasmid constructions. For wild-type (WT) BTNL9 overexpression, the cDNA was subcloned into a third-generation lentiviral backbone vector, pLJM1 (Addgene, Watertown, MA, USA, RRID:Addgene_19319), from which the eGFP reporter gene had been removed. The resulting plasmid was designated pBTNL9-OE. The pBTNL9-AM-tag, pBTNL9-FLAG, pBTNL9-ΔbZIP-AM-tag and pBTNL9-MutbZIP-AM-tag expression constructs (
Figure S1D), used for ChIP-sequencing, co-immunoprecipitation (co-IP) and native PAGE experiment, were generated with a BTNL9 cDNA template and cloned into the same modified pLJM1 lentiviral backbone. All primers used for amplifying these construct sequences are listed in
Table S9. Gibson Assembly was used for all cloning steps.
4.5. Lentivirus Production and Infection
Lentiviral particles were produced using a second-generation packaging system according to previous published protocol with minor modification [
63]. Three days after transfection, the viral supernatant was harvested, subsequently filtered through 0.45 μm filter to remove cell debris, and then mixed with Lenti-X concentrator at a 3:1 ratio (Takara, Kusatsu, Japan, # 631231). After incubation overnight at 4 °C, the mix was centrifuged at 1500×
g for 45 min at 4 °C. The concentrated lentivirus was re-suspended in an appropriate volume and kept at −80 °C. A549 and NCI-H460 were subsequently transduced with lentiviruses carrying either an empty vector or overexpression plasmids (pBTNL9-OE and pBTNL9-AM-tag) in the presence of 8 ug/mL hexadimethrine bromide (Sigma-Aldrich, St. Louis, MO, USA, # H9268) overnight. The fresh medium was replaced the next day and cells were harvested as assigned. Due to the potent anti-proliferative effect associated with sustained BTNL9 overexpression, stable puromycin-selected BTNL9-overexpressing NSCLC cell lines could not be maintained during prolonged culture. Preliminary time-course analysis demonstrated that BTNL9 expression peaked at Day 3 following lentiviral transduction and gradually declined thereafter (
Figure S3A), likely reflecting selective depletion of highly expressing cells. Functional assays were therefore initiated during the period of peak BTNL9 expression.
4.6. Chromatin Immunoprecipitation Sequencing (ChIP-Seq) and ChIP-qPCR
ChIP DNA was prepared using Tag-ChIP-IT (Active Motif, Carlsbad, CA, USA, #53022) according to the manufacturer’s protocol. A549 and NCI-H460 cells were infected with lentivirus overexpressing pBTNL9-AM-tag and cross-linked with 1% formaldehyde fixative solution on Day 3 before being quenched after 15 min. Following 2 rounds of washing, cell pellets were incubated in Chromatin Prep Buffer for 10 min, followed by 20 strokes of processing with a chilled Dounce homogenizer. After centrifugation, cells were resuspended in ChIP buffer before sonication to yield fragments between 200 and 500 bp in length. Four ug of Antibodies for anti-AM-tag (Active Motif, #91111, RRID:AB_2793779), anti-mouse H3K27ac (Thermo Fisher Scientific, Waltham, MA, USA, #MA5-23516, RRID:AB_2608307) or mouse IgG2a isotype control (Thermo Fisher Scientific, #02-6200, AB_2532943) were added to 30 µg sheared chromatin and incubated at 4 °C overnight. ChIP DNA and input DNA were extracted using the column provided by this kit. Both ChIP DNA and input DNA samples were either analyzed via ChIP-qPCR or submitted to BGI Genomics (Hong Kong, China) for ChIP-seq library construction and sequencing. ChIP DNA was prepared using the DNBSEQ™ MGISEQ-2000RS platform (MGI Tech, Shenzhen, China). Briefly, DNA ends were repaired, 3′-dA overhangs were added, and sequencing bubble adaptors were ligated. The DNA fragments were amplified, heat-denatured, and circularized to form single-strand circular libraries prior to sequencing. Raw sequencing data were filtered to remove adapter sequences, contaminants, and low-quality reads using SOAPnuke (CleanParameter: filter -l 5 -q 0.5 -n 0.1 -Q 2). The resulting clean reads were aligned to the human reference genome (GRCh37/hg19) using BWA (version 0.7.10; parameters: bwa aln -t 4 -o 1 -e 49 -m 100,000 -i 15 -q 10 -I) and SOAPaligner/SOAP2 (version 2.21t, RRID:SCR_005503). For group-level peak calling, sequencing reads from both biological replicates (A549-BT-rep1 and A549-BT-rep2) were pooled and analyzed jointly against pooled input controls (A549-Input-rep1 and A549-Input-rep2) using MACS2 (RRID:SCR_013291; parameters: -g hs -s 50 -p 1.0 × 10
−5 -m 10 30 -B --trackline). Peaks were identified using a threshold of
p < 1.0 × 10
−5 and a Benjamini–Hochberg false discovery rate (FDR) < 0.005, yielding 26,610 high-confidence BTNL9 associated genomic regions. Pooling of biological replicates prior to peak calling is an established strategy to increase the sequencing depth and sensitivity for detecting chromatin-associated regions, particularly for proteins with low endogenous expression. To associate peaks with nearby genes, genomic coordinates of the significant peaks were uploaded to the Genomic Regions Enrichment of Annotations Tool (GREAT, version 4.0.4, RRID:SCR_005807), using a window of ±1 kb around the transcription start site (TSS), identifying 9709 BTNL9-associated genomic regions proximal to annotated genes. To validate ChIP-seq data, enrichment at a selected gene locus was quantified using the percent of input method and confirmed specific BTNL9 binding in both cell lines. In addition, 10% of sheared chromatin as input was purified together with final ChIP-DNA. Equal amounts of ChIP-DNA from IgG2a isotype control and BTNL9-AM-tag pulled down groups were used as templates in ChIP-qPCR. Primers are listed in
Table S9.
4.7. Co-Immunoprecipitation (Co-IP) Protein Pull-Down Assay
Both A549 and NCI-H460 cells were co-infected with lentiviral generated from pCMV-BTNL9-AM-tag and pCMV-BTNL9-FLAG-tag. Two million cells were seeded in a 2 × 10 cm culture dish (Corning, Corning, NY, USA, #430167) and cells were harvested at Day 3. Co-IP was performed using Pierce crosslink immunoprecipitation kit (Thermo Fisher Scientific, #26147) according to the manufacturer’s instructions. In addition, 10 µg of anti-FLAG antibody (Biolegend, San Diego, CA, USA, #637304) was crosslinked to Protein A/G Plus Agarose and used as bait in the Co-IP process, which was followed by overnight incubation with 500 µg of pre-clear lysate at 4 °C overnight. The eluted BTNL9-AM-tag immunoprecipitated protein was analyzed by Western blot.
4.8. Native Polyacrylamide Gel Electrophoresis (PAGE)
Briefly, samples were harvested in RIPA Lysis and Extraction Buffer (Thermo Fisher Scientific, #89900) without any agitation on ice for 30 min. Following centrifugation, protein concentration was quantified using Pierce BCA kit (Thermo Fisher Scientific, # 23225). For native PAGE, samples were prepared in Pierce™ LDS Sample Buffer, Non-Reducing (Thermo Fisher Scientific, #84788), while denatured samples were boiled before being loaded into the NativePAGE™ Bis-Tris Mini Protein Gels, 3–12% (Thermo Fisher Scientific, #BN1001BOX). The gel was run for 1.5 h using a cathode (Thermo Fisher Scientific, #BN2002) and NativePAGE™ Running Buffer (Thermo Fisher Scientific, #BN2001). Proteins were transferred onto a PVDF membrane for Western blot analysis.
4.9. MEME-ChIP DNA Motif Analysis
Both BTNL9 ChIP peak replicate samples were further processed to meet the criteria before being submitted for motif analysis. Peaks with a Benjamini–Hochberg FDR < 0.005 were selected to extract 500 bp from the central region of each peak and generated the final BED format. In the CentriMo option within the MEME (version 5.5.9, RRID:SCR_001783) [
64], a maximum region width of 200 bp was set for motif analysis. The only motif sequence that appeared from both replicate samples analyses was selected as the conserved motif in this study.
4.10. Generation of Sequence Logos Using WebLogo 3
Conserved BTNL9 motif sequence logos were generated using the WebLogo 3 (
https://weblogo.berkeley.edu). Briefly, 19 bp of adjacent BTNL9 putative binding sites aligned nucleotide sequences in FASTA format were uploaded to the WebLogo interface. The output logo depicted the relative frequency and information content of residues at each position, with symbol height being proportional to conservation. Logos were exported in a high resolution image format (PDF) for inclusion in figure.
4.11. DNA-Protein Pulldown (Streptavidin-Biotin Assay)
A 237 bp biotinylated DNA fragment corresponding to the E2F1 promoter region containing the multiple predicted BTNL9 binding motif was synthesized and purified (
Table S9). Nuclear extracts were prepared from A549 cells transiently overexpressing FLAG-tagged BTNL9 using a standard nuclear extraction protocol. The biotinylated DNA probe was incubated with nuclear extracts at 4 °C to allow DNA-protein complex formation. Complexes were captured using Dynabeads MyOne Streptavidin T1 magnetic beads (Thermo Fisher Scientific, #65602) according to the manufacturer’s instructions. After sequential washes [3 rounds of 1× EMSA buffer (20 mM HEPES (pH 7.2), 32 mM KCl, 0.1 mM EDTA (pH 8), 10% glycerol, 70 ng/μL BSA, 8 ng/μL poly dI-dC and 2.5 mM DDT)], including stringent conditions with additional 0.2% Tween-20, bound proteins were eluted and analyzed by SDS-PAGE followed by immunoblotting with anti-FLAG antibody (1:1000 dilution).
4.12. RNA-Sequencing (RNA-Seq)
The total RNA was isolated using Trizol reagent (Thermo Fisher Scientific, # 15596026) and sent to RNA-sequencing service provider (Ebiogen, Seoul, Republic of Korea). RNA quality was assessed by Agilent TapeStation 4000 system (Agilent Technologies, Santa Clara, CA, USA), and RNA quantification was performed using ND-2000 Spectrophotometer (Thermo Fisher Scientific). Library construction was performed using QuantSeq 3′ mRNA-Seq Library Prep Kit (Lexogen, Vienna, Austria) according to the manufacturer’s instructions. This 3′ end sequencing approach enables accurate gene-level expression quantification but precludes detection of alternative splicing events or isoform-level transcript changes, which were not objectives of the present study. High-throughput sequencing was performed as single-end 75 sequencing using NextSeq 550 (Illumina, San Diego, CA, USA). The sequencing raw data was analyzed by ROSALIND
® (
https://rosalind.bio/, RRID:SCR_006233), with a HyperScale architecture developed by ROSALIND, Inc. (San Diego, CA, USA). Reads were trimmed using cutadapt1. Quality scores were assessed using FastQC2. Reads were aligned to the Homo sapiens genome build hg19 using STAR3. Individual sample reads were quantified using HTseq4 and normalized via Relative Log Expression (RLE) using DESeq2 R library (version 1.48.0). Read Distribution percentages, violin plots, identity heatmaps, and sample multidimensional scaling (MDS) plots were generated as part of the QC step using RSeQC6. DEseq2 [
65] was also used to calculate fold changes and
p-values and performed optional covariate correction. Clustering of genes for the final heatmap of differentially expressed genes (DEGs) was done using the PAM (Partitioning Around Medoids) method using the fpc R library (version 2.2-13). Hypergeometric distribution was used to analyze the enrichment of pathways, gene ontology, domain structure, and other ontologies. The topGO R library (version 2.62.0) was used to determine local similarities and dependencies between GO terms in order to perform Elim pruning correction. Several database sources were referenced for enrichment analysis, including Interpro9, NCBI10, MSigDB11,12, REACTOME13, and WikiPathways. Enrichment was calculated relative to a set of background genes pertinent to the study. RNA-seq was performed with two biological replicates per group, with a discovery-oriented FDR threshold of
q < 0.1 applied to maximize detection sensitivity. RNA-seq transcriptomic profiling was performed exclusively in A549 cells. Both A549 and NCI-H460 cells were used for targeted RT-qPCR validation of 12 selected DEGs to assess cross-cell-line consistency of key transcriptional changes, and do not constitute independent transcriptome-level replication.
4.13. RNA Extraction and cDNA Synthesis
Total RNA for qPCR was extracted using a TaKaRa MiniBEST Universal RNA Extraction Kit (Takara Bio, Kusatsu, Japan, #9767A), according to the manufacturer’s protocol. RNA concentration and quality were measured with Nanodrop 2000 (Thermo Fisher Scientific). cDNA was synthesized from 2 μg of total RNA in 20 μL reactions using High-Capacity cDNA Reverse Transcription Kit (Thermo Fisher Scientific, #4368814). After synthesis, the cDNA was diluted 4 times with double distilled water and stored at −20 °C.
4.14. Quantitative Real-Time PCR (qPCR)
Quantitative real-time PCR following reverse transcription (RT-qPCR) was performed in a CFX Opus 96 Real-Time PCR System (Bio-Rad, Hercules, CA, USA) using KAPA SYBR FAST Universal Kit (Sigma-Aldrich, #KK4601). For quantification using the comparative CT method of gene expression, corresponding primers used in this study are listed in
Table S9. All reactions were performed in triplicate and normalized to GAPDH, which served as a control housekeeping gene.
4.15. Immunofluorescence Staining and Confocal Microscopy Analysis
Both A549 and NCI-H460 cells were seeded on poly-l-lysine (Sigma-Aldrich, #P8920) coated slide overnight prior to the process for immunofluorescence staining. Cells were fixed with 4% Paraformaldehyde at room temperature for 15 min and permeabilized with 0.3% Triton-X-100 in 5% BSA for 15 min, followed by 5% goat serum for 1 h. Either 1:250 dilution of anti-rabbit BTNL9 antibody (LS-Bio, Seattle, WA, USA, #LS-C399149) or rabbit IgG control was added for overnight incubation. Slides were washed and incubated at room temperature with 1:1000 diluted anti-rabbit IgG Alexa Fluor® 594-conjugated (Thermo-Fisher Scientific, #A32740, RRID:AB_2762824) for 1 h, followed by DAPI to counterstain nuclei. Slides were mounted with VECTASHIELD® Antifade Mounting Medium (Vector Laboratories, Newark, CA, USA, #H-1000-10). All confocal images were captured with Nikon Confocal laser microscope A1+ at 40× lens. Confocal images were presented without cropping or digital manipulation.
4.16. Western Blot
Cells were lysed in RIPA Lysis and Extraction Buffer (Thermo Fisher Scientific, #89900) with Halt™ Protease and Phosphatase Inhibitor Cocktail (Thermo Fisher Scientific, #78440). The concentration of protein lysate was measured using Pierce™ BCA Protein Assay Kits (Thermo Fisher Scientific, #23225). Then, 30 µg of protein lysate was resolved by 10% SDS-PAGE and transferred to Immobilon-PSQ PVDF Membrane (Sigma-Aldrich, #ISEQ00010). Transferred membranes were incubated with a 5% Blotting-Grade Blocker (Bio-Rad, #1706404), followed by 1:1000 dilution of primary antibodies for overnight incubation. All primary antibodies and secondary antibodies used in this study are tabulated in
Table S10 with an RRID number. The HRP-conjugated secondary antibody was incubated at room temperature for 1 h prior to signal development by Immobilon Forte Western HRP substrate (Sigma-Aldrich, #WBLUF0500). All images were captured with iBright CL1500 (Thermo Fisher Scientific, #A43678) and the signal intensity was quantified with iBright Analysis software version 5.2.2.
4.17. Fractionation Assay
To determine the subcellular localization of BTNL9, we performed the fractionation assay as described in a reference paper with minor modifications [
66]. Briefly, 5 million cells were used for whole cell lysate (WCL), and isolation of cytoplasm fraction (Cyt) and nucleus fraction (Nuc). Additionally, 15 µL of each fraction were loaded for Western blot.
4.18. Proliferation Assay
Cell proliferation was determined by seeding 500 cells/well for A549 cell line and 150 cells/well for NCI-H460 with triplicate wells in a 96-well microplate (Corning, #3596). One tenth of the growth medium’s volume of Resazurin (R&D Systems, Minneapolis, MN, USA, #AR002) was added from Day 0 onward and incubated for 4 h at 37 °C in the presence of 5% CO2. Fluorescence was measured using the microplate reader Viroskan Lux (Thermo Fisher Scientific, #VLBL00D0) by setting the excitation at 544 nm and emission at 590 nm in Skanlt software 6.0.1 (Thermo Fisher Scientific). Multiple points per well were selected to eliminate cross-emission between wells. Growth curves were then generated by subtracting blank readings and normalizing to the initial reading on Day 0.
4.19. Cytotoxicity Assay
To assess the effect of BTNL9 overexpression on drug sensitivity, A549 and NCI-H460 cells were infected with lentivirus carrying either a vector control or BTNL9 overexpression construct. The following day, cells were counted and seeded at a density of 5000 cells per well in 96-well plates in triplicate for each condition. On Day 2, either etoposide (Sigma-Aldrich, #E1383-25mg) or bortezomib (Sigma-Aldrich, #5043140001) were added to the wells at a range of concentrations to generate dose–response curves, and control wells were treated with the vehicle only. Cells were incubated with the drugs for 48 h at 37 °C in a humidified incubator with 5% CO2. After the incubation period, resazurin solution was added and proceeded following the same method as the proliferation assay. The fluorescent signal was normalized to the vehicle control, and dose–response curves were plotted using PRISM software (version 8.3.1). The IC50 values were calculated for both vector control and BTNL9-overexpressing cells to evaluate the impact of BTNL9 on drug sensitivity. Drug concentrations were selected to produce a robust mechanistic signal in vitro and are not intended to reflect clinical pharmacokinetics.
4.20. Cell Cycle Assay
To assess cell proliferation in a cell-cycle dependent manner, transfected cells were seeded in a 6-well microplate (NEST, Wuxi, China, #703003). After 24 h, cells were pulsed with 10 µM of BrdU (Sigma-Aldrich, #B5002) for 1 h, harvested, and then stained using BrdU cell proliferation assay kit (BD Bioscience, San Jose, CA, USA, #556028). Flow cytometry was performed using CytoFlex (Beckman Coulter, Brea, CA, USA, #A001-1-1102). The Flow cytometry data was analyzed by FlowJo software (version 10.2, RRID:SCR_008520). These experiments were repeated twice.
4.21. Clonogenic Assay
Initially, we determined the plating efficiency by seeding varying numbers of cells. For A549, 500 cells were seeded and for NCI-H460, 250 cells were seeded per 6 cm plate, with the experiments done in biological replicates and repeated twice (SPL Life Sciences, Pocheon, Republic of Korea, #20060). Plates were incubated at 37 °C in the presence of 5% CO
2 for 10 days until colonies became visually apparent. The plates were stained with 0.1% crystal violet solution containing 20% of methanol for 20 min and gently rinsed with running water. Plate images were captured and colonies were counted with ImageJ (version 2.14.0/1.54f, National Institutes of Health, RRID:SCR_003070) [
67].
4.22. Soft Agar Assay
To determine anchorage-independent growth, soft agar assay was performed twice with biological triplicates. Low-gelling temperature agarose (Sigma-Aldrich, #A9414-25G) was dissolved in ultra-sterile water to make 2% agarose stock gel. The gel was liquefied by heating and kept in a water bath set at 45 °C. The plate was prewarmed inside incubator at 37 °C and coated with a 0.6% diluted gel to create a bottom layer, which was then solidified at 4 °C for 30 min. The base-coated plate was prewarmed again at 37 °C and an adequate cell number (10,000 cells for A549, and 600 cells for NCI-H460 per well) was added into the 0.3% agarose containing growth media. The suspension was mixed gently avoiding bubble formation and dispensed evenly on top of the base layer. The plate was then incubated at 4 °C for an additional 30 min, after which 1.5 mL of media was added to prevent the agar from disintegrating. After 2–3 weeks, colonies were stained by 1 mg/mL of Nitro blue Tetrazolium Chloride (NBT) (Thermo Fisher Scientific, #N6495) at 37 °C overnight. Captured images were analyzed by OpenCFU (version 3.9.0) [
68].
4.23. Immunohistochemistry Staining
IHC was conducted on paraffin-embedded tissue of normal lung tissue and lung tumor obtained from 98 LUAD patients (45 male, 53 female; mean diagnosis age 59.9 years; tumor stage I–IV; histological grade 2–3) under IRB approval (#2023-09-012) as described in
Section 4.1. The intensity of cytoplasmic staining was evaluated semi-quantitatively by a pathologist as low, intermediate, or high grade. For comparative analysis, cases were grouped into Strong (high staining intensity; n = 25) and Weak (low-to-intermediate staining intensity; n = 73) expression categories. Baseline clinical characteristics including sex, diagnosis age, tumor stage, histological grade, tumor size, pleural invasion, lymphovascular invasion, and EGFR mutation status were comparable between groups (all
p > 0.05). Slides were heated for 1 h at 60 °C, deparaffinized in xylene, rehydrated in graded alcohol and rinsed in distilled water. Antigen retrieval and immunohistochemistry were performed using either a Benchmark XT or Discovery XT automated immunohistochemistry system (Ventana Medical Systems, Inc., Tucson, AZ, USA) with an OptiView DAB IHC Detection kit. Slides were incubated for 34 min at room temperature with diluted BTNL9 antibody to 1:100 (LS-Bio; #LS-C399149). After antibody staining, sections were washed in distilled water, lightly counterstained with hematoxylin, rehydrated and mounted with coverslips. IHC images were obtained on a NanoZoomer RS Digital Pathology System scanner. The intensity of cytoplasmic staining was evaluated as low, intermediate and high grade.
4.24. Generation of p53 Knockout (KO) Cell Lines Using CRISPR-Cas9
CRISPR-Cas9-mediated knockout of
TP53 was performed in A549 and NCI-H460 cells. Single-guide RNAs (sgRNAs) targeting exon 6 of the
TP53 gene were adopted from a previously published study [
69] and cloned into a modified lentiviral HypaCas9 vector (Addgene, RRID:Addgene_138557), which had been engineered to include a U6 promoter and sgRNA scaffold for sgRNA expression. Lentiviral particles were produced in HEK-293T cells using standard packaging plasmids (psPAX2 and pMD2.G) and used to transduce the target cells in the presence of polybrene (8 μg/mL). Transduced cells were selected with blasticidin (10 μg/mL) for 10 days. The knockout efficiency was confirmed by immunoblotting for p53 protein.
4.25. Cox Regression and Forest Plot Analysis
Survival analysis was performed using the Posit R platform (formerly RStudio, version 2025.05.1). Clinical and molecular data (extracted from cBioportal for LUAD and LUSC) were imported into R (version 4.5.3), and survival time and event status were defined as outcome variables. A Cox proportional hazards regression was conducted using the survival package (version 3.8.3) to estimate hazard ratios (HRs) and 95% confidence intervals (CIs) for BTNL9 expression and relevant covariates. Model assumptions were verified by testing proportional hazards with Schoenfeld residuals. Forest plots were generated using the forestplot (version 3.1.6) and ggplot2 packages (version 4.0.3) to visualize HRs across subgroups. Each plot displayed point estimates (HRs) as squares and 95% CIs as horizontal lines, with the line of unity (HR = 1) indicated for reference.
4.26. Quantification and Statistical Analysis
All experiments were carried out independently three times. Data were expressed as mean ± standard deviation (SD) and compared using Student’s t-test and two-way ANOVA. Differences with p < 0.05 were considered statistically significant (* p < 0.05, ** p < 0.01, and *** p < 0.001). Data were processed with Graph PadPrism for Windows, version 8 (Graph Pad Software Inc., San Diego, CA, USA).
4.27. Use of Artificial Intelligence Tools
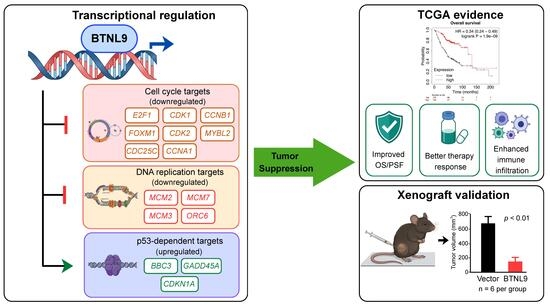
The graphical abstract was generated using ScholarViz (Nano Banana Pro;
https://scholarviz.com). AI-assisted tools were used for language refinement during manuscript preparation. All scientific content, data interpretation, and conclusions remain solely the responsibility of the authors.




 ,
,