1. Introduction
High-grade serous ovarian carcinoma (HGSOC) remains the most lethal subtype of ovarian cancer, largely owing to late diagnosis, extensive intraperitoneal dissemination, and frequent relapse after platinum-based chemotherapy [
1]. Although immune checkpoint blockade has reshaped the treatment landscape of several solid tumors, its clinical benefit in ovarian cancer has been modest and inconsistent [
2,
3,
4]. This limited efficacy suggests that the ovarian tumor microenvironment contains dominant non-T-cell-intrinsic barriers that restrict effective antitumor immunity [
4,
5].
As a dominant stromal cell population in HGSOC, CAFs orchestrate microenvironmental remodeling by coordinating extracellular matrix organization, myofibroblastic activation, paracrine signaling, and metabolic adaptation [
6]. In particular, myofibroblastic CAF and collagen-rich matrix-remodeling CAF states can generate a dense fibrotic stroma, which not only increases tissue stiffness but also alters nutrient and oxygen availability [
7,
8]. Such stromal remodeling may establish a hypoxic and glycolytic niche, thereby shaping immune cell localization and function [
9,
10]. However, how CAF-associated matrix remodeling and metabolic stress are integrated into immune exclusion and T-cell exhaustion in HGSOC remains incompletely defined.
Immune evasion in ovarian cancer is not restricted to the absence of cytotoxic lymphocytes. Tumors may occupy different immune states, from immune-desert lesions to stromal-excluded tumors and immune-infiltrated tumors with exhaustion-prone T-cell dysfunction [
11,
12]. Immune-excluded tumors are characterized by CD8
+ T cells that remain spatially confined to stromal regions, with limited access to tumor nests. Conversely, in immune-infiltrated tumors, chronic antigen exposure, hypoxia, lactate accumulation, and immunosuppressive stromal signaling may promote exhaustion-related transcriptional programs [
13,
14]. Hypoxia can reinforce T-cell exhaustion by inducing mitochondrial stress under chronic stimulation [
13]. Hypoxia- and glycolysis-induced lactic acid metabolism impairs T/NK-cell activation and tumor immune surveillance [
15]. Thus, a stromal program capable of both restricting T-cell entry and impairing T-cell function could represent a key barrier to effective antitumor immunity.
Mitochondrial and metabolic adaptations in CAFs represent an emerging stromal feature that may support persistent fibroblast activation and matrix remodeling [
16,
17,
18]. CAFs and activated fibroblasts can undergo mitochondrial and bioenergetic remodeling in response to TGFβ signaling, hypoxia, and mechanical cues from the extracellular matrix, thereby supporting myofibroblastic activation and persistent ECM remodeling [
19,
20]. Nevertheless, most existing stromal signatures focus primarily on fibroblast abundance or ECM genes, without capturing the combined contribution of contractile activation, matrix remodeling, and mitochondrial metabolic adaptation. A composite signature integrating these features may better reflect the functional stromal state that drives immune remodeling in HGSOC.
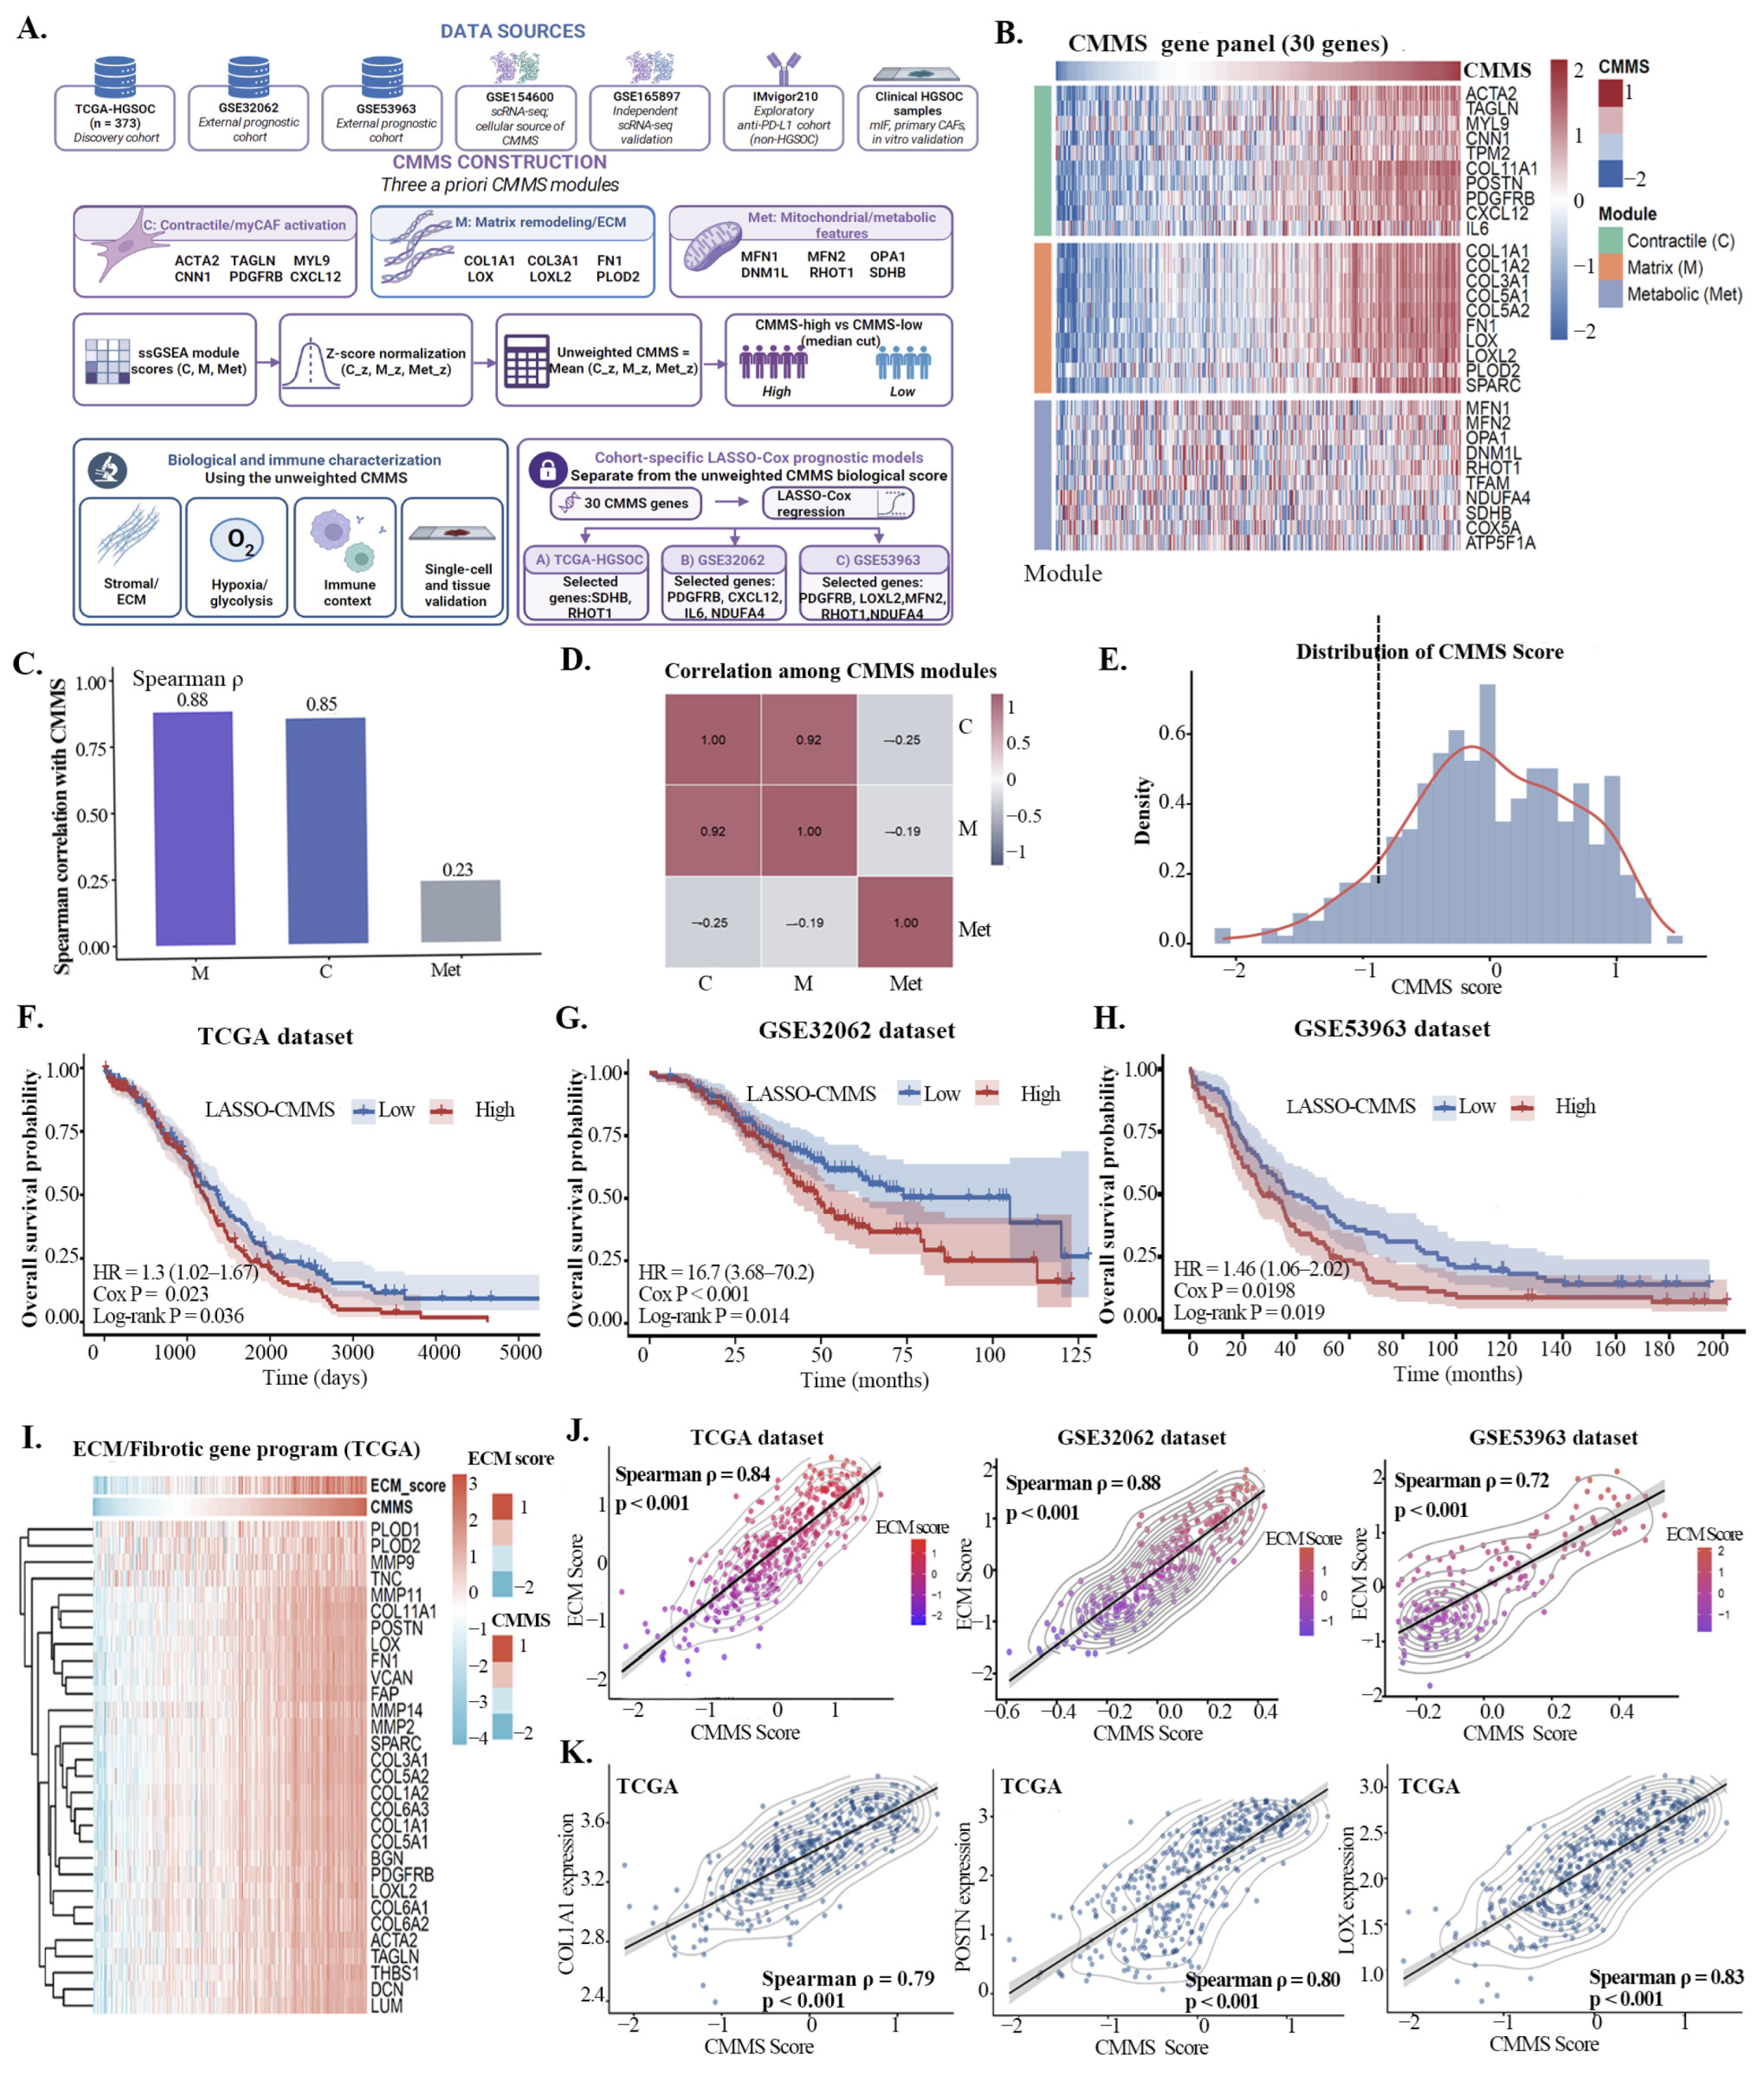
Here, we sought to determine whether an integrated CAF-associated stromal-metabolic signature could identify the fibrotic and immune-suppressive microenvironmental state underlying poor prognosis and immunotherapy resistance in HGSOC. In this study, we developed a CAF-associated stromal remodeling signature, termed CMMS, by integrating genes related to contractile/myCAF activation, ECM-remodeling, and fibroblast mitochondrial/metabolic features. Across TCGA-HGSOC and independent GEO cohorts, we explored whether CMMS delineates a poor-prognosis stromal state characterized by fibrotic remodeling, hypoxic–glycolytic stress, immune exclusion, and exhaustion-prone T-cell dysfunction. Single-cell transcriptomic analyses further defined the cellular origin of CMMS and resolved CMMS-high CAF states at single-cell resolution. Together, CMMS captures a CAF–ECM-remodeling-driven fibro-hypoxic-glycolytic program. This program primarily shapes immune exclusion through TGFβ-associated stromal barriers, while in the subset of T-cell-inflamed tumors, CMMS is also linked to T-cell phenotypes that exhibit heightened exhaustion, together contributing to immunotherapy resistance and poor prognosis.
3. Discussion
This study identifies CMMS as a CAF-enriched stromal remodeling program associated with poor prognosis and impaired antitumor immunity in HGSOC. Unlike conventional stromal scores that mainly reflect fibroblast abundance or ECM gene expression, CMMS integrates contractile CAF activation, matrix remodeling, and mitochondrial metabolic adaptation. Our analyses across bulk and single-cell cohorts suggest that CMMS-high tumors represent a fibrotic and hypoxia-associated stromal phenotype accompanied by an unfavorable immune context, rather than a simple high-stroma phenotype. This concept is consistent with previous studies showing that TGFβ-activated fibroblastic stroma and cancer-associated ECM programs can favor immune escape and substantially curtail clinical responses to anti-PD-1/PD-L1 treatment [
21,
22,
23].
CAFs comprise diverse functional subtypes, including myCAF, iCAF and antigen-presenting CAF states [
24,
25]. The dominant biological axis of CMMS was contractile–ECM remodeling. The contractile/myCAF and matrix-remodeling modules were tightly coupled, whereas the mitochondrial/metabolic module showed a relatively distinct and weaker association with the composite CMMS phenotype. These findings indicate that CMMS should be interpreted as a composite CAF-associated stromal state, in which myofibroblast activation and ECM remodeling form the structural backbone, while mitochondrial/metabolic features capture additional CAF-state heterogeneity rather than constituting an independent dominant axis. This ECM-dominant interpretation was supported by the strong association of CMMS with ECM scores and matrix-remodeling genes across independent cohorts, as well as by overlap-controlled and leave-one-module-out analyses. Biologically, this interpretation is consistent with prior evidence that collagen density and matrix organization can shape tumor-infiltrating T-cell activity and spatial accessibility [
7].
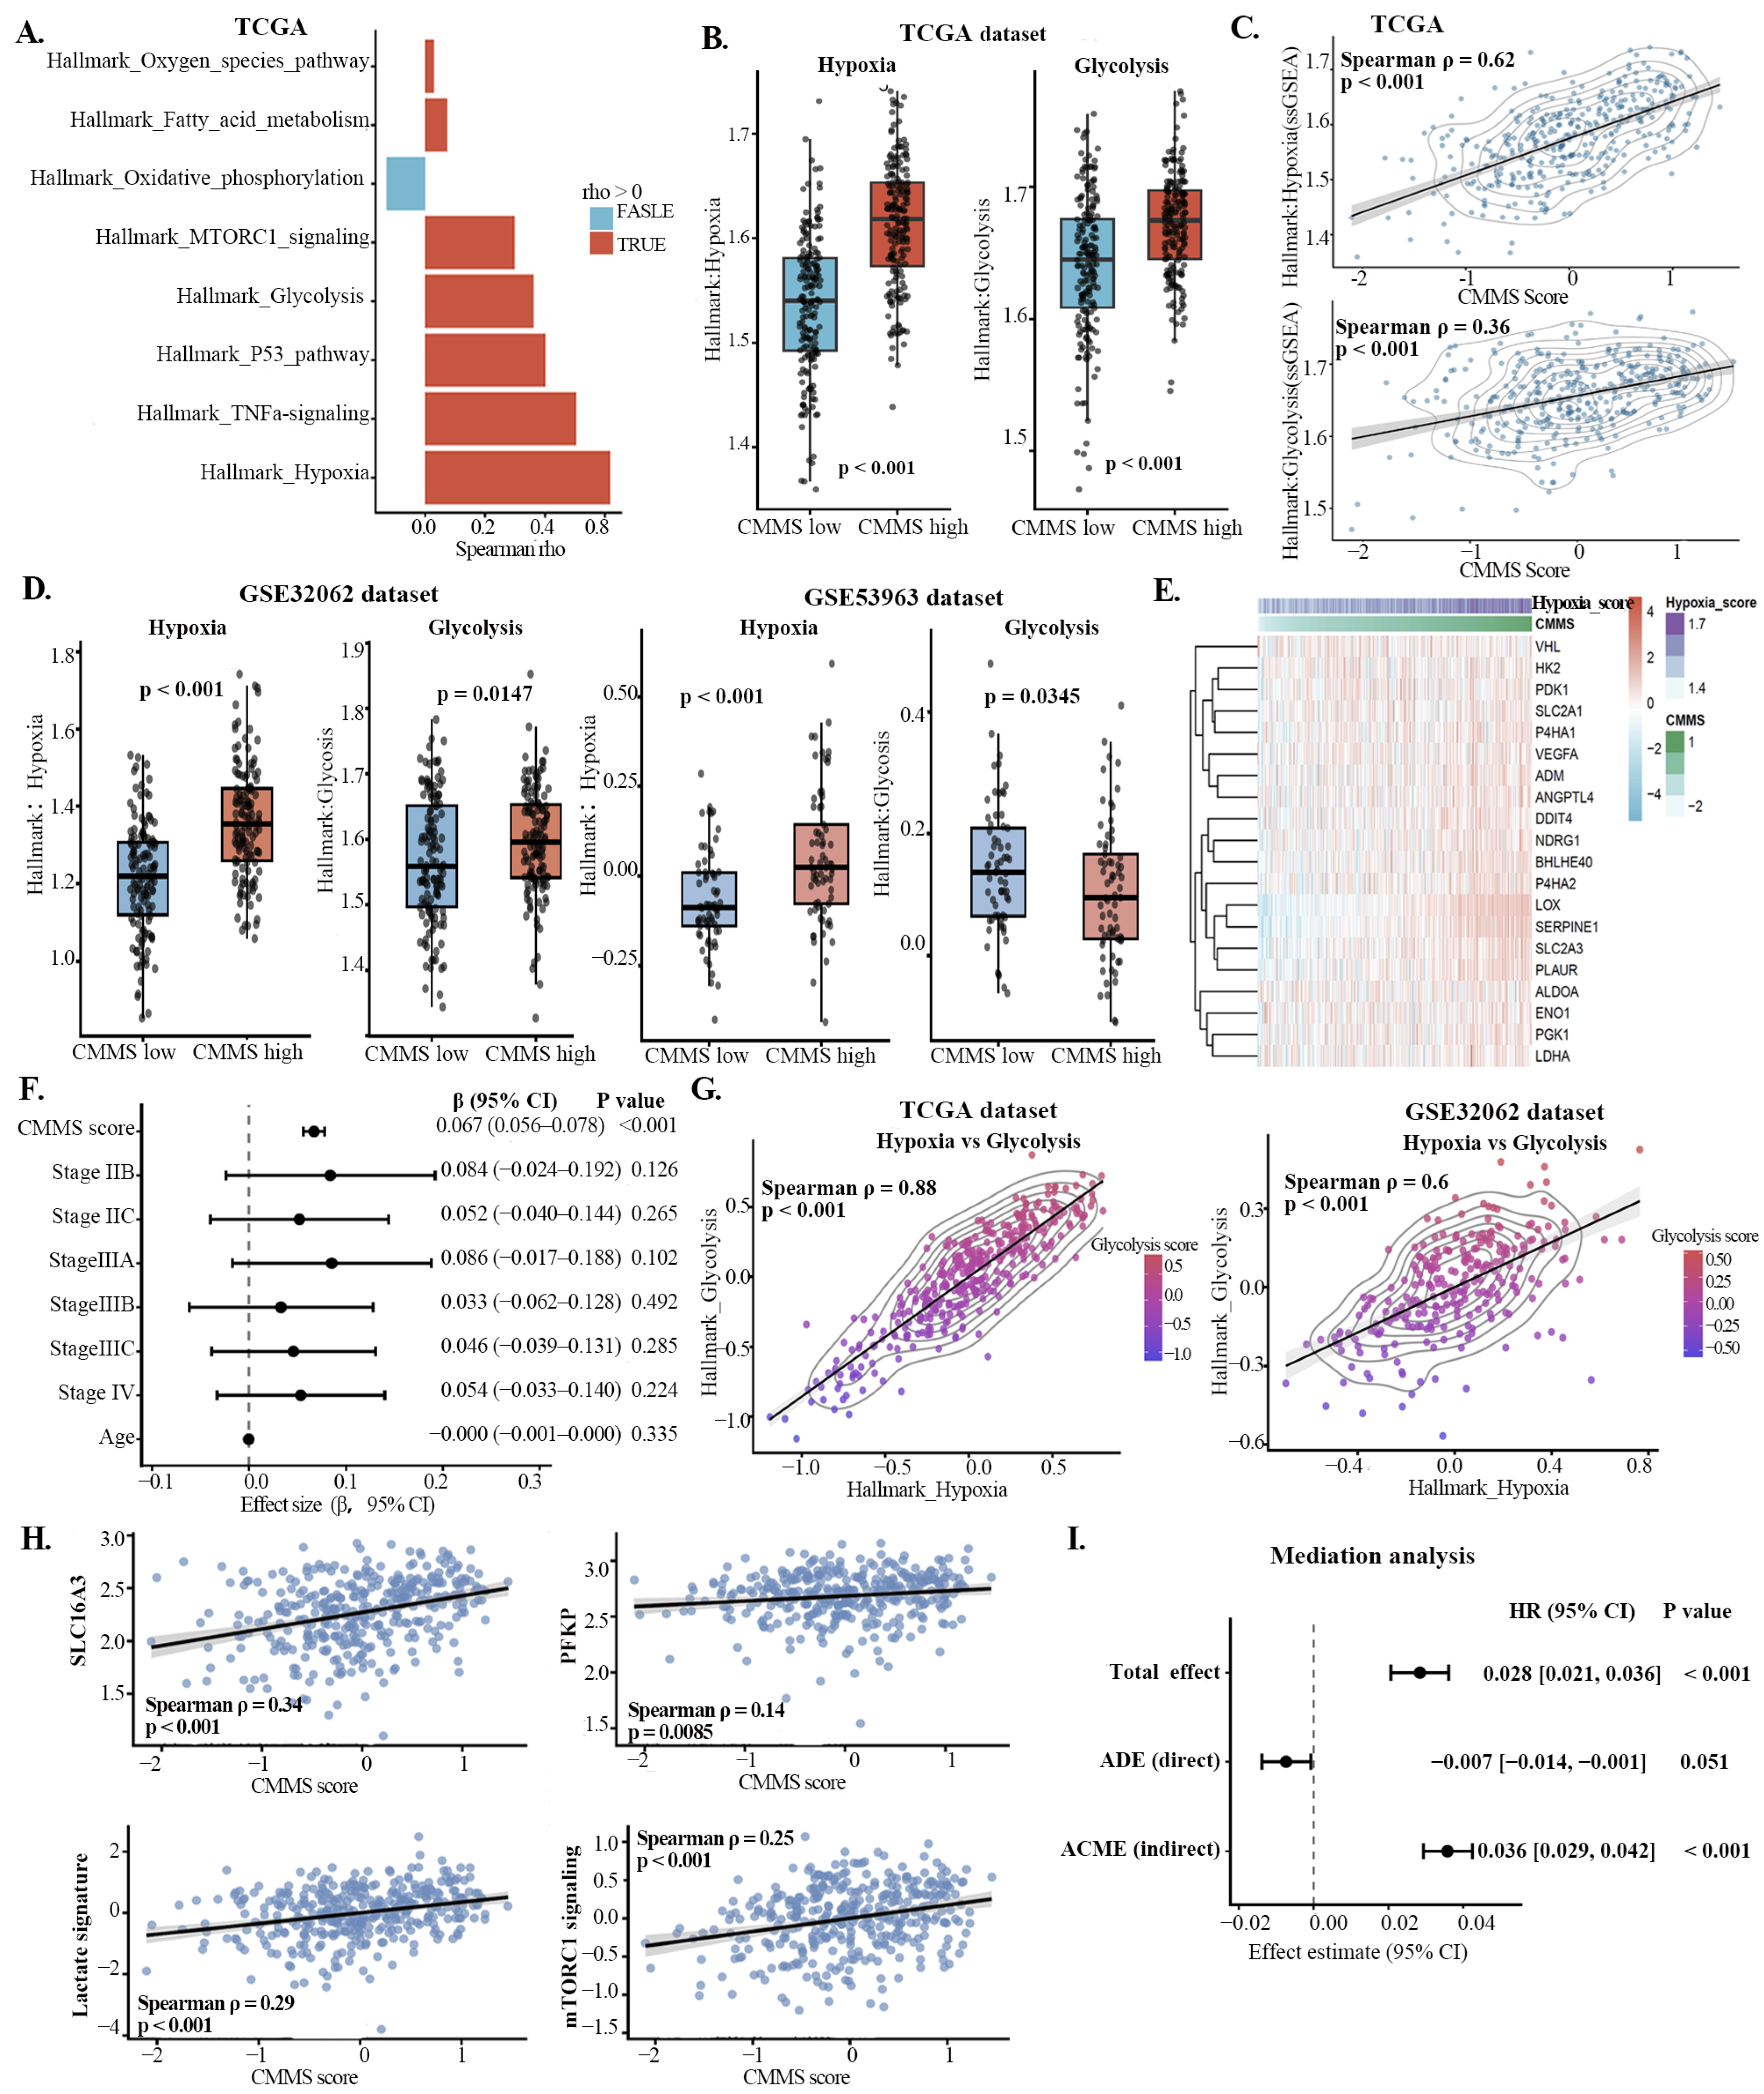
A key finding is the link between CMMS and hypoxia-centered metabolic remodeling. Hypoxia was the hallmark pathway most strongly associated with CMMS, and mediation analysis suggested that hypoxia largely accounted for the relationship between CMMS and glycolysis. Single-cell analysis further showed that the hypoxia and glycolysis programs were enriched in stromal-related compartments, supporting a multicellular stromal contribution to the metabolic phenotype observed in bulk tumors. Thus, glycolytic reprogramming in CMMS-high tumors may arise from stromal remodeling-induced hypoxic stress rather than from a purely tumor cell-intrinsic metabolic shift. This interpretation is biologically plausible, as hypoxia and metabolic stress have been shown to reinforce exhaustion-related T-cell states, while lactate-rich and metabolically competitive tumor microenvironments can blunt T- and NK-cell function [
13,
15,
26].
CAFs and the stromal matrix have been implicated in T-cell exclusion and resistance to immunotherapy [
27,
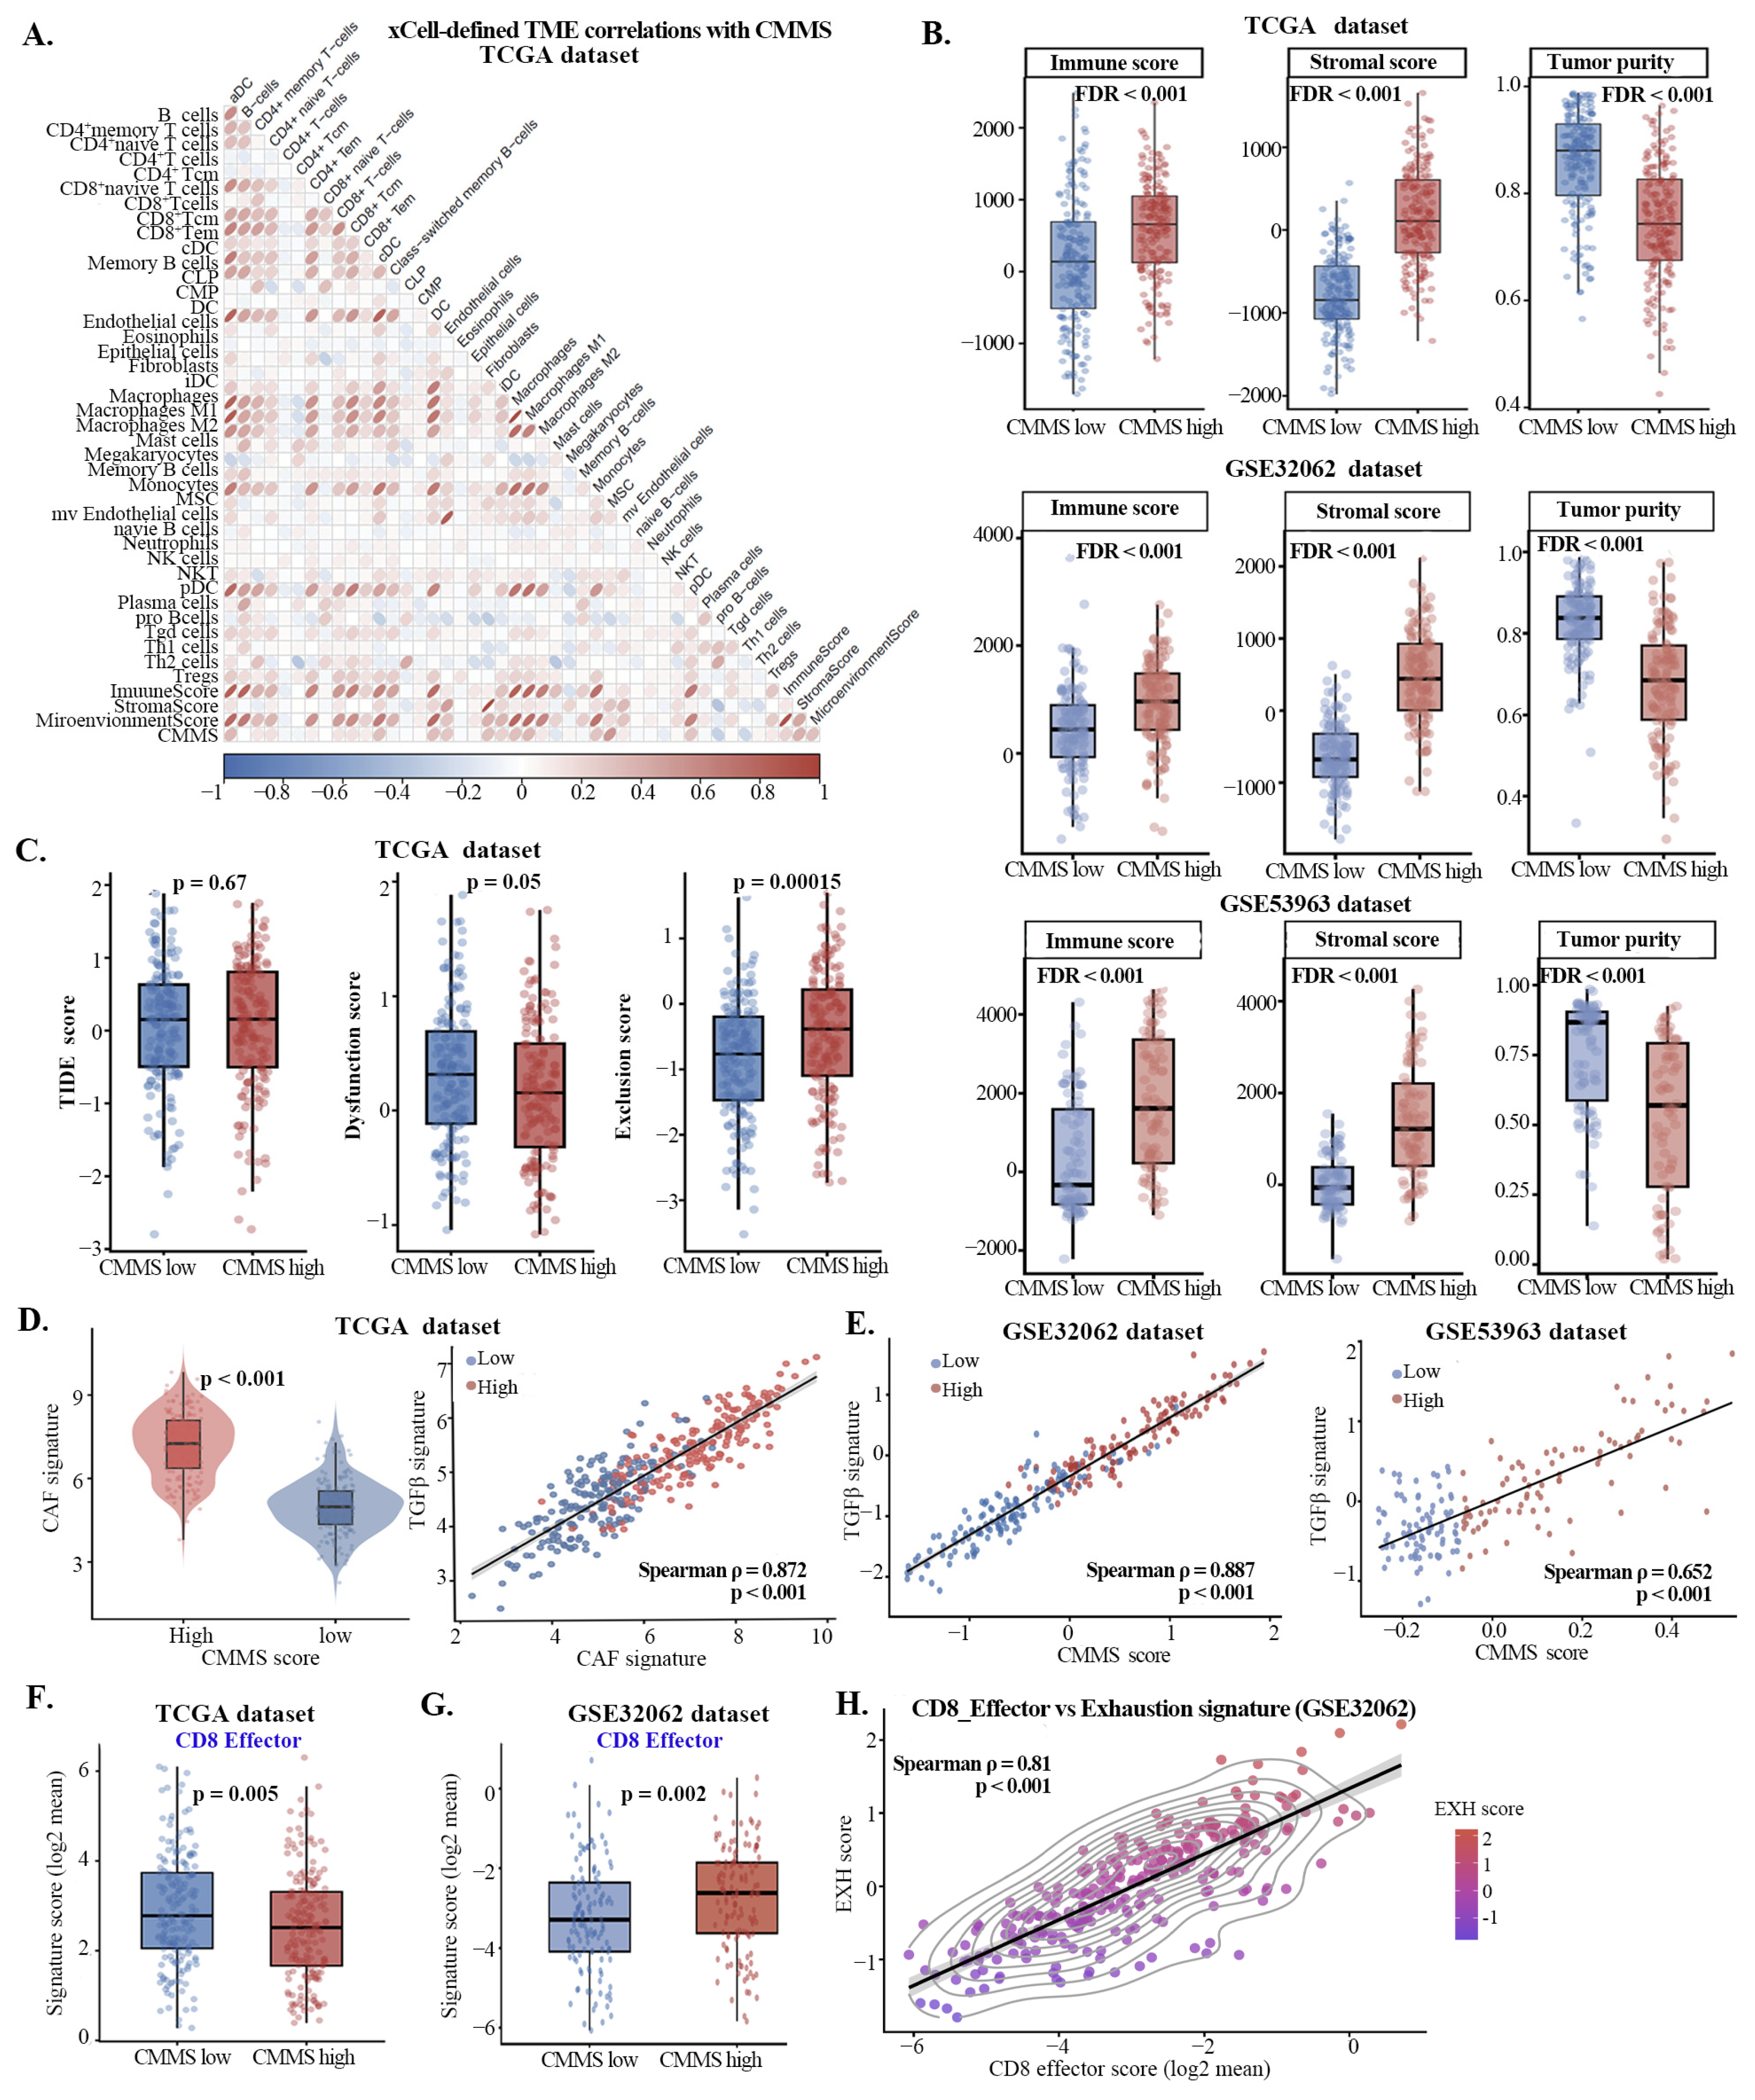
28]. CMMS was also closely connected to immune remodeling. CMMS-high tumors showed increased immune and stromal scores but reduced tumor purity, indicating that they were not simply immune-desert tumors. Instead, CMMS was preferentially associated with TIDE-derived immune exclusion-associated phenotype and a conserved CAF/TGFβ axis. This aligns with the TIDE framework, which models immune escape through two major mechanisms: T-cell dysfunction in infiltrated tumors and T-cell exclusion in tumors with impaired T-cell infiltration [
29]. TGFβ signaling in stromal cells has been shown to restrict T-cell penetration and attenuate the response to PD-L1 blockade [
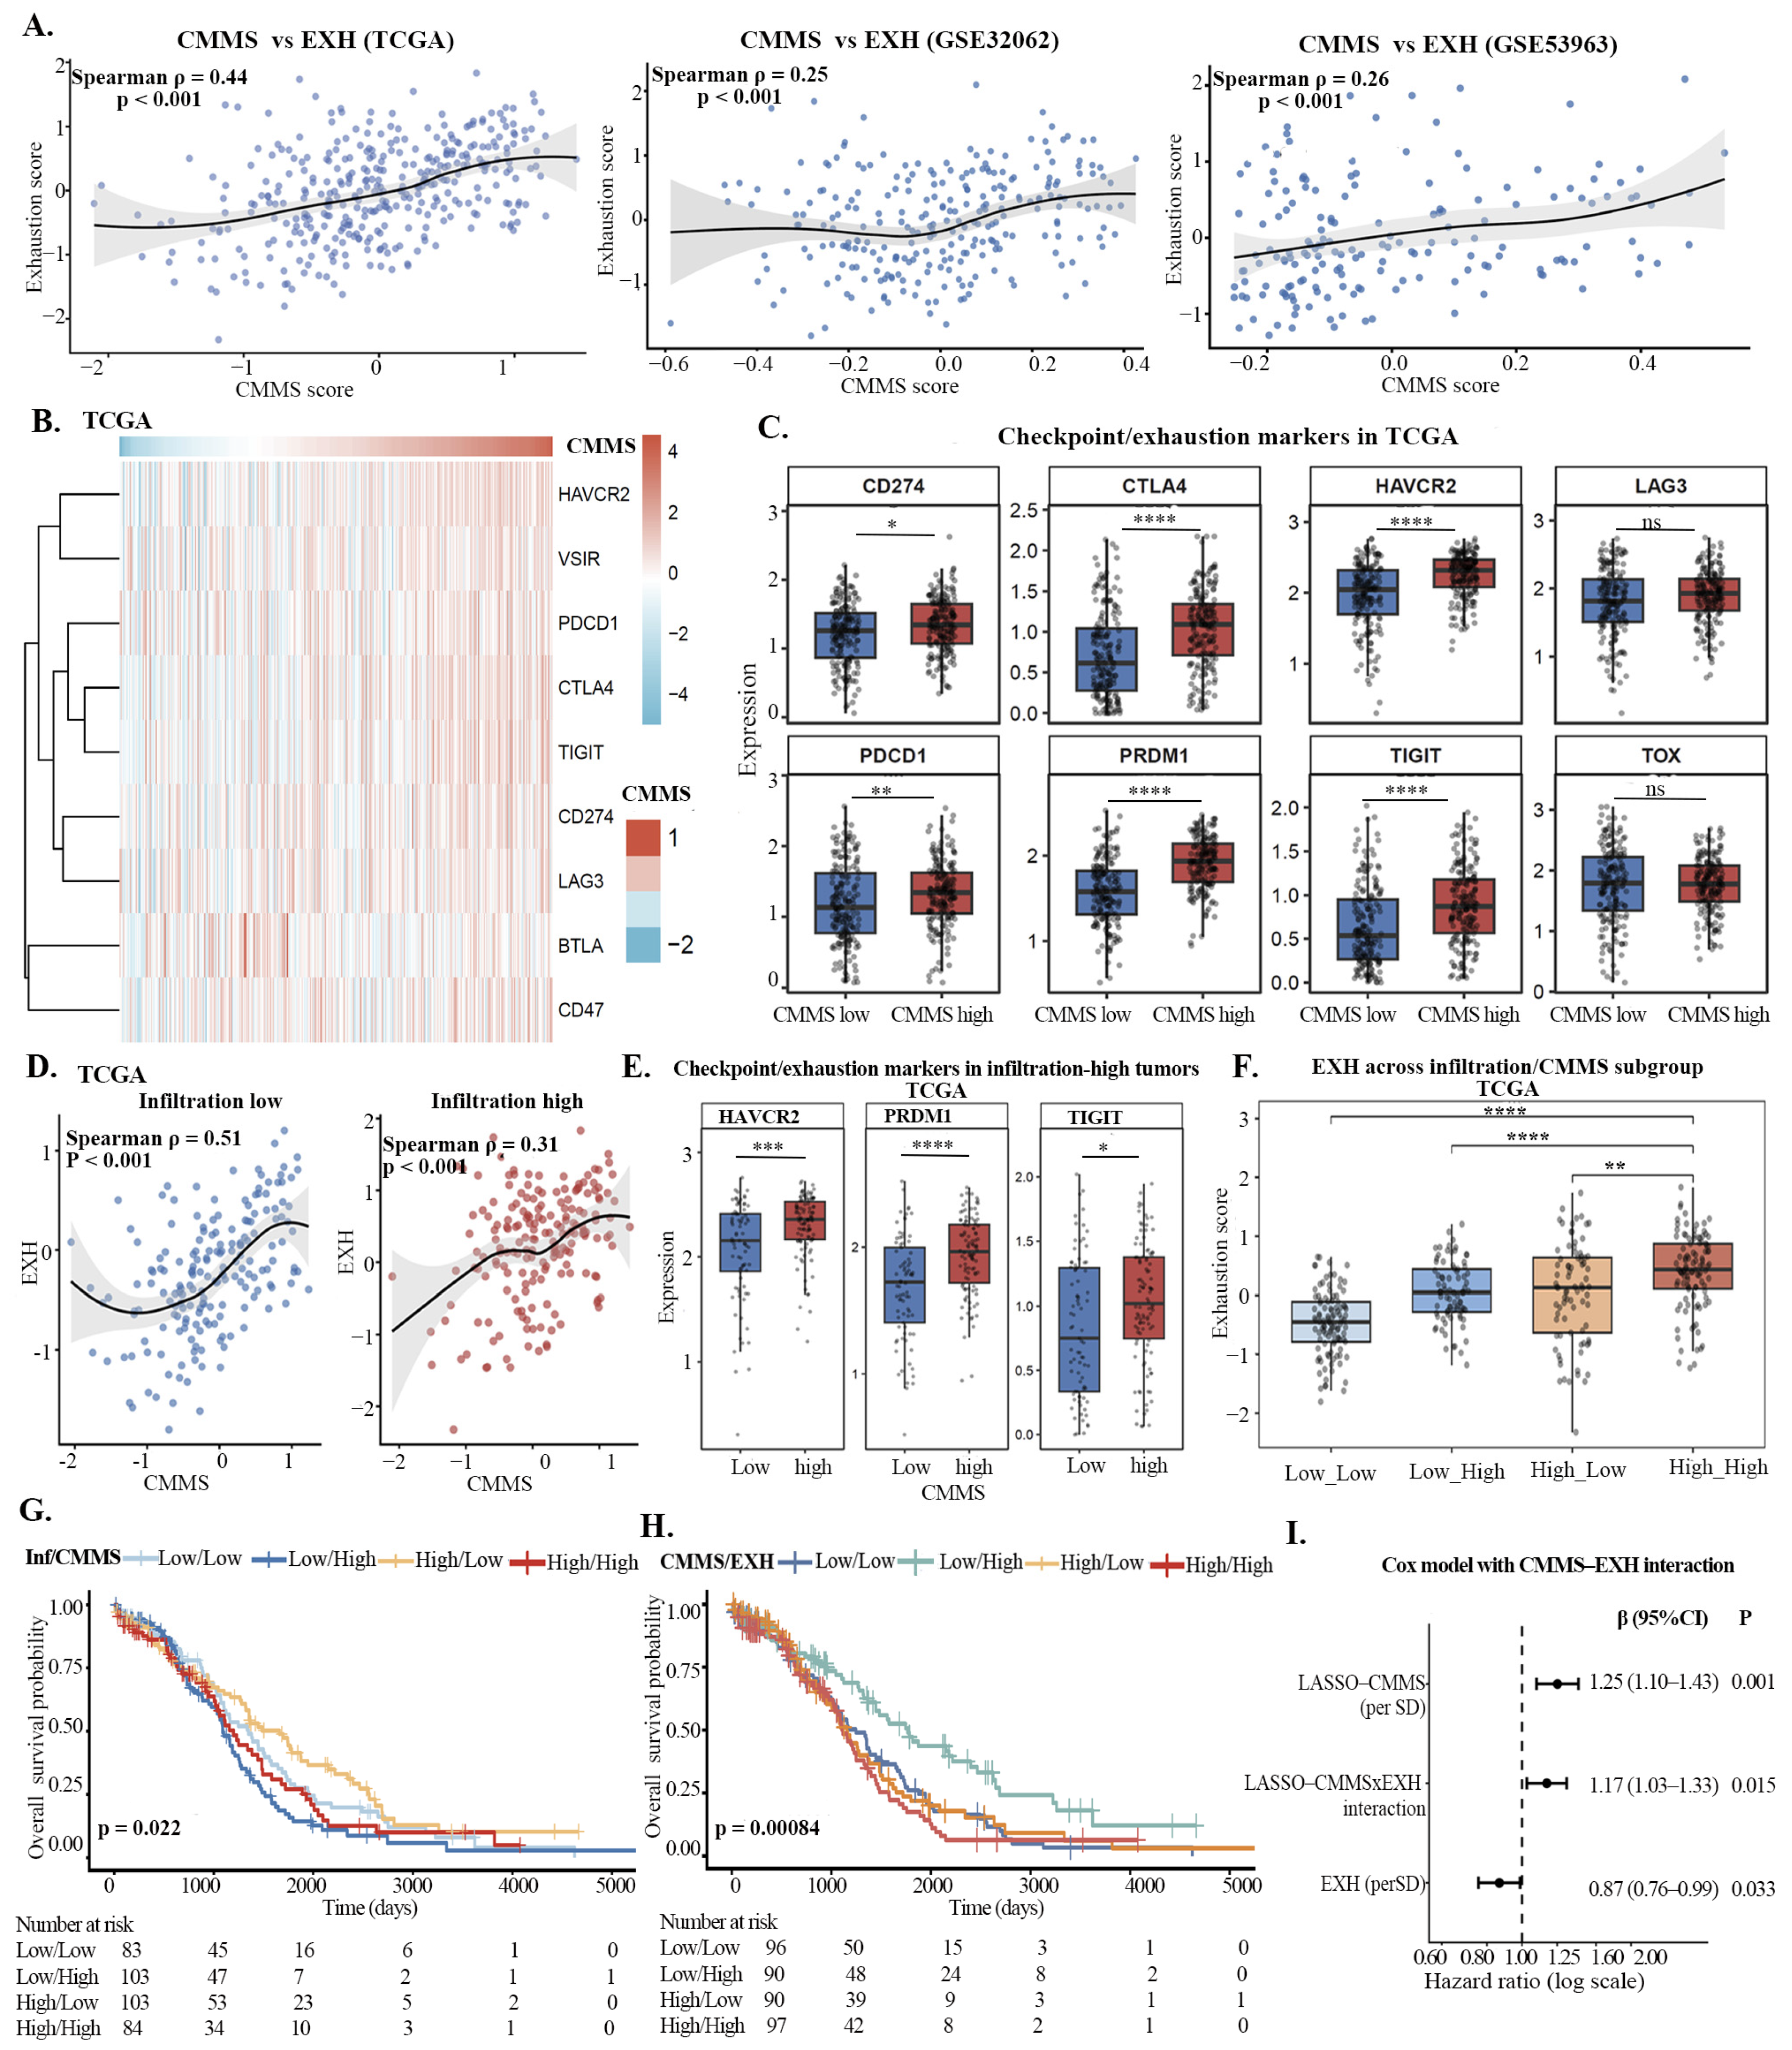
21]. These findings suggest that CMMS-high tumors may establish a stromal barrier that limits productive T-cell access. In parallel, CMMS was linked to exhaustion-related immune dysfunction. CD8 effector signals were not uniformly depleted; however, when present, they were strongly coupled with exhaustion signatures. This supports a dual model in which CMMS-high tumors suppress antitumor immunity through both the stromal immune exclusion-associated phenotype and exhaustion-prone dysfunction in infiltrated tumors. This interpretation is consistent with the current view that exhaustion is a coordinated transcriptional and functional state rather than the expression of any single inhibitory receptor. It is also compatible with HGSOC-specific evidence showing that exhausted CD8
+ T-cell states may retain cytotoxic features in certain spatial contexts [
30].
Several CAF- or stroma-related prognostic signatures have been reported in ovarian cancer. For example, a POSTN/TGFBI-associated stromal signature was previously shown to predict poor prognosis in serous epithelial ovarian cancer, supporting the clinical relevance of ECM-rich stromal programs. Subsequent studies further linked distinct CAF functional states, fibroblast modules, and CAF-associated paracrine signaling to ovarian cancer prognosis, immune microenvironment remodeling, and therapy response [
31,
32]. More recently, integrative single-cell and bulk transcriptomic analyses have generated CAF-related indices for predicting prognosis and immune contexture in ovarian cancer. Compared with these studies, CMMS provides a biologically interpretable framework that integrates contractile/myCAF activation, ECM-remodeling, and mitochondrial/metabolic CAF-state features. Importantly, our module-level analyses indicate that the dominant biological axis of CMMS is contractile–ECM remodeling, whereas the mitochondrial/metabolic component captures additional CAF-state heterogeneity rather than an independent dominant axis. Thus, CMMS should be considered an ECM/myCAF-dominant stromal remodeling signature that complements, rather than replaces, previously reported CAF or fibrosis-related prognostic signatures.
The clinical relevance of this immune remodeling was supported by survival analyses. The original CMMS score showed limited prognostic value, suggesting that equal weighting of its components may dilute its biological impact. In contrast, the LASSO-derived model assigns differential weights, improving prognostic performance. Moreover, the prognostic impact of immune infiltration and exhaustion appeared to depend on CMMS status. Higher levels of immune infiltration predicted better survival outcomes mainly under low CMMS conditions, whereas CMMS-high tumors showed poor outcomes despite immune infiltration. The significant CMMS–EXH interaction further suggests that CMMS modifies the clinical meaning of exhaustion-related immune signals, potentially converting immune activation into a dysfunctional and unfavorable state.
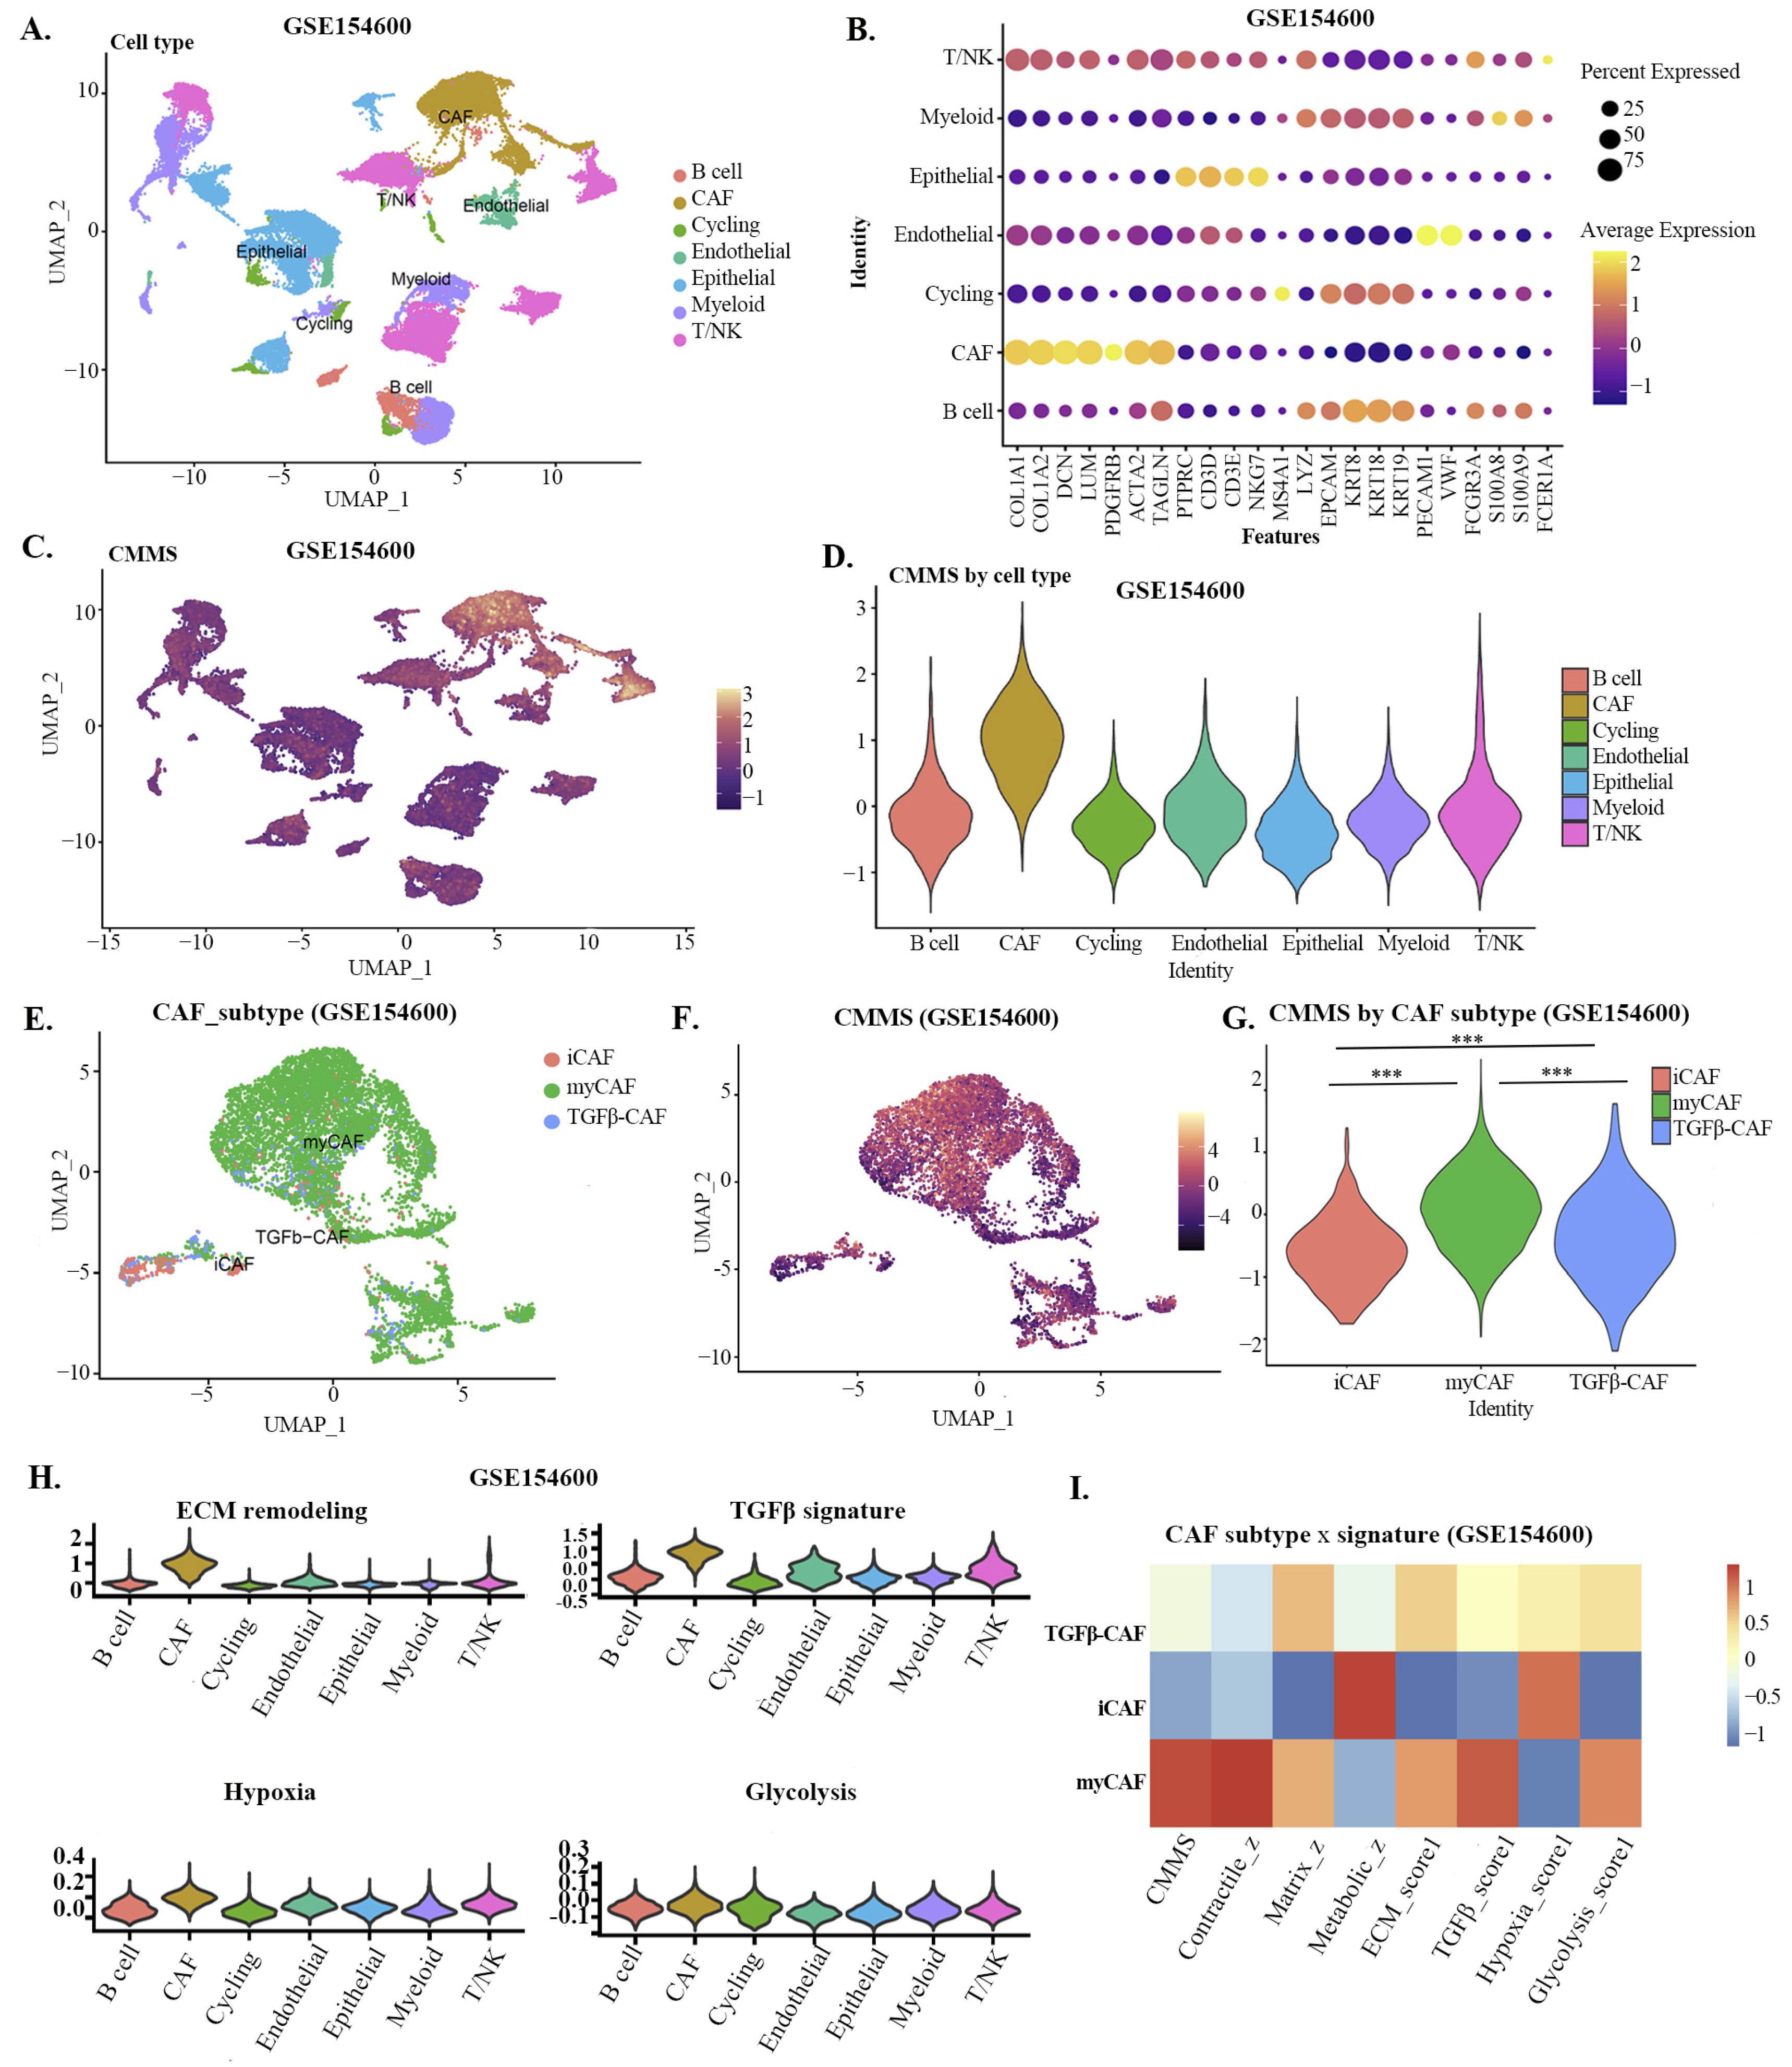
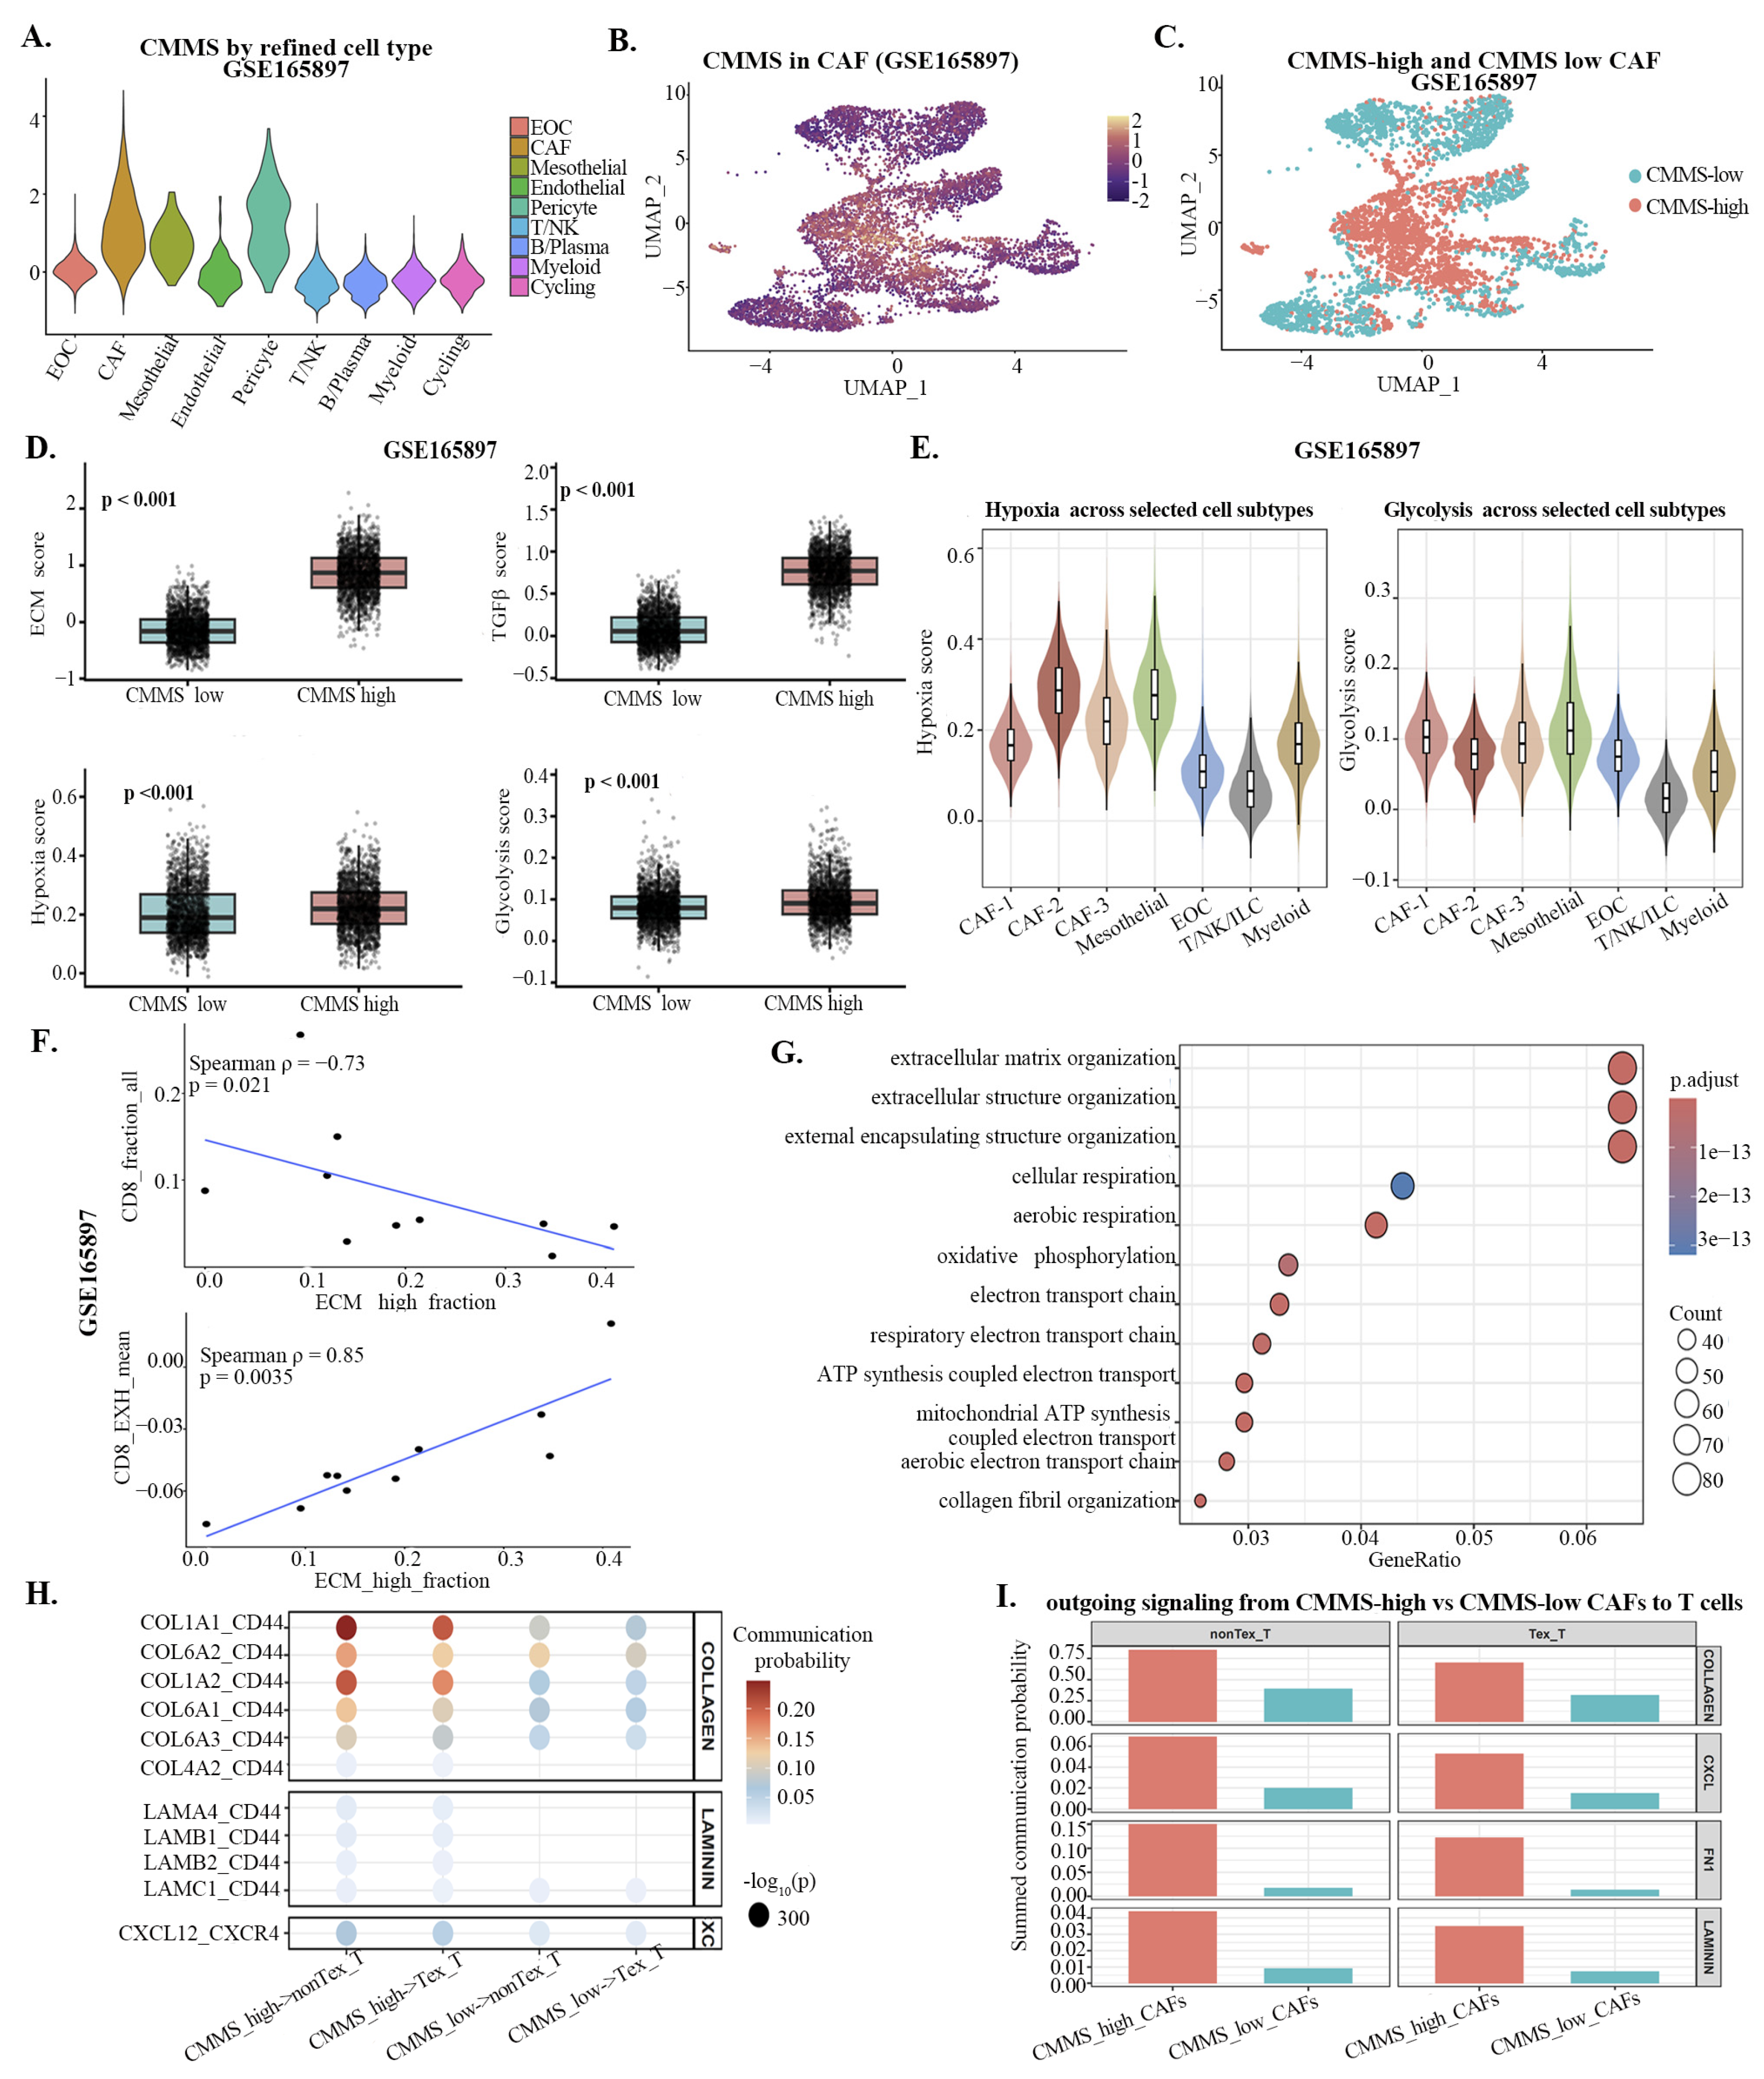
Single-cell validation localized CMMS activity predominantly to CAFs, especially myCAF-like subsets with contractile, ECM-remodeling, and TGFβ-related programs. In the independent GSE165897 cohort, CMMS-high CAFs retained ECM/TGFβ activation and were associated with reduced CD8 abundance and increased CD8 exhaustion at the sample level. Cell–cell communication analysis further suggested enhanced matrix- and chemokine-related signaling from CMMS-high CAFs toward T-cell subsets, including COLLAGEN, FN1, LAMININ, and CXCL pathways. The CXCL-related component is particularly relevant given previous evidence that CAF-derived CXCL12 can mediate T-cell exclusion and limit anti-PD-L1 efficacy [
33]. These results provide cellular support for the stromal–immune model inferred from bulk transcriptomes.
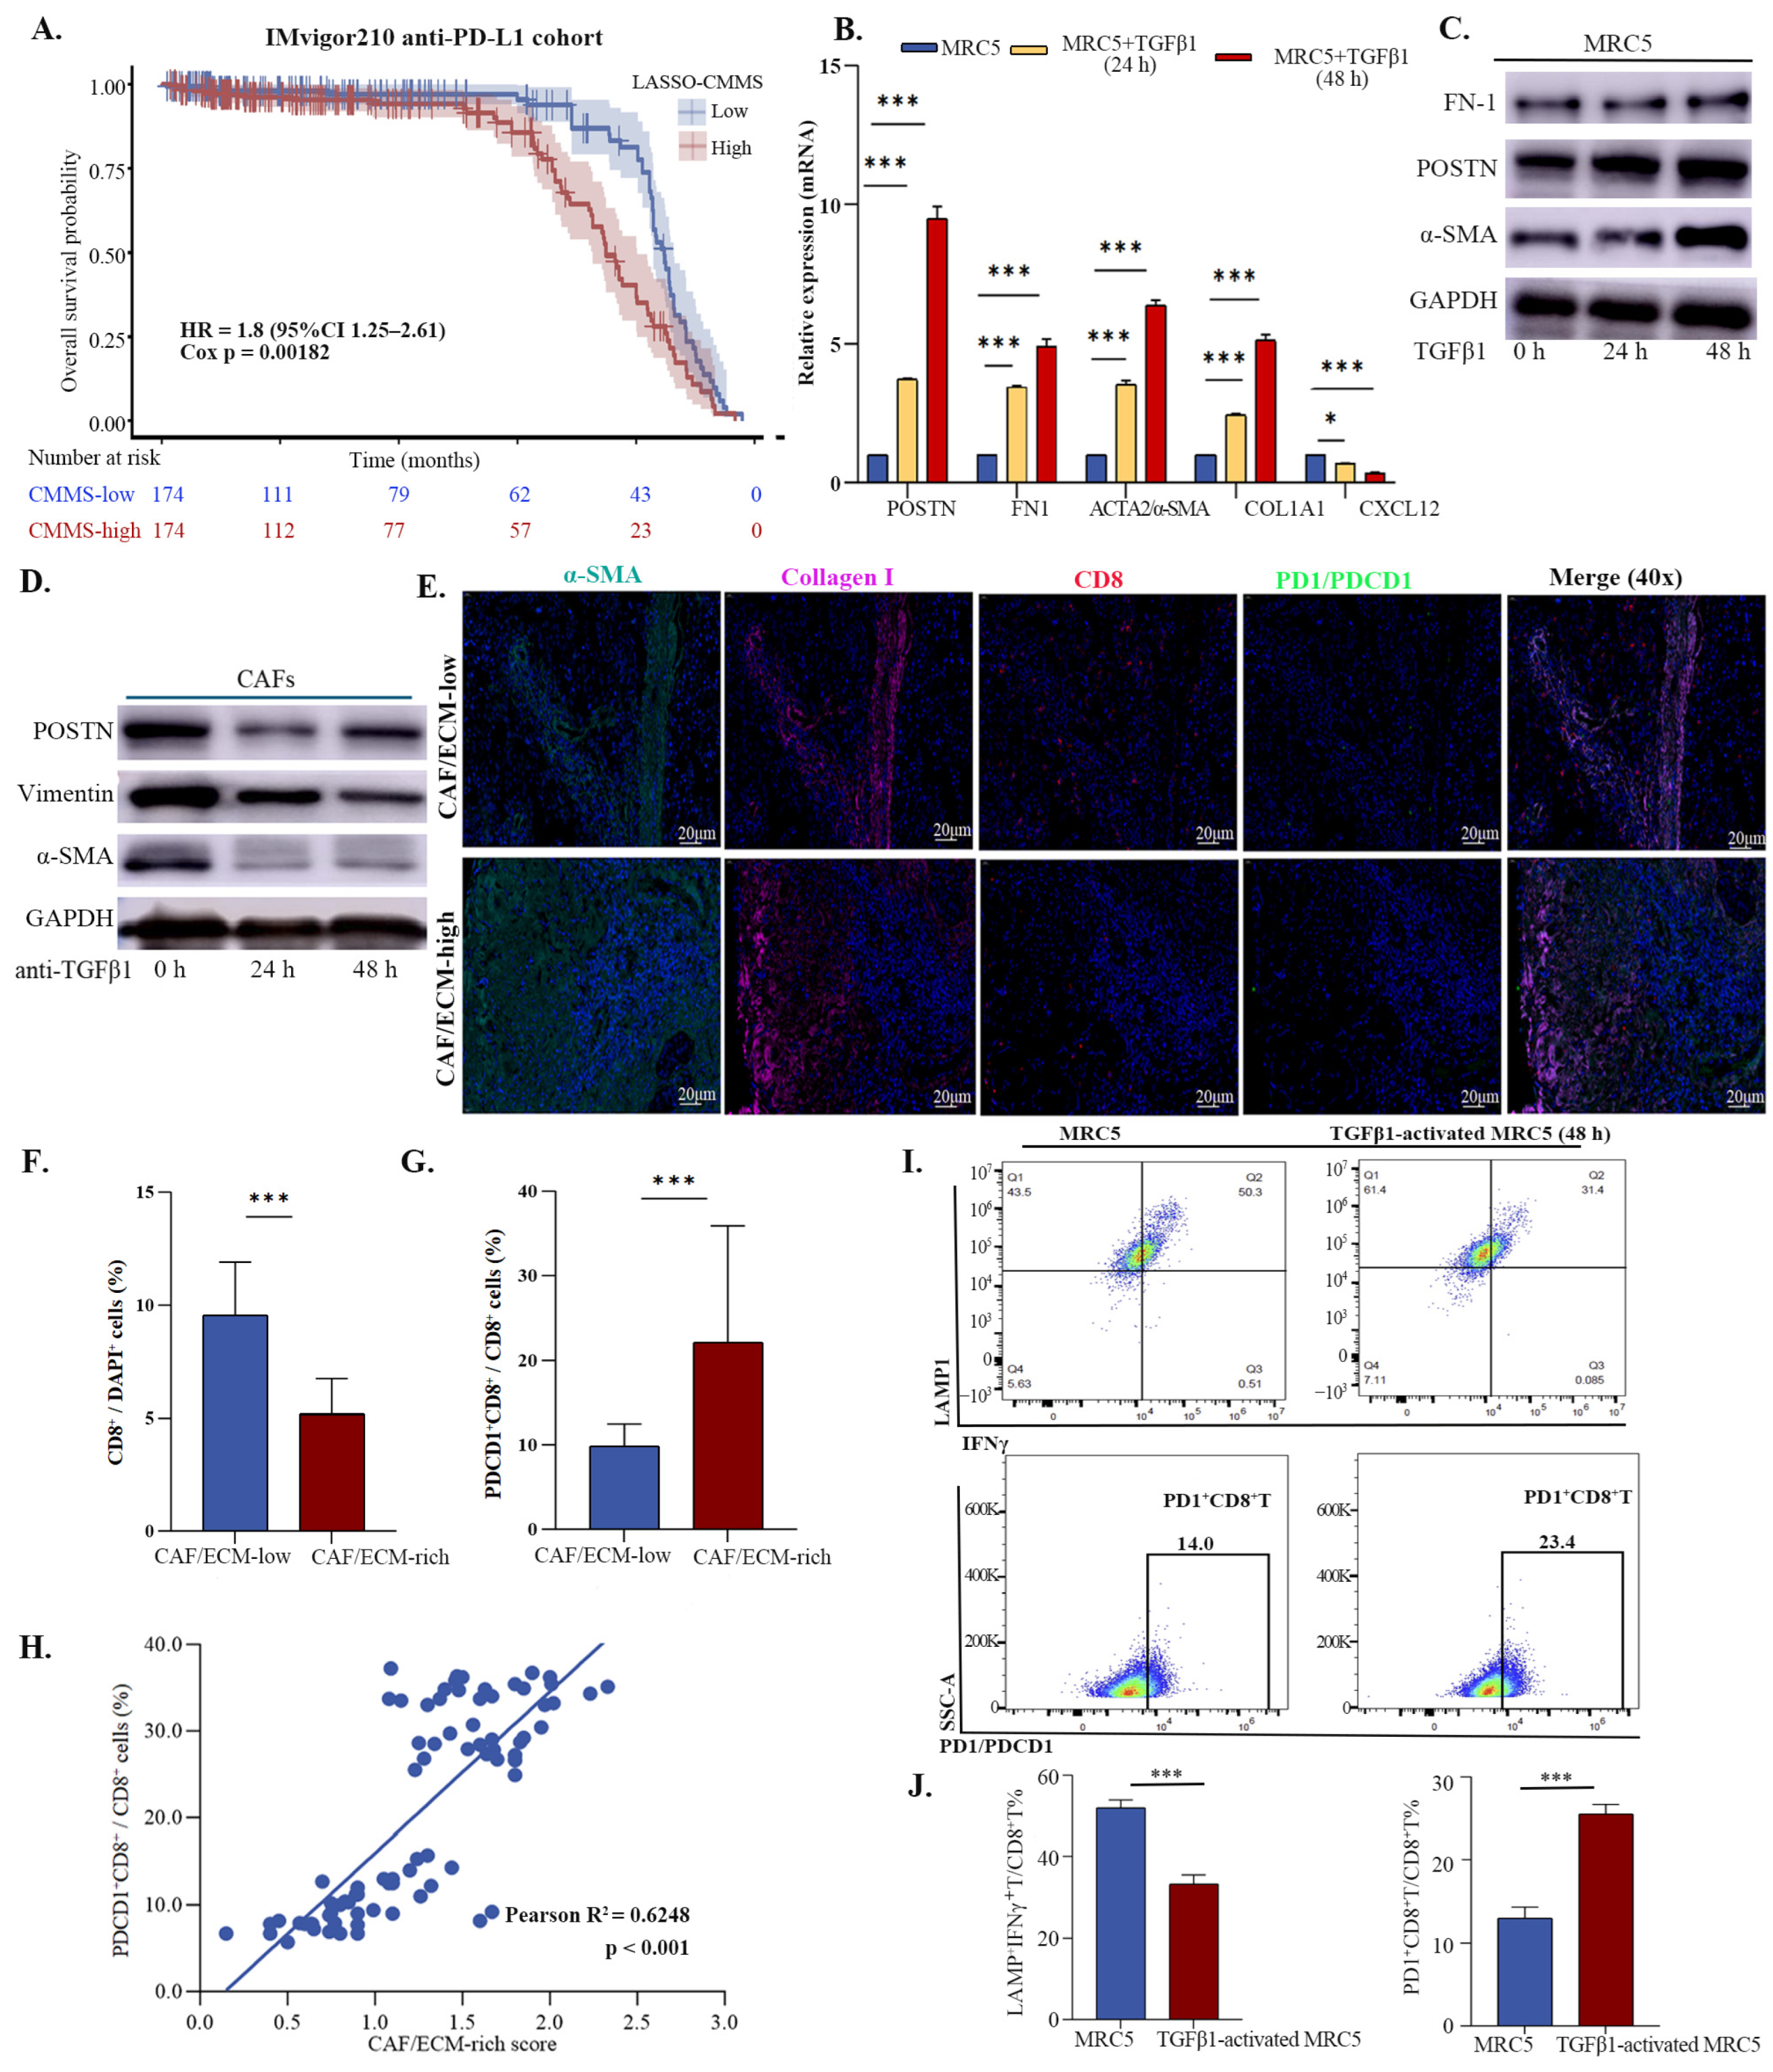
Importantly, our experimental validation further supported the spatial and functional relevance of the CMMS model. Multiplex immunofluorescence showed that α-SMA
+/COL1A1
+ stromal regions were associated with spatial restriction of CD8
+ T cells and increased exhaustion marker expression among CD8
+ cells. TGFβ has been shown to induce CAF-associated programs in advanced high-grade serous ovarian tumors [
34]. In vitro, TGFβ-activated fibroblasts acquired a CMMS-like contractile and matrix-remodeling phenotype and were associated with exhaustion-related marker expression in CD8
+ T cells. These experimental findings strengthen the link between CMMS-like CAF activation, stromal immune exclusion, and exhaustion-prone T-cell dysfunction.
The exploratory IMvigor210 analysis suggests that CMMS-associated stromal remodeling may also be relevant to immunotherapy resistance, as high LASSO-weighted CMMS was associated with an inferior outcome after anti-PD-L1 therapy. This observation is consistent with the original IMvigor210-based analysis showing that TGFβ activity in fibroblastic stroma was associated with T-cell exclusion and lack of response to anti-PD-L1 therapy [
21]. Although this finding requires cautious interpretation because IMvigor210 is not an ovarian cancer cohort, it is consistent with the concept that stromal exclusion and TGFβ-rich microenvironments can limit checkpoint blockade efficacy. Therapeutically, CMMS-high tumors may require stromal remodeling strategies, such as targeting TGFβ signaling, ECM organization, LOX-mediated matrix stiffening, CXCL12-CXCR4 signaling, or hypoxia/lactate-associated metabolic stress, in combination with chemotherapy or immune checkpoint blockade. However, targeting CAF-associated stromal remodeling remains challenging. CAFs are highly heterogeneous, and some fibroblast populations may exert tumor-restraining functions depending on the context. Broad depletion of CAFs or nonspecific suppression of stromal programs may therefore produce unintended effects. In addition, ECM remodeling is spatially heterogeneous and may require biomarker-guided patient stratification. Thus, CMMS may help identify tumors with ECM/myCAF-dominant stromal remodeling, but its therapeutic utility will require prospective validation and functional testing in ovarian cancer-specific models.
A limitation of our immune-exclusion analysis is that bulk RNA-seq deconvolution and TIDE-based exclusion scores cannot directly demonstrate spatial exclusion of immune cells from tumor nests. Although our integrative analyses link CMMS to stromal remodeling, immune exclusion-related programs, and exhaustion-prone CD8+ T-cell states, these findings should not be interpreted as definitive evidence that CMMS-high CAFs directly cause immune exclusion-associated phenotype or checkpoint resistance. Bulk transcriptomic deconvolution, module scoring, single-cell correlation analyses, and mediation-type models are inherently associative. Our in vitro assays provide functional support that activated fibroblasts can impair CD8+ T-cell effector activity, but they do not fully recapitulate the spatial and cellular complexity of HGSOC tissues. Future studies using spatially resolved perturbation models, CAF-specific genetic manipulation, and in vivo immune-competent systems will be required to determine whether CMMS-associated CAF programs directly regulate CD8+ T-cell exclusion, dysfunction, or therapeutic resistance.
Because CMMS reflects stromal and ECM-enriched transcriptional programs, its associations with prognosis and immune features may be influenced by tumor purity, stromal content, and differences in tissue composition. Although we performed tumor-purity-adjusted analyses in TCGA-HGSOC where possible, residual confounding cannot be excluded.
Although single-cell data identified CMMS-high CAF states, direct spatial and functional validations remain necessary. Recent spatial studies in HGSOC further emphasize that the stromal and immune compartments are organized into distinct spatial niches, reinforcing the need for tissue-level validation of the CMMS-associated immune exclusion-associated phenotype [
35]. In addition, the IMvigor210 analysis should be viewed as exploratory because it was performed in a non-ovarian anti-PD-L1-treated cohort. Future multiplex immunofluorescence, spatial profiling, and CAF–T-cell functional assays will be important to validate whether CMMS-like CAFs directly contribute to the immune exclusion-associated phenotype and T-cell exhaustion.
Despite the wide usage of TGFβ1-stimulated MRC-5 cells for modeling fibroblast activation, this cell line fails to recapitulate the heterogeneous landscape of primary HGSOC CAFs. Although primary ovarian CAFs confer higher clinical authenticity to our experiments, patient-matched CAF perturbation analyses are still required to uncover the functional uniqueness of CMMS-high CAF phenotypes. In addition, targeted perturbation of the ECM/TGFβ/chemokine pathways and immune-competent in vivo systems will be required to establish causal mechanisms.
In summary, CMMS defines a CAF-associated stromal state linking ECM remodeling, hypoxic metabolic stress, the immune exclusion-associated phenotype, and exhaustion-prone T-cell dysfunction in HGSOC. These findings provide a conceptual framework for understanding stromal barriers to antitumor immunity and suggest that CMMS may help guide stromal-targeted immunotherapeutic strategies.
4. Materials and Methods
4.1. Data Collection and Preprocessing
Gene expression profiles and matched clinical annotations for ovarian cancer were downloaded from publicly accessible resources, including TCGA-OV and the GEO datasets GSE32062 and GSE53963. Only samples with available overall survival information were retained for prognostic analyses. For TCGA-OV, cases annotated as serous ovarian carcinoma were used to represent the HGSOC cohort. Gene expression profiles were processed at the gene-symbol level. For RNA-seq data, expression values were log-transformed after normalization. In microarray datasets, platform-specific annotation files were used to match probe identifiers to gene symbols. When several probes corresponded to the same gene, the probe showing the greatest average expression was used for downstream analysis.
Clinical annotations, such as survival time, vital status, age, and tumor stage, were extracted when available. Sample identifiers were harmonized across expression, clinical, and immune annotation files. Genes not detected in a given cohort were excluded from cohort-specific analyses.
4.2. Construction of the CMMS Score
A CMMS (CAF–Matrix–Metabolic Signature) was constructed by integrating three biologically defined modules: a contractile/myCAF activation module (C), a matrix-remodeling/ECM module (M), and a mitochondrial/metabolic module (Met). Representative genes were selected based on their highest connectivity in the co-expression network and established literature evidence as canonical markers. The contractile/myCAF module included ACTA2, TAGLN, MYL9, CNN1, TPM2, COL11A1, POSTN, PDGFRB, CXCL12, and IL6. The matrix-remodeling/ECM module included COL1A1, COL1A2, COL3A1, COL5A1, COL5A2, FN1, LOX, LOXL2, PLOD2, and SPARC. The mitochondrial/metabolic module included MFN1, MFN2, OPA1, DNM1L, RHOT1, TFAM, NDUFA4, SDHB, COX5A, and ATP5F1A (
Table S3). Module-level activity scores were calculated for each sample, followed by z-score normalization within each cohort. The unweighted CMMS score was defined as the average of the three standardized module scores: CMMS = mean (C_z, M_z, Met_z). Patients were stratified into the CMMS-high and CMMS-low groups using the cohort-specific median CMMS score unless otherwise indicated.
4.3. LASSO-Weighted CMMS Model
To evaluate the prognostic contribution of individual CMMS genes, LASSO–Cox regression was performed using the 30 CMMS genes. All genes present in every dataset were encompassed by the analytical model. The analysis was conducted separately in TCGA-HGSOC, GSE32062, and GSE53963 to account for differences in cohort composition, platform characteristics, and expression distributions. The optimal penalty parameter was determined by cross-validation, and the lambda.min criterion was used to select the final model because the aim of this analysis was to assess the prognostic contribution of CMMS-related genes rather than to establish a highly parsimonious clinical prediction tool. Genes with non-zero coefficients at lambda.min were retained to calculate the cohort-specific LASSO-CMMS risk score as follows: risk score = Σ(coefficient_i × expression_i), where expression_i represents the normalized expression value of the corresponding gene. Patients in each cohort were divided into high-risk and low-risk groups according to the median risk score. The selected genes, coefficients, lambda.min values, number of non-zero genes, and exact risk-score formulas are provided in
Table S4. Cross-validation curves and coefficient profiles are shown in
Figure S1B–G. These LASSO-CMMS models were interpreted as cohort-specific prognostic summaries of CMMS-related genes and are not presented as a single transferable clinical classifier. Survival distributions were visualized by Kaplan–Meier curves, and the associations between risk groups and overall survival were quantified using Cox proportional hazards regression. The unweighted CMMS score was primarily used for biological association analyses, whereas the LASSO-weighted CMMS score was used for prognostic stratification.
4.4. Pathway and Functional Signature Scoring
Gene set activity scores were calculated using ssGSEA or module score-based approaches depending on the data type [
36]. ECM, TGFβ, hypoxia, glycolysis, lactate-related, mTORC1, CD8 effector, and exhaustion signatures were evaluated using curated gene sets from hallmark pathways or published immune/stromal signatures.
In the bulk transcriptomic cohorts, gene-set activity was summarized for each individual sample. For single-cell RNA-seq analyses, module activities were quantified for individual cells with the AddModuleScore function. All signature scores were computed using genes detected in the corresponding dataset. When required, scores were standardized within each cohort before comparison or integration. A predefined exhaustion-related gene set, consisting of PDCD1, LAG3, TIGIT, HAVCR2, CTLA4, TOX, and CXCL13, was used to estimate exhaustion signature activity. The CD8 effector signature was calculated using cytotoxic T-cell effector genes, including GZMB, PRF1, GNLY, NKG7, and CTSW.
4.5. Immune Infiltration and Tumor Microenvironment Analysis
The tumor microenvironment composition was inferred using multiple complementary approaches. The overall immune and stromal content of individual tumors was evaluated using three parameters derived from the ESTIMATE algorithm: the immune score, stromal score, and tumor purity.
Bulk transcriptomic profiles were analyzed with ImmuCellAI and xCell to characterize immune cell infiltration. The inferred immune cell abundance for each sample was used for downstream comparisons between the CMMS-high and CMMS-low groups, defined by the cohort-specific median CMMS score. To compare immune cell infiltration levels across the predefined groups, the Wilcoxon rank-sum test was employed. Additionally, the association between the CMMS score and the abundance of various inferred immune cell populations was quantified using Spearman’s rank correlation analysis. Adjusted p values were obtained using the Benjamini–Hochberg method. Clustered correlation matrices were displayed using the corrplot package in R.
TIDE-associated metrics, including the TIDE score, dysfunction score, and exclusion score, were used to evaluate immune evasion phenotypes [
29]. The association between CMMS and immune exclusion-associated phenotype or exhaustion was assessed using group comparisons, correlation analyses, and stratified analyses based on immune infiltration status.
Tumors were stratified into infiltration-high and infiltration-low subgroups using the median CD8 effector or immune infiltration score to evaluate the CMMS-associated effects across distinct immune contexts.
4.6. Mediation Analysis
Mediation analysis was performed to examine whether hypoxia mediated the association between CMMS and glycolysis. CMMS was treated as the exposure variable, the hypoxia score as the mediator, and the glycolysis score as the outcome variable. The mediation model quantified the hypoxia-mediated indirect effect, the residual direct effect, and the overall effect of CMMS on glycolysis. Statistical significance was assessed using nonparametric simulation or bootstrapping procedures. A significant indirect effect with attenuation of the direct effect was interpreted as evidence supporting a hypoxia-mediated relationship between CMMS and glycolytic remodeling.
4.7. Single-Cell RNA-Seq Data Processing
The single-cell RNA-seq datasets GSE154600 and GSE165897 were used to evaluate CMMS activity at the single-cell resolution. Raw or processed count matrices were analyzed using Seurat. For each dataset, low-quality cells were removed based on gene complexity, total UMI counts, and mitochondrial transcript percentage. Specifically, cells were retained if they met the following criteria: nFeature_RNA > 200, nFeature_RNA < 6000, nCount_RNA > 500, and percent.mt < 15%. Doublets were removed using original author-provided doublet filtering, and the final number of cells retained for each patient is summarized in
Supplementary Tables S7 and S8.
After quality control, count matrices were normalized using Log Normalize, highly variable genes were identified, and the data were scaled before principal component analysis. Batch correction and dataset/sample integration were performed using RPCA-based Seurat integration, with 30 principal components used for downstream clustering and UMAP visualization. Cell clusters were identified using a graph-based clustering algorithm at a resolution of 0.8.
Canonical marker genes used for annotation included the following: EPCAM, KRT8, KRT18, and KRT19 for epithelial cells; COL1A1, COL1A2, DCN, LUM, PDGFRB, and ACTA2 for CAFs; PECAM1 and VWF for endothelial cells; CD3D, CD3E, NKG7, and CD8A for T/NK cells; LYZ and MS4A7 for myeloid cells; and MS4A1, CD79A, and JCHAIN for B/plasma cells (
Table S9).
For single-cell statistical analyses, individual cells were not treated as independent biological replicates. Instead, cell-level scores and cell fractions were aggregated at the patient/sample level, and each patient/sample was used as the statistical unit for correlation or group-comparison analyses. Cell-level UMAPs, violin plots, and heatmaps were retained as descriptive visualizations.
4.8. CAF Subtype and Functional State Analysis
CAF subtypes were annotated based on known fibroblast markers and functional programs, including iCAF, myCAF, and TGFβ-CAF states. CMMS, ECM remodeling, TGFβ, hypoxia, and glycolysis scores were compared across CAF subtypes. For visualization, CAFs were classified as CMMS-high or CMMS-low using the dataset-specific median CMMS score among CAFs. Similarly, ECM-high CAFs were defined using the dataset-specific median ECM score among CAFs. Heatmaps and violin plots were used to visualize the functional heterogeneity among CAF subsets.
To reduce pseudo-replication from cell-level testing, statistical inference for key comparisons was performed at the patient/sample level. Cell-level UMAPs, violin plots, and heatmaps were used as descriptive visualizations, whereas quantitative comparisons were based on aggregated patient-level metrics. For each patient/sample, CAF-level metrics included the mean CAF CMMS score, mean ECM score, and the fraction of CMMS-high or ECM-high CAFs. Immune-related metrics included the CD8 T-cell fraction and mean CD8 exhaustion score within the same patient/sample. These values were correlated with the CD8 T-cell fraction and CD8 exhaustion score within the same sample. Only samples with sufficient numbers of CAFs and T cells were included in the sample-level correlation analyses.
4.9. Cell–Cell Communication Analysis
Intercellular communication networks were reconstructed with CellChat, focusing on ligand–receptor interactions between CAF subpopulations and T-cell subsets [
10]. We classified CAFs into CMMS-high and CMMS-low subsets, while T cells were classified into exhausted and non-exhausted T-cell subsets according to exhaustion-associated marker expression. Communication probabilities were estimated for selected signaling pathways, with emphasis on matrix- and chemokine-related interactions, including COLLAGEN, FN1, LAMININ, CXCL, and CXCL12-CXCR4 signaling.
Outgoing signaling strength from CMMS-high and CMMS-low CAFs toward T-cell subsets was compared to identify CAF-derived communication programs potentially associated with T-cell exclusion or dysfunction.
4.10. Immunotherapy Cohort Analysis
The IMvigor210 anti-PD-L1-treated cohort was used as an exploratory immunotherapy-related validation dataset. Expression matrices and corresponding survival data were processed consistently with the aforementioned gene annotation and harmonization workflow. A LASSO-weighted CMMS risk score was calculated using available CMMS genes. A median-based cutoff was applied to classify patients into high- and low-risk groups. Survival outcomes were analyzed with Kaplan–Meier curves, and prognostic effects were estimated using Cox proportional hazards models. Because IMvigor210 is not an ovarian cancer cohort, this analysis was interpreted as exploratory evidence for the potential relevance of CMMS-associated stromal remodeling to immune checkpoint blockade response.
4.11. Overlap-Controlled and Leave-One-Module-Out Analyses
To evaluate whether ECM-related associations were driven by gene overlap with the CMMS definition, we performed overlap-controlled and leave-one-module-out sensitivity analyses. First, an external ECM-remodeling score was calculated using ECM-associated genes that were not included in the 30 CMMS genes. Second, three leave-one-module-out CMMS scores were generated by excluding the contractile/myCAF module, the matrix-remodeling/ECM module, or the mitochondrial/metabolic module. The resulting scores were defined as CMMS_no_C = mean (M_z, Met_z), CMMS_no_M = mean (C_z, Met_z), and CMMS_no_Met = mean (C_z, M_z). Spearman correlation analysis was then used to examine the associations between these alternative CMMS scores and the overlap-free ECM score. These analyses were used to distinguish built-in matrix–gene effects from broader stromal remodeling associations.
4.12. Cell Culture
The human fibroblast cell line MRC-5 was obtained from the Cell Bank of the Chinese Academy of Sciences (Shanghai, China). Primary human ovarian CAFs were isolated from ovarian cancer tissues collected at the Obstetrics and Gynecology Hospital of Fudan University. Primary human ovarian CAFs were isolated from 3 independent patient donors, and all in vitro experiments were conducted at passage P1–P3. The fibroblast phenotype was characterized by immunofluorescence staining for Vimentin. All human tissue specimens were obtained with institutional ethical approval and written informed consent from patients. Those above cells were cultured in an incubator with 5% CO2 and regularly sterilized at 37 °C. MRC-5 fibroblasts were stimulated by TGF-β1 (5 ng/mL) (PeproTech, Rocky Hill, NJ, USA) for 24 and 48 h in vitro. CAFs were subjected to the application of a TGFB1 neutralizing antibody (2 μg/mL) and were treated for 48 h.
4.13. Western Blot
MRC5 cells and CAFs were lysed in pre-chilled RIPA buffer. Following centrifugation, the supernatants were collected, and protein concentrations were quantified using a BCA assay. Protein samples were separated on 8–12% SDS-PAGE gels and transferred to 0.45 μm PVDF membranes. After blocking with 5% BSA, membranes were incubated with primary antibodies overnight at 4 °C and subsequently probed with HRP-conjugated secondary antibodies for 2 h at room temperature. Target proteins were visualized using an ECL chemiluminescence detection system. Band intensities were quantified using ImageJ v1.54f software. All primary and secondary antibodies used in this study are summarized in
Table S1.
4.14. RT-qPCR
Total RNA was prepared with TRIzol reagent, reverse-transcribed using PrimeScript RT Master Mix (Takara Bio Inc., Kusatsu, Shiga, Japan; Cat. No. RR036A), and analyzed by qRT-PCR with SYBR Green II (Takara Bio Inc., Kusatsu, Shiga, Japan; Cat. No. RR820A). The primers utilized for qPCR are presented in the online
Supplementary Table S2.
4.15. Immunofluorescent Staining
Paraffin-embedded tissues were deparaffinized, subjected to antigen retrieval, and blocked with 5% BSA. Sections were incubated overnight with the respective primary antibodies against Collagen I, α-SMA, CD8, or PDCD1, followed by HRP-conjugated or fluorescent secondary antibodies. IF staining employed DAPI for nuclei and confocal microscopy for imaging. For immunofluorescence staining, coverslip-cultured cells were sequentially fixed, permeabilized, blocked, and incubated with primary antibodies followed by Alexa Fluor-labeled secondary antibodies. Images were captured with a confocal microscope.
Multiplex immunofluorescence analysis was performed on HGSOC tissue sections from 80 patients. For each case, five representative non-necrotic ROIs were selected under identical imaging settings. Quantification was performed at the ROI level, and the mean value of five ROIs was used as the patient-level measurement. Therefore, each patient, rather than each ROI, was treated as the statistical unit (
Table S10). CAF/ECM-rich status was defined based on the combined α-SMA and Collagen I signaling. For each region of interest, α-SMA
+ and Collagen I
+ areas were quantified as the percentage of total tissue area. The two values were z-score normalized and averaged to generate a CAF/ECM-rich score. Regions or samples with scores above the median were classified as CAF/ECM-high, whereas those below the median were classified as CAF/ECM-low.
4.16. CD8+ T-Cell Isolation, Coculture and Flow Cytometry
PBMCs were obtained and CD8+ T cells isolated by negative magnetic selection. Purified CD8+ T cells were activated using CD3/CD28 beads supplemented with IL-2 and expanded before being introduced into the co-culture system. In a transwell co-culture system, TGFβ1-pretreated MRC-5 fibroblasts were plated in the lower chambers of 24-well plates, while CD8+ T cells were seeded in the upper inserts. Activated CD8+ T cells were stained with viability and surface markers following standard protocols and were analyzed on a flow cytometer.
4.17. Statistical Analysis
Statistical analyses were performed in R. Comparisons between groups were performed using nonparametric tests, including the Wilcoxon rank-sum test for two-group comparisons and the Kruskal–Wallis test for multiple groups. Correlations between continuous variables were evaluated using Spearman’s method. Interaction effects were tested using Cox models containing the corresponding interaction terms. Two-sided p values < 0.05 were considered statistically significant.