Article

Integrated Analysis of mRNA and microRNA Expression in Corneal Impression Cytology Samples from Patients with PAX6-Related Congenital Aniridia

1
Dr. Rolf M. Schwiete Center for Limbal Stem Cell and Congenital Aniridia Research, Saarland University, 66424 Homburg, Germany
2
Department of Experimental Ophthalmology, Saarland University, 66424 Homburg, Germany
3
Department of Ophthalmology, Saarland University Medical Center, 66424 Homburg, Germany
4
Department of Ophthalmology, Semmelweis University, 1085 Budapest, Hungary
5
Department of Genetics and Genomics, Instituto de Investigación Sanitaria-Fundación Jiménez Díaz University Hospital, Universidad Autónoma de Madrid (IIS-FJD, UAM), 28040 Madrid, Spain
6
Center for Biomedical Network Research on Rare Diseases (CIBERER), Instituto de Salud Carlos III, 28029 Madrid, Spain
7
MTA-SE Lendület Nephrogenetic Laboratory, Hungarian Academy of Sciences, 1051 Budapest, Hungary
8
1st Department of Pediatrics, Semmelweis University, 1085 Budapest, Hungary
9
Department of Human Genetics, Saarland University, 66424 Homburg, Germany
*
Author to whom correspondence should be addressed.
Int. J. Mol. Sci. 2026, 27(13), 6088; https://doi.org/10.3390/ijms27136088 (registering DOI)
Submission received: 20 June 2026 / Revised: 3 July 2026 / Accepted: 5 July 2026 / Published: 7 July 2026

Abstract

This study aimed to measure mRNA and miRNA expression profile in corneal impression cytology (IC) samples from patients with congenital aniridia (CA) and healthy controls, and to elucidate the key genes and signaling pathways involved in aniridia-associated keratopathy (AAK). Corneal IC samples were collected from 14 patients with CA and 14 healthy controls. RNA sequencing was performed to identify differentially expressed genes (DEGs) and miRNAs. Correlations with age and AAK grade were analyzed, selected miRNAs were validated by RT-qPCR, and Gene Ontology (GO) and Kyoto Encyclopedia of Genes and Genomes (KEGG) analyses were conducted to characterize biological functions and pathways. A total of 695 DEGs and 19 differentially expressed miRNAs were identified. KRT24 expression was negatively associated with age, whereas LY6D expression positively correlated with AAK grade. Several miRNAs were linked to disease severity, including positive correlations for miR-224-5p, miR-224-3p, and miR-452-5p, and negative correlations for miR-204-3p, miR-181b-5p, and miR-181a-5p. RT-qPCR confirmed significant downregulation of miR-204-5p and miR-138-5p in aniridia samples. Functional enrichment analyses showed that DEGs were mainly involved in cell adhesion, extracellular matrix remodeling, inflammatory and immune responses, and neural-related processes. Target genes of dysregulated miRNAs were enriched in transcriptional regulation, cell proliferation, apoptosis, and migration, with significant involvement of PI3K-Akt, AGE-RAGE, and EGFR signaling pathways. Corneal epithelial cells from patients with CA exhibit coordinated mRNA and miRNA dysregulation associated with extracellular matrix disruption, inflammation, and altered signaling pathways. These findings improve understanding of AAK pathogenesis and identify potential biomarkers and therapeutic targets.

1. Introduction

Congenital aniridia (CA) is a rare genetic disorder characterized by varying degrees of iris hypoplasia and is frequently accompanied by other ocular abnormalities, including nystagmus, secondary glaucoma, lens anomalies, and optic nerve and macular hypoplasia, which can severely compromise visual function. Epidemiological studies indicate that the prevalence of CA ranges from approximately 1:40,000 to 1:100,000 [1,2,3]. The paired box gene 6 (PAX6), a key transcription factor involved in ocular development, plays a central role in the pathogenesis of these ocular alterations through haploinsufficiency, which is present in approximately 90% of CA cases [1,4]. Aniridia-associated keratopathy (AAK) represents one of the most severe ocular complications of CA and may ultimately lead to profound deterioration of visual function and a markedly reduced quality of life [5]. AAK is characterized by progressive corneal conjunctivalization and neovascularization, resulting in loss of corneal transparency. Although the exact pathogenic mechanisms underlying AAK remain incompletely understood, limbal epithelial stem cell deficiency is considered a major contributing factor. Increasing evidence also indicates that chronic inflammation, extracellular matrix remodeling, abnormal epithelial differentiation, and corneal neovascularization contribute to disease progression [6,7,8,9,10].
Messenger RNA (mRNA) is essential for cellular function, as it conveys genetic information from DNA to the cytoplasm and directs protein synthesis [11]. Accordingly, analyzing mRNA expression profiles in corneal epithelial cells offers valuable insight into gene-level alterations associated with AAK. Previous studies have demonstrated significant dysregulation of multiple signaling pathways in AAK corneas, including retinoic acid, Notch1, sonic hedgehog (SHH), mTOR, and Wnt/β-catenin signaling [12,13]. High-throughput RNA sequencing enables comprehensive and unbiased profiling of coding transcripts and has become an important approach for identifying disease-associated molecular pathways and potential therapeutic targets [14].
MicroRNAs (miRNAs) are small non-coding RNA molecules, typically 20–24 nucleotides in length, that regulate gene expression by binding to target mRNAs and modulating protein synthesis [15,16,17]. miRNAs are involved in numerous biological processes, including cell proliferation, differentiation, apoptosis, and stress responses. Increasing evidence indicates that miRNAs also play important roles in the development and progression of AAK. For example, miR-204-5p has been reported to regulate PAX6 expression in corneal epithelial cells and to influence angiogenesis-related factors such as VEGFA and ANGPT1 [18]. It also modulates genes involved in transcriptional regulation, cytoskeletal organization, extracellular matrix remodeling, and retinoic acid signaling in limbal epithelial cells [19]. In addition, miR-7 and miR-375 affect cellular function through regulation of PAX6 [20], while miR-138-5p, upregulated in corneal cells from patients with CA, targets genes including FOXC1, CASP3, and CCND1 [21].
Impression cytology (IC) is a minimally invasive sampling technique in which a nitrocellulose or cellulose acetate membrane is gently applied to the ocular surface to obtain superficial epithelial cells from the conjunctival or corneal surface for cytological, molecular, and immunological analyses [22]. In a previous study, conjunctival IC samples from patients with CA revealed significant downregulation of the anti-angiogenic factor miR-204-5p, along with marked dysregulation of additional mRNAs and miRNAs, suggesting that the conjunctiva in aniridia is maintained in a pro-angiogenic and proliferative state [23]. To date, however, no study has specifically analyzed IC samples obtained from the central corneal surface of patients with CA. This is particularly relevant, as AAK primarily affects the cornea, and potential therapeutic strategies are likely to target this tissue [24]. Therefore, profiling mRNA and miRNA expression in corneal IC samples may accurately reflect site-specific pathogenic mechanisms. Furthermore, integrated analysis of mRNA and miRNA expression provides a more comprehensive understanding of the regulatory networks underlying disease pathogenesis than analysis of either transcript type alone. Such an approach facilitates the identification of key molecular pathways, regulatory interactions, and potential biomarkers that may contribute to the development of targeted therapeutic strategies for AAK.
Therefore, the aim of this study was to investigate the molecular mechanisms underlying AAK by analyzing corneal IC samples from patients with CA. High-throughput sequencing was performed to profile mRNA and miRNA expression patterns and to compare them with those of healthy controls. The objectives were to identify differentially expressed mRNAs and miRNAs, construct potential miRNA–mRNA regulatory networks, and elucidate molecular pathways involved in the development and progression of AAK.

2. Results

2.1. mRNA and miRNA Expression Profile

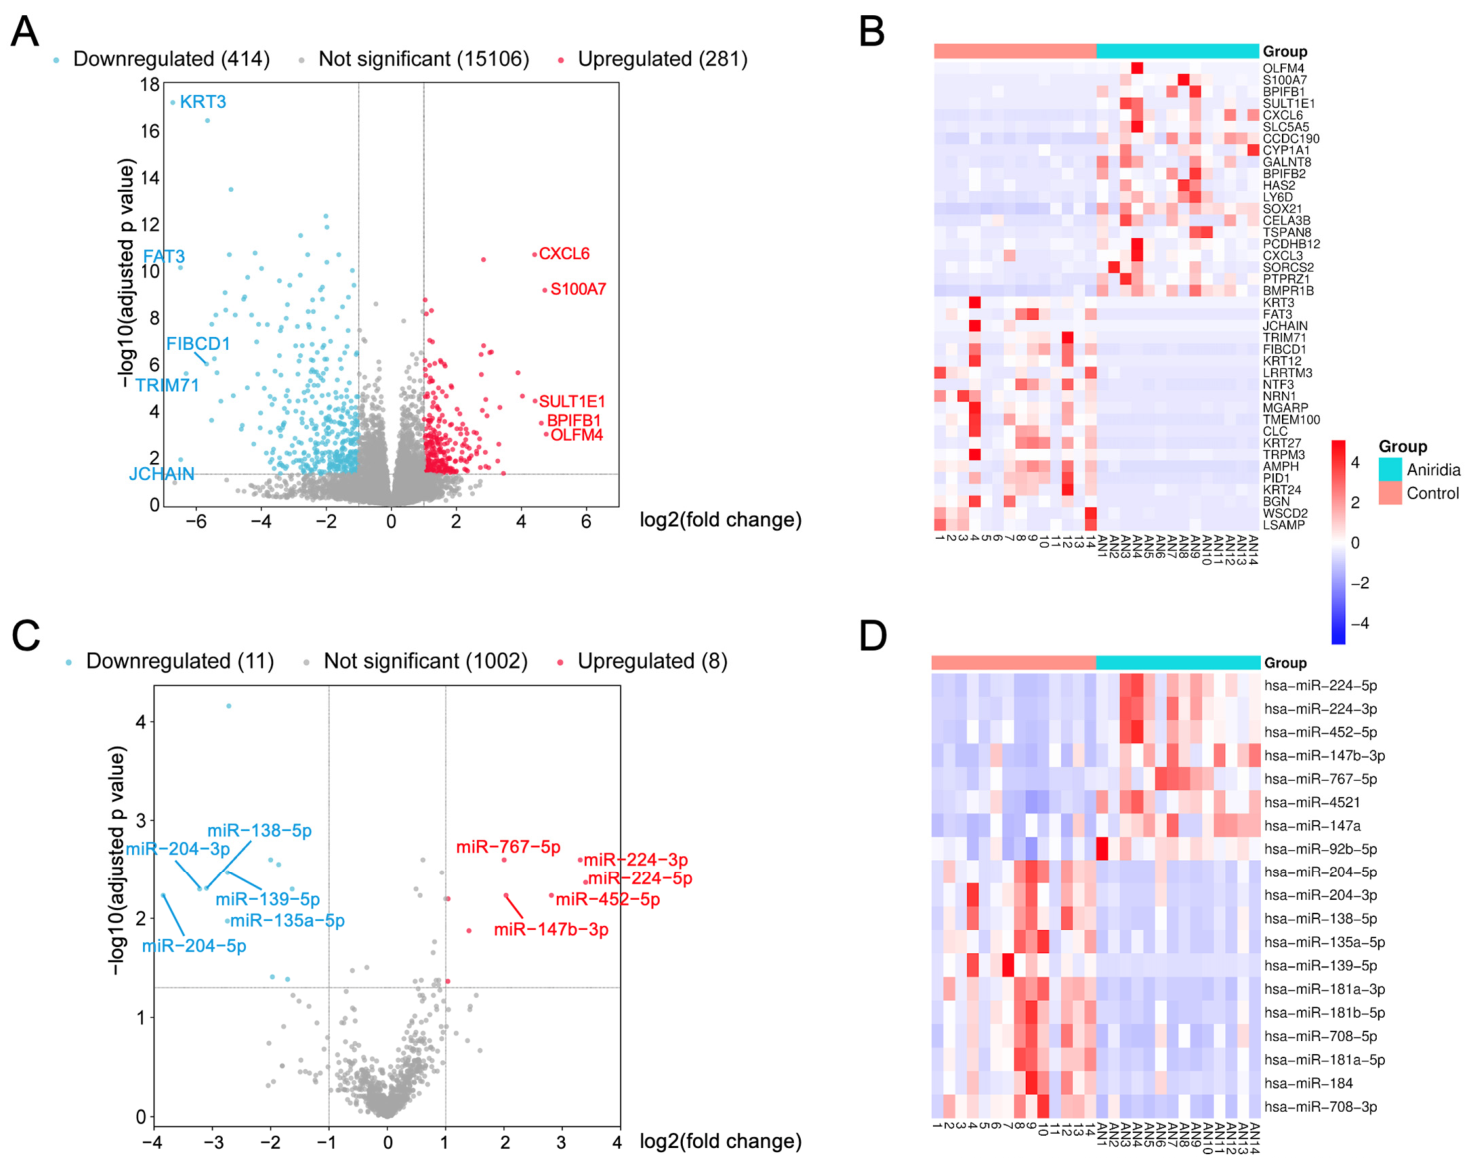
Of the 20,073 genes analyzed, 15,801 showed expression levels above background in at least 50% of the samples and were therefore included in further analysis. For these genes, a Wald test was performed to compare expression levels between the aniridia and control groups. This analysis identified a total of 695 differentially expressed genes, including 281 upregulated and 414 downregulated genes in superficial corneal cells from patients with aniridia (Figure 1A).
Figure 1B and Table 1 summarize the top 20 upregulated and top 20 downregulated differentially expressed genes (DEGs). Among them, OLFM4, S100A7, BPIFB1, SULT1E1, CXCL6, and SLC5A5 were the most strongly upregulated genes, each exhibiting log2 fold change (log2FC) values greater than 4. KRT3 was the most significantly downregulated gene and showed the largest expression difference between patients with aniridia and healthy controls. Other markedly downregulated genes, including FAT3, JCHAIN, TRIM71, FIBCD1, KRT12, LRRTM3, NTF3, NRN1, MGARP, TMEM100, CLC, KRT27, and TRPM3 displayed log2FC values less than −5.5.
A similar analytical approach was applied to assess and compare miRNA expression profiles in corneal samples from the two groups. Of the 1103 miRNAs analyzed, 1021 were expressed above background levels in at least 50% of the samples and were included in the analysis. Among these, 19 miRNAs were identified as differentially expressed between the aniridia and control groups. Compared with healthy controls, 8 miRNAs were upregulated and 11 miRNAs were downregulated in corneal samples from patients with aniridia (Figure 1C). The normalized mRNA and miRNA expression matrices, together with the differential expression analysis results, are provided in the Supplementary Data.
Figure 1D and Table 2 present all differentially expressed miRNAs identified between the two groups. Hsa-miR-224-5p, hsa-miR-224-3p, hsa-miR-452-5p, hsa-miR-147b-3p, and hsa-miR-767-5p were the most strongly upregulated miRNAs, each exhibiting log2FC values greater than 2. Hsa-miR-204-5p was the most significantly downregulated miRNA in the corneas of patients with aniridia, with a log2FC of −3.84, and showed the largest expression difference between groups. Other markedly downregulated miRNAs, including hsa-miR-204-3p, hsa-miR-138-5p, hsa-miR-135a-5p, hsa-miR-139-5p, hsa-miR-181a-3p, and hsa-miR-181b-5p, also demonstrated log2FC values below −2.

2.2. Correlation Analysis

Among the top 20 upregulated and downregulated mRNAs in aniridia samples, associations between mRNA expression levels and age were generally weak and did not reach statistical significance in either upregulated or downregulated genes, in both aniridia and control samples. With regard to AAK grade, most mRNAs likewise failed to show significant correlations after false discovery rate (FDR) adjustment.
Among the upregulated mRNAs, only LY6D displayed a significant positive correlation with AAK grade in aniridia samples (r = 0.809, p adj = 0.026), suggesting higher expression with increasing disease severity. HAS2 showed a similar positive trend (r = 0.728), although this did not remain statistically significant after correction (p = 0.078). In the group of downregulated mRNAs, KRT24 demonstrated a significant negative correlation with age in aniridia samples (r = −0.796, p adj = 0.042). However, no significant associations with AAK grade were observed after multiple testing correction. No relevant or statistically significant correlations were detected in control samples (Table 3).
Overall, miRNA expression showed only weak and non-significant associations with age in aniridia samples, regardless of whether the miRNAs were upregulated or downregulated. In contrast, several upregulated miRNAs were strongly and significantly positively correlated with AAK grade in aniridia, including hsa-miR-224-5p (r = 0.756, p adj = 0.038), hsa-miR-224-3p (r = 0.735, p adj = 0.025), and hsa-miR-452-5p (r = 0.724, p adj = 0.019), indicating that their expression levels increase with disease severity.
Conversely, several downregulated miRNAs displayed significant inverse correlations with AAK grade in aniridia, including hsa-miR-204-3p (r = −0.749, p adj = 0.029), hsa-miR-181b-5p (r = −0.668, p adj = 0.038), and hsa-miR-181a-5p (r = −0.647, p adj = 0.044), suggesting that their expression decreases as disease severity increases. No significant correlations were detected in control samples (Table 4).

2.3. Target Genes of Dysregulated miRNAs and miRNA-mRNA Binding Site Prediction

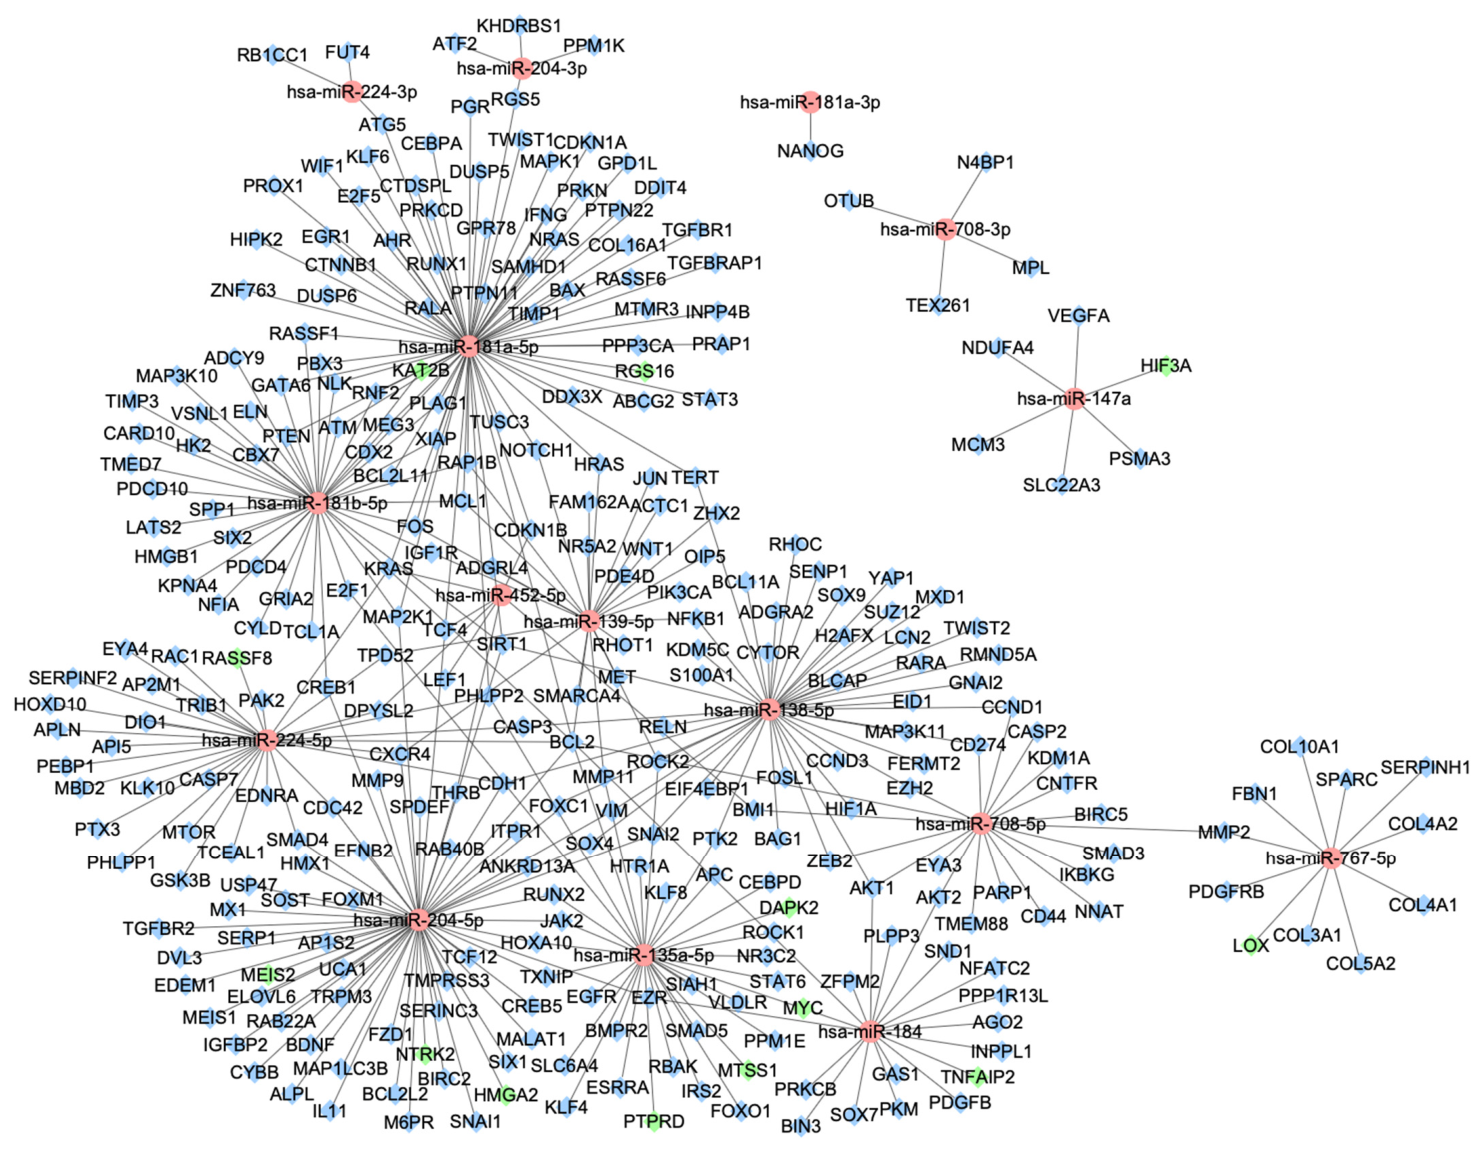
The online tool miRTarLink 2.0 was used to identify target genes regulated by dysregulated miRNAs. Only target genes that had been strongly validated by luciferase reporter assays, immunohistochemistry, microarray analysis, real-time quantitative PCR (RT-qPCR) and Western blotting were included. Using these criteria, validated target genes were identified for 16 of the 19 differentially expressed miRNAs, and the results are summarized in Table 5. Additionally, Figure 2 illustrates the miRNA-mRNA regulatory network constructed from the differentially expressed miRNAs and their experimentally validated target mRNAs in corneal samples from patients with congenital aniridia. A total of 15 dysregulated miRNA-mRNA interaction pairs were identified, in which both the miRNAs and their corresponding target mRNAs were differentially expressed, highlighting potential regulatory interactions associated with AAK pathogenesis. Notably, hsa-miR-181a-5p was associated with the largest number of target genes, with a total of 72 validated targets.
The TargetScanHuman 8.0 platform was used to predict the binding sites of the dysregulated miRNAs and their corresponding target genes that were also differentially expressed in AAK. A total of 15 predicted binding sites were identified across 11 miRNA–mRNA interaction pairs. The predicted binding sites are summarized in Supplementary Table S1.

2.4. Protein–Protein Interaction (PPI) Networks and Hub Genes

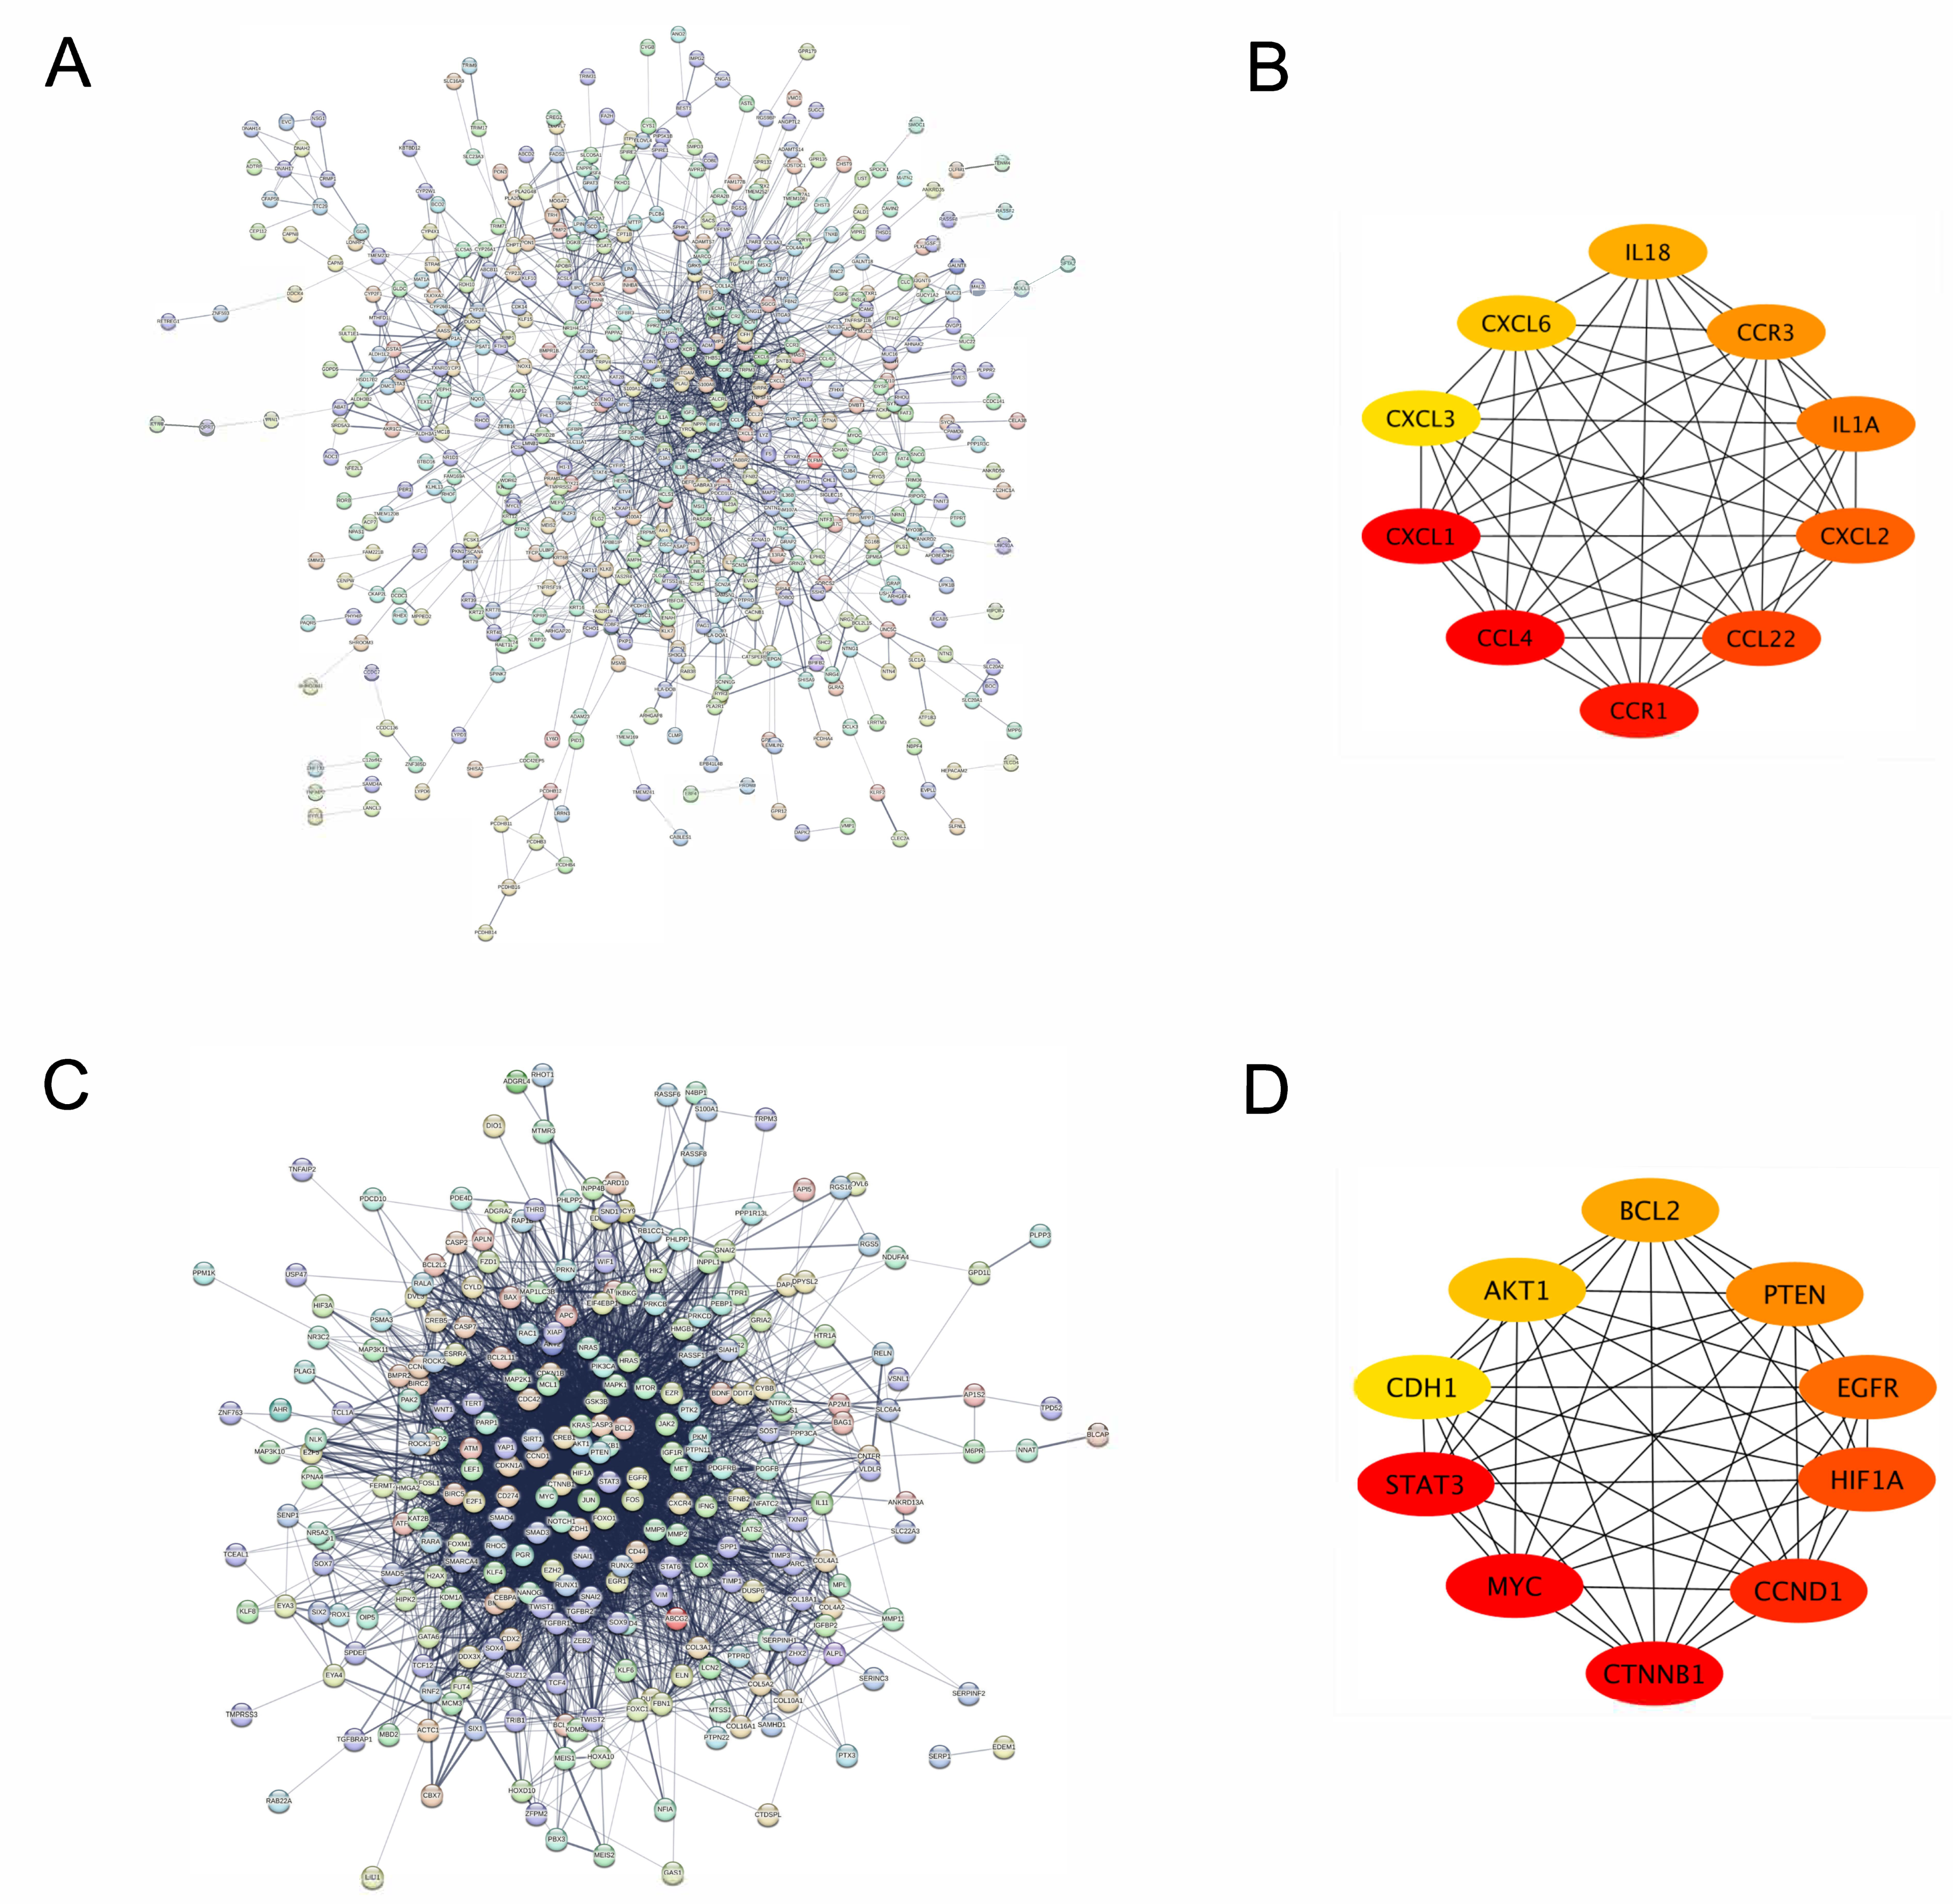
Figure 3A,C illustrate the PPI networks of DEGs in IC samples of corneas of patients with aniridia and the target genes regulated by differentially expressed microRNAs, respectively.
In the PPI network corresponding to DEGs, a total of 686 nodes and 1568 edges were identified (Figure 3A). The top 10 hub genes were CXCL1, CCL4, CCR1, CCL22, CXCL2, IL1A, CCR3, IL18, CXCL6, and CXCL13 (Figure 3B).
In the PPI network of target genes regulated by differentially expressed microRNAs, a total of 296 nodes and 4526 edges were identified (Figure 3C). The top 10 hub genes were STAT3, MYC, CTNNB1, CCND1, HIF1A, EGFR, PTEN, BCL2, AKT1, and CDH1 (Figure 3D).

2.5. Gene Ontology (GO) Enrichment Analysis

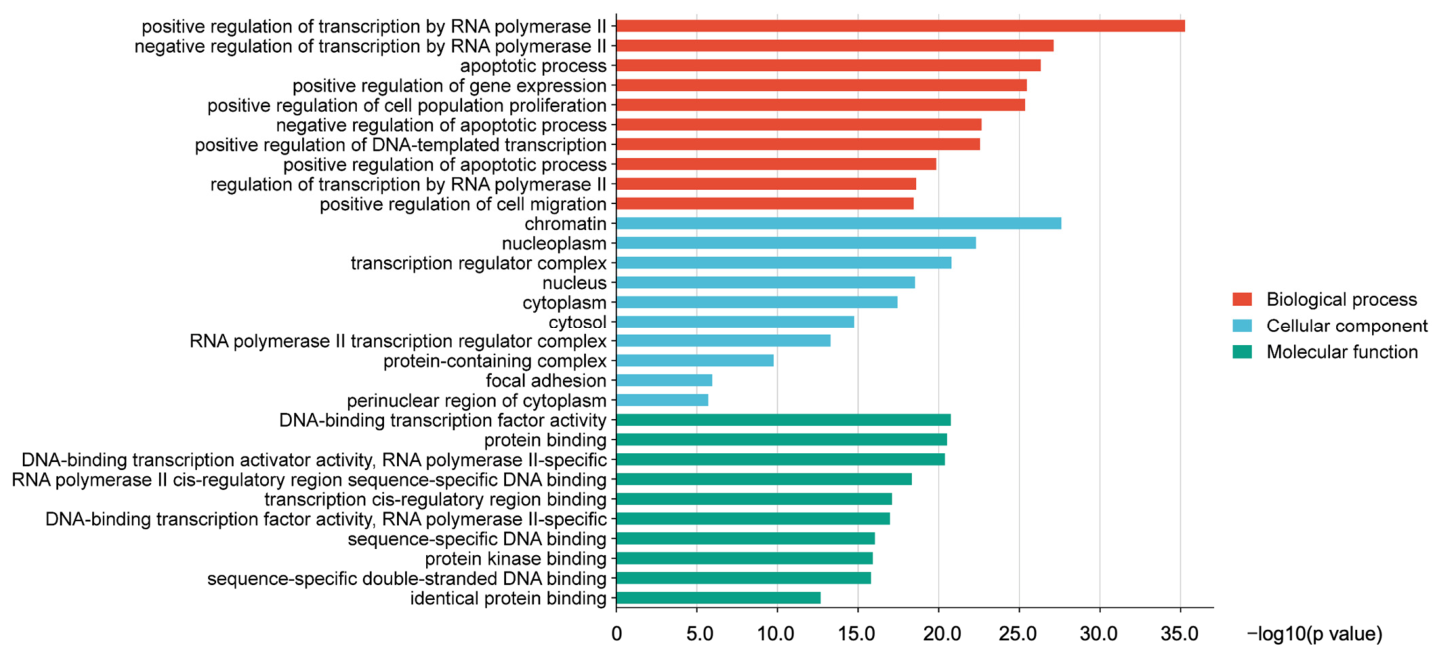
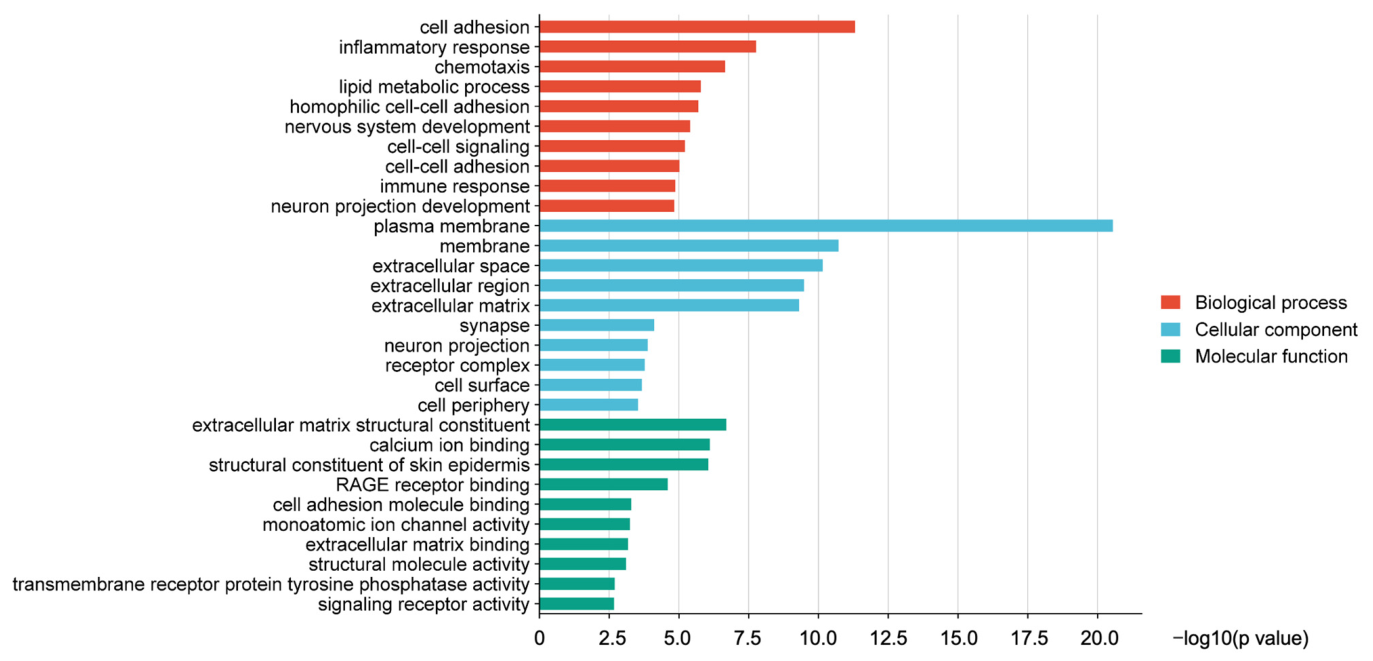
GO enrichment analysis was performed for both the differentially expressed genes and the target genes regulated by dysregulated miRNAs. Using this standardized functional annotation system, gene functions were categorized into three domains: biological process (BP), cellular component (CC), and molecular function (MF). Under a significance threshold of p < 0.05, enriched GO terms were ranked in descending order according to their −log10 p-values, and the top 10 terms from each category were presented in Figure 4 and Figure 5.
In the GO enrichment analysis of differentially expressed genes, the most significantly enriched BP terms included cell adhesion, inflammatory response, and chemotaxis. The most enriched CC terms were plasma membrane, membrane, and extracellular space, while the most prominent MF terms included extracellular matrix structural constituent, calcium ion binding, and structural constituent of skin epidermis (Figure 4). The detailed analysis results are provided in Supplementary Table S2.
For the target genes regulated by differentially expressed miRNAs, GO enrichment analysis revealed that the most enriched BP terms were positive and negative regulation of transcription by RNA polymerase II and apoptotic processes. The most enriched CC terms included chromatin, nucleoplasm, and transcription regulator complexes, whereas the most enriched MF terms comprised DNA-binding transcription factor activity, protein binding, and RNA polymerase II–specific DNA-binding transcription activator activity (Figure 5). The detailed analysis results are provided in Supplementary Table S3.

2.6. Kyoto Encyclopedia of Genes and Genomes (KEGG) Pathway Analysis

KEGG pathway enrichment analysis was performed for both the differentially expressed genes and the target genes regulated by dysregulated miRNAs. Enriched pathways were ranked in descending order according to their −log10 p-values.
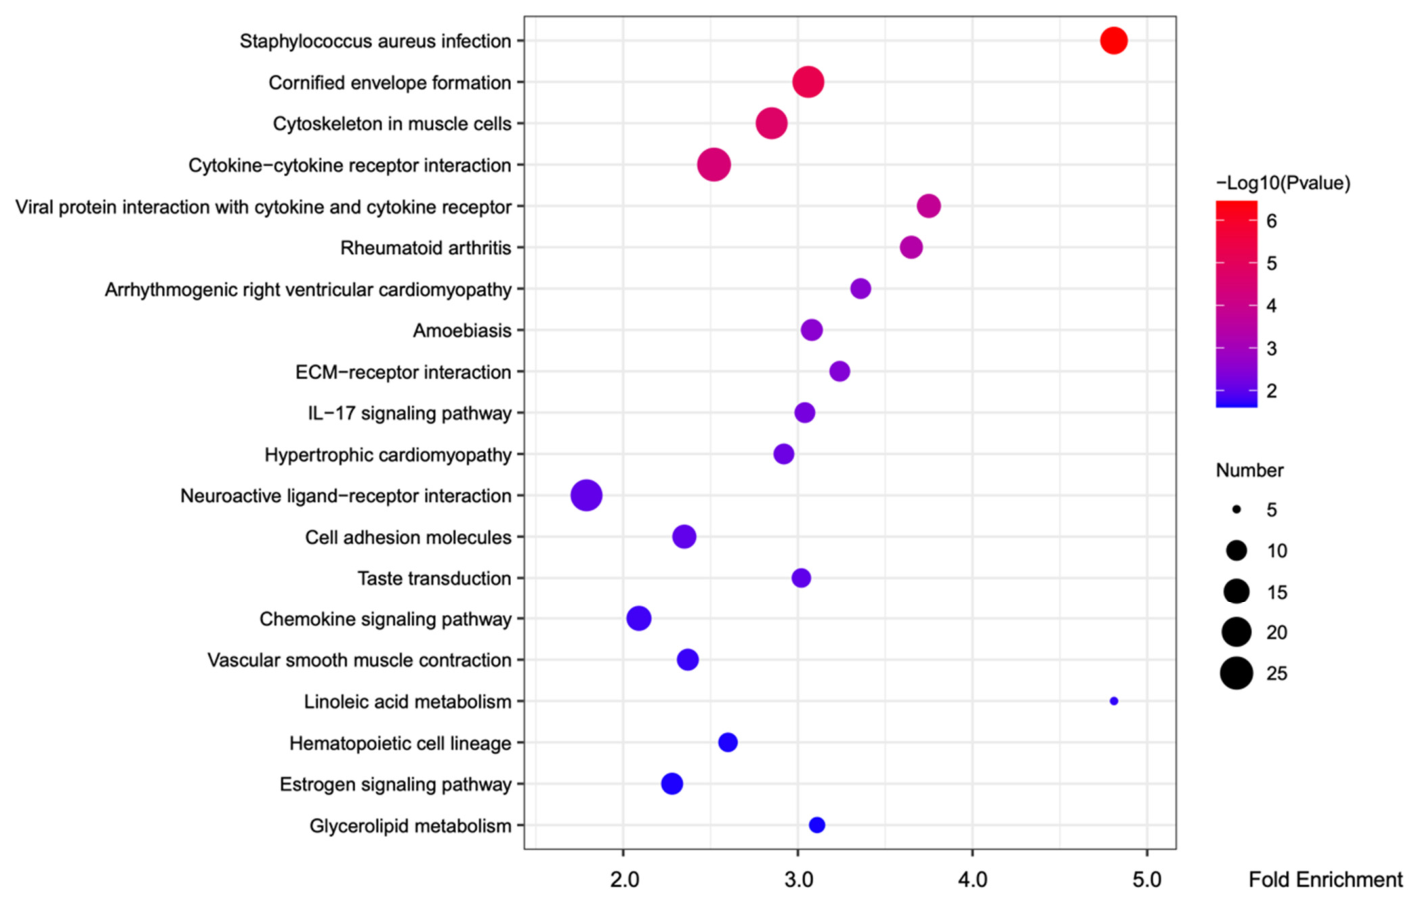
KEGG pathway analysis of differentially expressed genes revealed that the most significantly enriched pathways included Staphylococcus aureus infection, cornified envelope formation, cytoskeleton organization in muscle cells, cytokine-cytokine receptor interaction, and viral protein interaction with cytokine and cytokine receptors, among others (Figure 6). The detailed analysis results are provided in Supplementary Table S4.
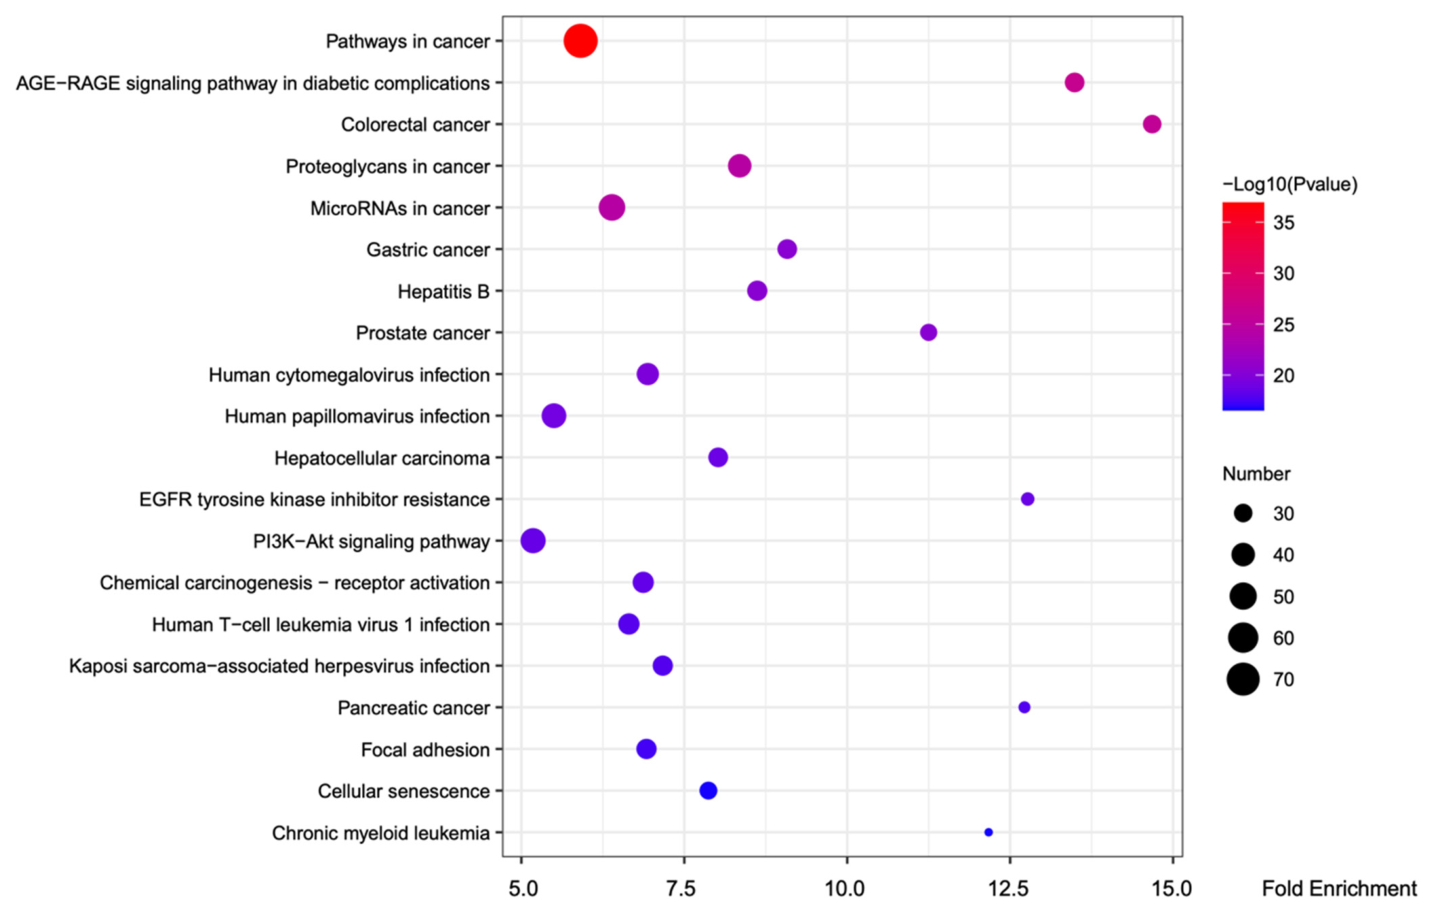
Similarly, KEGG pathway analysis of target genes regulated by differentially expressed miRNAs demonstrated significant enrichment in pathways related to cancer, the AGE-RAGE signaling pathway in diabetic complications, colorectal cancer, proteoglycans in cancer, and microRNAs in cancer (Figure 7). The detailed analysis results are provided in Supplementary Table S5.

2.7. RT-qPCR Validation

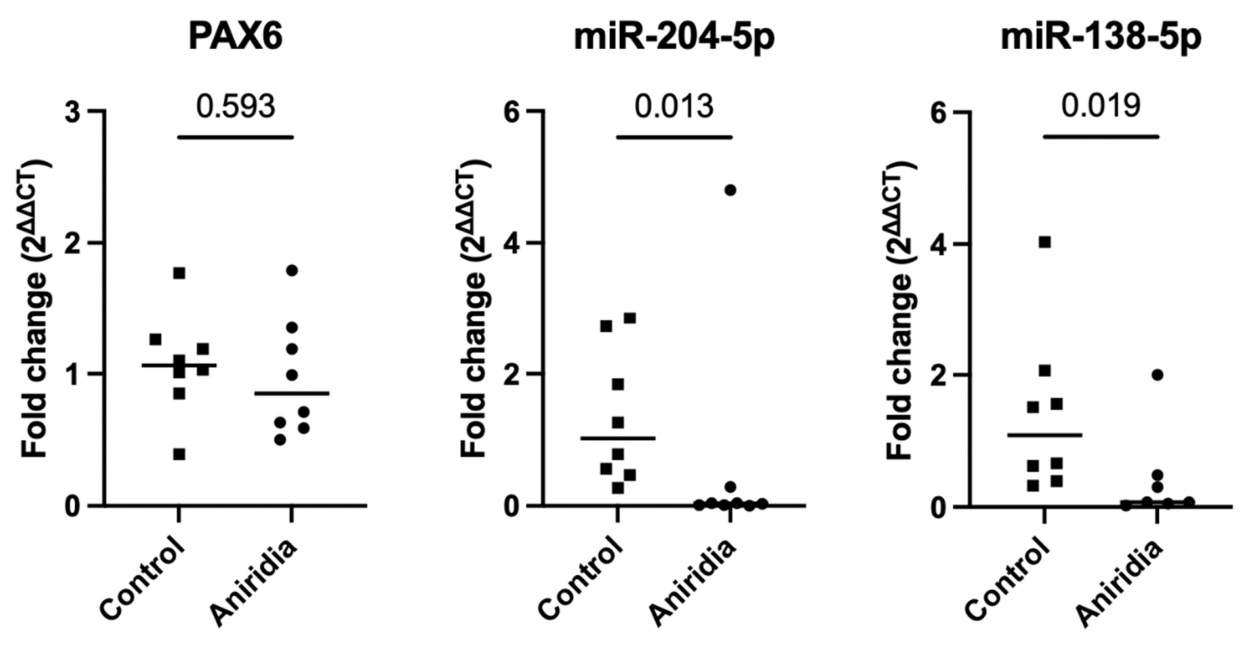
Among the differentially expressed miRNAs, we selected miR-204-5p and miR-138-5p, two miRNAs that have previously been demonstrated to play important roles in AAK for RT-qPCR validation. Compared with healthy controls, the expression level of miR-204-5p in corneal aniridia IC samples was significantly decreased (p = 0.013). Similarly, the expression level of miR-138-5p in corneal aniridia IC samples was also significantly reduced (p = 0.019). In addition, we also performed RT-qPCR validation for PAX6. The RNA sequencing results showed that PAX6 was not downregulated (log2FC = 0.08784, p = 0.651) and the RT-qPCR results also indicated that there was no statistically significant difference in PAX6 expression levels between aniridia samples and control samples (p = 0.593) (Figure 8).

3. Discussion

In this study, we systematically profiled and compared mRNA and miRNA expression patterns in corneal IC samples of patients with CA and healthy controls and performed GO and KEGG pathway enrichment analyses on both DEGs and the target genes regulated by differentially expressed miRNAs. In contrast to previous transcriptomic studies that analyzed conjunctival IC specimens and primary limbal epithelial and stromal cell cultures from patients with CA [21,23], the present investigation focused specifically on superficial cells collected from the central and paracentral corneal surface. Because these samples were mainly obtained from the most superficial epithelial layer, they were expected to represent a more differentiated cell population. This approach allows for a more direct assessment of cornea-specific alterations at the mRNA and miRNA levels in patients with AAK.
Among the 695 identified DEGs, 414 genes (59.6%) were downregulated, with KRT3 exhibiting the largest expression difference compared with the control group. In addition, KRT12, KRT24, and KRT27 were also markedly downregulated. Notably, KRT3 and KRT12 are recognized as specific markers of corneal epithelial maturation and differentiation, and their reduced expression indicates impaired corneal epithelial differentiation, increased epithelial fragility, and epithelial conjunctivalization in patients with aniridia [25,26,27]. These findings are highly consistent with the role of PAX6 as a key regulator of ocular surface development, and the decreased expression of KRT3 and KRT12 may represent downstream consequences of PAX6 dysfunction [28,29]. Furthermore, several genes associated with cell adhesion, including FAT3, OLFM4, LRRTM3, PCDHB12, and TSPAN8 [30,31], are also regulated by PAX6 [32]. Dysregulation of these genes suggests compromised corneal stability in AAK, rendering the cornea more susceptible to mechanical injury [33]. In addition, altered expression of genes closely related to neuronal development, regulation, and sensory function, such as NTF3, NRN1, LSAMP, SORCS2, PTPRZ1, and TRPM3, together with numerous inflammation-related genes, including S100A7, CXCL3, CXCL6, JCHAIN, FIBCD1, and CLC, may help explain clinical features observed in patients with AAK, such as reduced corneal innervation and increased inflammatory cell infiltration [7,34].
Among the 19 differentially expressed miRNAs identified in this study, hsa-miR-204-5p exhibited the largest expression difference between corneal IC samples from patients with aniridia and healthy controls and was markedly downregulated in aniridia. miR-204-5p has been reported to act as a regulatory factor of PAX6 [18] and is involved in corneal epithelial cell differentiation, migration, and inflammatory responses [19]. Using the online tool miRTarLink 2.0, we identified 60 strongly validated target genes of miR-204-5p. Functionally, these targets are involved in corneal epithelial differentiation, cell adhesion and migration, apoptosis, inflammation, and immune responses, as well as in key signaling pathways, including Wnt/β-catenin, TGF-β, and MAPK. Dysregulation of these targets may collectively contribute to impaired epithelial differentiation, enhanced cell migration, persistent inflammatory activation, and neural dysfunction observed in AAK [23,35,36]. Analysis of conjunctival IC samples from patients with aniridia by Latta et al. yielded comparable results, demonstrating a 26.79-fold downregulation of miR-204-5p expression [23]. As miR-204-5p functions as an inhibitor of neovascularization, its reduced expression may contribute to the development of corneal neovascularization in patients with AAK [18,23].
In addition to hsa-miR-204-5p, other dysregulated miRNAs, including hsa-miR-224-5p and hsa-miR-138-5p, may also influence a broad range of cellular functions through regulation of their target genes and play important roles in the development and progression of AAK [21,37]. Therefore, miRTarLink 2.0 was used to identify strongly validated target genes regulated by all upregulated and downregulated miRNAs. A total of 31 genes have been identified as strongly regulated targets of miR-224-5p, many of which are implicated in the control of cell proliferation, differentiation, and apoptosis [38,39,40]. In the present study, miR-224-5p was markedly upregulated in corneal IC samples from patients with aniridia, showing an approximately 10.56-fold increase. In comparison, conjunctival cells from aniridia patients exhibited a more moderate upregulation of approximately 2.44-fold [23], indicating a more pronounced dysregulation in the cornea. Previous studies further suggest that miR-224-5p can enhance cellular proliferation and migration [41,42]. Accordingly, its elevated expression may contribute to the hyperproliferative and migratory phenotype observed in AAK corneal epithelium, potentially promoting disease progression.
In addition, we analyzed the correlations between differentially expressed mRNAs and miRNAs and parameters such as age and AAK grade. Among the differentially expressed mRNAs, KRT24 expression showed a significant negative correlation with patient age in aniridia samples, whereas no such association was observed in healthy controls. KRT24, a member of the keratin family, has been identified as a potential marker of cellular differentiation and an antiproliferative factor [43]. The age-related decline in KRT24 expression may reflect progressive alterations in corneal epithelial homeostasis during disease progression in patients with aniridia [24]. In contrast, the absence of this correlation in healthy samples suggests that this age-related change may be associated with the pathological microenvironment of aniridia. Furthermore, LY6D expression was significantly positively correlated with AAK grade, suggesting a potential association with disease severity. Previous studies have shown that LY6D is involved in epithelial differentiation and immune-related processes [44,45]. Therefore, the increased expression of LY6D with higher AAK grades may reflect enhanced epithelial remodeling or inflammatory responses during the progression of AAK [46].
Regarding miRNAs, although no significant correlations were observed between miRNA expression levels and age, several miRNAs were significantly associated with AAK grade. Specifically, the expression levels of hsa-miR-224-5p, hsa-miR-224-3p, and hsa-miR-452-5p were positively correlated with AAK grade, whereas hsa-miR-204-3p, hsa-miR-181b-5p, and hsa-miR-181a-5p showed negative correlations with AAK grade. These findings suggest that dysregulated miRNAs may contribute to the progression of AAK through the regulation of target genes involved in disease-related biological processes.
Due to the limited amount of total RNA, we selected miR-204-5p and miR-138-5p, two miRNAs that have been demonstrated to play important roles in the pathogenesis of AAK [18,47], and validated their expression levels using RT-qPCR. The RT-qPCR results showed that the expression levels of miR-204-5p and miR-138-5p were markedly reduced in IC samples of corneas of patients with aniridia, which was consistent with the results of our sequencing analysis. Furthermore, we also performed RT-qPCR validation for PAX6. Although PAX6 is a key gene implicated in aniridia, our results showed no significant change in its mRNA expression levels in AAK IC samples. This may be explained by the fact that PAX6-associated pathogenesis is often due to haploinsufficiency or functional impairment rather than transcriptional downregulation. In addition, post-transcriptional regulation, protein dysfunction, and tissue heterogeneity may contribute to the discrepancy between gene expression and phenotypic manifestation [48].
We performed PPI network analysis and identified the top 10 hub genes for both DEGs and the target genes regulated by differentially expressed miRNAs, with the aim of identifying genes that may play critical roles in the development and progression of AAK. The results showed that all of the top 10 hub genes among the DEGs in aniridia corneas were associated with inflammation, further indicating that inflammation-related pathways are markedly activated in AAK [49]. In contrast, the results of PPI network analysis and hub gene selection for the target genes regulated by differentially expressed miRNAs were more diverse. These hub genes are mainly involved in signaling pathways such as PI3K/Akt, JAK–STAT, and Wnt/β-catenin, and participate in processes including inflammatory responses, cell cycle regulation, cell proliferation, and cell adhesion [21,23].
Thereafter, target genes regulated by other differently expressed miRNAs were subsequently subjected to GO and KEGG pathway enrichment analyses to further characterize their functional relevance. GO enrichment analysis of DEGs revealed significant enrichment of BP terms related to cell adhesion, cell–cell adhesion, and homophilic cell–cell adhesion, indicating substantial disruption of intercellular junctions and structural stability in the corneal epithelium. This finding is consistent with the marked downregulation of corneal epithelial differentiation markers, such as KRT3 and KRT12, observed in this study, and supports the pathological features of impaired epithelial differentiation and increased epithelial fragility in AAK [50]. In addition, multiple GO terms associated with inflammatory response, immune response, and chemotaxis were significantly enriched, suggesting persistent inflammatory activation in the corneas of patients with aniridia, as also described previously [7,51,52]. This observation aligns with the dysregulated expression of numerous inflammation- and chemotaxis-related genes among the DEGs, including CXCL3, CXCL6, and S100A7, and provides a molecular basis for the commonly observed inflammatory cell infiltration and corneal neovascularization in AAK [7]. Notably, GO terms related to nervous system development and neuron projection development were also significantly enriched, indicating potential impairment of corneal nerve development and maintenance. This finding is consistent with clinical observations of reduced corneal nerve density and decreased corneal sensitivity in patients with AAK [51,53], and is further supported by the dysregulated expression of neuron-associated genes identified in this study, such as NTF3 and NRN1. At the CC and MF levels, DEGs were predominantly localized to the plasma membrane, extracellular space, and extracellular matrix and were enriched in functions related to structural molecule activity, cell adhesion molecule binding, and calcium ion binding. These results further indicate that both the structural integrity and functional properties of the corneal epithelium are compromised in AAK. Collectively, these GO enrichment findings suggest that epithelial structural instability, persistent inflammatory activation, and neural dysfunction jointly contribute to the molecular basis of AAK pathogenesis [54]. In contrast, GO enrichment analysis of the target genes regulated by differentially expressed miRNAs predominantly highlighted upstream regulatory mechanisms related to transcriptional control and cell fate determination (Figure 5).
At the BP level, enriched terms included RNA polymerase II–mediated transcription, regulation of DNA-templated transcription, general gene expression control, as well as regulation of cell proliferation, migration, and apoptosis. These findings suggest that dysregulated miRNAs may exert their effects primarily by modulating key transcriptional programs, thereby influencing fundamental corneal epithelial processes that contribute to AAK progression [24,55] (Figure 5).
At the CC level, significant enrichment was observed in chromatin, nucleoplasm, nucleus, transcriptional regulatory complexes, and cytoplasm, further supporting the notion that these target genes are closely linked to transcriptional regulation and intracellular gene expression machinery. At the molecular function level, the target genes were mainly associated with DNA-binding transcription factor activity and transcriptional activator functions. Collectively, these results indicate that altered miRNA expression may disrupt upstream transcription factors and their regulatory networks, ultimately impairing corneal epithelial proliferation, migration, and apoptosis. Dysregulation of the miRNA-mRNA interaction network therefore likely represents a key molecular mechanism underlying the development and progression of AAK (Figure 5).
KEGG pathway analyses of both the DEGs and the target genes regulated by differentially expressed miRNAs further supported our hypotheses from complementary perspectives. The KEGG enrichment results encompass six major functional categories: metabolism, genetic information processing, environmental information processing, cellular processes, organismal systems, and human diseases [55]. Based on the KEGG pathway analysis of DEGs, genes differentially expressed in the corneal epithelium of patients with CA were primarily enriched in pathways related to inflammatory and immune responses, cell adhesion and extracellular matrix remodeling, and neural and sensory signaling. These findings are highly consistent with the known pathological features of AAK [56,57]. Similarly, KEGG analysis of target genes regulated by dysregulated miRNAs revealed enrichment in pathways associated with key cellular signal transduction, cell adhesion and ECM remodeling, cell proliferation and senescence, and inflammatory and immune responses. Among the most significantly enriched pathways, the PI3K-Akt signaling pathway, AGE-RAGE signaling pathway, and EGFR-related pathways were prominently represented. These pathways play central roles in regulating cell proliferation, survival, stress responses, and cell migration [18,58,59]. Broad miRNA-mediated regulation of critical components within these signaling cascades may therefore contribute to impaired corneal epithelial differentiation, aberrant cell migration, and dysregulated repair processes.
In addition, KEGG enrichment analysis identified numerous pathways annotated with other diseases. It should be emphasized that the enrichment of these pathways does not imply a direct disease association between aniridia and these conditions. Rather, it likely reflects substantial overlap between key transcription factors or core signaling molecules involved in these pathways and genes relevant to aniridia. These genes are broadly involved in fundamental biological regulation and represent shared molecular mechanisms across multiple diseases. Notably, multiple cancer-associated signaling pathways were significantly enriched in our dataset. This observation may relate to the central role of PAX6 as a master transcription factor, whose dysregulation has been implicated in the development and progression of various malignancies [60]. Depending on the cellular context, PAX6 may function either as an oncogene or as a tumor suppressor [61,62,63]. Although direct clinical evidence linking CA to increased cancer incidence remains limited, our findings point to a potential molecular association that merits careful consideration and further investigation.
We have previously analyzed the mRNA expression profiles of limbal epithelial cells (AN-LECs) and limbal stromal cells (AN-LSCs) in patients with CA [49], thereby investigating gene expression changes in AAK at the level of limbal stem cells. In contrast, the present study focuses on corneal IC samples from patients with aniridia, which represent the mature phenotype of AAK. Although all three cell types examined across the two studies exhibited significant alterations in inflammation-related genes and signaling pathways, notable differences were observed in other functional gene categories and pathways. DEGs in aniridia corneal IC samples were mainly enriched in extracellular matrix remodeling, cell adhesion, cell proliferation, and cellular senescence, suggesting structural abnormalities of the corneal epithelium and impairment of barrier function. In AN-LECs, the predominant changes were observed in immune- and interferon-related pathways, indicating intrinsic dysfunction of epithelial cells. In contrast, AN-LSCs were mainly characterized by dysregulation of metabolic and mitochondrial pathways, suggesting that abnormalities in the stromal microenvironment contribute to impaired limbal stem cell function in AAK [49].
By analyzing both DEGs and the target genes regulated by differentially expressed miRNAs, we were able to elucidate the molecular mechanisms underlying AAK from complementary perspectives. Integration of GO and KEGG enrichment analyses at these two levels suggests that disruption of the miRNA regulatory network represents an upstream driving force in AAK pathogenesis. Aberrant miRNA expression initially affects key regulatory processes, including transcriptional control, cell proliferation, migration, and apoptosis, which subsequently leads to impaired corneal epithelial differentiation and phenotypic instability.
In contrast, DEGs were predominantly enriched in pathways related to cytokine and chemokine signaling, ECM-receptor interactions, cytoskeletal organization and cell adhesion, as well as neural and sensory signaling. These findings reflect downstream pathological changes, such as reduced cell adhesion capacity, abnormal extracellular matrix organization, impaired corneal innervation, and persistent inflammatory activation. Collectively, these results provide systematic molecular evidence for the pathogenesis of AAK and highlight the critical role of the miRNA-mRNA regulatory network in the development and progression of this disease.
Nevertheless, this study has several limitations. First, the relatively small sample size may have limited the statistical power to detect associations between gene/miRNA expression and clinical parameters. Although several mRNAs and miRNAs showed nominally significant correlations with age or AAK grade, only a limited number of these associations remained significant after correction for multiple testing. These findings suggest that the relationships between molecular expression profiles and clinical characteristics are complex and should be interpreted with caution. Further validation in larger, independent patient cohorts is warranted. Second, the biological functions and regulatory mechanisms of the identified dysregulated genes and miRNAs were primarily inferred from transcriptomic profiling, functional enrichment analyses, and experimentally validated miRNA–mRNA interactions reported in the literature and public databases. Therefore, direct functional studies are still required to validate their specific biological roles and elucidate the underlying molecular mechanisms involved in the pathogenesis of AAK. In addition, owing to the limited quantity of RNA obtained from corneal impression cytology samples, we were unable to perform RT-qPCR validation of additional key genes and dysregulated miRNAs. Finally, because this study was conducted in a relatively small cohort using a specific patient population and a single sampling method, the generalizability of our findings to broader populations with different disease stages, genetic backgrounds, and demographic characteristics remains to be established. Future multicenter studies including larger and more diverse cohorts, together with comprehensive functional investigations, are warranted to validate our findings and further elucidate the molecular mechanisms underlying AAK.

4. Materials and Methods

4.1. Ethical Considerations

The study was conducted in accordance with the principles of the Declaration of Helsinki. Written informed consent was obtained from all participants or their legal guardians, and the study protocol was approved by the Ethics Committee of Semmelweis University, Budapest, Hungary (No. 80/2020) and by the Ethics Committee of the Medical Association of Saarland, Germany (No. 110/17).

4.2. IC Sample Collection

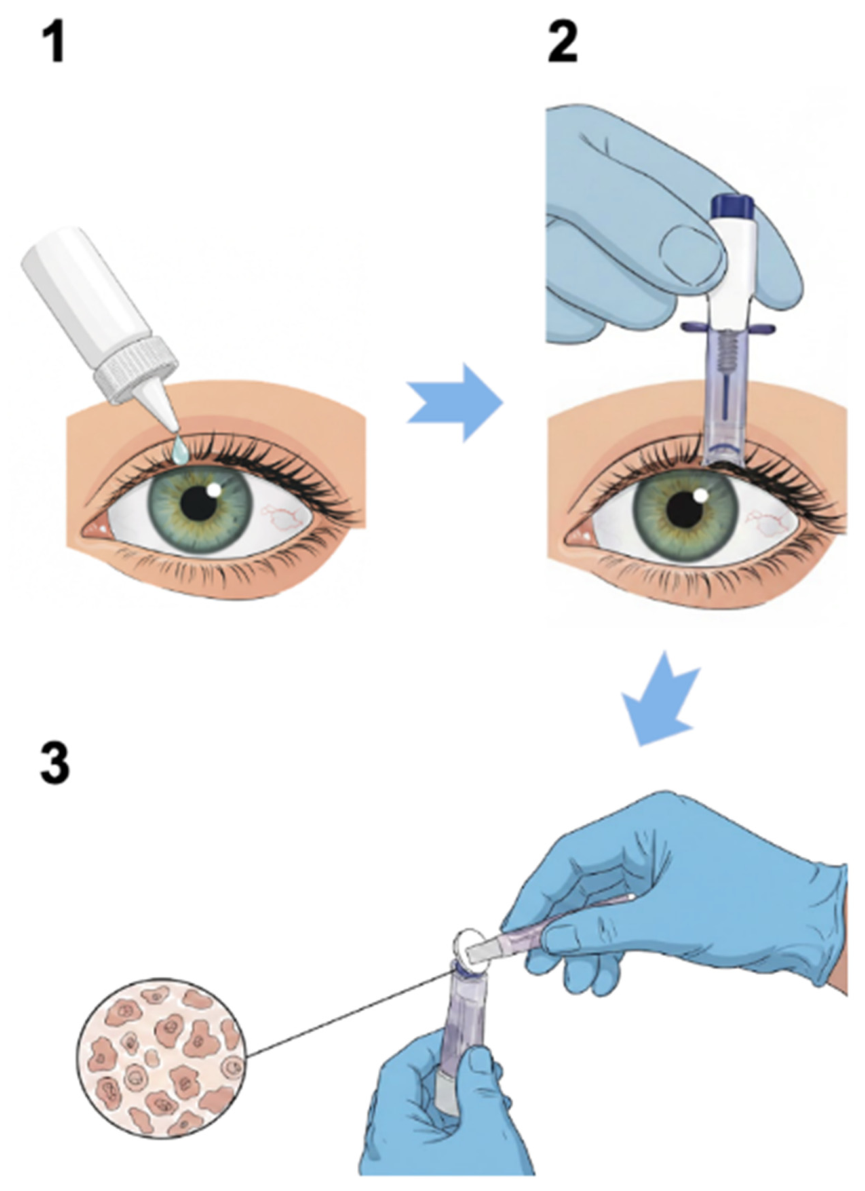
IC samples from patients with CA were collected at the Department of Ophthalmology, Semmelweis University, Budapest, Hungary, while samples from healthy controls were obtained at the Department of Ophthalmology, Saarland University Medical Center, Homburg/Saar, Germany. The IC sampling procedure is illustrated in Figure 9. First, 0.4% oxybuprokain-hidroklorid eye drops were instilled into the conjunctival sac to achieve topical anesthesia. Samples were then collected using the EYEPRIM™ device (OPIA Technologies, Paris, France), which has a sampling area of approximately 69 mm2. The applicator head was gently applied to the corneal surface, with its long axis oriented from the central cornea toward the inferior limbus. Gentle pressure was maintained for approximately 2–3 s, after which the device was lifted vertically to obtain the corneal IC sample. The collected membrane was immediately transferred into lysis buffer provided by the DNA/RNA/Protein Purification Kit Micro (Norgen Biotek Corp., Thorold, ON, Canada) and stored at −80 °C until RNA extraction.
For the present study, IC specimens were collected from 14 patients with CA (mean age: 25.6 ± 15.6 years; range: 11–57 years; 7 males and 7 females) and 14 healthy controls (mean age: 29.2 ± 19.6 years; range: 2–60 years; 6 males and 8 females). The demographic and clinical characteristics of the study population are summarized in Table 6.

4.3. RNA Isolation and Quality Control

Total RNA, including miRNA, was isolated from all IC specimens using the DNA/RNA/Protein Purification Kit Micro (Norgen Biotek Corp., Thorold, ON, Canada) according to the manufacturer’s instructions. Following purification, RNA was eluted in 30 μL of nuclease-free water. For quality control, total RNA concentration was determined using a UV/VIS spectrophotometer (Analytik Jena AG, Jena, Germany).

4.4. Whole-Transcriptome and miRNome Sequencing and Data Analysis

Global transcriptome analysis was carried out using IC-derived RNA samples from 14 patients with CA and 14 healthy controls. The samples were processed in separate experimental batches. RNA sequencing libraries were prepared with the MGIEasy rRNA Depletion Kit together with the MGIEasy Universal Library Prep Set (MGI Tech, Shenzhen, China) according to the manufacturer’s protocol. Sequencing was performed at the Sequencing Unit of the Core Facility for Molecular Single Cell and Particle Analysis, Saarland University, using a DNBSEQ-G400RS platform with 100 bp paired-end reads.
RNA-Seq data processing and quantification were carried out using the mRNA workflow implemented in snakePipes [64]. Sequencing reads were aligned to the human reference genome (GRCh38) at the gene level using STAR [65], and gene-level read counts were obtained with FeatureCounts [66]. Quality control was performed with FastQC, and results were aggregated using multiQC to ensure overall sequencing quality and integrity [67]. Raw count data were subjected to variance-stabilizing transformation (VST) using DESeq2 (version 1.46.0) [32], and the transformed data were used for clustering analyses.
For microRNA analysis, sequencing libraries were generated using the MGIEasy Small RNA Library Prep Kit (MGI Tech, Shenzhen, China) following the manufacturer’s instructions. Sequencing was performed on the same DNBSEQ-G400RS platform using a 50 bp single-end read configuration. The resulting FASTQ files were analyzed with the miRmaster 2.0 pipeline [68], which includes adapter trimming, read collapsing, and miRNA quantification based on miRBase v22.1 [69]. To enable cross-sample comparisons, miRNA expression levels were normalized to reads per million mapped miRNAs (RPMMM).
Differential gene and miRNA expression analyses were performed using the DESeq2 package. Raw count data were modeled using a negative binomial distribution, and differential expression was assessed using the Wald test. p-values were adjusted for multiple testing using the Benjamini–Hochberg false discovery rate (FDR) procedure. Genes and miRNAs with an absolute fold change > 2 (or < 0.5) and an adjusted p-value < 0.05 were considered differentially expressed.

4.5. Correlation Analysis

To assess whether the expression levels of differentially expressed mRNAs and miRNAs were associated with age and AAK grade, Spearman correlation analysis was performed. Prior to analysis, data distribution was evaluated using the Shapiro–Wilk test. p-values were adjusted for multiple testing using the Benjamini–Hochberg method to control the FDR, with a significance threshold set at 0.05.

4.6. Prediction of miRNA-mRNA Regulatory Relationships and Binding Site Prediction

We used the online tool miRTarLink 2.0 (https://ccb-compute.cs.uni-saarland.de/mirtargetlink2; accessed on 10 January 2026) to identify target genes regulated by dysregulated miRNAs [70]. Only experimentally validated target interactions were included, based on evidence from luciferase reporter assays, immunohistochemistry, microarray analysis, RT-qPCR, and Western blotting.
The TargetScanHuman 8.0 platform (https://www.targetscan.org/vert_80/; accessed on 26 June 2026) was used to predict miRNA–mRNA binding sites. Based on the miRNA–mRNA regulatory network generated using miRTarLink 2.0, binding site prediction was performed for the 15 miRNA–mRNA interaction pairs in which both the miRNAs and their corresponding target genes were differentially expressed in corneal IC samples from patients with CA.

4.7. PPI Network and Hub Gene Identification

To identify functional relationships, PPI networks of differentially expressed mRNAs and the target genes of differentially expressed microRNAs in aniridia corneal samples were constructed using the STRING database (https://string-db.org; accessed on 10 January 2026). The minimum required interaction score was set to 0.4.
To further identify genes with high connectivity within the PPI network, those likely to play critical roles in network regulation, we performed maximal clique centrality (MCC) analysis using the cytoHubba plugin in Cytoscape (version 3.10.4) and selected the top 10 hub genes.

4.8. KEGG Pathway Enrichment and GO Analysis

To uncover the functions of DEGs and the target genes regulated by differentially expressed miRNAs, and to further investigate the pathways among co-regulated genes, we performed GO analysis, including BP, MF, and CC, as well as KEGG pathway analysis using the DAVID Bioinformatics online platform (https://davidbioinformatics.nih.gov; accessed on 10 January 2026).

4.9. RT-qPCR Validation

For mRNA validation, 500 ng of total RNA was reverse-transcribed into complementary DNA (cDNA) using the OneTaq RT-PCR Kit (New England Biolabs GmbH, Frankfurt am Main, Germany). RT-qPCR was subsequently performed on a QuantStudio 5 Real-Time PCR System (Applied Biosystems, Waltham, MA, USA) using ACEq SYBR Green Master Mix (Vazyme Biotech, Nanjing, China). Glucuronidase Beta (GUSB) and TATA-box binding protein (TBP) were selected as internal reference genes for normalization.
For miRNA validation, cDNA synthesis was conducted using the miRCURY LNA miRNA RT Kit, followed by duplicate qPCR reactions with the miRCURY LNA miRNA SYBR Green PCR Kit (Qiagen GmbH, Hilden, Germany), according to the manufacturer’s instructions. miR-103a-3p and snRNA RNU6 were used as endogenous controls for normalization.
Relative expression levels were calculated using the ΔΔCt method. Normality was assessed using the Shapiro–Wilk test and then Mann–Whitney test was used to compare the expression level of mRNA and miRNAs in healthy control and aniridia IC corneal samples.

5. Conclusions

In this study, we systematically profiled mRNA and miRNA expression patterns in corneal IC samples of patients with CA and healthy controls and identified 695 DEGs and 19 differentially expressed miRNAs. Several mRNAs and miRNAs were significantly associated with age or AAK severity. However, after correction for multiple testing, only a limited number of these associations remained significant, indicating that their potential involvement in disease progression should be interpreted with caution and requires further validation in larger, independent cohorts. Functional enrichment analyses of the DEGs and miRNA target genes using GO and KEGG pathways suggest that dysregulation of the miRNA–mRNA regulatory network contributes to the pathogenesis of AAK. Aberrant miRNA expression may disrupt gene regulatory programs involved in corneal epithelial cell proliferation, migration, differentiation, and apoptosis. These molecular alterations may, in turn, contribute to the characteristic clinical features of AAK, including impaired epithelial integrity, increased corneal fragility, reduced corneal nerve density and sensitivity, and persistent activation of inflammatory and immune-related pathways.

Supplementary Materials

The following supporting information can be downloaded at: https://www.mdpi.com/article/10.3390/ijms27136088/s1.

Author Contributions

Conceptualization, S.L., T.S. and N.S.; methodology, S.L., T.S. and N.S.; software, S.L., T.S. and N.S.; validation, T.S.; formal analysis, S.L.; investigation, S.L., T.S., A.C., E.J., K.T., M.C. (Marta Corton) and N.L.; resources, N.S.; data curation, S.L., T.S., N.L. and N.S.; writing—original draft preparation, S.L.; writing—review and editing, S.L., T.S., F.N.F., M.C. (Mária Csidey), A.N., A.C., Á.É., B.S., Z.Z.N., E.M., M.C. (Marta Corton), E.J., K.T., N.L. and N.S.; visualization, S.L.; supervision, T.S. and N.S.; project administration, T.S. and N.S.; funding acquisition, N.S. All authors have read and agreed to the published version of the manuscript.

Funding

This research received no external funding.

Institutional Review Board Statement

The study was conducted in accordance with the Declaration of Helsinki and approved by the Ethics Committee of Semmelweis University (approval No.: 80/2020; approval date: 5 May 2020) and the Ethics Committee of Saarland (approval No.: 110/17; approval date: 14 June 2017).

Informed Consent Statement

Informed consent was obtained from all subjects involved in the study.

Data Availability Statement

The original contributions presented in this study are included in the article/Supplementary Material. Further inquiries can be directed to the corresponding author.

Acknowledgments

The work of the Dr. Rolf M. Schwiete Center for Limbal Stem Cell and Congenital Aniridia Research at Saarland University (1 June 2020 to 31 May 2025) has been supported by the Dr. Rolf M. Schwiete Foundation (S.L., T.S., F.N.F. and N.S.). The work of S.L. has been supported by the China Scholarship Council. We also are thankful for the support of the EU-Horizon MSCA Unit Grant, PN 101226474 (N.S.).

Conflicts of Interest

The authors declare no conflicts of interest.

Abbreviations

The following abbreviations are used in this manuscript:
AAKAniridia-associated keratopathy
AN-LECsAniridia limbal epithelial cells
AN-LSCsAniridia limbal stromal cells
BPBiological process
CACongenital aniridia
CCCellular component
cDNAComplementary DNA
DEGsDifferentially expressed genes
FCFold change
FDRFalse discovery rate
GOGene Ontology
GUSBGlucuronidase beta
ICImpression cytology
KEGGKyoto Encyclopedia of Genes and Genomes
MCCMaximal clique centrality
MFMolecular function
miRNAMicro RNA
mRNAMessenger RNA
PAX6Paired box gene 6
PPIProtein–protein interaction
RPMMMReads per million mapped miRNAs
SHHSonic hedgehog
TBPTATA-box binding protein
VSTVariance-stabilizing transformation

References

  1. Hingorani, M.; Hanson, I.; van Heyningen, V. Aniridia. Eur. J. Hum. Genet. 2012, 20, 1011–1017. [Google Scholar] [CrossRef]
  2. Daruich, A.; Duncan, M.; Robert, M.P.; Lagali, N.; Semina, E.V.; Aberdam, D.; Ferrari, S.; Romano, V.; des Roziers, C.B.; Benkortebi, R.; et al. Congenital aniridia beyond black eyes: From phenotype and novel genetic mechanisms to innovative therapeutic approaches. Prog. Retin. Eye Res. 2023, 95, 101133. [Google Scholar] [CrossRef]
  3. Calvao-Pires, P.; Santos-Silva, R.; Falcao-Reis, F.; Rocha-Sousa, A. Congenital Aniridia: Clinic, Genetics, Therapeutics, and Prognosis. Int. Sch. Res. Not. 2014, 2014, 305350. [Google Scholar] [CrossRef] [PubMed]
  4. Freund, C.; Horsford, D.J.; McInnes, R.R. Transcription factor genes and the developing eye: A genetic perspective. Hum. Mol. Genet. 1996, 5, 1471–1488. [Google Scholar] [CrossRef] [PubMed]
  5. Gour, A.; Tibrewal, S.; Garg, A.; Vohra, M.; Ratna, R.; Sangwan, V.S. New horizons in aniridia management: Clinical insights and therapeutic advances. Taiwan J. Ophthalmol. 2023, 13, 467–478. [Google Scholar] [CrossRef] [PubMed]
  6. van Velthoven, A.J.H.; Utheim, T.P.; Notara, M.; Bremond-Gignac, D.; Figueiredo, F.C.; Skottman, H.; Aberdam, D.; Daniels, J.T.; Ferrari, G.; Grupcheva, C.; et al. Future directions in managing aniridia-associated keratopathy. Surv. Ophthalmol. 2023, 68, 940–956. [Google Scholar] [CrossRef] [PubMed]
  7. Lagali, N.; Wowra, B.; Dobrowolski, D.; Utheim, T.P.; Fagerholm, P.; Wylegala, E. Stage-related central corneal epithelial transformation in congenital aniridia-associated keratopathy. Ocul. Surf. 2018, 16, 163–172. [Google Scholar] [CrossRef] [PubMed]
  8. Lee, H.K.; Kim, M.K.; Oh, J.Y. Corneal Abnormalities in Congenital Aniridia: Congenital Central Corneal Opacity Versus Aniridia-associated Keratopathy. Am. J. Ophthalmol. 2018, 185, 75–80. [Google Scholar] [CrossRef] [PubMed]
  9. Rautavaara, Y.; Sefawi, I.; Vattulainen, M.; Moustardas, P.; Javidjam, D.; Dashti, A.; Lagali, N. Central Corneal Epithelial Wounding Accelerates Aniridia-Associated Keratopathy in PAX6-Deficient Mice. Investig. Opthalmol. Vis. Sci. 2025, 66, 33. [Google Scholar] [CrossRef] [PubMed]
  10. Foroozandeh, P.; Kaplan, N.; Qi, X.; Yang, W.; Chen, X.; Lee, S.K.; Ren, Z.; Lavker, R.M.; Kume, T.; Peng, H. PAX6 Deficiency Compromises the Ability of Limbal Epithelial Stem Cells to Properly Differentiate Into Mature Corneal Epithelial Cells. Investig. Ophthalmol. Vis. Sci. 2026, 67, 56. [Google Scholar] [CrossRef] [PubMed]
  11. Jiang, A.; Liu, S.; Li, Z.; Zhang, X.; Duan, M.; Li, B. Therapy-induced mRNA, rRNA and tRNA methylation alterations confer tolerance phenotype in tumor cells: Mechanism and implications. Int. J. Biol. Sci. 2026, 22, 86–110. [Google Scholar] [CrossRef] [PubMed]
  12. Hsu, S.L.; Stachon, T.; Fries, F.N.; Li, Z.; Li, S.; Liu, S.; Seitz, B.; Kundu, S.; Amini, M.; Suiwal, S.; et al. Effect of retinoic acid treatment on the retinoic acid signaling pathway in a human siRNA-based aniridia limbal epithelial cell model, in vitro. PLoS ONE 2025, 20, e0324946. [Google Scholar] [CrossRef] [PubMed]
  13. Vicente, A.; Bystrom, B.; Pedrosa Domellof, F. Altered Signaling Pathways in Aniridia-Related Keratopathy. Investig. Ophthalmol. Vis. Sci. 2018, 59, 5531–5541. [Google Scholar] [CrossRef] [PubMed]
  14. Diendorfer, A.; Khamina, K.; Pultar, M.; Hackl, M. miND (miRNA NGS Discovery pipeline): A small RNA-seq analysis pipeline and report generator for microRNA biomarker discovery studies. F1000Research 2022, 11, 233. [Google Scholar] [CrossRef] [PubMed]
  15. Alaei, A.; Kakumani, P.K. MicroRNA chemical modifications in post-transcriptional gene silencing and human diseases. Mol. Ther. Nucleic Acids 2025, 36, 102745. [Google Scholar] [CrossRef] [PubMed]
  16. Ha, M.; Kim, V.N. Regulation of microRNA biogenesis. Nat. Rev. Mol. Cell Biol. 2014, 15, 509–524. [Google Scholar] [CrossRef] [PubMed]
  17. O’Brien, J.; Hayder, H.; Zayed, Y.; Peng, C. Overview of MicroRNA Biogenesis, Mechanisms of Actions, and Circulation. Front. Endocrinol. 2018, 9, 402. [Google Scholar] [CrossRef] [PubMed]
  18. Abbasi, M.; Amini, M.; Moustardas, P.; Gutsmiedl, Q.; Javidjam, D.; Suiwal, S.; Seitz, B.; Fries, F.N.; Dashti, A.; Rautavaara, Y.; et al. Effects of miR-204-5p modulation on PAX6 regulation and corneal inflammation. Sci. Rep. 2024, 14, 26436. [Google Scholar] [CrossRef] [PubMed]
  19. Amini, M.; Stachon, T.; Hsu, S.L.; Li, Z.; Chai, N.; Fries, F.N.; Seitz, B.; Kundu, S.; Suiwal, S.; Szentmary, N. Effect of MiRNA 204-5P Mimics and Lipopolysaccharide-Induced Inflammation on Transcription Factor Levels, Cell Maintenance, and Retinoic Acid Signaling in Primary Limbal Epithelial Cells. Int. J. Mol. Sci. 2025, 26, 3809. [Google Scholar] [CrossRef] [PubMed]
  20. Yongblah, K.; Alford, S.C.; Ryan, B.C.; Chow, R.L.; Howard, P.L. Protecting Pax6 3’ UTR from MicroRNA-7 Partially Restores PAX6 in Islets from an Aniridia Mouse Model. Mol. Ther. Nucleic Acids 2018, 13, 144–153. [Google Scholar] [CrossRef] [PubMed]
  21. Nastaranpour, M.; Suiwal, S.; Stachon, T.; Fries, F.N.; Amini, M.; Seitz, B.; Meese, E.; Ludwig, N.; Szentmary, N. miRNA Expression Profile in Primary Limbal Epithelial Cells of Aniridia Patients. Investig. Ophthalmol. Vis. Sci. 2025, 66, 20. [Google Scholar] [CrossRef] [PubMed]
  22. Lent-Schochet, D.; Akbar, M.; Hou, J.H.; Farooq, A.V. Diagnostic approach to limbal stem cell deficiency. Front. Ophthalmol. 2024, 4, 1524595. [Google Scholar] [CrossRef] [PubMed]
  23. Latta, L.; Ludwig, N.; Krammes, L.; Stachon, T.; Fries, F.N.; Mukwaya, A.; Szentmary, N.; Seitz, B.; Wowra, B.; Kahraman, M.; et al. Abnormal neovascular and proliferative conjunctival phenotype in limbal stem cell deficiency is associated with altered microRNA and gene expression modulated by PAX6 mutational status in congenital aniridia. Ocul. Surf. 2021, 19, 115–127. [Google Scholar] [CrossRef] [PubMed]
  24. Szentmary, N.; Suiwal, S.; Amini, M.; Fries, F.N.; Naray, A.; Latta, L.; Li, Z.; Li, S.; Liu, S.; Hsu, S.L.; et al. Aniridia-associated keratopathy: Clinical and molecular mechanisms of disease progression and emerging therapeutic targets. Acta Ophthalmol. 2026. Early View. [Google Scholar] [CrossRef] [PubMed]
  25. Ramos, T.; Parekh, M.; Kaye, S.B.; Ahmad, S. Epithelial Cell-Derived Extracellular Vesicles Trigger the Differentiation of Two Epithelial Cell Lines. Int. J. Mol. Sci. 2022, 23, 1718. [Google Scholar] [CrossRef] [PubMed]
  26. Latta, L.; Viestenz, A.; Stachon, T.; Colanesi, S.; Szentmary, N.; Seitz, B.; Kasmann-Kellner, B. Human aniridia limbal epithelial cells lack expression of keratins K3 and K12. Exp. Eye Res. 2018, 167, 100–109. [Google Scholar] [CrossRef] [PubMed]
  27. Yoshihara, M.; Kamuro, R.; Hara, S.; Nishida, N.; Ohmoto, K.; Sasamoto, Y.; Kawasaki, S.; Oie, Y.; Nishida, K. Transcriptional landscape of aniridia-associated keratopathy through single-cell RNA sequencing. Ocul. Surf. 2025, 38, 43–52. [Google Scholar] [CrossRef] [PubMed]
  28. Li, W.; Chen, Y.T.; Hayashida, Y.; Blanco, G.; Kheirkah, A.; He, H.; Chen, S.Y.; Liu, C.Y.; Tseng, S.C. Down-regulation of Pax6 is associated with abnormal differentiation of corneal epithelial cells in severe ocular surface diseases. J. Pathol. 2008, 214, 114–122. [Google Scholar] [CrossRef] [PubMed]
  29. Ramaesh, T.; Collinson, J.M.; Ramaesh, K.; Kaufman, M.H.; West, J.D.; Dhillon, B. Corneal abnormalities in Pax6+/− small eye mice mimic human aniridia-related keratopathy. Investig. Ophthalmol. Vis. Sci. 2003, 44, 1871–1878. [Google Scholar] [CrossRef] [PubMed]
  30. Deng, X.; Yu, Z.; Hu, W. Recent advances in the study of FAT family genes in lung cancer. Discov. Oncol. 2025, 16, 1929. [Google Scholar] [CrossRef] [PubMed]
  31. Roppongi, R.T.; Dhume, S.H.; Padmanabhan, N.; Silwal, P.; Zahra, N.; Karimi, B.; Bomkamp, C.; Patil, C.S.; Champagne-Jorgensen, K.; Twilley, R.E.; et al. LRRTMs Organize Synapses through Differential Engagement of Neurexin and PTPsigma. Neuron 2020, 106, 108–125.e12. [Google Scholar] [CrossRef] [PubMed]
  32. Love, M.I.; Huber, W.; Anders, S. Moderated estimation of fold change and dispersion for RNA-seq data with DESeq2. Genome Biol. 2014, 15, 550. [Google Scholar] [CrossRef] [PubMed]
  33. Davis, J.; Duncan, M.K.; Robison, W.G., Jr.; Piatigorsky, J. Requirement for Pax6 in corneal morphogenesis: A role in adhesion. J. Cell Sci. 2003, 116, 2157–2167. [Google Scholar] [CrossRef] [PubMed]
  34. Le, Q.; Deng, S.X.; Xu, J. In vivo confocal microscopy of congenital aniridia-associated keratopathy. Eye 2013, 27, 763–766. [Google Scholar] [CrossRef] [PubMed]
  35. Zhang, Y.; Yeh, L.K.; Zhang, S.; Call, M.; Yuan, Y.; Yasunaga, M.; Kao, W.W.; Liu, C.Y. Wnt/beta-catenin signaling modulates corneal epithelium stratification via inhibition of Bmp4 during mouse development. Development 2015, 142, 3383–3393. [Google Scholar] [CrossRef] [PubMed]
  36. Ramaesh, T.; Ramaesh, K.; Leask, R.; Springbett, A.; Riley, S.C.; Dhillon, B.; West, J.D. Increased apoptosis and abnormal wound-healing responses in the heterozygous Pax6+/− mouse cornea. Investig. Ophthalmol. Vis. Sci. 2006, 47, 1911–1917. [Google Scholar] [CrossRef] [PubMed]
  37. Wu, J.; Zhang, D.; Wu, J.; Zhang, S. Construction of ceRNA network and identification of hub genes in aniridia-associated keratopathy using bioinformatics analysis. Front. Genet. 2022, 13, 997581. [Google Scholar] [CrossRef] [PubMed]
  38. Huang, J.; Zhao, Y.; Guan, J.; Zhang, X.; Wu, D. PHLPP: A Janus-faced regulator in oncogenesis. Biochem. Biophys. Res. Commun. 2026, 795, 153104. [Google Scholar] [CrossRef] [PubMed]
  39. Bartl, T.; Cacsire Castillo-Tong, D. Targeting RAS-RAF-MEK-ERK signaling in mucinous ovarian cancer: A translational evidence synthesis and clinical framework. Int. J. Gynecol. Cancer 2026, 36, 104485. [Google Scholar] [CrossRef] [PubMed]
  40. Kulkarni, B.B.; Tighe, P.J.; Mohammed, I.; Yeung, A.M.; Powe, D.G.; Hopkinson, A.; Shanmuganathan, V.A.; Dua, H.S. Comparative transcriptional profiling of the limbal epithelial crypt demonstrates its putative stem cell niche characteristics. BMC Genom. 2010, 11, 526. [Google Scholar] [CrossRef] [PubMed]
  41. Yang, L.M.; Zheng, Q.; Liu, X.J.; Li, X.X.; Veronica, L.; Chen, Q.; Zhao, Z.H.; Wang, S.Y. Exosome-Transmitted miR-224-5p Promotes Colorectal Cancer Cell Proliferation via Targeting ULK2 in p53-Dependent Manner. Biomed. Environ. Sci. 2024, 37, 71–84. [Google Scholar] [CrossRef] [PubMed]
  42. Chen, C.; Zhao, J.; Qiu, B. HCC control by lycorine-based restraining of the MiR-224-5p/COLEC10 axis. Pak. J. Pharm. Sci. 2024, 37, 1093–1105. [Google Scholar] [PubMed]
  43. Min, M.; Chen, X.B.; Wang, P.; Landeck, L.; Chen, J.Q.; Li, W.; Cai, S.Q.; Zheng, M.; Man, X.Y. Role of keratin 24 in human epidermal keratinocytes. PLoS ONE 2017, 12, e0174626. [Google Scholar] [CrossRef] [PubMed]
  44. Andersson, N.; Ohlsson, J.; Wahlin, S.; Nodin, B.; Boman, K.; Lundgren, S.; Jirstrom, K. Lymphocyte antigen 6 superfamily member D is a marker of urothelial and squamous differentiation: Implications for risk stratification of bladder cancer. Biomark. Res. 2020, 8, 51. [Google Scholar] [CrossRef] [PubMed]
  45. Lutz, K.; Musumeci, A.; Sie, C.; Dursun, E.; Winheim, E.; Bagnoli, J.; Ziegenhain, C.; Rausch, L.; Bergen, V.; Luecken, M.D.; et al. Ly6D(+)Siglec-H(+) precursors contribute to conventional dendritic cells via a Zbtb46(+)Ly6D(+) intermediary stage. Nat. Commun. 2022, 13, 3456. [Google Scholar] [CrossRef] [PubMed]
  46. Stachon, T.; Fecher-Trost, C.; Latta, L.; Yapar, D.; Fries, F.N.; Meyer, M.R.; Kasmann-Kellner, B.; Seitz, B.; Szentmary, N. Protein profiling of conjunctival impression cytology samples of aniridia subjects. Acta Ophthalmol. 2023, 102, e635–e645. [Google Scholar] [CrossRef] [PubMed]
  47. Suiwal, S.; Stachon, T.; Kumar, V.; Fries, F.N.; Hsu, S.L.; Liu, S.; Li, S.; Kundu, S.; Seitz, B.; Amini, M.; et al. miR-138-5p overexpression inhibits limbal epithelial cell proliferation and induces cell cycle arrest, in vitro. Exp. Eye Res. 2026, 266, 110934. [Google Scholar] [CrossRef] [PubMed]
  48. Blanco-Kelly, F.; Tarilonte, M.; Villamar, M.; Damian, A.; Tamayo, A.; Moreno-Pelayo, M.A.; Ayuso, C.; Corton, M. Genetics and epidemiology of aniridia: Updated guidelines for genetic study. Arch. Soc. Esp. Oftalmol. (Engl. Ed.) 2021, 96, 4–14. [Google Scholar] [CrossRef] [PubMed]
  49. Stachon, T.; Suiwal, S.; Amini, M.; Corton, M.; Fries, F.N.; Seitz, B.; Ludwig, N.; Rishik, S.; Keller, A.; Szentmary, N. mRNA Sequencing of Limbal Epithelial Cells and mRNA/miRNA Profiling of Limbal Stromal Cells in PAX6-Related Congenital Aniridia. Cells 2026, 15, 340. [Google Scholar] [CrossRef] [PubMed]
  50. Javidjam, D.; Moustardas, P.; Abbasi, M.; Dashti, A.; Rautavaara, Y.; Lagali, N. A human-like model of aniridia-associated keratopathy for mechanistic and therapeutic studies. JCI Insight 2024, 10, e183965. [Google Scholar] [CrossRef] [PubMed]
  51. Eden, U.; Fagerholm, P.; Danyali, R.; Lagali, N. Pathologic epithelial and anterior corneal nerve morphology in early-stage congenital aniridic keratopathy. Ophthalmology 2012, 119, 1803–1810. [Google Scholar] [CrossRef] [PubMed]
  52. Lagali, N.; Eden, U.; Utheim, T.P.; Chen, X.; Riise, R.; Dellby, A.; Fagerholm, P. In vivo morphology of the limbal palisades of vogt correlates with progressive stem cell deficiency in aniridia-related keratopathy. Investig. Ophthalmol. Vis. Sci. 2013, 54, 5333–5342. [Google Scholar] [CrossRef] [PubMed]
  53. Acosta, M.C.; Naray, A.; Csidey, M.; Maka, E.; Nagy, Z.Z.; Javorszky, E.; Zobor, D.; Tory, K.; Corton, M.; Kovacs, I.; et al. Age Impairs Corneal Sensitivity and Reflex Tearing in Congenital Aniridia. Cornea 2026. Early View. [Google Scholar] [CrossRef] [PubMed]
  54. Willems, M.; Vialaret, J.; Girard, M.; Feret, N.; Bremond-Gignac, D.; Chassaing, N.; Kindermans, J.; Fichter, L.; Hirtz, C.; Mollevi, C.; et al. High-performance proteomics reveals immune, epithelial, and vascular dysregulation underlying lacrimal fluid defects in patients with aniridia. BMC Ophthalmol. 2026. Early View. [Google Scholar] [CrossRef] [PubMed]
  55. Qiu, M.; Yu, X.; Liu, H.; Tao, Y.; Huang, C.; Xi, Y.; Liao, Q. Emerging insights into enhancer RNAs: Biogenesis, function, mechanism, and disease implication. Brief. Bioinform. 2026, 27, bbaf700. [Google Scholar] [CrossRef] [PubMed]
  56. Lee, H.; Khan, R.; O’Keefe, M. Aniridia: Current pathology and management. Acta Ophthalmol. 2008, 86, 708–715. [Google Scholar] [CrossRef] [PubMed]
  57. Ihnatko, R.; Eden, U.; Fagerholm, P.; Lagali, N. Congenital Aniridia and the Ocular Surface. Ocul. Surf. 2016, 14, 196–206. [Google Scholar] [CrossRef] [PubMed]
  58. Chen, K.; Li, Y.; Zhang, X.; Ullah, R.; Tong, J.; Shen, Y. The role of the PI3K/AKT signalling pathway in the corneal epithelium: Recent updates. Cell Death Dis. 2022, 13, 513. [Google Scholar] [CrossRef] [PubMed]
  59. Li, Z.; Han, Y.; Ji, Y.; Sun, K.; Chen, Y.; Hu, K. The effect of a-Lipoic acid (ALA) on oxidative stress, inflammation, and apoptosis in high glucose-induced human corneal epithelial cells. Graefes Arch. Clin. Exp. Ophthalmol. 2023, 261, 735–748. [Google Scholar] [CrossRef] [PubMed]
  60. Guo, X.F.; Wang, L.L.; Zheng, F.M.; Li, H.P. PAX6 enhances Nanog expression by inhibiting NOTCH signaling to promote malignant properties in small cell lung cancer cells. Heliyon 2025, 11, e41795. [Google Scholar] [CrossRef] [PubMed]
  61. Liu, X.; Gao, Z.; Chen, M.; Chen, F.; Li, X.; Hu, L. TNFRSF9 Inhibits Pancreatic Cancer Progression by Regulating PAX6-mediated Cell Proliferation, Migration, and Apoptosis. Pancreas 2025, 54, e705–e718. [Google Scholar] [CrossRef] [PubMed]
  62. Li, J.; Wang, F.L.; Yang, T.T.; Yu, X.L.; Cai, Q.R.; Ye, Q.N.; Zhang, S.; Wang, Q.; Dong, H.W.; Liu, J.R. beta-ionone synergizes with 5-Fluorouracil to inhibit gastric cancer progression through PAX6-mediated cell cycle arrest. BMC Cancer 2026, 26, 192. [Google Scholar] [CrossRef] [PubMed]
  63. Luo, Q.; Fu, L.; Zhang, J.; Zhang, S.; Wu, L.; Zhu, Q.; Huang, B. PAX6 Downregulation Triggers HIF-1alpha-Mediated Ferroptosis in Glioma Cells. Biomolecules 2025, 15, 1462. [Google Scholar] [CrossRef] [PubMed]
  64. Bhardwaj, V.; Heyne, S.; Sikora, K.; Rabbani, L.; Rauer, M.; Kilpert, F.; Richter, A.S.; Ryan, D.P.; Manke, T. snakePipes: Facilitating flexible, scalable and integrative epigenomic analysis. Bioinformatics 2019, 35, 4757–4759. [Google Scholar] [CrossRef] [PubMed]
  65. Dobin, A.; Davis, C.A.; Schlesinger, F.; Drenkow, J.; Zaleski, C.; Jha, S.; Batut, P.; Chaisson, M.; Gingeras, T.R. STAR: Ultrafast universal RNA-seq aligner. Bioinformatics 2013, 29, 15–21. [Google Scholar] [CrossRef] [PubMed]
  66. Liao, Y.; Smyth, G.K.; Shi, W. featureCounts: An efficient general purpose program for assigning sequence reads to genomic features. Bioinformatics 2014, 30, 923–930. [Google Scholar] [CrossRef] [PubMed]
  67. Ewels, P.; Magnusson, M.; Lundin, S.; Kaller, M. MultiQC: Summarize analysis results for multiple tools and samples in a single report. Bioinformatics 2016, 32, 3047–3048. [Google Scholar] [CrossRef] [PubMed]
  68. Fehlmann, T.; Kern, F.; Laham, O.; Backes, C.; Solomon, J.; Hirsch, P.; Volz, C.; Muller, R.; Keller, A. miRMaster 2.0: Multi-species non-coding RNA sequencing analyses at scale. Nucleic Acids Res. 2021, 49, W397–W408. [Google Scholar] [CrossRef] [PubMed]
  69. Kozomara, A.; Birgaoanu, M.; Griffiths-Jones, S. miRBase: From microRNA sequences to function. Nucleic Acids Res. 2019, 47, D155–D162. [Google Scholar] [CrossRef] [PubMed]
  70. Kern, F.; Aparicio-Puerta, E.; Li, Y.; Fehlmann, T.; Kehl, T.; Wagner, V.; Ray, K.; Ludwig, N.; Lenhof, H.P.; Meese, E.; et al. miRTargetLink 2.0-interactive miRNA target gene and target pathway networks. Nucleic Acids Res. 2021, 49, W409–W416. [Google Scholar] [CrossRef] [PubMed]
Figure 1. Volcano plot and heatmaps for the differentially expressed mRNAs (A,B) and miRNAs (C,D) in corneal IC samples of aniridia subjects versus controls. The volcano plots display the −log10 (adjusted p-values) from the t-test on the Y-axis and the log2 (fold change) on the X-axis. mRNAs or miRNAs with a log2 (fold change) > 1 and a p-value < 0.05 were considered upregulated, and with a log2 (fold change) < −1 and a p-value < 0.05 were considered downregulated in corneal IC samples from patients with aniridia (A,C). Heatmap rows are identified by Entrez gene names or official miRNA names. Intensities are shown by a color range from red (row max) to white (row average) and blue (row minimum) (B,D).
Ijms 27 06088 g001
Figure 2. miRNA–mRNA regulatory network in corneal impression cytology (IC) samples from patients with congenital aniridia (CA). Red nodes represent differentially expressed miRNAs. Green nodes indicate experimentally validated target genes that are also differentially expressed in corneal IC samples from patients with CA, whereas blue nodes represent experimentally validated target genes that are not differentially expressed. Edges denote validated regulatory interactions between miRNAs and their target genes. Target genes were identified using the online database miRTarLink 2.0 (https://ccb-compute.cs.uni-saarland.de/mirtargetlink2; accessed on 10 January 2026).
Ijms 27 06088 g002
Figure 3. The protein–protein interaction (PPI) network and top 10 hub genes of differently expressed genes (A,B) and target genes regulated by differently expressed microRNAs (C,D) in aniridia corneal IC samples. In the PPI network corresponding to DEGs, a total of 686 nodes and 1568 edges were identified (A) and in the PPI network of target genes regulated by differentially expressed microRNAs, a total of 296 nodes and 4526 edges were identified (C). The color depth refers to the rank of hub genes generated with multiple correlation clustering (MCC) (B,D).
Ijms 27 06088 g003
Figure 4. Top 30 Gene Ontology (GO) enrichment terms of differentially expressed mRNAs in aniridia corneal IC samples. The X-axis represents −log10 (p-value), and the Y-axis represents the different GO terms.
Ijms 27 06088 g004
Figure 5. Top 30 Gene Ontology (GO) enrichment terms of target genes regulated by differentially expressed miRNAs in aniridia corneal IC samples. Target genes regulated by differentially expressed miRNAs were identified by using the online tool miRTarLink 2.0 (https://ccb-compute.cs.uni-saarland.de/mirtargetlink2; accessed on 10 January 2026). Only target interactions with strong experimental validation were included, such as those confirmed by luciferase reporter assays, immunohistochemistry, microarray analysis, real-time quantitative PCR (RT-qPCR), and Western blotting. The X-axis represents −log10(p-value), and the Y-axis represents the different GO terms.
Ijms 27 06088 g005
Figure 6. Bubble plot of top 20 Kyoto Encyclopedia of Genes and Genomes (KEGG) enrichment pathway of differentially expressed mRNAs. KEGG pathway enrichment analysis was performed using the set of differentially expressed mRNAs identified in corneal impression cytology samples. In the bubble plot, the size of each circle represents the number of genes associated with the corresponding pathway, while the color of the circle indicates the p-value, reflecting the statistical significance of pathway enrichment.
Ijms 27 06088 g006
Figure 7. Bubble plot of top 20 Kyoto Encyclopedia of Genes and Genomes (KEGG) enrichment pathway of target genes regulated by differentially expressed miRNAs. Target genes regulated by differentially expressed miRNAs were identified by using the online tool miRTarLink 2.0 (https://ccb-compute.cs.uni-saarland.de/mirtargetlink2; accessed on 10 January 2026). Only target interactions with strong experimental validation were included, such as those confirmed by luciferase reporter assays, immunohistochemistry, microarray analysis, real-time quantitative PCR (RT-qPCR), and Western blotting. The number of genes was represented by the size of the circle, and the p-value was represented by the color of the circle.
Ijms 27 06088 g007
Figure 8. RT-qPCR validation results of PAX6, miR-204-5p, and miR-138-5p expression levels in corneal impression cytology (IC) samples from healthy controls and patients with aniridia (n = 8). Expression levels were quantified by RT-qPCR and are presented on a logarithmic scale (log2). Statistical comparisons between aniridia and healthy control samples were performed using the Mann–Whitney test. The expression levels of miR-204-5p and miR-138-5p were significantly reduced in aniridia IC samples compared with healthy controls (p = 0.013 and p = 0.019, respectively), whereas PAX6 expression showed no significant difference (p = 0.593). Significant p-values (<0.05) are indicated in the plots.
Ijms 27 06088 g008
Figure 9. Procedure for collecting corneal impression cytology (IC) samples. Topical anesthesia was achieved by instilling 0.5% proparacaine hydrochloride eye drops into the conjunctival sac (1). Corneal IC samples were subsequently obtained using the EYEPRIM™ device (OPIA Technologies, Paris, France) (2). The applicator was carefully positioned on the corneal surface, aligned from the central cornea toward the inferior limbus. Light, steady pressure was applied for about 2–3 s, after which the device was gently lifted perpendicular to the surface to collect the sample. The membrane containing corneal surface cells was immediately transferred into lysis buffer provided with the DNA/RNA/Protein Purification Kit Micro (Norgen Biotek Corp., Thorold, ON, Canada) (3) and stored at −80 °C until RNA isolation.
Ijms 27 06088 g009
Table 1. Top 20 upregulated and downregulated differentially expressed genes (DEGs) in corneas of patients with congenital aniridia.
UpregulatedDownregulated
Genelog2FCAdjusted
p-Value
Genelog2FCAdjusted
p-Value
OLFM44.760530.00097KRT3−6.721646.12 × 10−18
S100A74.718306.67 × 10−10FAT3−6.486927.16 × 10−11
BPIFB14.610290.00033JCHAIN−6.480130.01193
SULT1E14.417963.67 × 10−5TRIM71−6.313132.46 × 10−6
CXCL64.404991.99 × 10−11FIBCD1−5.681069.62 × 10−7
SLC5A54.028872.27 × 10−5KRT12−5.654573.61 × 10−17
CCDC1903.892062.27 × 10−6LRRTM3−5.529530.00025
CYP1A13.444650.04616NTF3−5.524311.90 × 10−8
GALNT83.337066.94 × 10−5NRN1−5.442935.70 × 10−7
BPIFB23.302470.00260MGARP−5.398037.65 × 10−9
HAS23.270810.01365TMEM100−5.362462.27 × 10−6
LY6D3.075742.92 × 10−7CLC−5.243813.73 × 10−5
SOX213.027403.11 × 10−7KRT27−5.114148.43 × 10−10
CELA3B2.990180.02642TRPM3−5.093504.70 × 10−9
TSPAN82.939990.00016AMPH−4.982891.99 × 10−11
PCDHB122.903630.02331PID1−4.931853.23 × 10−14
CXCL32.901933.17 × 10−5KRT24−4.861912.18 × 10−5
SORCS22.888250.00580BGN−4.801527.65 × 10−9
PTPRZ12.835041.57 × 10−7WSCD2−4.617200.00059
BMPR1B2.832313.25 × 10−11LSAMP−4.583500.00041
Table 2. Upregulated and downregulated microRNAs in corneas of patients with congenital aniridia.
UpregulatedDownregulated
Genelog2FCAdjusted
p-Value
Genelog2FCAdjusted
p-Value
hsa-miR-224-5p3.400720.00433hsa-miR-204-5p−3.844170.00586
hsa-miR-224-3p3.307410.00252hsa-miR-204-3p−3.219190.00505
hsa-miR-452-5p2.812660.00586hsa-miR-138-5p−3.101400.00496
hsa-miR-147b-3p2.035030.00586hsa-miR-135a-5p−2.741950.01066
hsa-miR-767-5p2.002730.00252hsa-miR-139-5p−2.739710.00342
hsa-miR-45211.399370.01336hsa-miR-181a-3p−2.717866.92 × 10−5
hsa-miR-147a1.042160.00636hsa-miR-181b-5p−2.000470.00252
hsa-miR-92b-5p1.037850.04323hsa-miR-708-5p−1.971120.03898
hsa-miR-181a-5p−1.863900.00282
hsa-miR-184−1.710500.04126
hsa-miR-708-3p−1.632160.00505
Table 3. Exploratory correlation analysis of the expression levels of the top 20 differentially expressed mRNAs with age and aniridia-associated keratopathy (AAK) grade 1.
UpregulatedDownregulated
Correlation with AgeCorrelation with AAK Grade Correlation with AgeCorrelation with AAK Grade
AniridiaControlAniridia AniridiaControlAniridia
mRNAr p adj rp adjrp adjmRNArp adjrp adjrp adj
OLFM40.3560.602−0.5100.6540.3790.603KRT30.1020.883−0.1160.956−0.1460.824
S100A70.2590.7380.0150.9880.5970.265FAT30.0970.8740.1120.939−0.2200.828
BPIFB10.0640.945−0.288>0.9990.4440.449JCHAIN0.1880.798−0.6330.710−0.016>0.999
SULT1E10.5800.2590.1270.9480.3910.603TRIM71−0.003>0.999−0.1440.918−0.052>0.999
CXCL60.4710.455−0.327>0.9990.6820.112FIBCD10.001>0.9990.0770.9060.001>0.999
SLC5A50.7090.115−0.0780.9300.5570.203KRT12−0.4130.474−0.2700.998−0.5640.217
CCDC1900.0330.986−0.6280.3780.1230.872LRRTM3−0.1730.9520.407>0.999−0.2530.816
CYP1A1−0.2790.7300.1030.9520.1810.854NTF3−0.1600.864−0.2570.997−0.3070.680
GALNT80.6220.265−0.1560.9460.2210.808NRN10.4870.4560.2190.8210.3830.559
BPIFB2−0.1060.925−0.0930.9120.2060.832MGARP0.009>0.999−0.1690.938−0.4790.388
HAS20.2410.402−0.295>0.9990.7280.078TMEM1000.3110.714−0.1040.9360.072>0.999
LY6D0.4350.4820.424>0.9990.8090.026CLC−0.4150.571−0.302>0.999−0.2530.788
SOX21−0.0620.927−0.2480.920−0.0620.980KRT27−0.4010.475−0.2530.9560.030>0.999
CELA3B0.1540.8520.0340.9700.2510.811TRPM3−0.3200.261−0.0990.923−0.3060.709
TSPAN8−0.1020.911−0.0070.9880.1090.888AMPH−0.3050.6710.2440.888−0.3140.717
PCDHB120.5920.284−0.2180.7910.1770.802PID1−0.2360.412−0.2260.830−0.1920.847
CXCL30.2430.761−0.5960.3660.1780.831KRT24−0.7960.0420.1560.914−0.5740.230
SORCS20.2040.7700.2850.9930.2750.750BGN0.2770.7020.2350.8350.2420.802
PTPRZ10.5060.446−0.2400.8600.5730.276WSCD20.1320.9120.298>0.9990.0770.992
BMPR1B0.4600.4430.0330.9900.3170.766LSAMP−0.4140.5120.297>0.9990.021>0.999
1 Spearman correlation analyses were performed to assess associations between differentially expressed mRNAs and age as well as AAK grade in aniridia and control samples. Genes are grouped into upregulated and downregulated mRNAs, and correlation coefficients (r) together with false discovery rate (FDR)-adjusted p-values (p adj) are reported. Significant p-values are shown in bold.
Table 4. Exploratory correlation analysis of miRNA expression levels with age and aniridia-associated keratopathy (AAK) grade 1.
UpregulatedDownregulated
Correlation with AgeCorrelation with AAK Grade Correlation with AgeCorrelation with AAK Grade
AniridiaControlAniridia AniridiaControlAniridia
miRNAr p adj rp adjrp adjmiRNArp adjrp adjrp adj
hsa-miR-224-5p0.5830.295−0.297>0.9990.7560.038hsa-miR-204-5p−0.5570.2610.0330.916−0.5940.073
hsa-miR-224-3p0.4820.197−0.2040.9170.7350.025hsa-miR-204-3p−0.6520.256−0.363>0.999−0.7490.029
hsa-miR-452-5p0.4200.286−0.367>0.9990.7240.019hsa-miR-138-5p−0.3980.275−0.1960.867−0.5020.166
hsa-miR-147b-3p−0.1590.617−0.0730.960−0.0280.927hsa-miR-135a-5p−0.3470.353−0.081>0.999−0.2500.460
hsa-miR-767-5p−0.2960.4410.342>0.9990.1710.621hsa-miR-139-5p0.2900.425−0.446>0.999−0.3050.454
hsa-miR-45210.4930.2040.086>0.9990.2910.421hsa-miR-181a-3p−0.5060.212−0.0680.917−0.3680.371
hsa-miR-147a−0.0310.918−0.0420.941−0.2800.419hsa-miR-181b-5p−0.2610.434−0.284>0.999−0.6680.038
hsa-miR-92b-5p−0.2850.4060.2090.999−0.1410.664hsa-miR-708-5p−0.5190.225−0.213>0.999−0.4690.194
hsa-miR-181a-5p−0.2320.471−0.231>0.999−0.6470.044
hsa-miR-184−0.4040.288−0.0810.994−0.3120.477
hsa-miR-708-3p−0.5240.2700.086>0.999−0.3130.425
1 Spearman correlation analysis was performed to assess associations between differentially expressed miRNAs and age as well as AAK grade in aniridia and control samples. miRNAs are grouped into upregulated and downregulated categories. Correlation coefficients (r) and false discovery rate (FDR)-adjusted p-values (p adj) are reported. Significant p-values are shown in bold.
Table 5. Target genes of dysregulated microRNAs in corneas of patients with congenital aniridia.
miRNATarget Genes
hsa-miR-204-5pAP1S2, BCL2L2, BDNF, SERINC3, ELOVL6, TRPM3, SNAI2, BIRC2, MALAT1, EZR, MEIS1, ITPR1, VIM, CDC42, DVL3, FZD1, MAP1LC3B, RAB40B, SMAD4, SIX1, SERP1, CXCR4, CDH1, TCF4, FOXM1, RAB22A, TXNIP, MEIS2, TMPRSS3, JAK2, RUNX2, SIRT1, NTRK2, USP47, IL11, TGFBR2, CYBB, SOX4, HMX1, MAP2K1, MMP9, UCA1, HMGA2, HOXA10, MX1, IGFBP2, EDEM1, M6PR, THRB, TCF12, FOXC1, CREB5, ALPL, SNAI1, BCL2, SPDEF, SOST, EFNB2, CREB1, ANKRD13A
hsa-miR-224-5pDIO1, KRAS, AP2M1, PTX3, API5, PHLPP2, TPD52, CDC42, GSK3B, PEBP1, SMAD4, TCEAL1, DPYSL2, PAK2, KLK10, TRIB1, RAC1, EDNRA, APLN, MBD2, CXCR4, SERPINF2, CDH1, RASSF8, BCL2, CASP3, HOXD10, MTOR, EYA4, PHLPP1, CASP7
hsa-miR-224-3pFUT4, RB1CC1, ATG5
hsa-miR-204-3pRGS5, ATF2, KHDRBS1, PPM1K
hsa-miR-138-5pROCK2, SNAI2, BLCAP, H2AFX, RELN, VIM, EZH2, TERT, RMND5A, CD274, AKT1, NFKB1, ADGRA2, SOX9, S100A1, CDH1, KDM5C, BAG1, HIF1A, CYTOR, CASP3, YAP1, BCL11A, EIF4EBP1, SIRT1, MXD1, RHOC, FOSL1, SOX4, MAP3K11, PTK2, RARA, FOXC1, LCN2, FERMT2, SENP1, CCND3, ZEB2, GNAI2, EID1, SUZ12, CCND1, TWIST2
hsa-miR-452-5pDPYSL2, THRB, CDKN1B, LEF1, KRAS, TCF4, BMI1
hsa-miR-135a-5pVLDLR, ROCK2, MYC, APC, CEBPD, NR3C2, BMPR2, EGFR, FOXO1, PPM1E, PTPRD, TXNIP, DAPK2, E2F1, MMP11, KLF8, JAK2, RUNX2, IRS2, SLC6A4, PHLPP2, MTSS1, PTK2, RBAK, HOXA10, HTR1A, SMAD5, SIAH1, BCL2, KLF4, STAT6, ROCK1, ESRRA
hsa-miR-139-5pROCK2, MMP11, FAM162A, MCL1, NR5A2, SMARCA4, RHOT1, ZHX2, TPD52, WNT1, OIP5, MET, PDE4D, HRAS, NOTCH1, IGF1R, NFKB1, CXCR4, RAP1B, BCL2, ADGRL4, JUN, FOS, ACTC1, PIK3CA
hsa-miR-181a-3pNANOG
hsa-miR-767-5pCOL3A1, FBN1, COL4A1, COL10A1, SPARC, SERPINH1, LOX, COL5A2, MMP2, COL4A2, PDGFRB
hsa-miR-181b-5pSIX2, ATM, CBX7, MCL1, PLAG1, LATS2, TCL1A, MAP3K10, XIAP, GATA6, KPNA4, TIMP3, SPP1, PBX3, RASSF1, E2F1, CYLD, KAT2B, HMGB1, VSNL1, MEG3, PTEN, SIRT1, PDCD10, TMED7, BCL2L11, RNF2, NLK, MAP2K1, IGF1R, ELN, CARD10, RAP1B, BCL2, HK2, GRIA2, PDCD4, FOS, CREB1, CDX2, ADCY9, NFIA
hsa-miR-708-5pCNTFR, TMEM88, PARP1, BIRC5, CD44, AKT2, SMAD3, EZH2, MMP2, BMI1, CD274, AKT1, NNAT, EYA3, CASP2, BCL2, KDM1A, ZEB2, IKBKG, CCND1
hsa-miR-181a-5pSTAT3, EGR1, ATM, DDIT4, TWIST1, PLAG1, TERT, AHR, PGR, GATA6, RUNX1, BAX, PRKCD, PBX3, MAPK1, CDKN1B, RASSF1, SAMHD1, KLF6, MEG3, BCL2L11, ATG5, NLK, ABCG2, RALA, CTDSPL, PROX1, RAP1B, RGS16, CTNNB1, BCL2, DDX3X, PTPN22, CDX2, E2F5, DUSP5, TUSC3, MCL1, RASSF6, XIAP, HRAS, MTMR3, PRAP1, TCF4, PRKN, GPD1L, TGFBRAP1, DUSP6, WIF1, INPP4B, RGS5, KAT2B, PTPN11, ZNF763, SIRT1, KRAS, NRAS, GPR78, PHLPP2, RNF2, PPP3CA, MAP2K1, TIMP1, HIPK2, NOTCH1, COL16A1, CEBPA, IFNG, CDKN1A, TGFBR1, FOS, PTEN
hsa-miR-184PRKCB, MYC, AGO2, EZR, AKT2, PLPP3, AKT1, SOX7, PKM, INPPL1, PPP1R13L, BCL2, TNFAIP2, NFATC2, BIN3, GAS1, SND1, PDGFB, ZFPM2
hsa-miR-708-3pTEX261, OTUB, N4BP1, MPL
hsa-miR-147aHIF3A, VEGFA, MCM3, PSMA3, NDUFA4, SLC22A3
Table 6. Demographic characteristics, aniridia-associated keratopathy (AAK) Grade (according to Lagali et al. [7]) and mutation type of subjects with congenital aniridia and demographic characteristics of controls.
Subjects with Congenital AniridiaHealthy Control Subjects
Donor NumberGenderAge (Years)AAK Grade R/LMutation TypeDonor NumberGenderAge (Years)
1Female231/1Splicing1Male6
2Female161/1Missence2Male2
3Male262/2Nonsense3Female16
4Male574/4Nonsense4Female19
5Male512/2Microdeletion5Female22
6Male111/1Nonsense6Female23
7Female112/2Nonsense7Female42
8Male234/2Frameshift8Female60
9Female234/4Splicing9Female49
10Male252/-Frameshift10Female49
11Male170/0Splicing11Male9
12Female502/2Splicing12Male18
13Female140/0Splicing13Male35
14Female122/2Splicing14Male59
Disclaimer/Publisher’s Note: The statements, opinions and data contained in all publications are solely those of the individual author(s) and contributor(s) and not of MDPI and/or the editor(s). MDPI and/or the editor(s) disclaim responsibility for any injury to people or property resulting from any ideas, methods, instructions or products referred to in the content.