1. Introduction
Drug delivery is an advancing field in biomedicine that aims to increase the therapeutic efficacy. Traditional systems such as tablets, capsules, and various forms of injections use established administration routes [
1,
2] and are readily available but face challenges in terms of solubility, drug release and distribution, which are all associated with off-target toxicity and limited effectiveness [
3,
4]. These limitations are critical in cancer therapy, where drugs are unable to reach the diseased cells effectively, thereby causing systemic side effects, including cardiotoxicity and gastrointestinal toxicity [
5,
6]. As such, modern drug delivery strategies have been explored to overcome these side effects. Among these, quantum dots (QDs) offer solutions by acting as functionalized drug carriers for specific delivery.
QDs are semiconductor nanoparticles that are highly valued for biological applications due to their size and tunable properties. Some common QD types include CdSe/ZnS, CdTe, InP/ZnS, and carbon-based QDs. Each QD is optimized for biological compatibility according to its size, composition, and surface chemistry. Among these, CdSe/ZnS QDs are promising due to their high quantum yield, which enables efficient light emission and real-time observations of biological processes for a long time. Moreover, the ZnS shell can be functionalized for carrying drugs [
7].
Given their unique properties, extensive research has focused on using QDs as drug carriers, biosensors, and imaging probes. However, there are major concerns regarding QD-induced cytotoxicity [
8,
9], and more importantly, their interactions with intracellular proteins remain poorly characterized. QDs non-specifically interact with proteins such as actin, altering the structure of monomeric actin [
10] and disrupting actin dynamics [
11]. This dynamic assembly and disassembly of actin play an essential role in providing the mechanical support and cellular movement [
12]. Subsequently, actin dynamics in cells are regulated not only by actin but also by a network of actin-binding proteins like α-actinin, profilin, cofilin, and tropomyosin [
13]. Among them, α-actinin is a key actin crosslinking protein that bundles and stabilizes actin filaments, playing a pivotal role in muscle contraction and cell motility [
14]. The effects of QDs on actin in the presence of actin-binding proteins such as α-actinin are unknown and considering the importance of actin-binding proteins in actin dynamics, it is crucial to understand how QDs influence these regulatory components.
In addition to the rise of nanomedicine, computational modeling has become an essential tool in modern drug discovery. Computational tools help bridge the gap between experimental data and theoretical understanding. It provides a cost-effective and scalable approach to not only understand protein structure but also study protein–ligand (QDs) interactions at the atomic level via predicting any structural changes and binding affinities. This physics-based modeling further helps simulate complex physiological environment(s) to build on existing knowledge about how nanoparticle properties influence protein dynamics as well as give predictive insight into nanoparticle behavior in vivo.
Despite the growing interest in the biological applications of QDs, their interaction with actin-binding proteins that regulate cytoskeletal organization remains poorly understood. While previous studies have primarily focused on direct QD–actin interactions, it is unclear whether QDs can interact with regulatory proteins such as α-actinin and affect actin dynamics. Therefore, to our knowledge, this is the first study that examines how CdSe/ZnS QDs interact with α-actinin and how it further influences actin structure and dynamics. We integrated biochemical methodologies with computational approaches to characterize QD–α-actinin interactions and assess their effects on actin organization. This study provides new insights into how QDs disrupt cytoskeletal integrity and cause toxicity.
3. Discussion
Here, to our knowledge, this is the first study that reveals that in addition to binding to actin [
10,
11], CdSe/ZnS QDs interact with actin crosslinking protein, α-actinin, and consequently affect actin filament stability. By integrating biochemical experiments and physics-based computational modeling, we provide evidence that QDs disrupt the actin cytoskeleton through both direct interactions with actin and interfering with the intrinsic activity of α-actinin in stabilizing F-actin filaments.
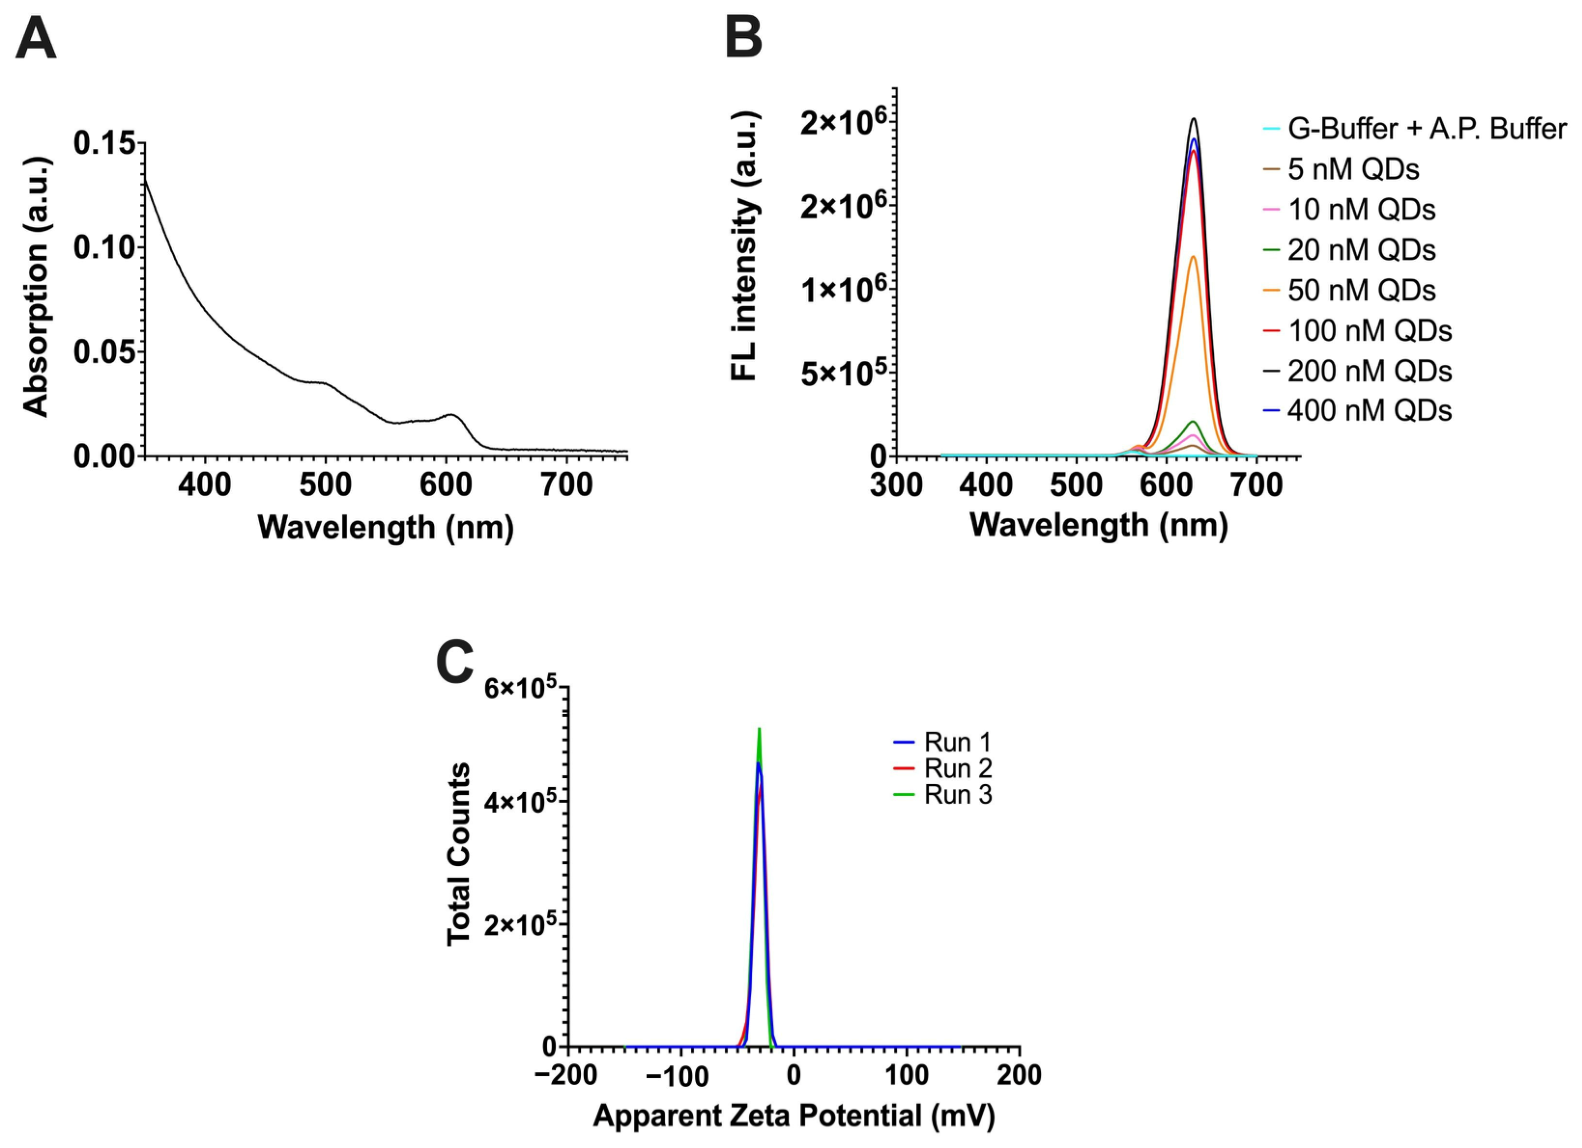
The QDs used in this study have a net negative surface charge of −30.4 mV (
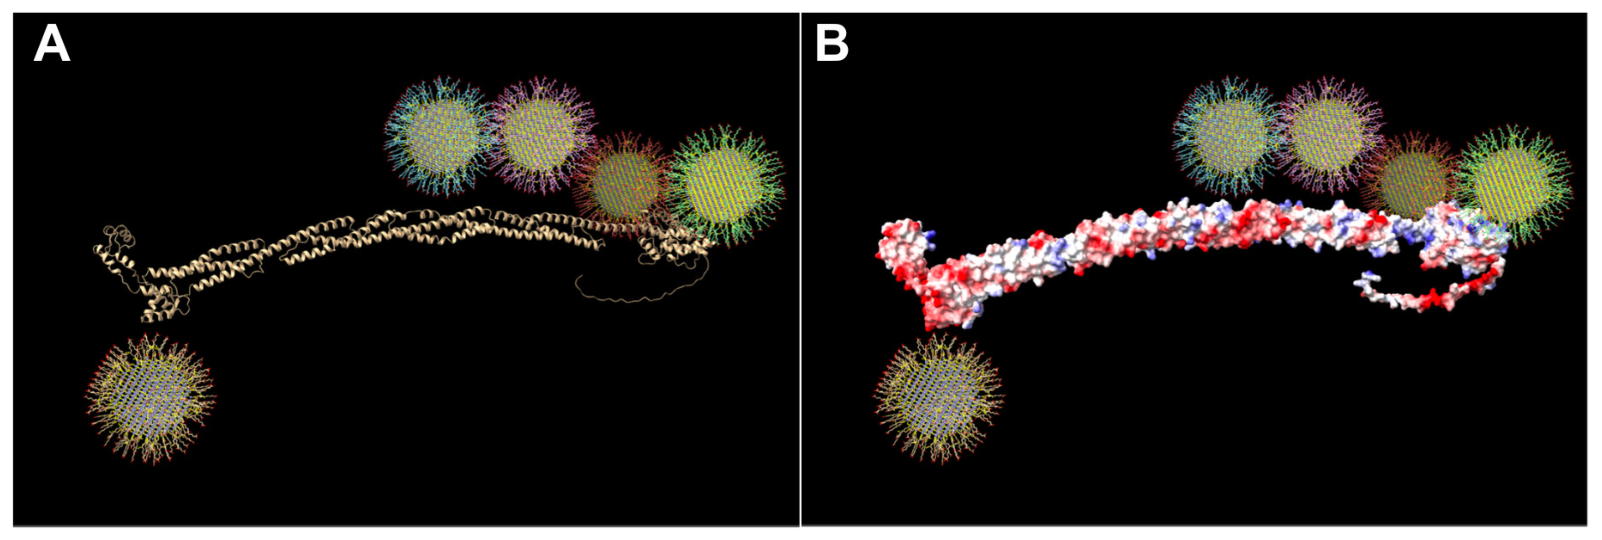
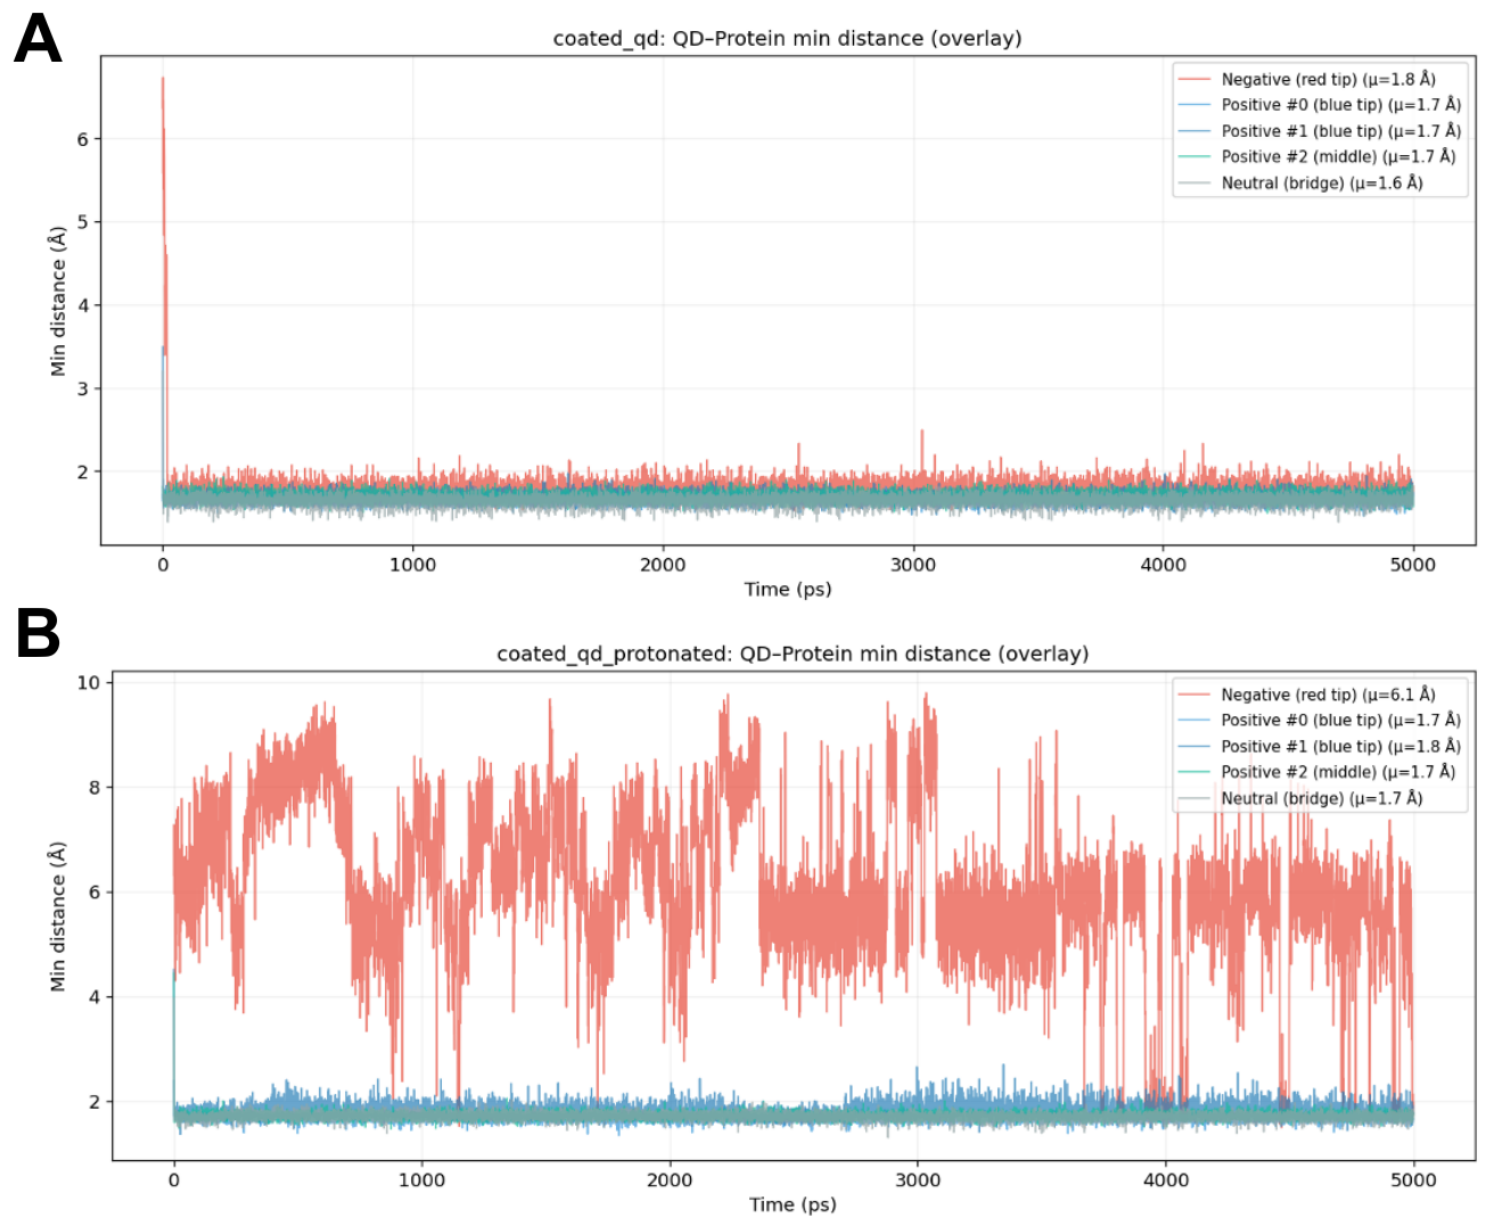
Figure 1C), suggesting their tendency to have electrostatic interactions with positively charged regions of their binding protein partners. Our computational modeling supports this idea, as the predicted binding configurations demonstrated reduced binding distances between the QD carboxylate groups (COO
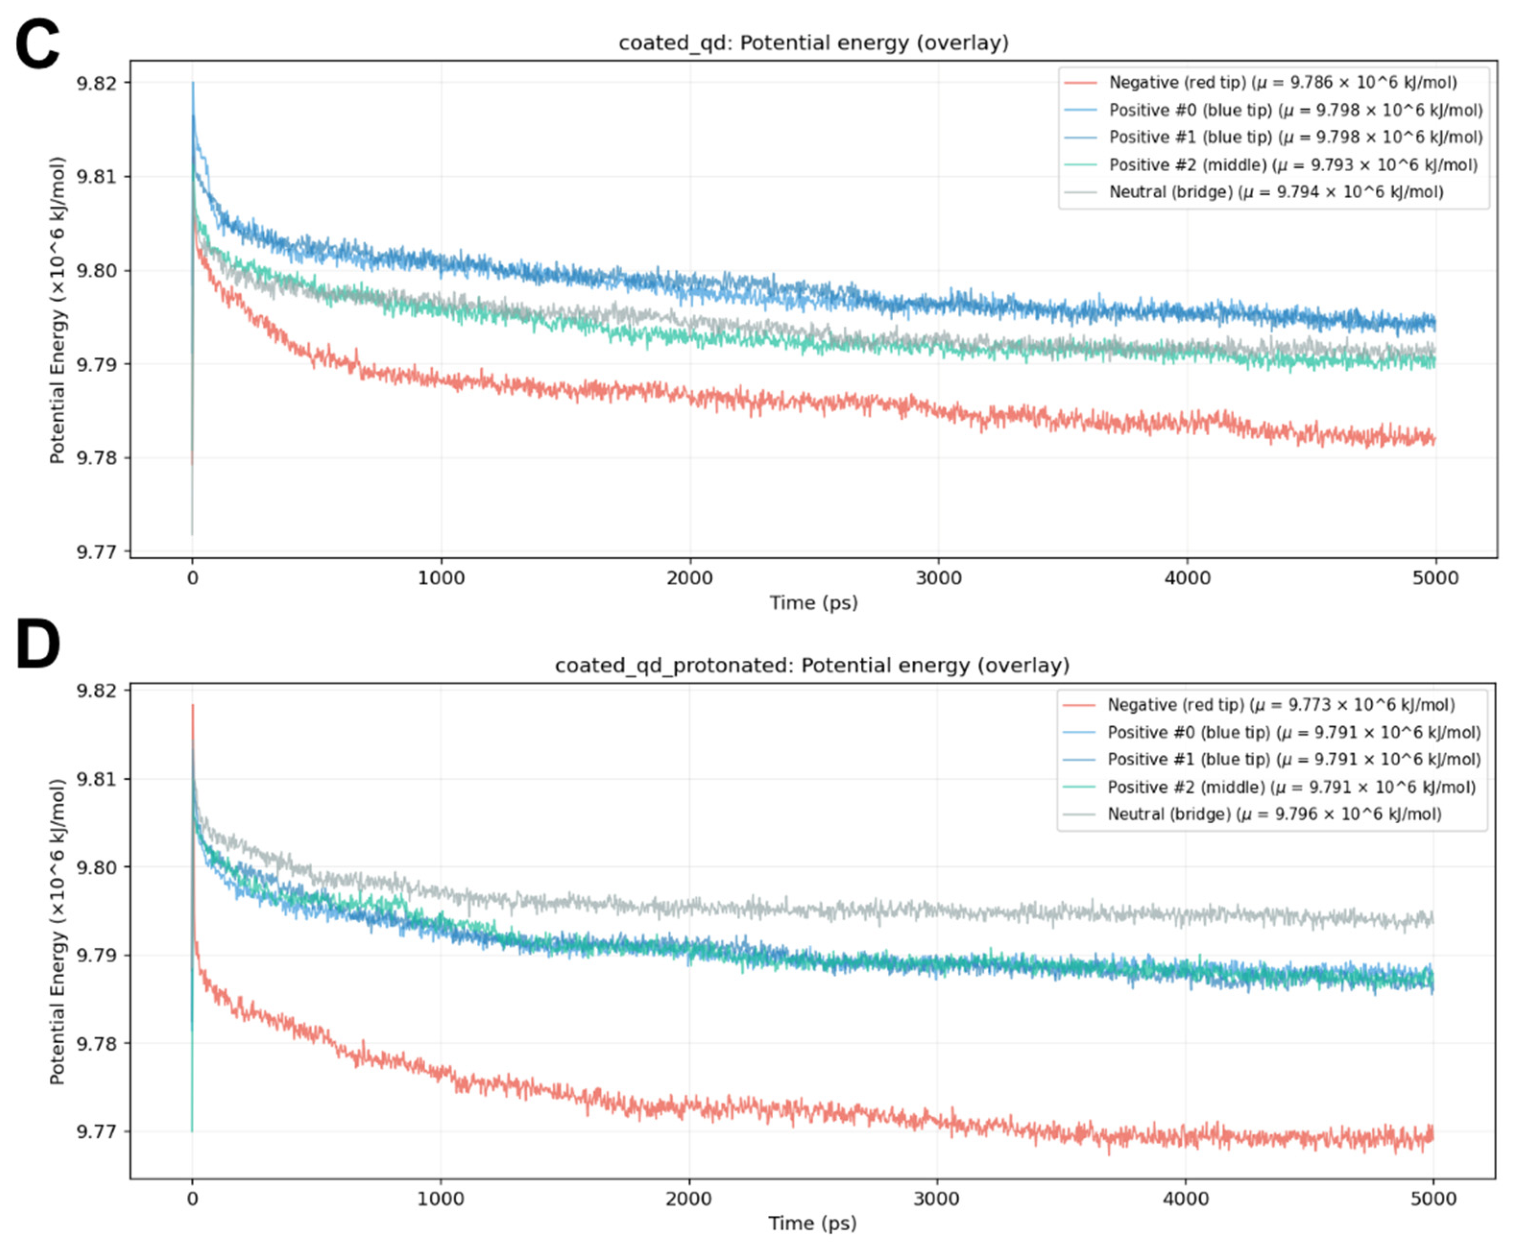
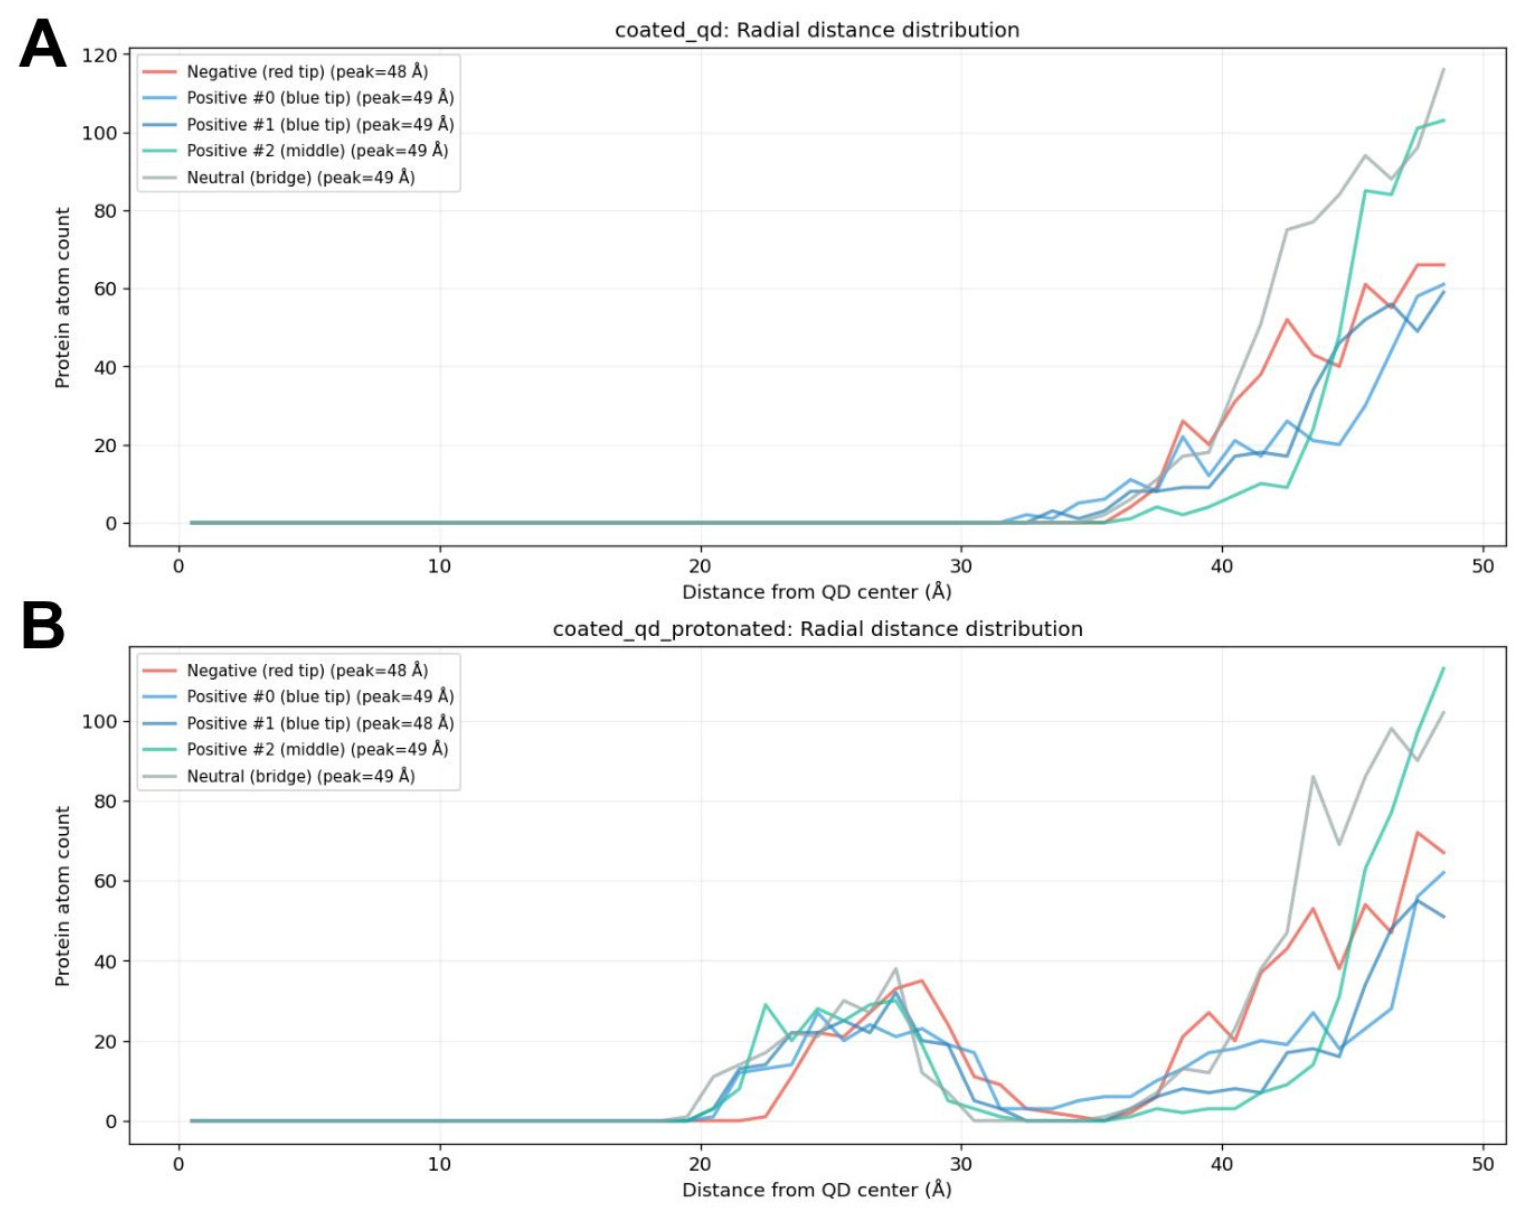
−) and positively charged surfaces on α-actinin compared to the negatively charged surface. This suggests that electrostatic forces are a primary force for QDs–α-actinin interaction. This is further supported by the molecular dynamics simulations where positively charged residues like Arg and Lys contribute strongly to electrostatic protein–ligand interactions and are among the closest residues to the QDs’ surface. That said, we would like to note that the persistence of near-contact distances throughout the simulations suggests that QDs can have stable interactions with α-actinin under physiological conditions. We acknowledge that the 5 ns simulation windows demonstrate kinetic persistence of near-contact configurations rather than fully converged thermodynamic binding affinity; longer timescale simulations or free energy calculations would be required to quantify absolute binding strength. Additionally, our residue proximity to QDs via analyzed trajectories (
Table 1) shows that QDs interact with the actin-binding domain (ABD) of α-actinin. The ABD of α-actinin consists of tandem calponin homology (CH) domains, CH1 and CH2, which tentatively range between residues 26 and 250 [
23]. We speculate that such stable interactions between QDs and α-actinin may cause steric hindrance and interfere with the actin-binding domains of α-actinin, causing QDs to impair α-actinin’s crosslinking function. As such, additional studies and experimental verifications are required to determine whether actin-binding or crosslinking activity is affected.
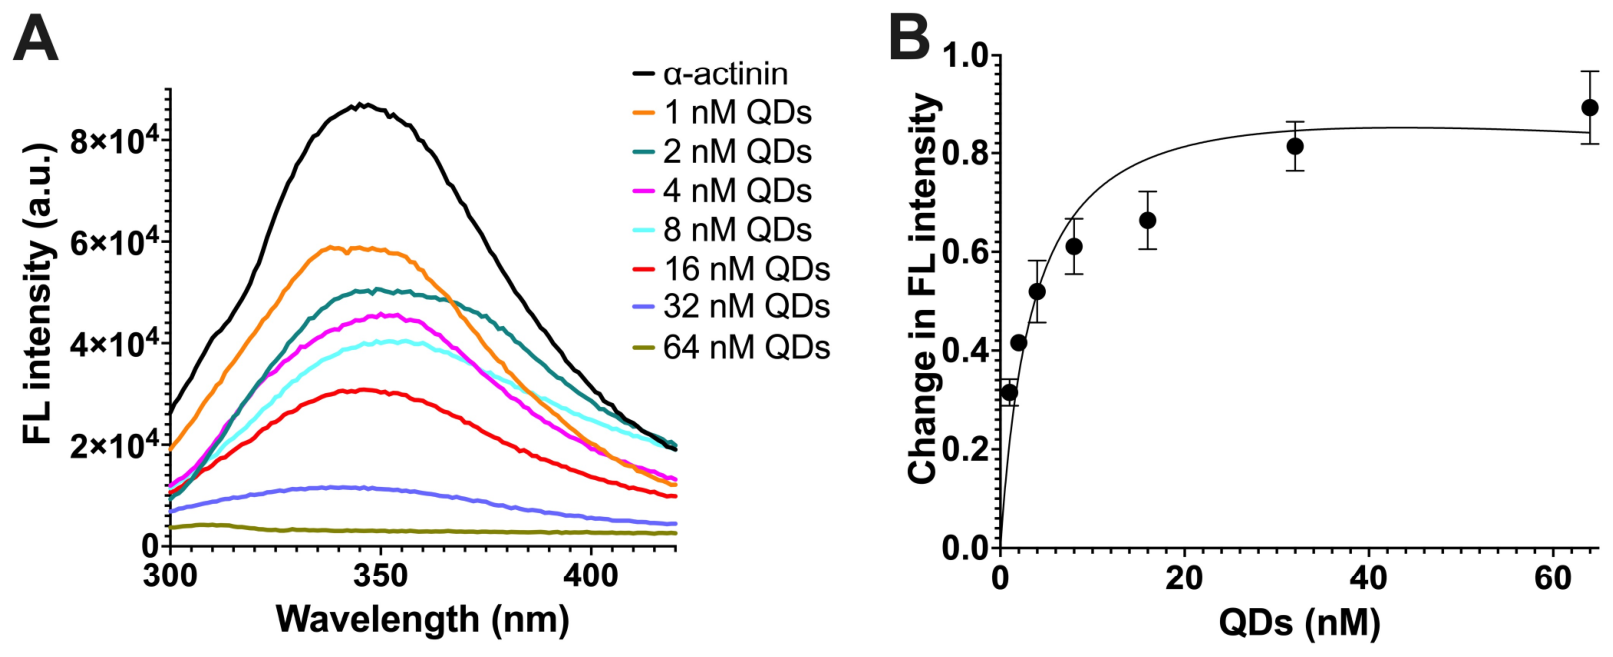
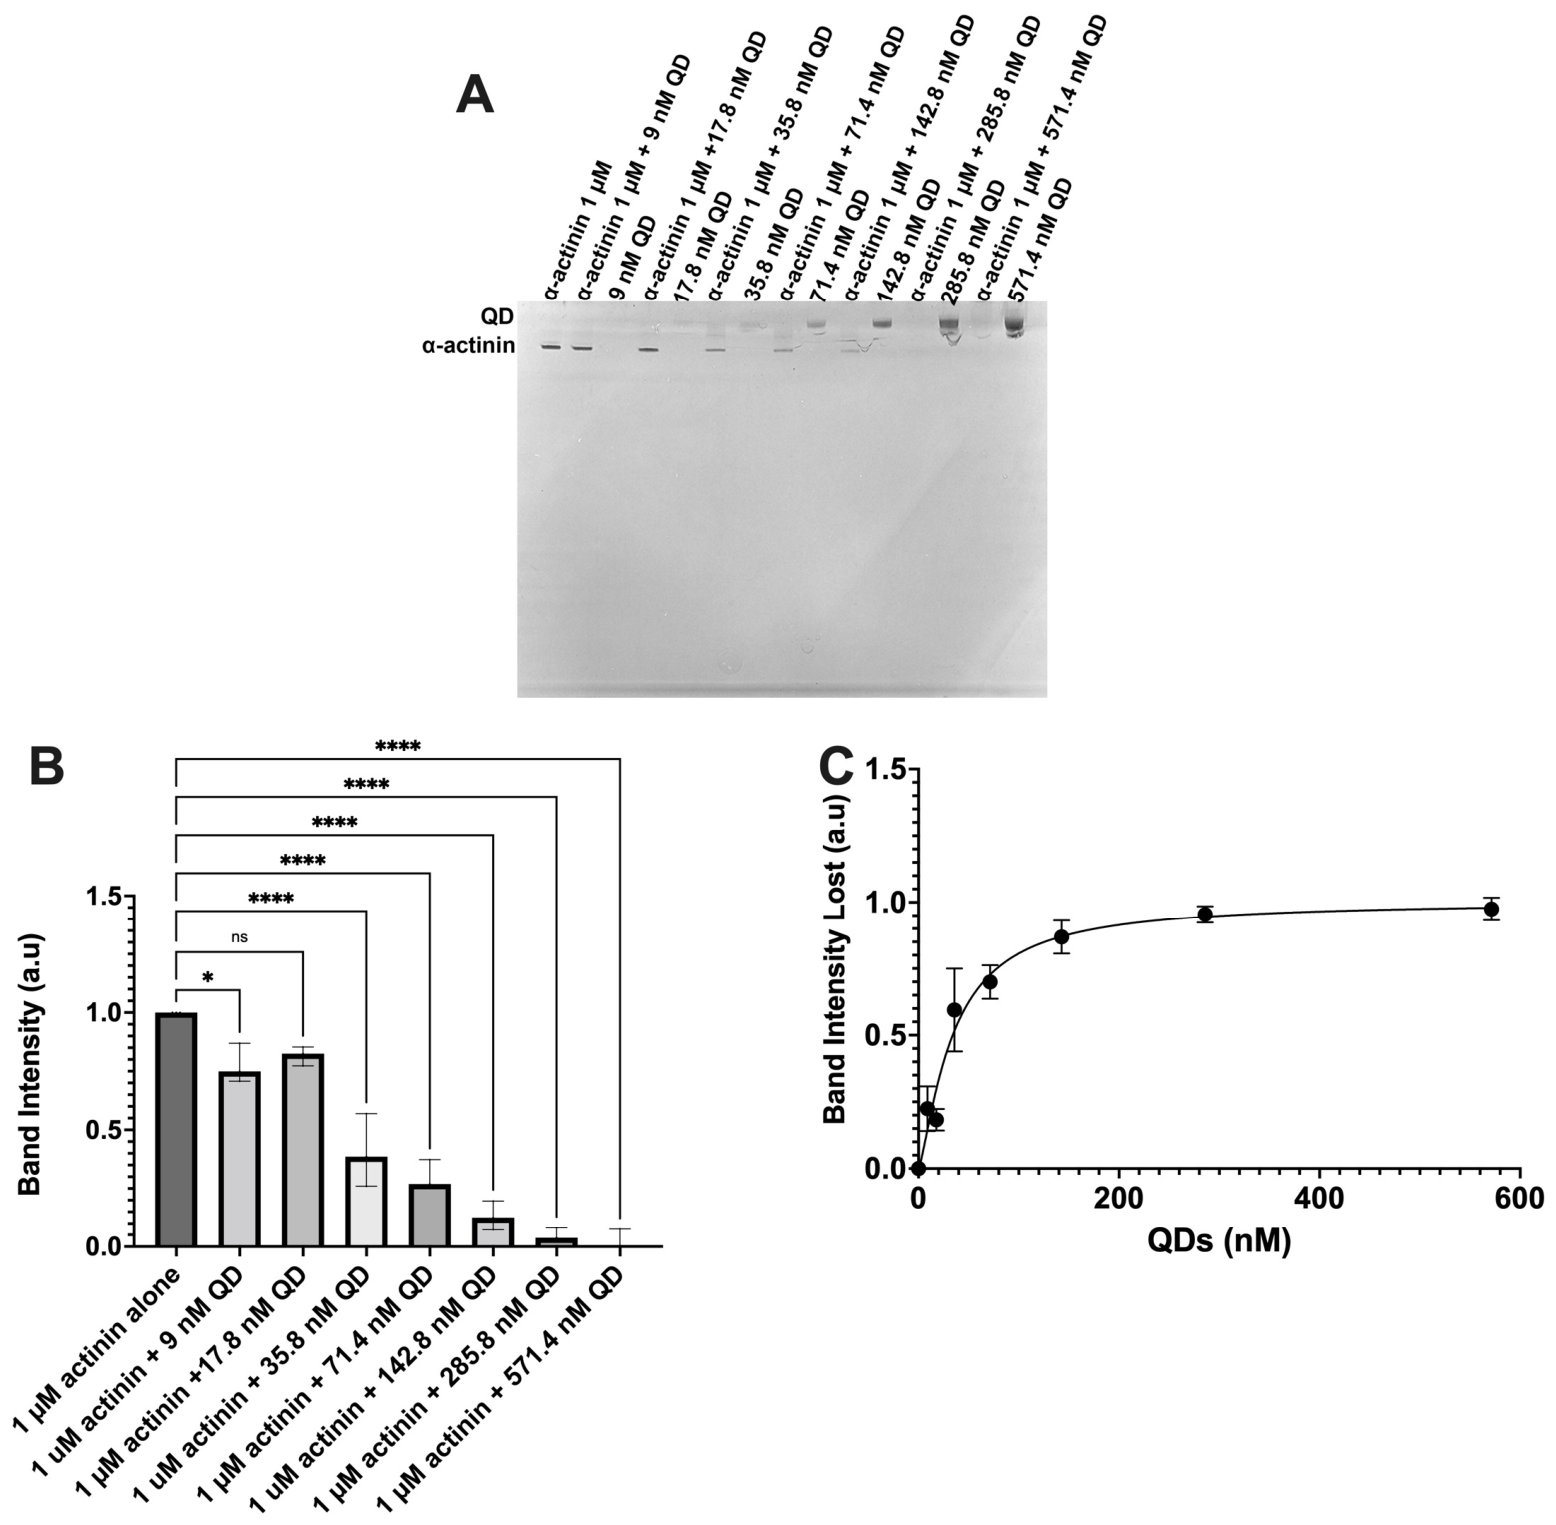
Experimentally, fluorescence quenching and native PAGE assays revealed a dissociation constant (K
d) of 3.7 nM and 34.3 nM, respectively, for QD–α-actinin interaction. This binding affinity is substantially higher than the K
d of 400 nM between QDs and globular actin (G-actin) reported by Le et al., which was determined by a native PAGE [
10]. There are several factors that may account for this difference. α-actinin (30–40 nm in length, 3–4 nm wide) is a significantly larger protein compared to G-actin (3.5 nm thick, 5.5 nm height and width) [
24,
25], so it provides a larger interaction surface for QDs binding. Additionally, the difference in methodological approach may also contribute to the discrepancy in K
d values obtained in the present study, as gel-based assays may underestimate the binding affinity compared to fluorescence-based quenching, which is very sensitive to environmental changes around the tryptophan residues.
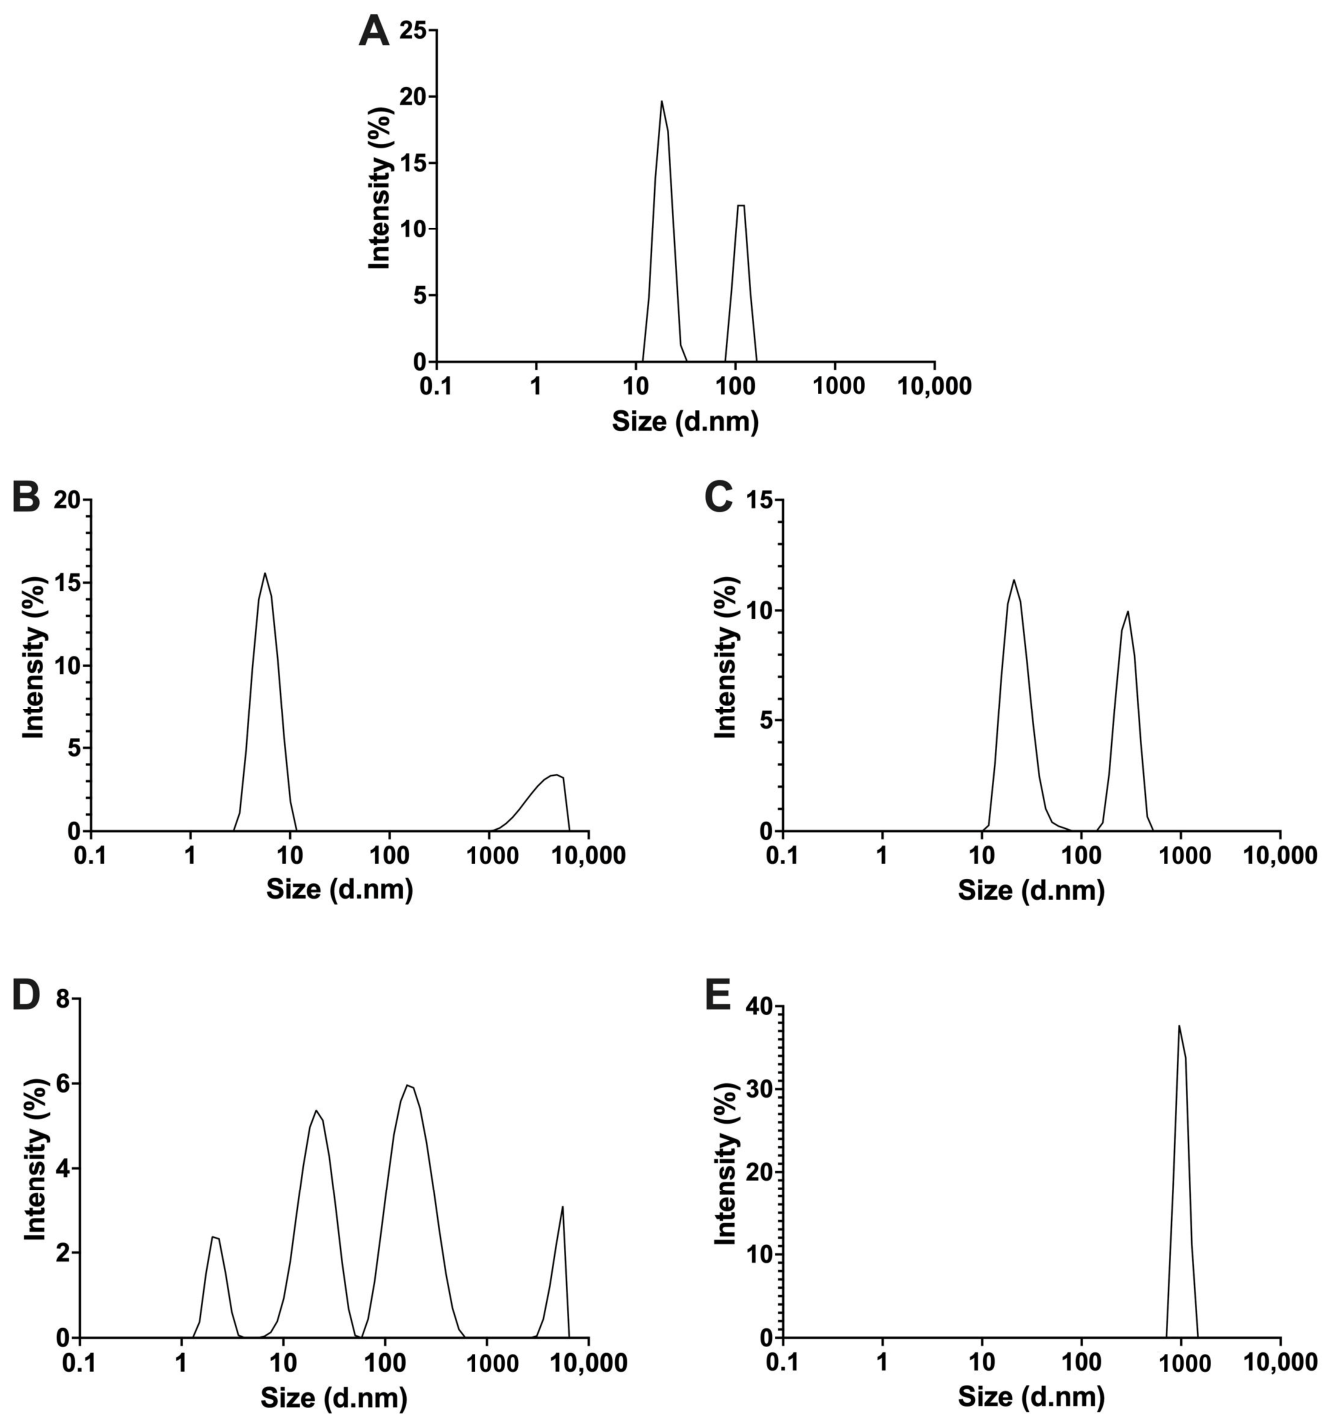
The DLS intensity distribution (
Figure 6) suggested that QDs interact differently with BSA and α-actinin. Incubation of QDs with BSA resulted in the formation of larger particles while retaining smaller-sized particles as well. In contrast, incubation of QDs with α-actinin resulted in the disappearance of smaller-sized particles and presented only one distinct large particle population. This difference could be related to the protein and its structural properties. Having multiple interaction domains may enable multiple QDs to bind to α-actinin simultaneously, resulting in extensive particle clustering. This raises the possibility that interactions between QDs and cytoskeletal proteins could promote nanoparticle aggregation within biological environments. Further studies need to be carried out to assess its biological implications and contribution to nanotoxicity.
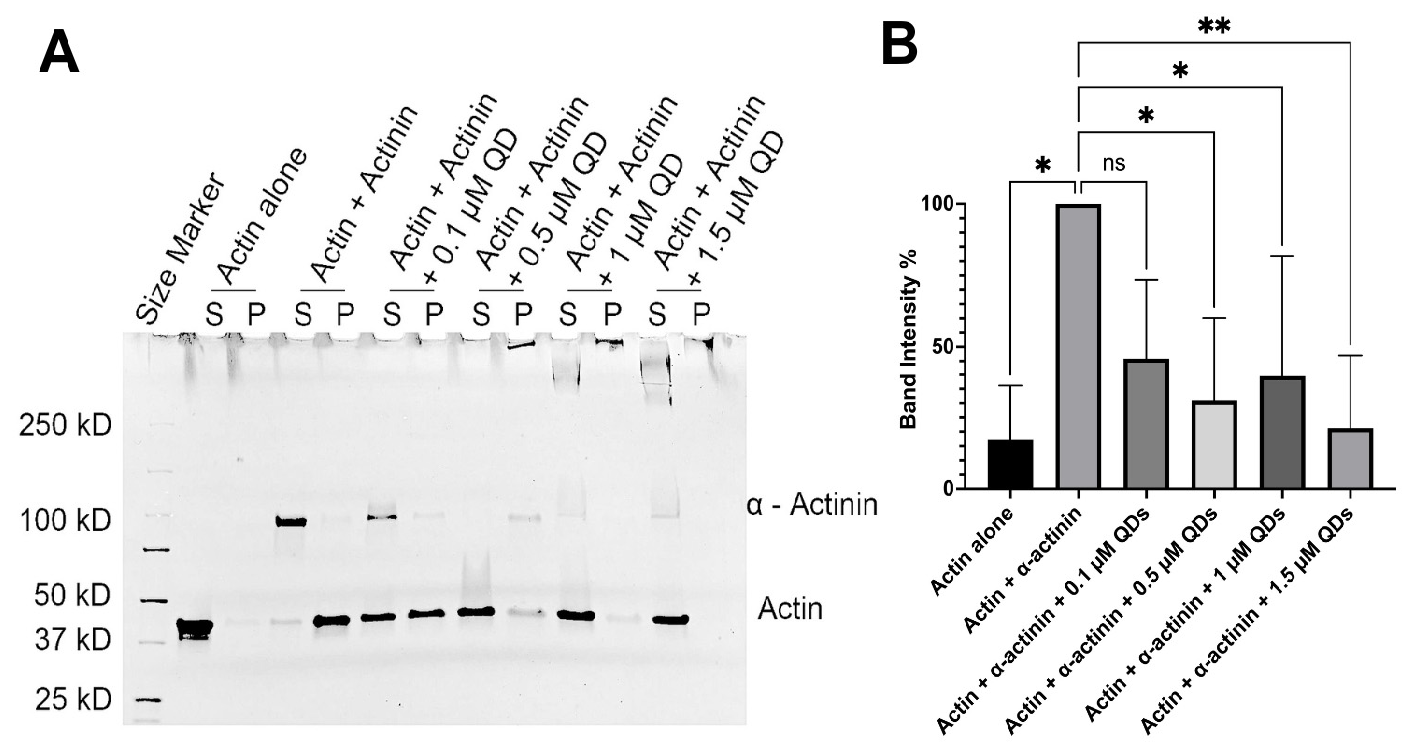
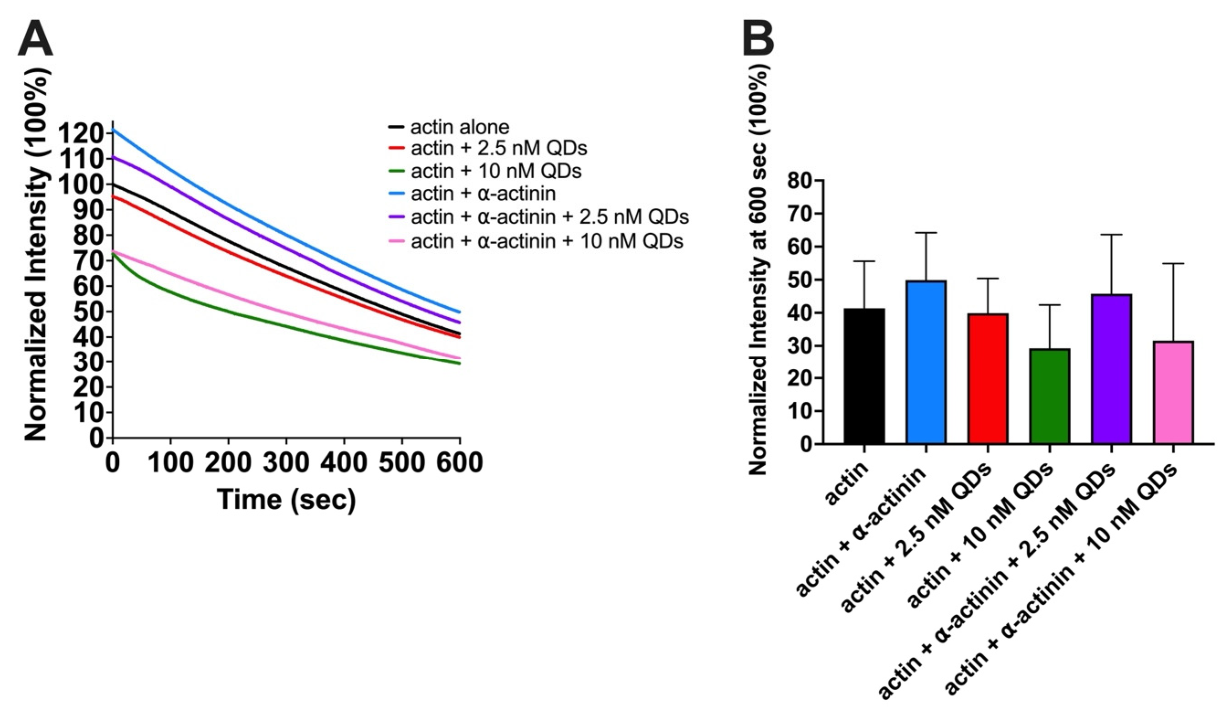
Furthermore, QD–α-actinin binding had functional consequences on actin organization. The spin-down assay demonstrated that actin bundling was inhibited even in the presence of α-actinin after QD treatment, suggesting impairment in crosslinking activity. Actin bundling is essential for organizing actin into higher-order structures for key processes such as cell division, migration, invasion, and bulk transport [
14]. Therefore, the disruption of the actin bundling process implies that QDs can compromise higher-order actin architecture. The effects of QDs on the cytoskeletal proteins, actin and α-actinin, were further demonstrated in the depolymerization assay. As reported in our previous study as well [
11], the presence of QDs caused more significant depolymerization. Here, α-actinin showcased its stabilizing effect by slowing down actin depolymerization, which is consistent with previous reports [
26]. Likewise, consistent with our findings, other actin bundling proteins such as the
Dictyostelium 30 kDa actin-bundling protein, plastin and fascin, have been reported to stabilize F-actin by inhibiting depolymerization [
27,
28,
29]. Consequently, a clear trend was observed, where in the presence of QDs, this stabilizing effect was weakened, suggesting that QD binding interferes with α-actinin’s regulatory function. The variability observed in the depolymerization data is due to how relative the fluorescent intensity is during each independent experimental run, which is why normalization was carried out to enable comparison of depolymerization kinetics.
As such, the biological implications of our findings are significant. As mentioned earlier, the actin cytoskeleton and its organization is fundamental to processes such as cell migration, adhesion, division, and muscle contraction. Perturbations in actin bundling and filament stability could contribute to compromised structural integrity and impaired motility. Furthermore, from a nanotoxicology perspective, our results suggest that QD-induced actin cytoskeletal dysfunction may arise not only from direct interaction but also from interference with regulatory protein networks. This expands on the current understanding that QDs influence intracellular systems and, in particular, the actin cytoskeleton.
Depending on the biological context, these perturbations in actin dynamics may be either detrimental or beneficial. As such, identifying the specific residues involved in protein–QD interactions may enable the rational design of surface functionalized QDs that either enhance or minimize such interactions by selectively targeting particular protein domains. This improves precision drug delivery while reducing unintentional cytoskeletal toxicity.
Therefore, future research should focus on expanding these findings into more complex biological systems. Studying QDs and actin/α-actinin interactions in muscle cells would provide physiological consequences in a cellular context. This might also demonstrate the potential of QDs in regenerative medicine. Additionally, transitioning from heavy metal-based QDs to carbon-based quantum dots will help minimize toxicity while preserving functional tunability. From a computational perspective, expanding simulations to include multiple QDs within protein-rich environments could better approximate intracellular conditions and provide insight into competitive binding environment.
4. Materials and Methods
4.1. QDs’ Characterization
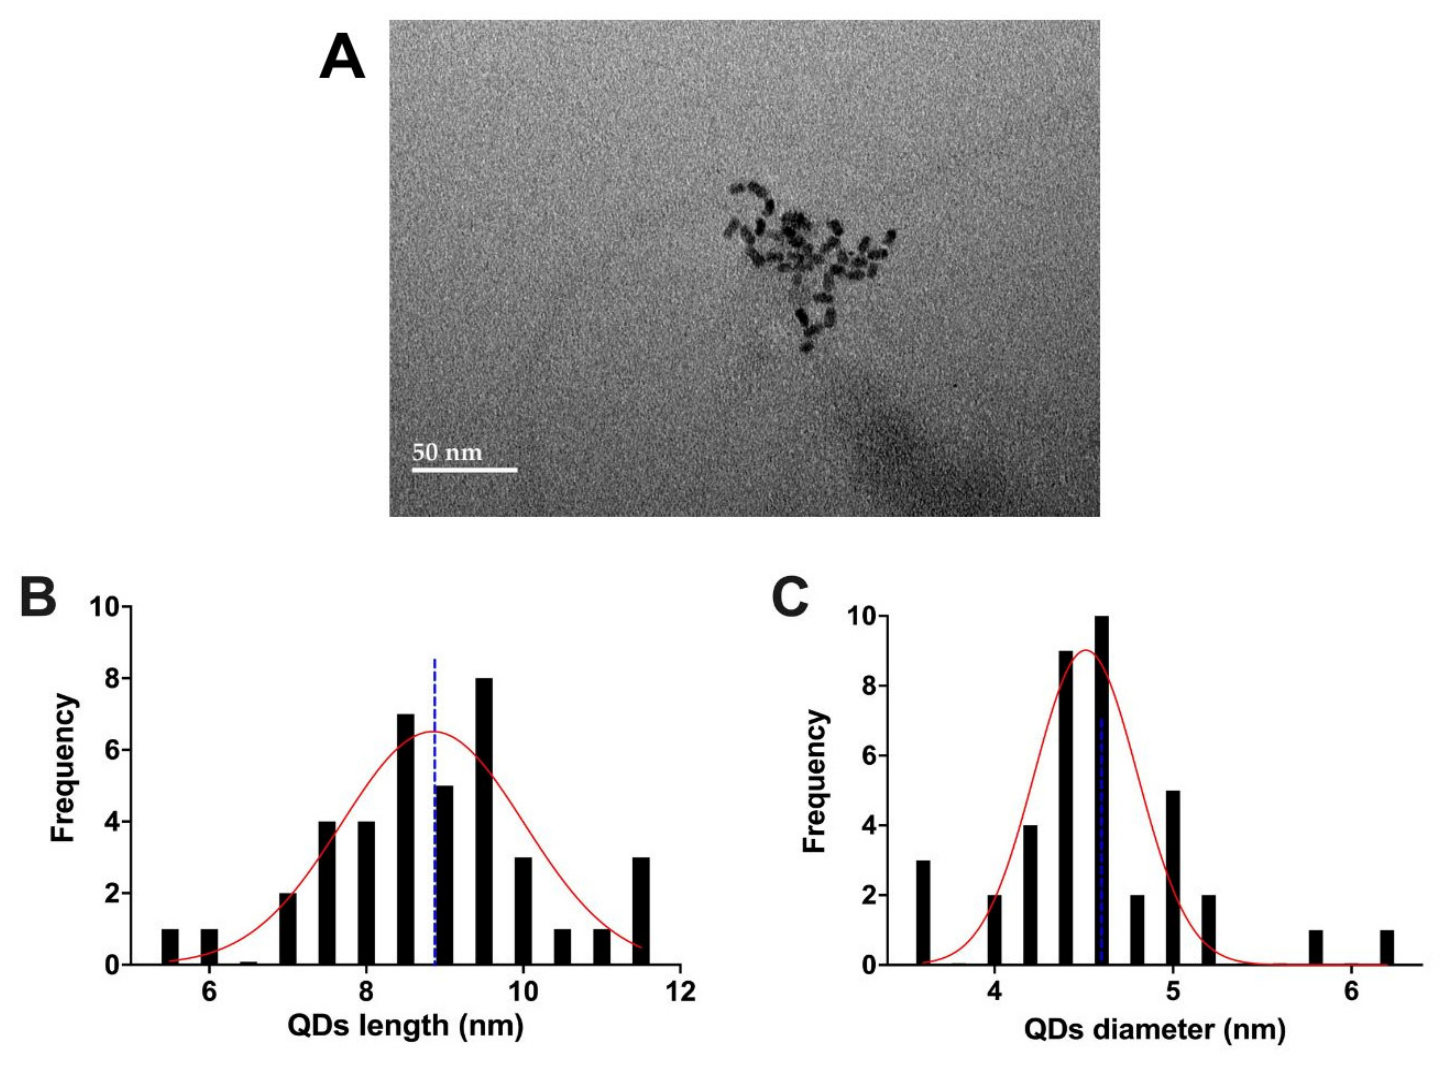
We obtained visible water-soluble CdSe/ZnS QDs coated with carboxylic acid terminal end groups from NanoOptical Materials Inc. (Carson, CA, USA). To ensure nanoparticle integrity and consistency with expected physical/chemical properties, characterization studies using spectroscopy, zeta potential, and TEM were carried out.
For fluorometer emission, we diluted the stock concentration of QDs (11 µM) to 100 nM using deionized water. The excitation and emission wavelength were adjusted to 280 nm and 350–700 nm respectively, and the emission spectra were measured using a PTI spectrofluorometer (PTI Photon Technology International, Birmingham, NJ, USA). The excitation of QDs at 280 nm is very efficient with high fluorescence intensity, which results in better image quality [
30], whereas the emission wavelength range of 350–700 nm allows us to fully capture the fluorescence spectrum of CdSe/ZnS QDs and detect any potential overlap with α-actinin fluorescence.
For zeta potential, QDs were similarly diluted to 100 nM and the electric potential of QDs was measured using a Zetasizer Nano ZS90 (Malvern Panalytical, Westborough, MA, USA).
For UV-Vis, a fixed concentration of 50 nM of QDs was used in Millipore water (pH 8.0) to create our samples. The absorbance of the samples was scanned from 350 to 750 nm with a UV-2101PC UV–Vis spectrophotometer (Shimadzu, Columbia, MD, USA). The data was then graphed using GraphPad Prism 9.
For TEM, the data was obtained by sending our sample of QDs in a pH 7 phosphate buffer to the University of Missouri, and they used a JEM-1400 (JEOL USA, Peabody, MA, USA).
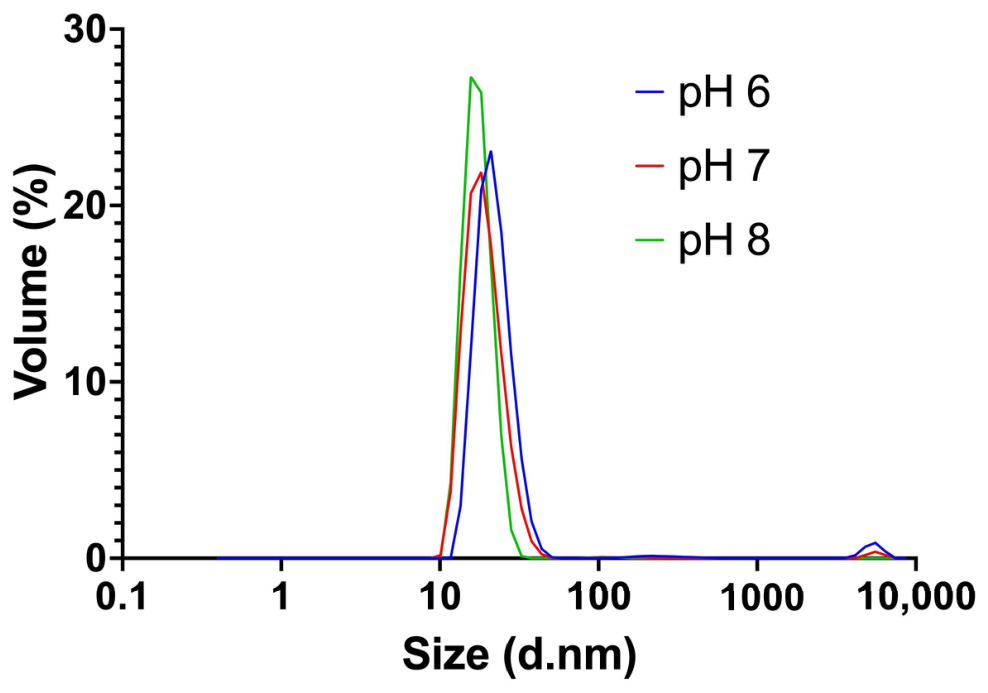
For DLS, QDs with a concentration of 100 nM were prepared in a variety of phosphate buffers, with pH values of 6, 7, and 8. We measured the size of the quantum dots using a refractive index of 2.80 and an absorption value of 1.00 using the Zetasizer. The Volume Distribution graph was used to estimate the hydrodynamic size of the QDs. The data was then graphed using GraphPad Prism 9.
4.2. Actin Preparation
We homogenized 1 mg of pyrene-labeled rabbit skeletal muscle actin (Cytoskeleton Inc., Denver, CO, USA) in 50 µL cold sterile deionized water to prepare a stock concentration of 20 mg/mL (465.12 µM) and kept it on ice. For the fluorometric assay, we further diluted the actin in general actin (G) buffer (5 mM Tris-HCl, pH 8.0, 0.2 mM CaCl2, 0.2 mM ATP) to a working concentration of 4 µM. Next, the diluted actin was introduced with 1X actin polymerization (AP) buffer (500 mM KCl, 20 mM MgCl2, 50 mM Guanine Carbonate, 10 mM ATP, 100 mM Tris) and incubated for 1 h at room temperature. The actin was then ready for experimental use.
For the spin-down assays, we diluted the actin to a working concentration of 5 µM and incubated it on ice for 30 min. Next, the diluted actin was introduced with 1X AP buffer and incubated for 1 h at room temperature before it was ready for experimental use.
4.3. α-Actinin Preparation
For all the assays, we homogenized 50 µg α-actinin (Cytoskeleton Inc., Denver, CO, USA) in 50 µL cold sterile deionized water to prepare a stock concentration of 1 mg/mL (10 µM) and kept it on ice. In fluorometric assays, the α-actinin was further diluted in the F-actin mixture to a working concentration of 0.112 µM, while for the spin-down assays, it was diluted to a working concentration of 0.5 µM.
4.4. Evaluation of Protein and QD Binding via Dynamic Light Scattering (DLS)
We completed 5 runs in total. The first run was 100 nM QD alone, second was 1 µM BSA alone, third was 1 µM BSA + QD, fourth was 1 µM α-actinin alone, and fifth was 1 µM α-actinin and 100 nm QDs. These runs were all done at room temperature in a pH 8 phosphate buffer. We used a refractive index of 2.80 and an absorption value of 1.00. The machine that was used for DLS was the Zetasizer. We used the intensity distribution graph to represent this data set.
4.5. Native Gel Electrophoresis
α-Actinin with a fixed concentration of 2 µM and variable QD concentrations of 9 nM, 17.8 nM, 35.8 nM, 71.4 nM, 142.8 nM, 285.8 nM, and 571.4 nM were mixed. Samples of varying concentrations of QDs and fixed concentrations of α-actinin were also prepared as controls. G-buffer (5 mM Tris HCL, pH 8, 0.2 mM CaCl2, and 0.2 mM ATP) was added to make all samples’ total volume 10 µL. The samples were incubated for 3 h at room temperature in the dark. While the samples were incubated, a Mini-PROTEAN precast polyacrylamide gel (Bio-Rad, Hercules, CA, USA) was pre-run in a native gel buffer (25 mM Tris-HCl, pH 8, 194 mM glycine, 0.5 mM CaCl2, 0.2 mM DTT, and 0.2 mM ATP) for 1 h at 70 V on ice. The incubated samples were then pipetted into their respective lanes, and the gel was run at 190 V for 50 min. The gel was then stained using a Coomassie brilliant blue R-250 dye for 30 min. After dumping out the dyeing solution, the gels were destained overnight, and images of the gel were taken. For the Native gel assessment, band intensity was quantified using relative densiometric analysis with Image J 1.35t. The values were then converted to relative band intensity lost using the equation , where B = band intensity of α-actinin + QDs, and = band intensity of α-actinin alone.
4.6. Assessment of Actin and α-Actinin Quenching by Fluorometer-Based Assay
The F-actin and α-actinin stock was prepared as mentioned in
Section 4.2 and
Section 4.3 respectively. We added different concentrations of QDs right before experimental use.
We measured the emission spectra of actinin–QD binding (
Section 2.2) by adjusting the excitation and emission wavelength to 280 nm and 300–450 nm respectively. The excitation wavelength of 280 nm was chosen because the tryptophan residues in α-actinin absorb strongly at this wavelength, while the emission wavelength range of 300–450 nm allows us to fully capture the fluorescence spectrum of α-actinin [
17]. For the dissociation constant (K
d), the fluorescent intensity of α-actinin was measured at 345 nm in the absence and presence of varying concentrations of QDs. The fluorescence values were then normalized such that the fluorescent intensity of α-actinin alone was set to a value of 1. The relative change was then calculated as
, where
F = fluorescent intensity of α-actinin + QDs, and
Fo = initial fluorescent intensity of α-actinin.
For the emission spectra of pyrene actin–α-actinin–QDs binding (
Section 2.4), we measured the fluorescent signal over time (600 s) with the standard excitation and emission wavelength of 365 nm and 407 nm respectively.
4.7. Spin-Down Assay Followed by SDS-PAGE
A fixed concentration of 5 µM actin and 0.5 µM α-actinin was prepared as mentioned in
Section 4.2 and
Section 4.3 respectively. We created the testing samples by mixing the actin and actinin with F-buffer (G buffer + AP buffer), Tris-HCl, pH 6.5, and different concentrations of QDs (0.1, 0.5, 1, and 1.5 µM) in individual Eppendorf tubes (e-tubes). We then incubated the e-tubes away from light for 30 min at room temperature and ultracentrifuged them at 14,000×
g (7000 rpm) for 1 h at 24 C. After centrifugation, we removed the supernatant and placed it in separate e-tubes on ice. The pellets were also resuspended separately in 40 µL F-buffer by pipetting up and down for 3 min and placed on ice. Next, we mixed 10 µL of 6X Laemmli SDS buffer into each e-tube before heating them at 95 C for 4 min. Finally, we used a mini-protean TGX precast gel (Bio-Rad, Hercules, CA, USA) to load and run the samples at 180 V for 45 min. The gels were then stained with Coomassie Blue, and images were taken with a gel scanner. The band intensity was quantified using relative densiometric analysis with Image J.
4.8. Data Analysis
All the experiments were performed in triplicate. QD characterization, fluorometric assessments, and all quantitative analyses were processed and graphed using GraphPad Prism 9. TEM images were quantified using Image J.
The data in the histograms (
Figure 2B,C) are presented as average ± standard deviation. The binding affinity (K
d) for the fluorometric analysis was determined by fitting the quenching data to a one site–total binding isotherm with constraints Bmax = 1 and background = 0 in Prism. For the native gel analysis, the binding affinity (K
d) was determined by fitting the relative band intensity lost values into the standard Hill equation, also using Prism. For the SDS gel assessment, band intensities were quantified using Image J and then normalized to the positive control (actin + α-actinin), which had 100% band intensity. Statistical significance was assessed using one-way ANOVA in Prism.
4.9. QD Model Generation
QD structures were generated using Python 3.11.14 with ASE 3.26.0, RDKit 2025.09.2, and NumPy 2.3.4. A spherical ZnS core was constructed from the zinc blende ZnS crystal structure (lattice constant a = 5.41 Å) and trimmed to produce a nanoparticle core geometry. Ligand placement and coating construction were automated with recorded metadata for atom mapping, ligand anchoring, and topology reproducibility.
For the final simulation campaign, coated deprotonated and coated protonated QD models were prepared to compare surface protonation effects while maintaining identical core geometry.
ZnS bonded and nonbonded interaction terms were implemented using literature-derived ZnS interaction parameters (
Table 2) previously developed for ZnS molecular dynamics simulations and later applied in biomolecular adsorption studies [
31,
32]. These parameters include harmonic bond and angle terms, partial atomic charges, and Lennard–Jones interactions describing Zn-S interactions within the ZnS lattice.
4.10. Molecular Dynamics System Preparation and Simulation Protocol
α-actinin patch targets were selected from electrostatic patch mapping and used to place each QD model at five defined regions (negative_0, positive_0, positive_1, positive_2, neutral_0). Initial complex geometries were adjusted to satisfy a consistent minimum QD–protein placement criterion.
Protein and QD topology components were assembled into system directories using the GROMACS 2025.4 simulation package [
33]. The α-actinin protein was described using the AMBER99SB-ILDN force field [
34], while QD topology files were generated from the custom ZnS parameter workflow described above.
Simulation systems were placed in cubic periodic boxes without explicit solvation or ion addition. Production MD simulations used a vacuum-style setup with pcoupl = no, coulombtype = Cut-off, rcoulomb = 1.4 nm, vdwtype = Cut-off, rvdw = 1.4 nm, and pbc = xyz. No separate solvation or ion-neutralization step was performed.
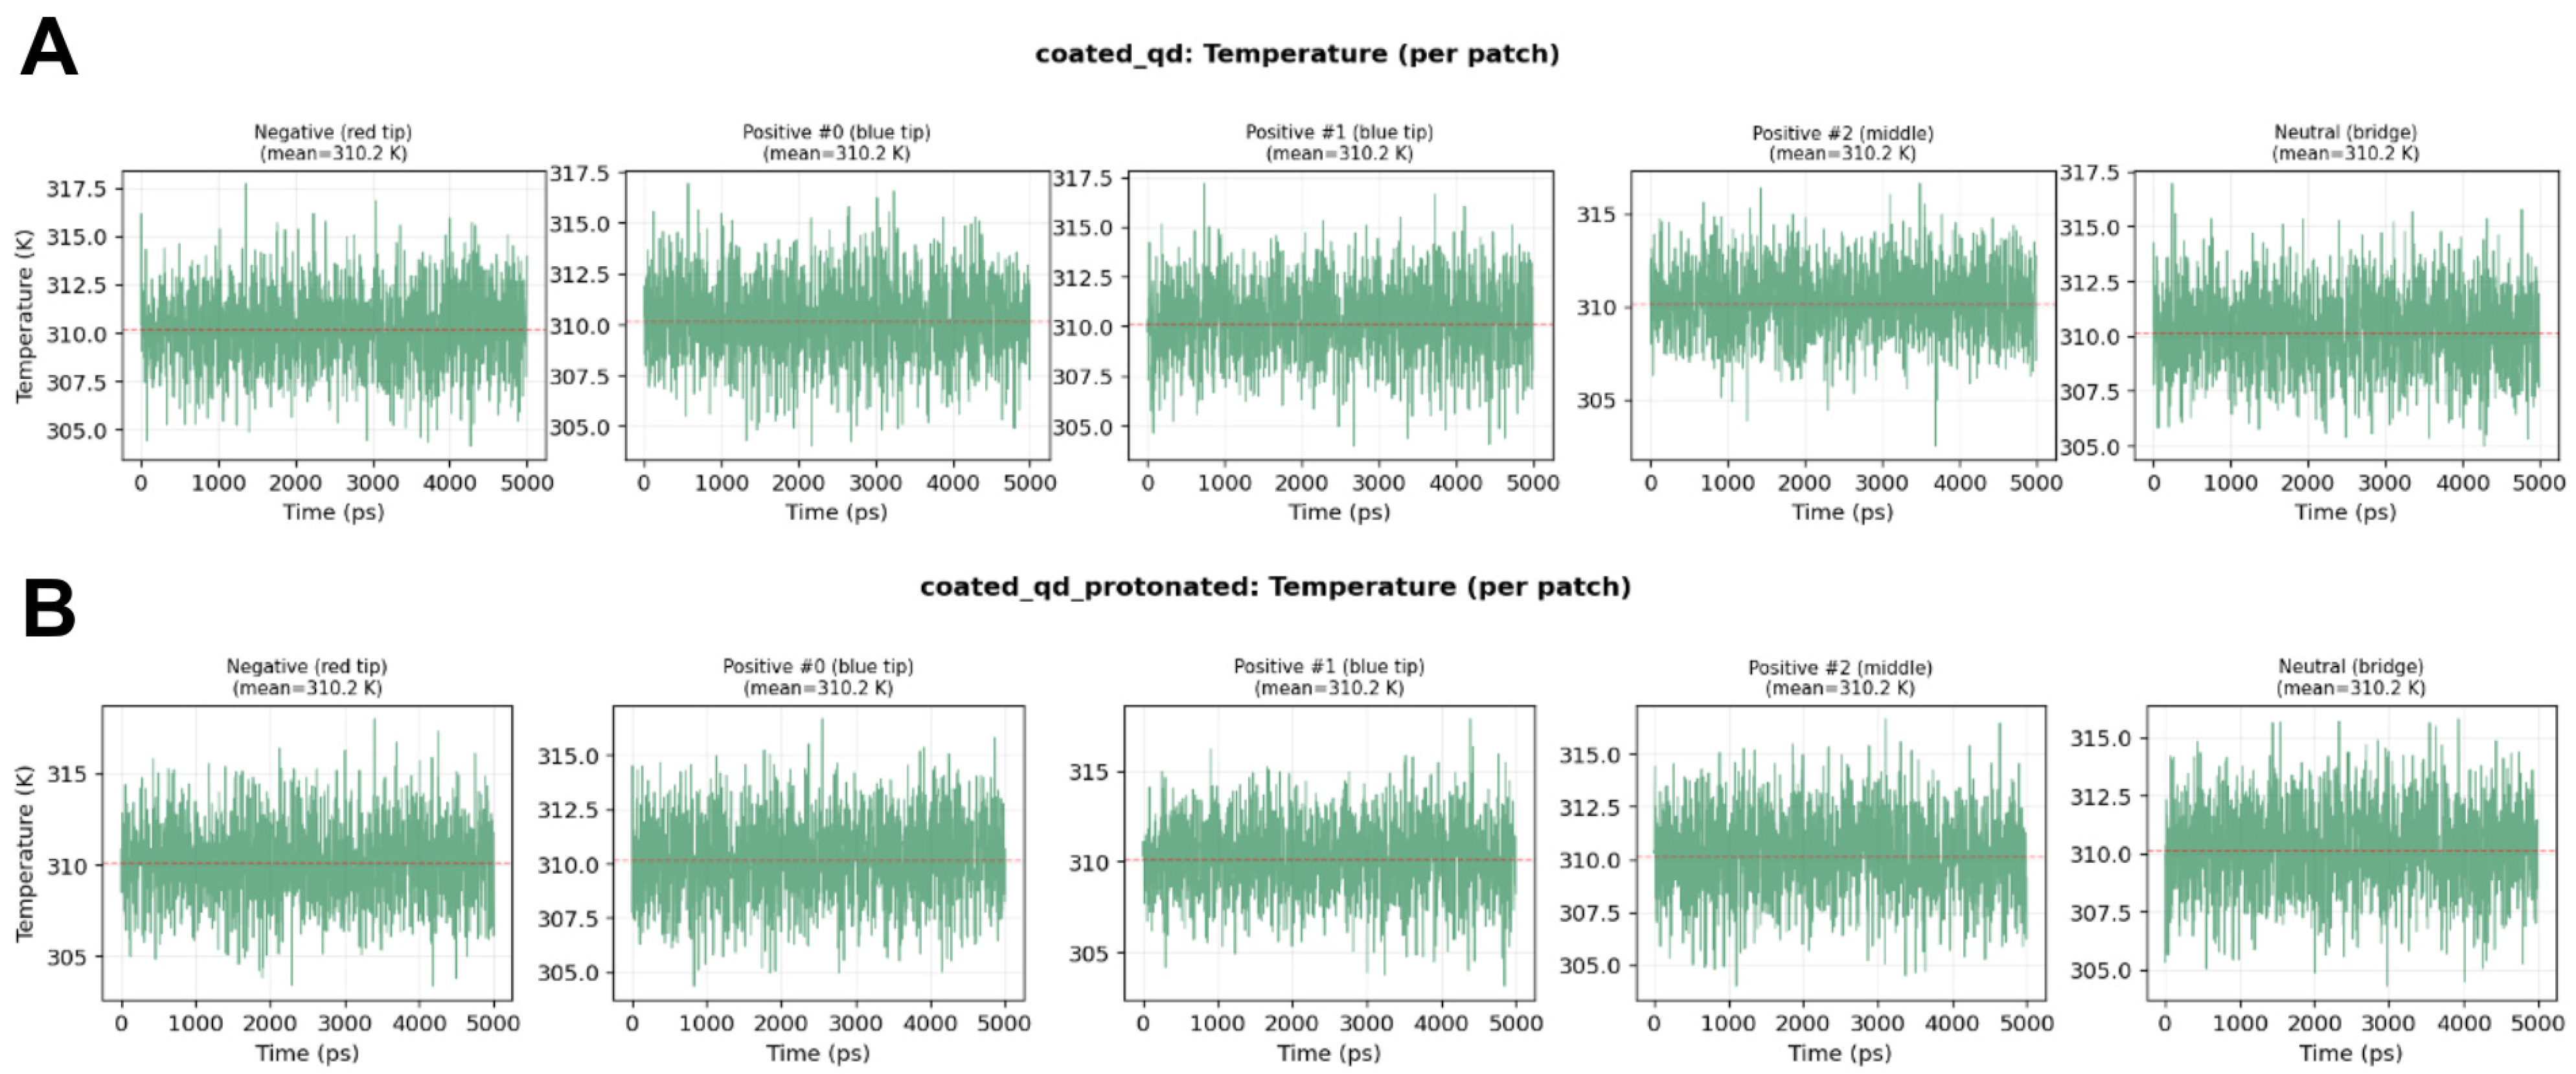
Energy minimization was performed using the steepest descent algorithm before molecular dynamics simulations. All systems were simulated for 5 ns at 310.15 K using identical parameters to allow direct comparison between coated-QD chemistries and placement patches.
Production MD simulations used a timestep of 0.001 ps with the Verlet cutoff scheme. Electrostatic interactions were treated using a cutoff distance of 1.4 nm, and Lennard–Jones interactions were truncated at 1.4 nm. Temperature was controlled using the velocity-rescale thermostat with a reference temperature of 310.15 K.
Periodic boundary conditions were applied in all spatial directions. Identical simulation parameters were applied across all ten systems to ensure consistent comparison of QD–protein interaction behavior.




 ,
,