Article

The Spermidine Synthase Gene as a Reporter of Transcription Inhibition in Escherichia coli
by
Anton R. Izzi
1,2,3,
Alisa P. Chernyshova
1,4,5,
Mikhail Y. Zhitlov
3,4,
Alexander Yu. Rudenko
3,
Ratislav M. Ozhiganov
3,5,
Yury A. Ikhalaynen
5,
Inna A. Volynkina
1,5,
Lubov V. Dorofeeva
6,
Vadim N. Tashlitsky
5,
Igor A. Rodin
5,
Lyudmila I. Evtushenko
6,
Vera A. Alferova
3,4,
Petr V. Sergiev
1,3,5,
Olga A. Dontsova
1,4,5 and
Dmitrii A. Lukianov
1,2,5,*
1
Center for Bio- and Medical Technologies, 121205 Moscow, Russia
2
Faculty of Bioengineering and Bioinformatics, Lomonosov Moscow State University, 119234 Moscow, Russia
3
Belozersky Institute of Physico-Chemical Biology, Lomonosov Moscow State University, 119234 Moscow, Russia
4
Shemyakin-Ovchinnikov Institute of Bioorganic Chemistry, Russian Academy of Sciences, 117997 Moscow, Russia
5
Department of Chemistry, Lomonosov Moscow State University, 119234 Moscow, Russia
6
All-Russian Collection of Microorganisms (VKM), Pushchino Scientific Center for Biological Research, Russian Academy of Sciences, 142290 Pushchino, Russia
*
Author to whom correspondence should be addressed.
Int. J. Mol. Sci. 2026, 27(11), 4829; https://doi.org/10.3390/ijms27114829
Submission received: 17 April 2026 / Revised: 8 May 2026 / Accepted: 21 May 2026 / Published: 27 May 2026

Abstract

Antimicrobial resistance is a major threat to modern society and healthcare, as it severely compromises the efficacy of standard antibiotic treatments. To meet the ever-increasing demand for novel antimicrobial drugs, it is crucial to develop new strategies for screening antimicrobial compounds and improve existing high-throughput techniques. Reporter systems that employ specific genetic markers are powerful tools not only for detecting antimicrobial activity of the substance being studied, but also for identifying the potential mechanism of its action. Among other metabolic pathways, RNA biosynthesis machinery is considered a promising molecular target as it remains underutilized in current antimicrobial therapy and therefore is rarely exposed to drug pressure. However, there is no suitable biomarker for identifying compounds that inhibit the transcription in Gram-negative bacteria. Combining bioinformatic search and RT-qPCR experimental validation, we have established the overexpression of the spermidine synthase gene (speE) as a biomarker associated with impaired transcription in Escherichia coli. Monitoring the expression level of speE in antibiotic-treated cells enables reliable detection of compounds that inhibit bacterial RNA-polymerase, such as rifampicin and fidaxomicin. Moreover, our screening system was successfully applied in practice to analyze chromatography fractions from fermentation broth of antibiotic producers, with compounds of the rifamycin family being identified as hits and isolated. The proposed method has the potential to be used in sequential screening procedures to reveal active antimicrobial compounds that inhibit bacterial transcription process, giving the world novel antimicrobials with minimal risk of resistance development.

1. Introduction

Antibiotics have become a powerful tool in the fight against infectious diseases, which were previously responsible for massive deaths due to the lack of adequate treatment methods or the insufficient effectiveness of existing treatments. Paul Ehrlich’s discovery of salvarsan, an effective antibacterial agent, was the result of many years of research [1]. It followed the discovery of the well-known antibiotic penicillin by Alexander Fleming during his experiments with Penicillium notatum [2]. The Waksman platform, which involves testing a variety of soil microorganisms on a plate covered with a layer of pathogenic bacteria, has led to the discovery of many antimicrobial agents during the golden age of antibiotics [3]. However, the antibiotic-resistant strains of pathogenic bacteria have become more prevalent. The formation of an antibiotic resistance crisis led to a decrease in the efficiency of known antibiotics due to the uncontrolled use of antimicrobial compounds in agriculture and pharmaceuticals [4].
A variety of strategies have been proposed to address this challenge. Multidrug therapeutic approaches are among the strategies that enable reducing the risk of resistance development without affecting the efficacy of treatment. By exploiting drug–drug interactions and utilizing collateral sensitivity, resistance-conferring mutations for one agent usually increase bacterial vulnerability to alternative agents. In addition, bacterial defense mechanisms, that are naturally present, might serve as another therapeutic tool [5]. For example, CRISPR-Cas nucleases are sequence-specific antimicrobials that target horizontally acquired genes that confer antibiotic resistance [6]. There are also potential alternatives to conventional antibiotics such as the use of probiotic microorganisms [7].
High-throughput screening based on whole-cell assays has revealed its weakness in efficient discovery of new antimicrobial agents nowadays. Combining the screening of natural and synthetic compounds with the simultaneous identification of their mechanism of action is considered the best strategy for discovering new antimicrobial agents. This leads to a reduction in research time and a substantial improvement in screening efficiency. Several reporter systems have been created that involve Gram-positive [8,9] and Gram-negative [10,11] bacteria, which enable to determine the mechanism of action of the tested antibiotic by activating the expression of a particular reporter gene. Most of those systems are aimed at screening antimicrobials that target protein synthesis or cause DNA damage, as well as reporter constructs that are capable of detecting quorum-sensing signaling molecules [12,13]. The genes employed as the basis for the development of reporter systems (biomarkers) are commonly those that react to the inhibition of various biosynthetic pathways [14,15]. Nevertheless, there are still no suitable markers that can efficiently detect antimicrobials affecting transcription in the E. coli system. Existing reporter systems based on luciferase assays do not provide enough specificity and cannot distinguish between transcription and translation inhibitors [16].
In this work, we present a specific E. coli model marker gene that indicates the impact of antimicrobials on transcription inhibition. We discovered it using an approach based on a combination of transcriptome analysis and experimental validation of potential marker genes, confirmed by quantitative PCR. Furthermore, the expression of this gene was assessed to screen column chromatography fractions for the presence of antimicrobial compounds that suppress bacterial transcription.

2. Results

2.1. Bioinformatic Search for Genes That Were Overexpressed After Rifampicin Treatment

To perform a screening system based on qPCR assay and with the aim to find antimicrobials that inhibit the transcription process in bacteria, it is necessary to discover the genes specifically overexpressing under the influence of antibiotics like rifampicin, which is a compound that inhibits bacterial RNA polymerase by binding to its β-subunit (RpoB), thereby affecting the transcription elongation stage [17]. For Gram-positive bacteria, including the Bacillus subtilis strain, a specific marker has been found—the yppS gene [9]. This gene has been shown to be upregulated upon treatment with RNA polymerase inhibitors, namely rifampicin and fidaxomicin. Therefore, its promoter was used as a part of a bioreporter assay adapted for soft-agar screening. However, the discovery of similar markers for Gram-negative bacteria has not yet been made. Due to this, an E. coli model has been chosen to solve this issue as there are extensive datasets of transcriptome data for this microorganism after exposure to several antibiotics, including rifampicin. A transcriptome dataset (accession number PRJNA889731) was chosen for this analysis, where in the E. coli K-12 strain MG1655 was exposed to three antibiotics with differing mechanisms of action—namely, rifampicin (50 µg/mL), novobiocin (100 µg/mL), and tetracycline (12.5 µg/mL). Therefore, the goal was to identify genes that are overexpressed when exposed to rifampicin but are downregulated or do not change their expression level when treated with other antibiotics.
Antibiotic treatment has resulted in significant changes in the E. coli transcriptome. Table 1 provides information on the properties of the transcriptome. The genes were considered differentially expressed at an adjusted p-value threshold <0.05 (using the Benjamini–Hochberg procedure [18]), as well as at a |log2FoldChange| threshold >0.58 to be considered as moderate, biologically meaningful changes [19,20]. An average of 2498 genes were differentially expressed under antibiotic treatment, accounting for 55.9% of the genome. The average number of genes upregulated and downregulated under antibiotic stress was roughly equal (1220 vs. 1278), and the percentage of differentially expressed genes did not differ significantly between the different treatments.
To identify genes that are specifically upregulated after rifampicin treatment, a log2FoldChange threshold of 2.37 was set with an adjusted p-value threshold of <0.05. In other treatments, these genes should have been significantly downregulated or not considered significant. This criterion led to the selection of eight genes, which are presented in Table 2. The products of the most of the selected genes are considered to be involved in different metabolic pathways, and only the yiaG gene product is involved in the transcription process. These genes were chosen to be confirmed further by qPCR on the E. coli K12 strain. Moreover, a B. subtilis marker yppS gene, which stands for phosphoenolpyruvate synthase, was also involved in the study, which is a ppsA gene in E. coli.

2.2. Analysis of the Expression Level of Potential Marker Genes by RT-qPCR

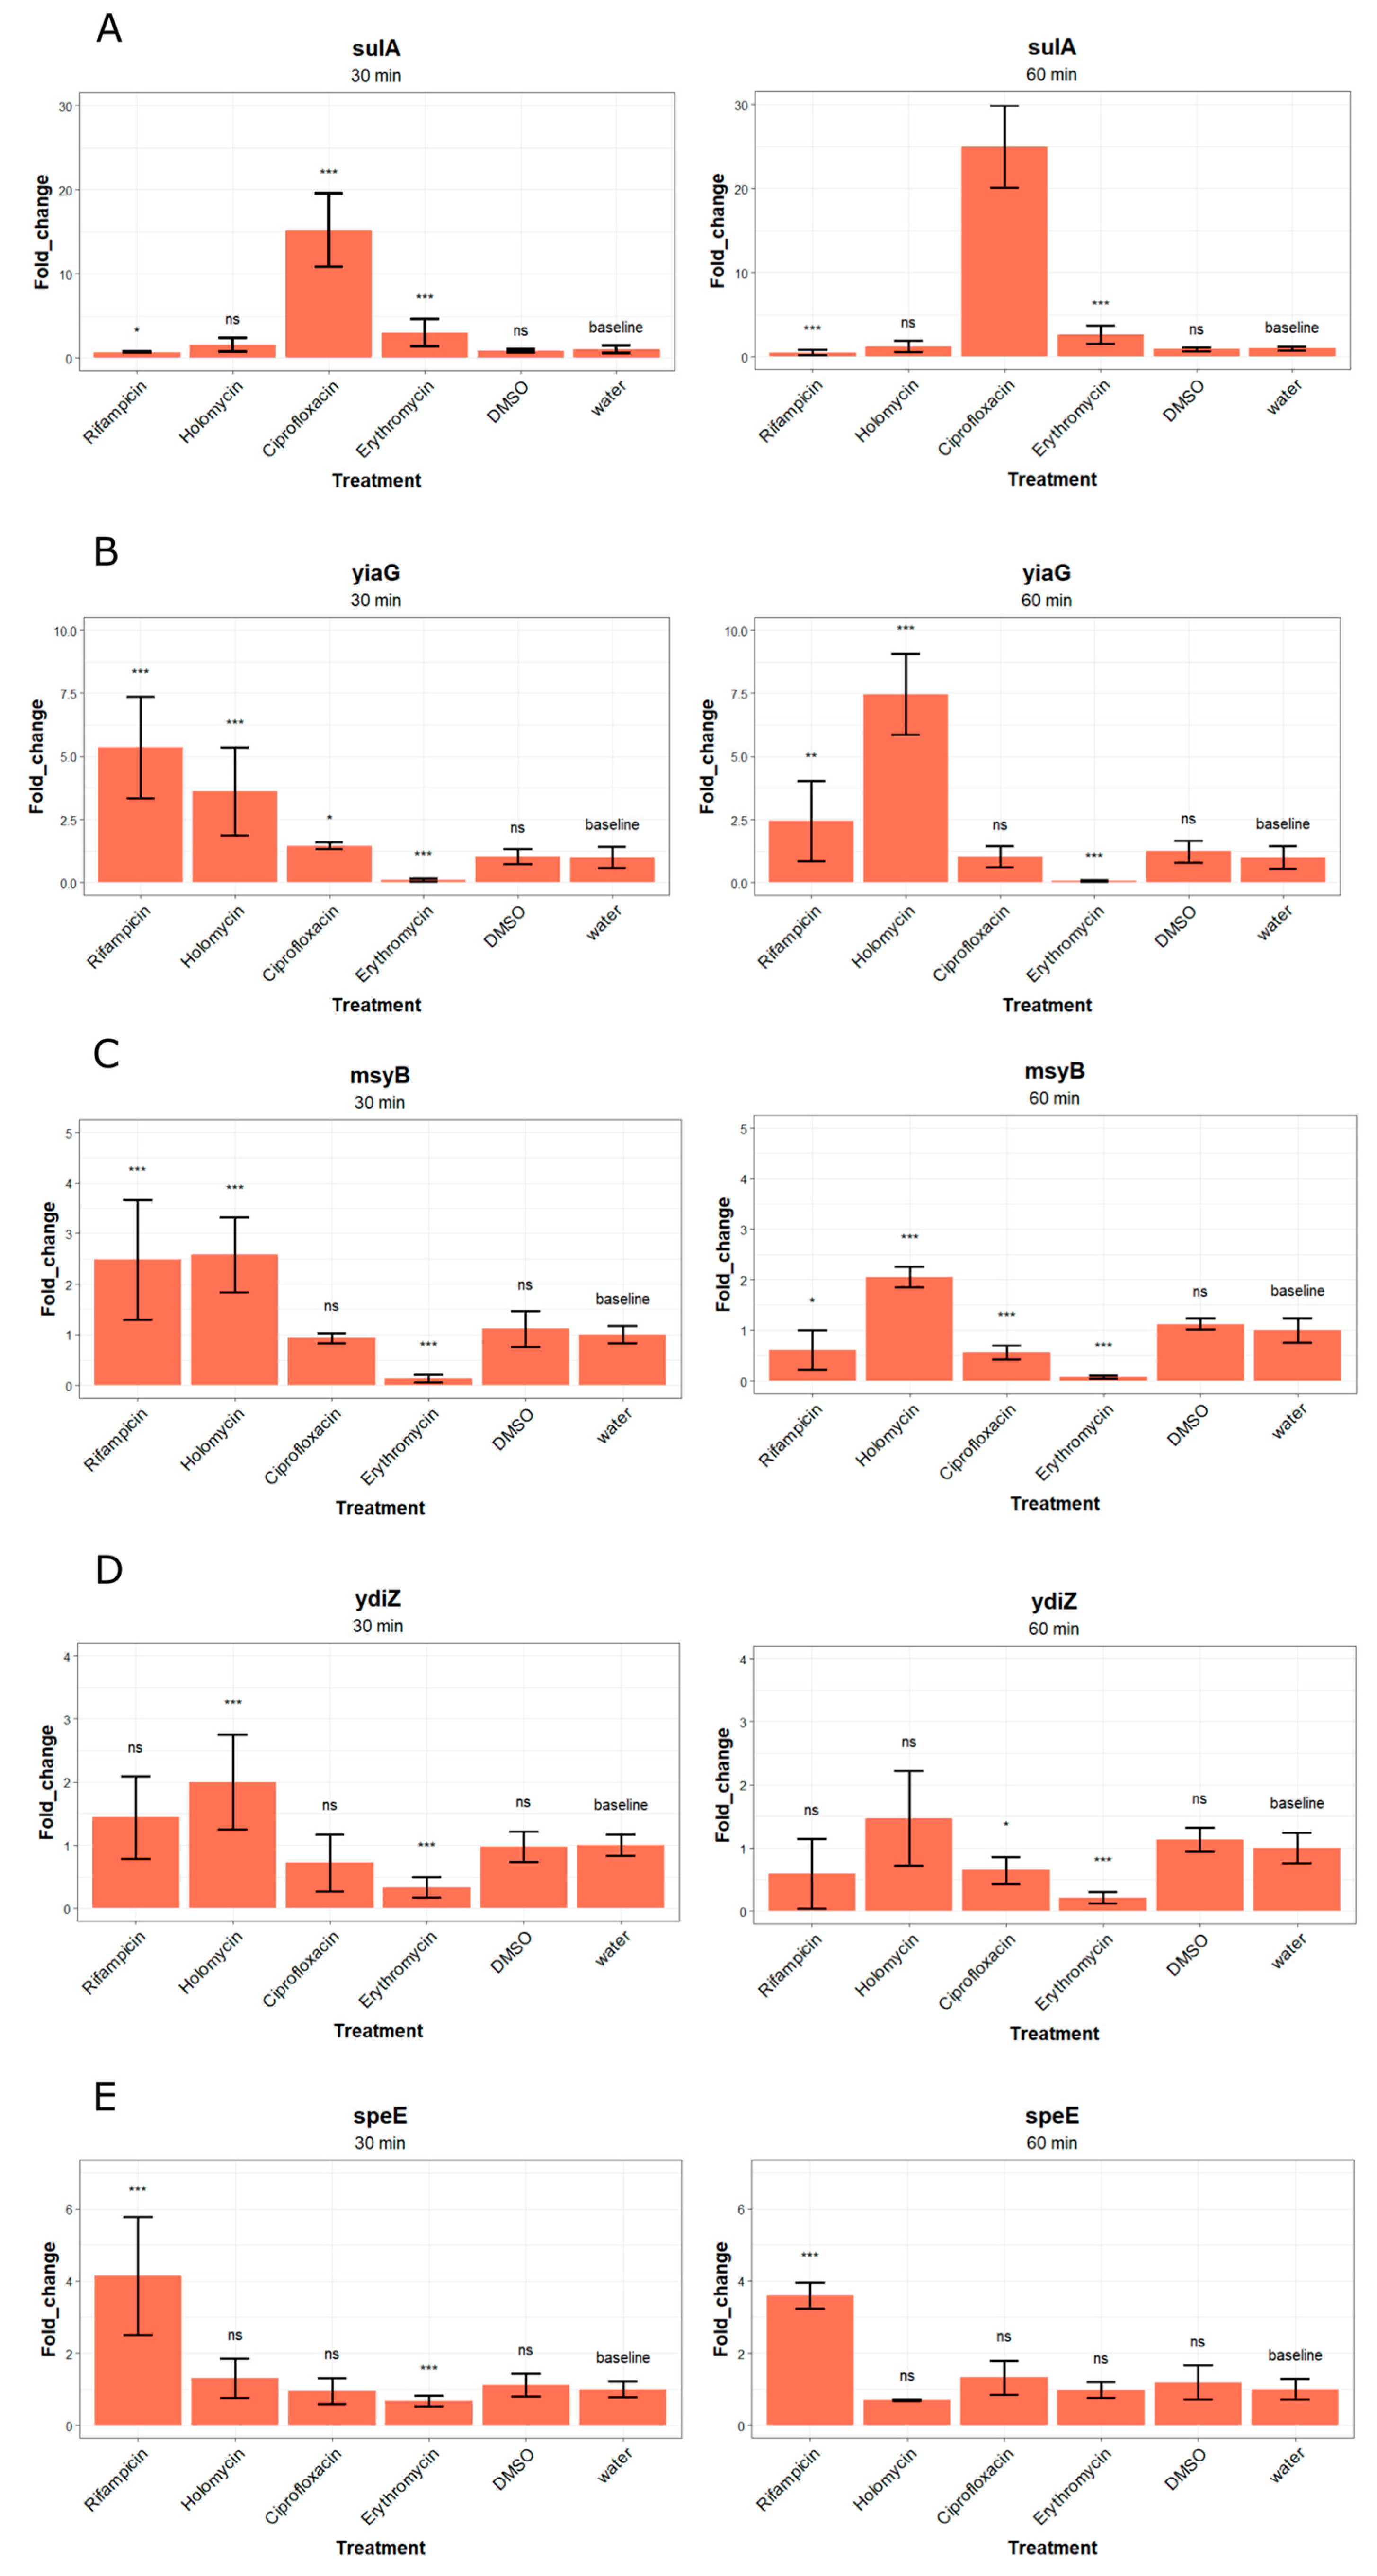
To confirm the possibility of using bioinformatically discovered genes as markers of transcription inhibition in experimental conditions, an E. coli K12 culture was treated with different antibiotics. Among these compounds were rifampicin as the main treatment, holomycin, ciprofloxacin, and erythromycin as antibiotic controls, as well as DMSO and deionized water as negative controls. Antibiotics concentration was selected according to the minimum inhibitory concentration. The MIC values of antibiotics used are given in Table S1. In total, 2x MICs were chosen as the middle variant that may affect gene expression and do not significantly reduce cell viability. After incubation for 30 and 60 min, total RNA was isolated and analyzed by RT-qPCR with primers for the genes of interest. In addition, a primer set for the sulA gene was used to test for ciprofloxacin treatment as it is a marker of SOS response in E. coli [21]. The minimum threshold for the change in gene expression at which a particular antibiotic treatment is considered to cause an effect was set at ≥1.5 with a p-value < 0.05. This threshold is often used to identify genes that are expressed differently [22,23,24].
RT-qPCR results showed that the sulA gene under ciprofloxacin treatment demonstrated significant overexpression at 30 and 60 min of incubation (p < 0.001, one-way robust ANOVA test) (Figure 1A). The choice of non-standard robust ANOVA test is explained by large difference in dispersion between different treatments (max(s2)/min(s2) > 3–4 [25]), so the classical ANOVA test cannot be applied. The yiaG gene has demonstrated a relatively high expression level after 30 min of treatment with rifampicin (p < 0.001, one-way robust ANOVA test) (Figure 1B). This is confirmed by the data of bioinformatic analysis. Nevertheless, treatment with holomycin has also led to an increase in gene expression after 30 min incubation (p < 0.001, one-way robust ANOVA test). After 60 min, the yiaG gene demonstrated a decrease in expression level after rifampicin treatment (p < 0.01, one-way robust ANOVA test), while it increased after holomycin treatment (p < 0.001, one-way robust ANOVA test). Holomycin belongs to the group of antimicrobial natural products known as dithiolopyrrolones, which were previously thought to target RNA polymerase [26]. It also acts as a zinc ion chelator [27]. Holomycin treatment of E. coli results in inhibition of class II fructose bisphosphate aldolase but not RNA polymerase [28]. Therefore, the yiaG gene cannot be used as a reliable marker for bacterial transcription inhibition.
Similar results were observed for the msyB gene (Figure 1C), which demonstrated a significant (p < 0.001 at 30 min, one-way robust ANOVA test), but not a big enough overexpression level after treatment with rifampicin and holomycin. However, after 60 min of incubation, rifampicin treatment led to a significant decrease in the expression level of the gene (p < 0.05, one-way robust ANOVA test). In the case of holomycin treatment, both 30 and 60 min incubations resulted in significant overexpression level of msyB gene with almost the same fold change value (p < 0.001, one-way robust ANOVA test). The expression level of the ydiZ gene did not change significantly due to rifampicin treatment (p > 0.5, one-way robust ANOVA test) (Figure 1D). The expression levels of genes aceB, aceA, luxS, ahr and ppsA were generally not significantly different from the control (p > 0.5, one-way robust ANOVA test) for almost every treatment (Figure S1). All of the potential marker genes mentioned above, due to their demonstrated expression properties when treated with various antibiotics, cannot be used as indicators of transcription inhibition and therefore were excluded from further analysis.
The last of the tested genes, speE (Figure 1E), has demonstrated significant overexpression after treatment with rifampicin (p < 0.001 at 30 and 60 min, one-way robust ANOVA test), while almost all other treatments, including holomycin, have not significantly changed the expression level of the gene (p > 0.05 at 30 and 60 min, one-way robust ANOVA test). This spermidine synthase gene was chosen to be further confirmed as a potential marker of bacterial transcription stress.

2.3. Analysis of the Expression Level of speE Gene in E. coli lptDmut Strain Model

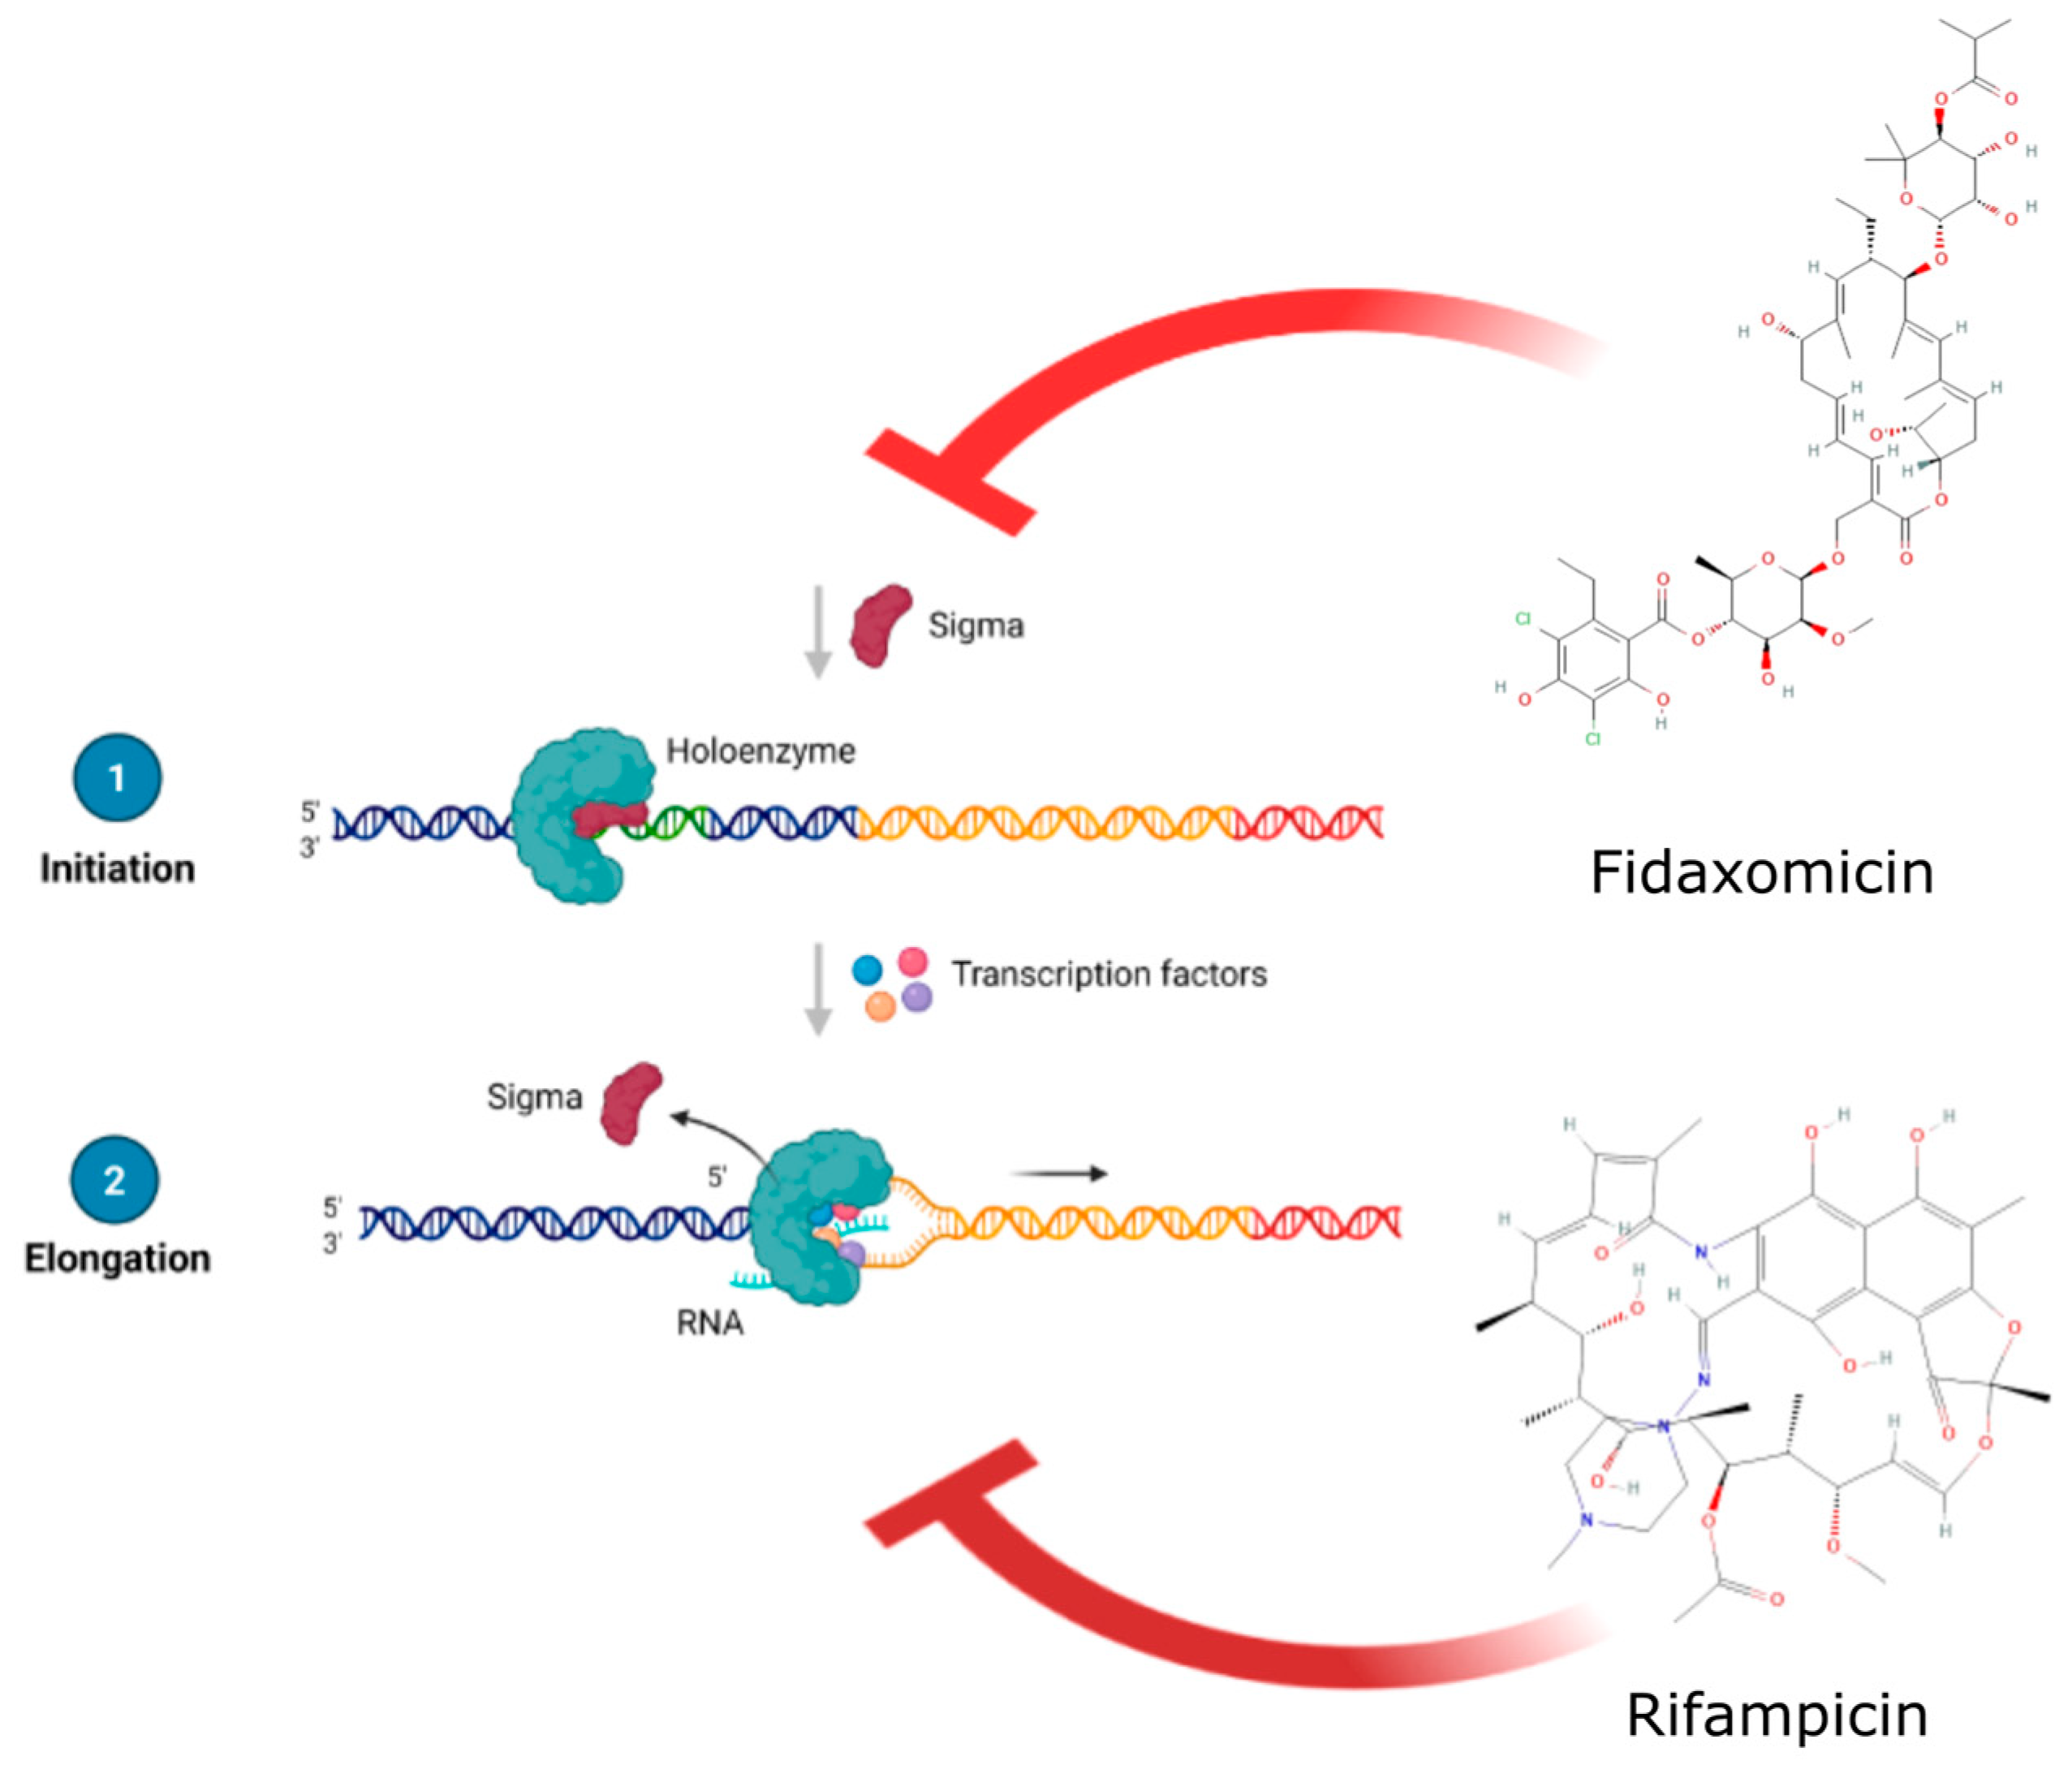
At this moment, there are not many antimicrobial compounds, particularly in readily available forms, that can directly or indirectly disrupt bacterial transcription and simultaneously have an effect on Gram-negative bacteria. In the next steps of the experiments, E. coli lptDmut [29] was used. It has a deletion in the LPS-assembly protein LptD gene, and is characterized by increased susceptibility to antimicrobials. In some cases, it can be affected by compounds that primarily work on Gram-positive microorganisms. The next qPCR experiment was performed to analyze speE gene expression after antibiotic treatments using E. coli lptDmut as a model microorganism, with fidaxomicin as another positive control that affects the initiation of transcription process, thereby demonstrating distinct from the rifampicin mechanism of action (Figure 2) [30,31]. According to an agar plate test, fidaxomicin impeded the growth of the chosen strain (Figure S2), but the inhibition zone was significantly smaller than that of rifampicin. The weaker effect of fidaxomicin was also demonstrated by MIC values (31.25 µg/mL for fidaxomicin compared to 0.02 µg/mL for rifampicin). The test was carried out similarly to that for the K12 strain, except that holomycin was replaced by fidaxomicin, and antibiotics were tested at 5x MIC and 2x MICs.
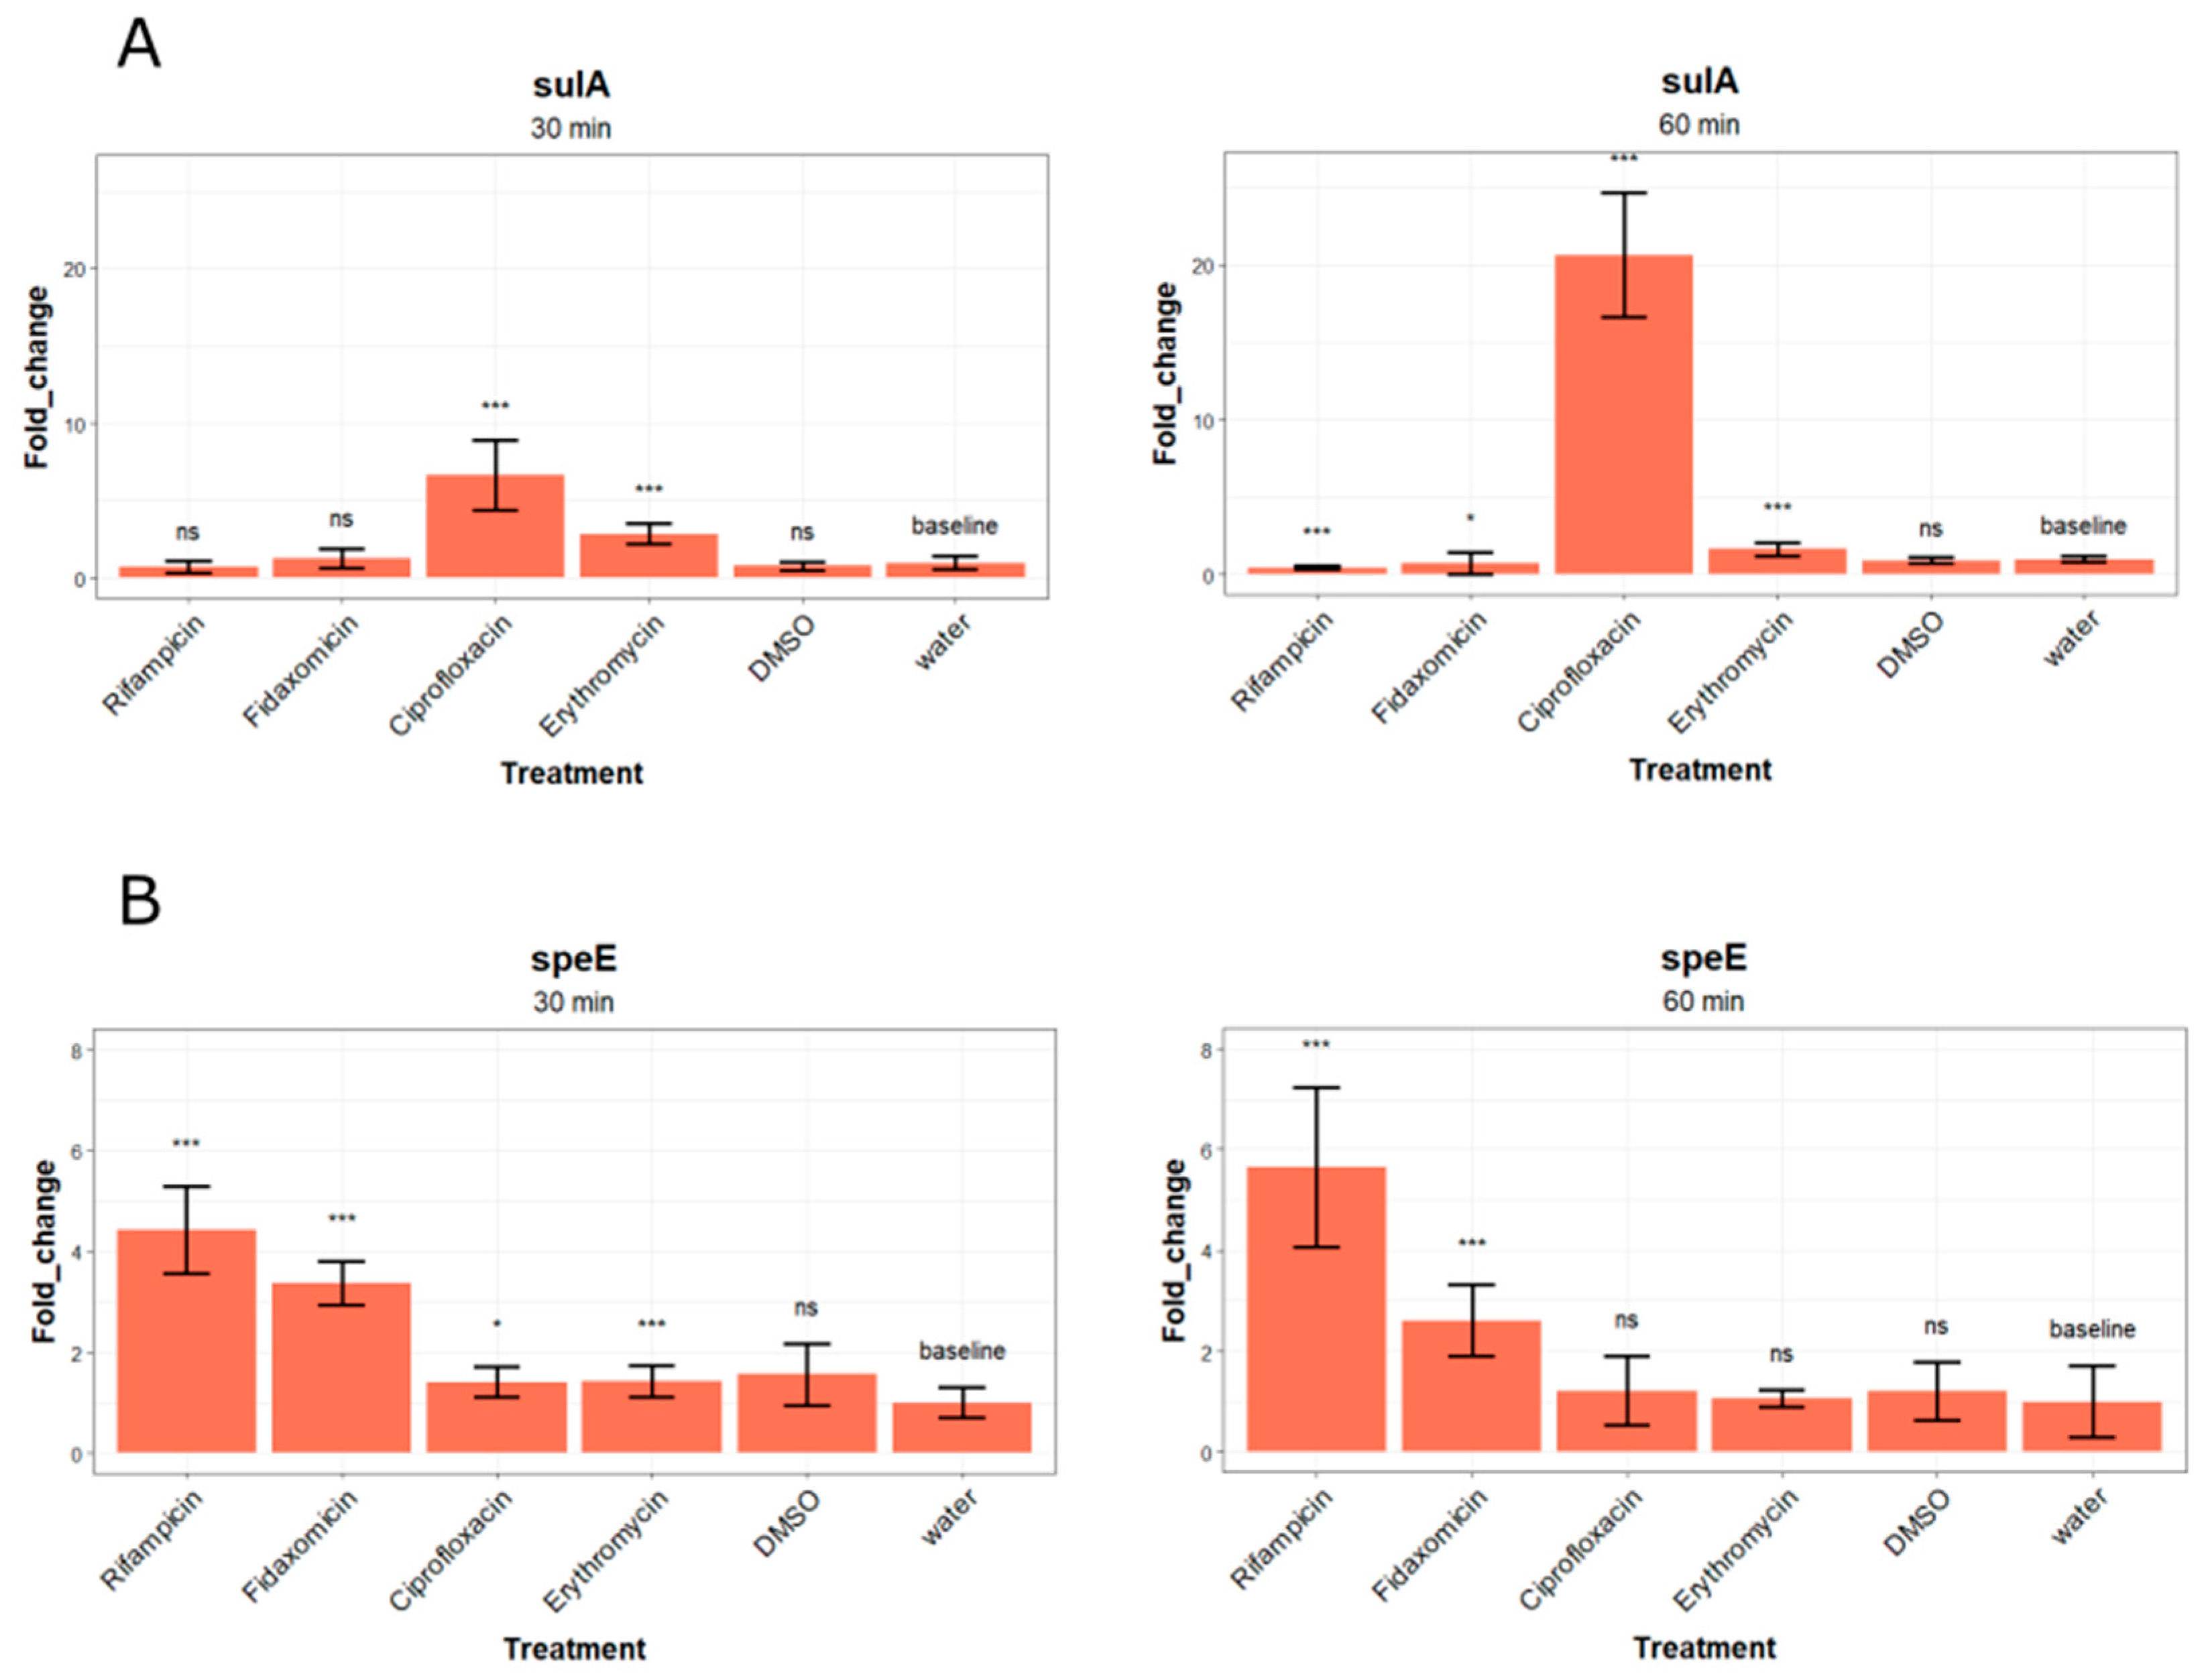
The sulA gene, after treatment with test antibiotics at 2x MICs, demonstrated almost the same expression profile as in the case of K12 cells. Ciprofloxacin treatment results in a significant increase in overexpression (p < 0.001 at 30 and 60 min, one-way robust ANOVA test) (Figure 3A). The wild-type strain had slightly different average expression values in this case. It can be explained by the specificity of the response to antibiotic stress in the susceptible-to-antimicrobials E. coli lptDmut strain.
The potential marker gene speE was significantly overexpressed after cells were treated with rifampicin (p < 0.001 at 30 and 60 min intervals, one-way robust ANOVA test) (Figure 3B), which supports the previous test. The same was observed for fidaxomicin treatment. The expression level of the speE gene also increased significantly when treated with this antibiotic (p < 0.001 at 30 and 60 min, one-way robust ANOVA test). Despite the treatment of ciprofloxain and erythromycin, significant differences in expression levels were found with the water control treatment (p < 0.05 and p < 0.001 respectively at 30 min, one-way robust ANOVA test). The mean expression levels of the speE gene after those treatments have not reached the minimum threshold required to be considered sufficient. Despite this, the speE gene’s expression level slightly increased after 60 min of rifampicin treatment, whereas it decreased after fidaxomicin treatment at the same incubation time. This might be attributed to the mechanism of action of fidaxomicin and the lack of susceptibility to it of the lptDmut strain in contrast to Gram-positive bacteria [32].
Incubation of lptDmut strain with 5x MIC antibiotic concentrations for 30 min led to a significant increase in the expression level of speE after rifampicin and fidaxomicin treatments (p < 0.001, one-way robust ANOVA test) (Figure S3). Nevertheless, the expression values for both treatments were noticeably lower than those of the treatment with a lower concentration. It can be explained with a significant increase in RNA synthesis inhibition, which to some extent neutralized the effect of overexpression of the marker gene. A large standard deviation in the case of DMSO treatment might also indicate additional influence of the vehicle as a stress factor in such concentration, despite its effect not being significant (p > 0.05, one-way robust ANOVA test). What is more, such higher antibiotic concentrations may disrupt the observed effect of treatment on detected gene expression levels due to its impact on bacterial viability, whereas 2x MIC may indeed have a minor effect on cell amount; this also needs the introduction of post-treatment normalization of purified RNA amount on cell viability, which makes the screening procedure more complicated. Therefore, for further screening procedures, the 2x MIC antimicrobial concentration and incubation time of 30 min were selected as the most suitable conditions.

2.4. Antimicrobial-Producing Strains’ Column Chromatography Fractions Screening

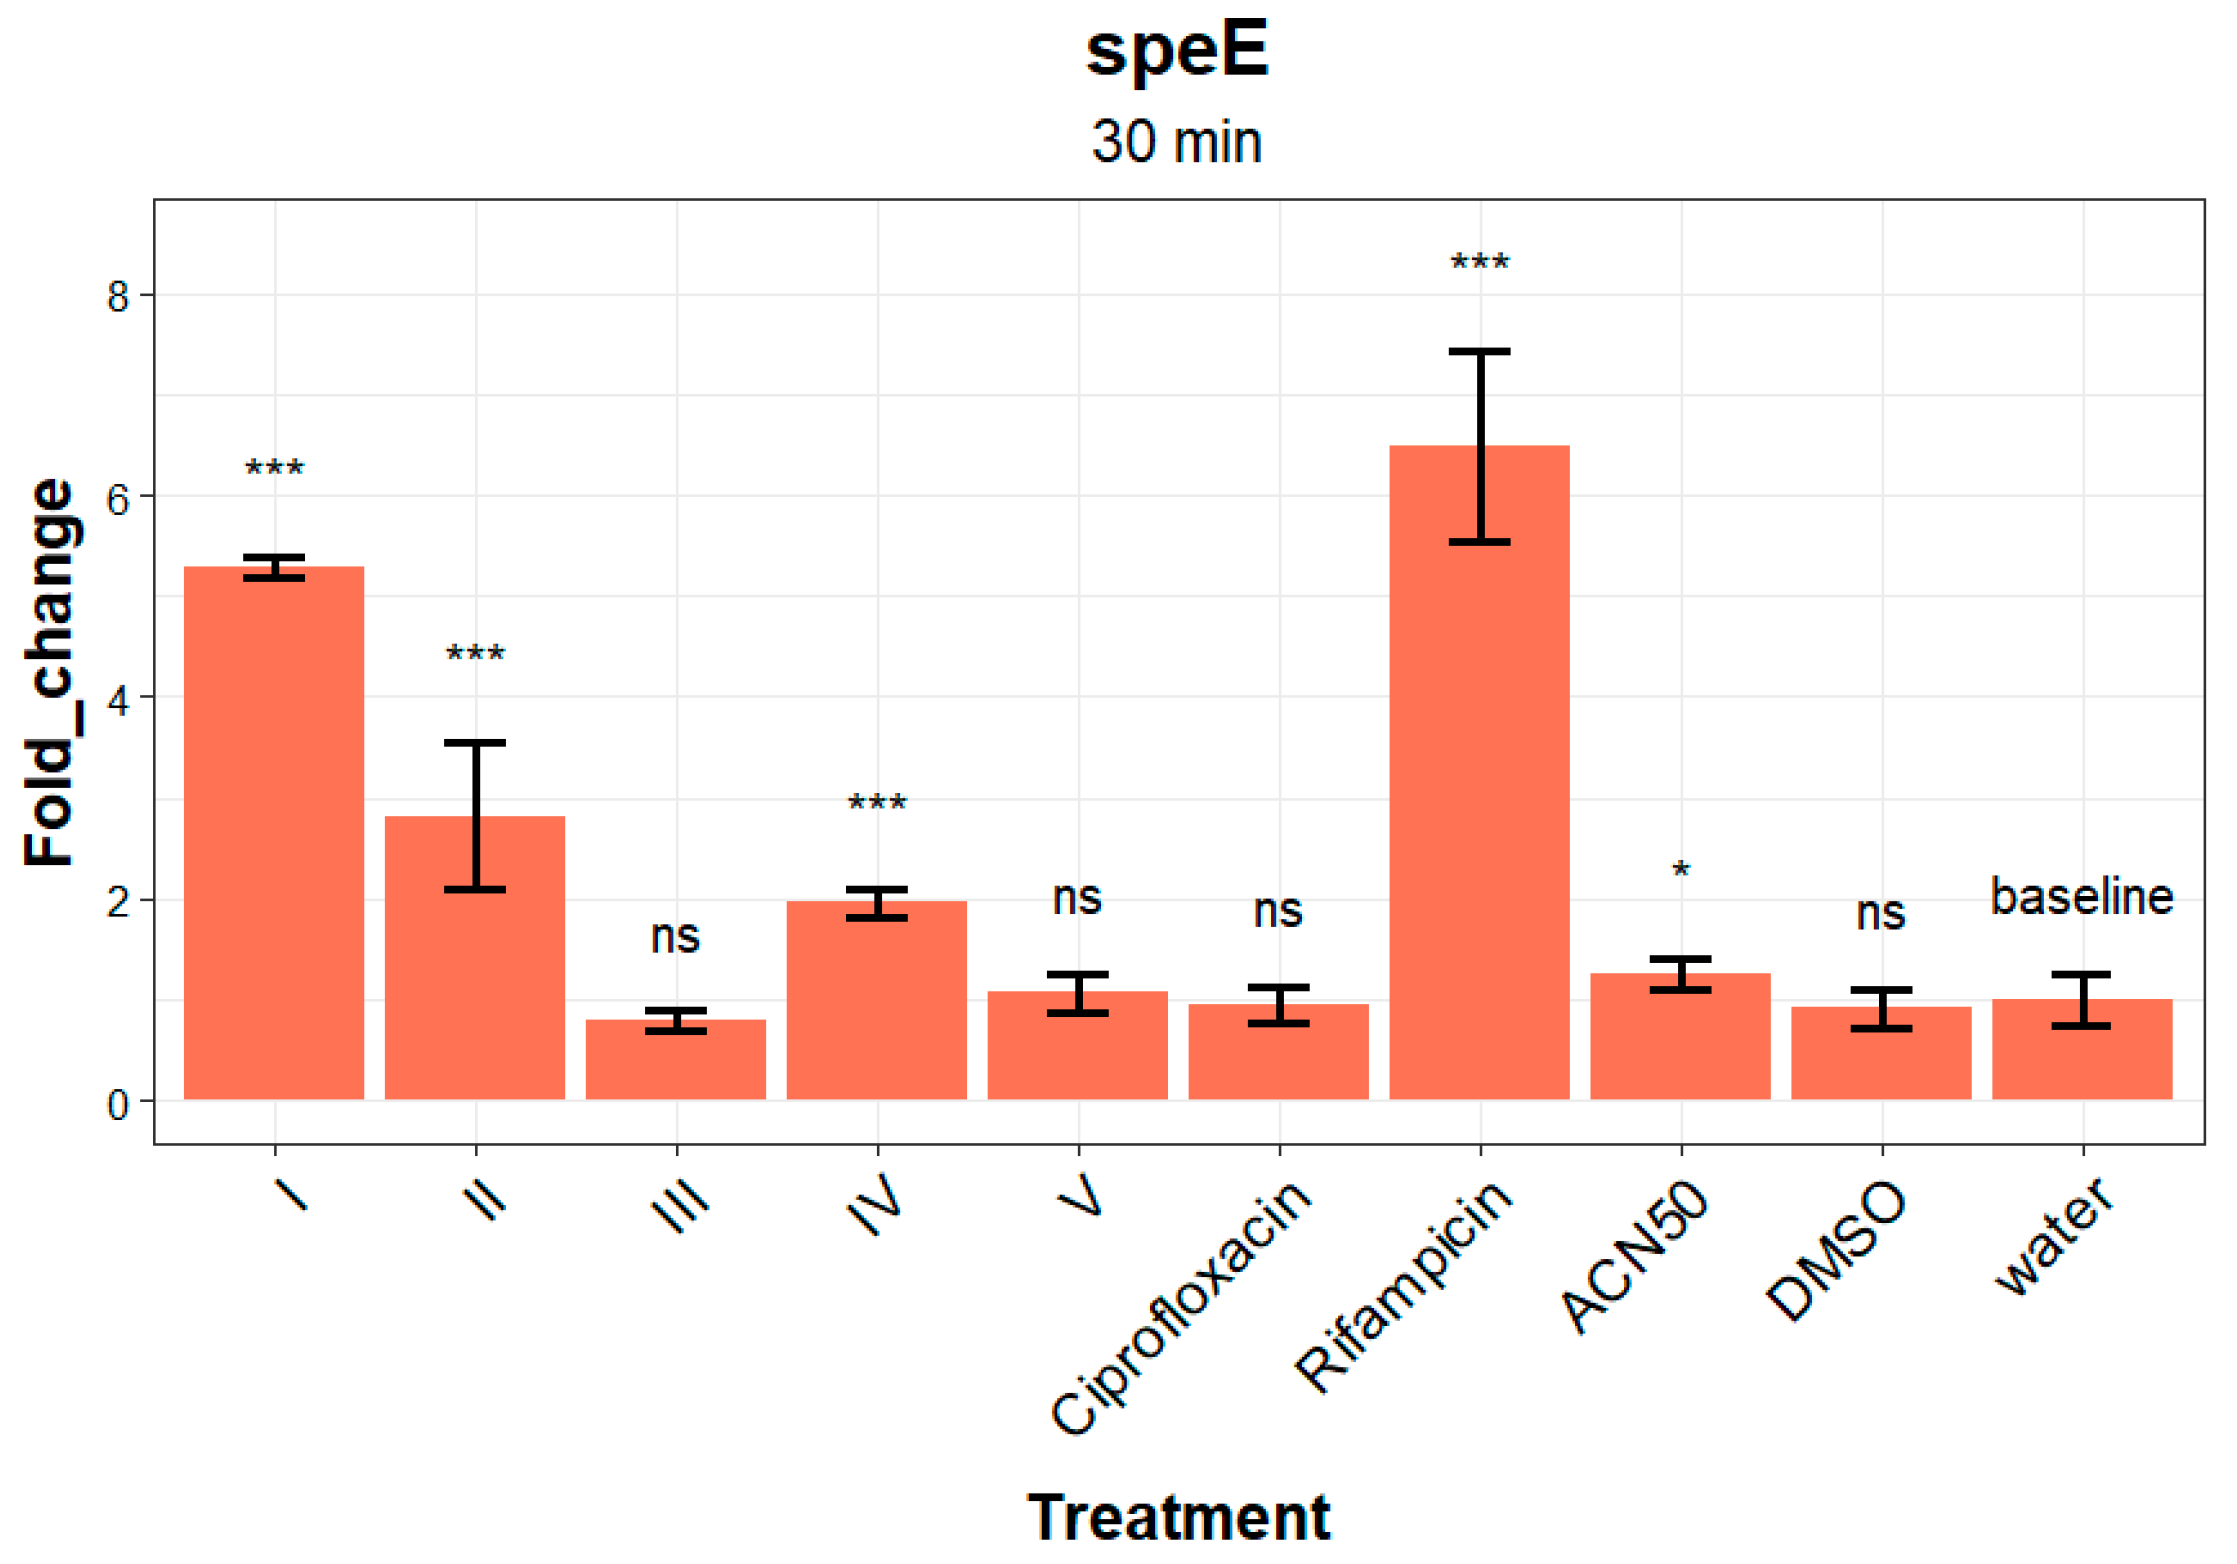
To test the developed bacterial transcription stress screening system based on RT-qPCR procedure with primers specific for the speE gene, five samples were tested against lptDmut culture media. This media was obtained as a result of microorganism cultivation and was concentrated on column chromatography. Fractions with additional controls (rifampicin, ciprofloxacin, MeCN 50%, and DMSO) were used to treat E. coli lptDmut strain cultures. The in vitro agar plate test (Figure S4) showed that the fractions had a strong effect on the strain. The concentration of the active compound in the given fractions could not be measured because the concentration of antibiotics is unknown. The MIC value will be replaced with the concept of minimum inhibitory dilution (MID), which will be measured using a procedure that is similar to the calculation of MIC. As in previous treatments, column chromatography fractions were used 2x MID with 30 min of incubation. The results have shown a significant increase in speE gene expression after treatment with rifampicin, as well as in samples I, II, and IV (p < 0.001, one-way robust ANOVA test) (Figure 4).
The speE gene fold change values seen in sample I are similar to those observed in the control treatment with rifampicin, suggesting that sample I may contain a compound that can inhibit the transcription process in bacteria.
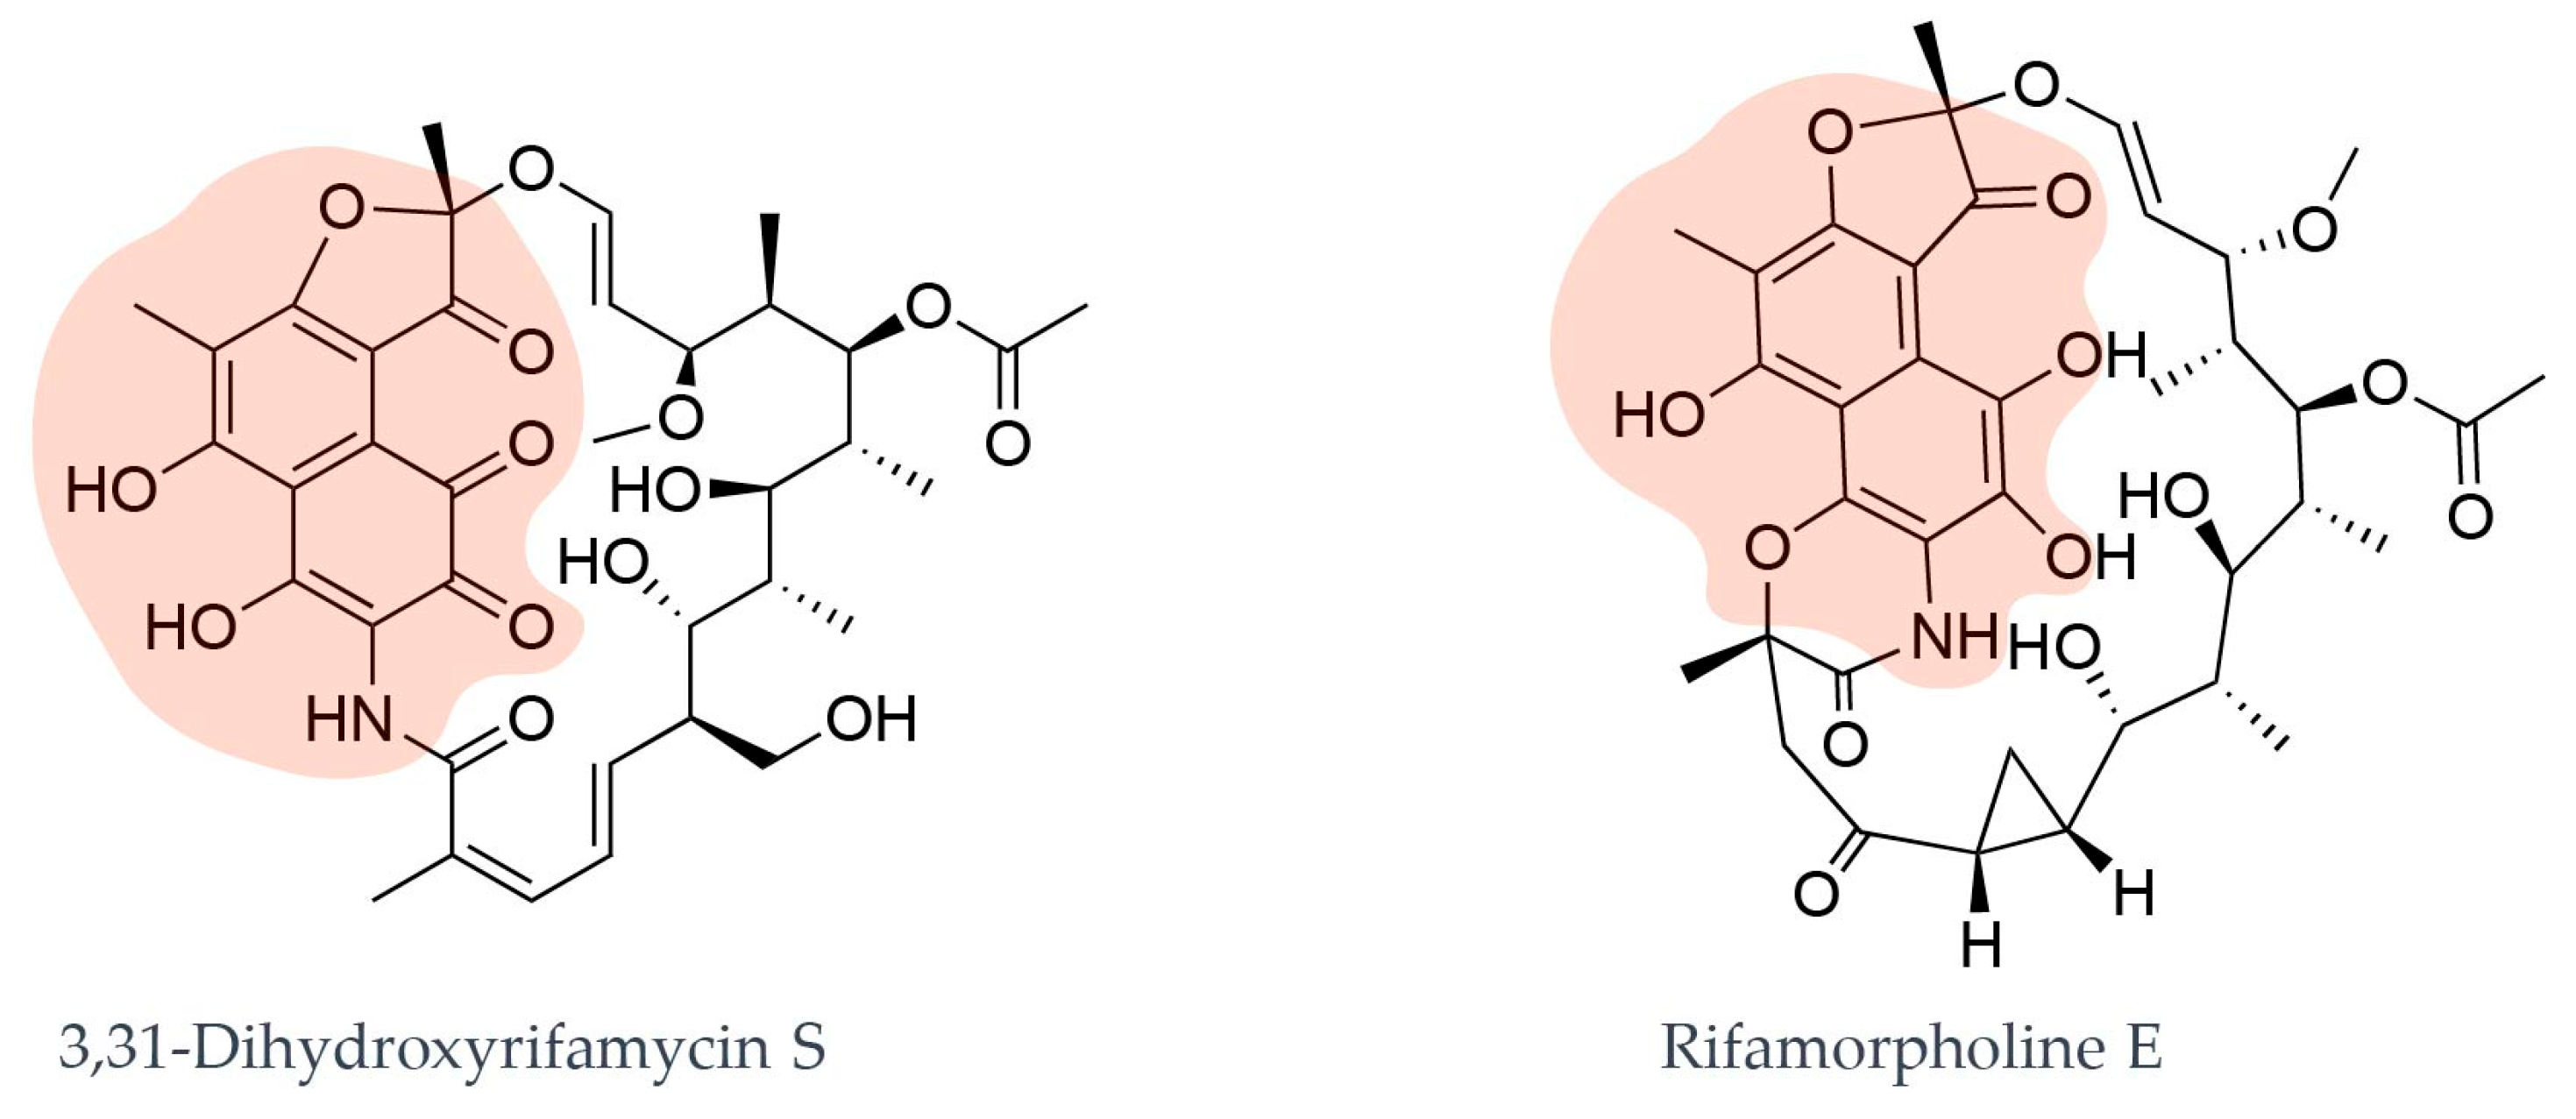
To characterize this complex mixture, sample I (Streptomyces sp. VKM Ac-3162) was further separated by reverse-phase HPLC (Figure S5). The collected fractions were assessed for antibacterial activity, and a single active peak (retention time 12.8 min) was isolated for LC-MS analysis. HR-LCMS analysis of the active fraction revealed an ion at m/z 728.2602, corresponding to the [M+H]+ adduct, and an ion at m/z 726.2764, corresponding to the [M-H] adduct. These ions are consistent with the molecular formula C37H45NO14 (calculated mass 727.2836, Δ0.6 ppm), which matches both 3,31-dihydroxyrifamycin S and rifamorpholine E (Figure 5)—members of the rifamycin family. MS fragmentation in negative mode (Figure S6) showed a fragment at m/z 273, characteristic of the naphthofuran moiety common to rifamycins [33,34,35]. UV spectral data (Figure S5) further supports this assignment. Based on these data, together with the proposed RNA polymerase inhibitory mechanism known for rifamycins [36] and demonstrated using the E. coli BW25113 lptDmut reporter (Figure S4), the active compound can be confidently assigned to the rifamycin family. Given the biosynthetic richness of the rifamycin family [37], the studied strain is expected to produce multiple congeners of this class. This assignment confirms the correct operation of our screening system based on quantitative PCR, designed to search for compounds that disrupt the transcription process in bacteria.

3. Discussion

Bacterial resistance to antimicrobial substances is becoming an increasingly threatening global issue with harmful consequences if nothing is done about it. One of the main approaches to solving the problem is screening new potential antibiotics from synthetic molecule libraries and natural sources. The use of reporter systems significantly improves the procedure as they provide information about the potential mechanisms of action of certain antibiotics. It can be applied to standard model organisms (including E. coli and B. subtilis) as well as known pathogenic species [38,39,40]. Most of these reporter systems allow the identification of antibiotics that act on relatively common targets, such as ribosomes and DNA. However, there are several examples of systems that can detect antibiotics with specific targets [12,41,42].
A suitable target for screening and identification of new antimicrobials could be bacterial RNA polymerase. Antibiotics that target this enzyme are not widely used in clinical practice, and therefore there are relatively few pathogenic strains that have developed resistance to them. A reporter system aimed to identify transcription stressors via agar plate test has been developed for the B. subtilis model. The system consists of a promoter of the yppS gene linked to the reporter β-galactosidase gene, which showed stable induction after treatment with rifampicin and fidaxomicin [9]. Another B. subtilis high-throughput screening system for RNA synthesis stress was developed using the yvgS gene promoter fused to the firefly luciferase reporter gene [43]. However, there is no evidence that reporter constructs based on specific promoters can detect transcription inhibition of antibiotics specifically in Gram-negative bacteria.
In the present study, bioinformatic analysis of transcriptomic data from E. coli K12 treated with three different antibiotics—rifampicin, tetracycline, and novobiocin—revealed a set of genes whose expression levels were significantly elevated exclusively following rifampicin treatment. However, further analysis by quantitative PCR (qPCR) using an additional control antibiotic, holomycin, enabled the exclusion of the vast majority of these candidate genes, with the exception of the spermidine synthase gene (speE), which showed a marked and selective increase in expression only after rifampicin exposure. A subsequent qPCR experiment involving treatment of the E. coli lptD mutant strain with RNA polymerase inhibitors and the antibiotic fidaxomicin (as a positive control) demonstrated that speE can serve as a genetic marker for transcription inhibition stress. Moreover, there was no available transcriptomic data that compared E. coli rifampicin treatment with another set of antibiotics except translation and DNA stressors. Nevertheless, we have tried to analyze separate treatments of E. coli with ampicillin (PRJNA156979) and imipenem (PRJNA910221) treatments as cell wall synthesis inhibitors and colistin (PRJNA671752) treatment as a membrane disruptor; the results have shown no significant increase in speE gene expression level in all cases (Table S3). Finally, the proposed screening system based on RT-qPCR proved effective in analyzing culture fluids and chromatography fractions for the presence of RNA synthesis inhibitors, allowing the identification and isolation of rifamycin family compounds from column chromatography samples.
The relationship between transcription stress in E. coli and the specific overexpression of the spermidine synthase gene poses an important question. It is known that polyamines play a crucial role in maintaining bacterial cell homeostasis, as they are necessary for normal cell growth [44]. Additionally, they are crucial in the formation of biofilm [45] and play a role in regulating virulent factors in pathogenic bacteria [46]. Understanding the function of polyamines in bacterial cells may shed light on the possible explanations why the spermidine synthase gene was overexpressed when E. coli cells were exposed to transcription-disrupting compounds. Most spermidine in bacterial cell (1.4 mol) exists as a complex with RNA [47], and it can stimulate protein synthesis via decreasing Mg2+ concentration [48], as well as the synthesis of the products of the genes rpoE and stpA that are linked with transcription are stimulated by spermidine analogue called homospermidine [49]. So, it can be suggested that the increase in spermidine synthase gene expression after moderate transcription disruption with the acceleration of endogenous spermidine content may contribute to the compensation of the RNA synthesis inhibition via enhancing of transcription factor synthesis as well as accumulation of sigma factor associated with stress response. Interestingly, according to transcriptomic data the expression level of rpoE gene has not changed significantly (p > 0.05) (Table S2). Moreover, there is some experimental evidence in the literature about the possibility of polyamines to interact with free nucleotides [50,51], as well as spermidine also being capable of binding to ATP [47]; with the fact that some excess of nucleotide tri-phosphates may arise during transcription inhibition, it is possible that an increase in speE gene expression may lead to an increase in spermidine levels in the cell, which will bind to these excess nucleotides.

4. Materials and Methods

4.1. Bacterial Strains and Culture Conditions

In this work E. coli K12 and E. coli BW25113 lptDmut strains were used. Both strains were aerobically cultured in lysogeny broth (LB) medium at 37 °C overnight with constant shaking (200 rpm, 14 h). For antibiotic and MIC tests overnight, cultures were diluted 1:100 in fresh LB medium and incubated at 37 °C with constant shaking until OD600 reached 0.6. The antibacterial activity of the fractions was assessed using the reporter system E. coli lptDmut pDualrep2.1 [52]. E. coli BW25113 lptDmut carries a 69-nucleotide deletion in the lptD gene, which results in increased cell membrane permeability and consequently higher susceptibility to toxic compounds. The plasmid pDualRep2.1 drives expression of the red fluorescent protein TurboRFP upon activation of the SOS response, and the far red fluorescent protein Katushka2S upon disruption of translation.
For antibiotic tests, 5 mL of bacterial cultures were treated with 2x or 5x minimal inhibitory concentration (MIC) of antibiotic solutions or column chromatography fractions, as well as solvents of the corresponding antibiotics (DMSO, 50% MeCN) and deionized water as negative control. Treated cultures were incubated at 37 °C with constant shaking (200 rpm) for 30 and 60 min and then centrifuged (5700× g, 2 min) for collecting cell pellets; after removing the supernatant, the pellets were centrifuged again for 15 s to remove residual media, and after that they were frozen in liquid nitrogen and stored at −80 °C for further analysis.

4.2. Determination of Minimal Inhibitory Concentration (MIC)

Bacterial cultures with OD600 0.6 were diluted 1:1000 in LB medium and loaded into a 96-well plate in a volume of 100 µL, with an initial volume of 200 µL prior to serial dilution, as it was described here [53]. Stock solutions of antibiotics were added to the initial wells at appropriate concentrations (rifampicin—25 mg/mL, holomycin—25 mg/mL, ciprofloxacin—100 µg/mL, erythromycin—50 mg/mL for E. coli K12 strain, and rifampicin—100 µg/mL, fidaxomicin—50 mg/mL, ciprofloxacin—20 µg/mL, erythromycin—5 mg/mL in the case of the E. coli lptDmut strain). When column chromatography fractions were tested, 10 and 50 µL of each fraction were added to the 190 and 150 µL of diluted bacterial culture in initial wells respectively. In other wells diluted inoculated LB-culture media were added without antibiotics or column chromatography fractions, while the rest were left with LB media only as additional controls of sterility. A two-fold serial dilution was then carried out, with gentle mixing in each row. Afterwards those plates were incubated at 37 °C with shaking at 500 rpm in a plate thermo shaker (MB100-4A, Allsheng, Hangzhou, China), overnight. Cell growth was measured at 590 nm using a microplate reader (VICTOR X5Light Plate Reader, PerkinElmer, Shelton, CT, USA).

4.3. Data Analysis and Bioinformatics

For searching of genes, specifically overexpressing after rifampicin treatment, transcriptomic data of E. coli str. K12 substr. MG1655 control and antibiotic-treated cultures with accession number PRJNA889731 were used. An enriched library dataset was downloaded, and reads were mapped on E. coli genome using Bowtie2 program [54]. SAMtools were used for transformation of mapped reads into binary format and sorting [55]. FeatureCounts v2.0 [56] program was used for quantification of gene expression levels according to the genomic annotation corresponding to the MG1655 strain; the E. coli database used for mapping was GCF_000005845.2. For calculation of differentially expressed genes DESeq program on the R 4.5 platform was used [57], and for each antibiotic vs. control pair the calculations were performed in triplicates.

4.4. RNA Extraction and Quantitative Real Time-PCR (qPCR)

The expression values of candidate genes were measured by RT-qPCR. For this purpose, bacterial cultures at OD600 0.6 were treated for 30 and 60 min with antibiotics with different mechanisms of action, including transcription inhibitors, followed by RNA isolation and cDNA synthesis. The differential expression was calculated with respect to expression in the control using the 2 to the power of the minus delta-delta cycle threshold (2−ΔΔCT) method, normalizing for 23S rRNA as an endogenous control and for deionized water as a treatment control.
RNA from E. coli cells was isolated using RNA Solo kit (Evrogen, Moscow, Russia) according to the manufacturer’s protocol, and the concentration was measured using Qubit RNA HS Assay Kit (Life Technologies, Thermo Fisher Scientific Inc., Waltham, MA, USA). cDNA was synthesized from 1 μg of RNA by using Magnus reverse transcriptase (Evrogen, Russia).
Real-time PCR was performed in triplicate with CFX96 Touch Real-Time PCR Detection System (Bio-Rad, Hercules, CA, USA) using 5X qPCRmix-HS SYBR (Evrogen, Russia). Primer sequences of tested genes are given in Table 3.

4.5. Isolation and Identification of Bioactive Compound

To obtain a sufficient amount of the active compound for detailed bioactivity studies, strains was cultured in four 750 mL Erlenmeyer flasks with 150 mL of liquid PDS+starch (g/L: Grated potato 200.0, Glucose 20.0, Starch 10.0; pH 6.5–7.0, sterilized by autoclaving at 111 °C and 0.5 atm for 20 min) at 28 °C with shaking (200 rpm) for 10 days. Culture liquids were separated from biomass by centrifugation at 20,000× g for 20 min (Centrifuge 5810 R, Rotor FA-45-6-30, Eppendorf, Hamburg, Germany).
One liter of the clarified supernatant was loaded onto a 30 mL cartridge containing 7 g of LPS-500-H polymer sorbent (divinylbenzene hydrophilic copolymer, pore size 50–1000 Å, 70 μm; Technosorbent, Moscow, Russia) at a flow rate of 15 mL/min using a peristaltic pump (Masterflex L/S Variable Speed Pump System, Masterflex, Gelsenkirchen, Germany). Sequential elution was performed with 15 mL portions of water–acetonitrile (MeCN) mixtures containing 0, 10, 20, 30, 40, 50, 75, and 100% MeCN. The biological activity of each fraction was assessed using the reporter E. coli lptDmut strain [58].
Active column chromatography fraction was analyzed by reverse-phase HPLC using Agilent 1260 Infinity II (Agilent Technologies, Santa Clara, CA, USA) equipped with UV-Vis 1260 Diode Array detector WR (Agilent Technologies, Santa Clara, CA, USA). Separation was performed on a Nucleodur C18 gravity column (260 mm × 4.6 mm, 5 μm, 110 Å; Machery-Nagel, Duren, Germany) with solvent A (10 mM NH4OAc) and solvent B (MeCN). The elution profile consisted of gradient 20–60% eluent B over 10 min and a 4 min column wash with 60% eluent B with flow rate 1 mL/min and detection on 260 nm (Figure S4). The collected fractions were assayed for antibacterial activity; the fraction containing the pure active compound was isolated and further subjected to LC-MS analysis.
Mass spectra were collected using a maXis II 4G ETD mass spectrometer (Bruker Daltonics, Bremen, Germany) and UltiMate 3000 chromatograph (Thermo Fisher Scientific, Waltham, MA, USA), equipped with an Acclaim RSLC 120 C18 column (2.1 × 100 mm, 2.2 μm, Thermo Fisher Scientific, Waltham, MA, USA). The spectrum registration mode and ESI mode were determined with a full scan from m/z 100 to 1500, and MS/MS was performed with the selection of the three most intense ions, with the dissociation type CID 10–40 eV and nitrogen collision gas. Raw data were collected and processed on Thermo Xcalibur Qual ver. 4.3.73.11.
The identity of the samples was confirmed by HPLC-HRMS/MS analysis using the Orbitrap Exploris 240 mass spectrometer (Thermo Fisher Scientific, Waltham, MA, USA) coupled with the Vanquish UHPLC system (Thermo Fisher Scientific, Waltham, MA, USA), equipped with a reversed-phase Acclaim™ 120 C18 (2.2 µm, 2.1 × 150 mm) column (Dionex, Sunnyvale, CA, USA). Eluent A was 0.1% formic acid in ultrapure water; eluent B was 0.1% formic acid in acetonitrile. Chromatographic separation was carried out at 45 °C in gradient elution mode at a flow rate of 0.4 mL/min. The gradient program was as follows: 0–3 min, 5% B; 3–17 min, 5–95% B; 17–21 min, 95% B; 21–22 min, 95–5% B. Injection volume was 10 µL and autosampler temperature was 4 °C. Mass spectra were acquired separately in both positive and negative ionization modes. Heated electrospray ionization (ESI) source parameters were as follows: ion source voltage—3500 V for positive ionization mode or 2500 V for negative ionization mode; sheath/auxiliary/sweep gas—50/10/1 arb; ion transfer temperature—325 °C; vaporizer temperature—350 °C. Mass spectra were recorded with a full scan from m/z 50 to 2000. The resolution was 30,000 (for both MS1 and MS2 spectra), the RF lens—70%. MS2 spectra were acquired in data-dependent acquisition (DDA) mode using dynamic exclusion-based precursor selection. Higher-energy collisional dissociation (HCD) fragmentation parameters were as follows: isolation window—m/z 1 with isolation offset turned off; normalized collision energy—15%, 30%, 45%, and 60%; normalized automatic gain control (AGC) target—200% with a maximum injection time parameter set to “auto”.
At the stage of preliminary experiments low-resolution mass spectra (LRMS) were recorded by HPLC-MS analysis using the EXPEC L-Chrom MS triple quadrupole system (Expec, Hangzhou, China) equipped with an electrospray ionization source (ESI).

4.6. Statistical Analysis

Each experiment was performed with three replicates. qPCR quantitative data are presented as the mean ± standard deviation (SD). qPCR assays were assessed using one-way robust ANOVA based on 20% trimmed means (WRS2 1.1-7 package, R 4.5). Post hoc comparisons were conducted using mcppb20 function (percentile bootstrap, 20% means trimming). All statistical calculations and diagramming were performed in the Rstudio program; the ggplot2 4.0.0 package was used for figure drawing. The results were deemed significant when p < 0.05.

5. Conclusions

The antibiotic resistance crisis requires searching for new strategies for the discovery and identification of new antibiotics, as well as improving current instruments, including reporter systems. Searching for markers that can identify transcription inhibitors of antimicrobials in Gram-negative bacteria can serve as a valuable aid in the fight against antimicrobial resistance. This group of antibiotics is not widely used in clinical practice. Here, we identified the spermidine synthase gene as a suitable biomarker for the detection of RNA synthesis stressors using RT-qPCR method. The system can also be applied in screening cultural fractions obtained from antimicrobial-producing microorganisms, which can simplify the further exploration of novel transcription inhibitor compounds. The tool provided has the potential to be used in screening procedures that aim to find new antimicrobials that can treat resistant pathogens.

Supplementary Materials

The following supporting information can be downloaded at: https://www.mdpi.com/article/10.3390/ijms27114829/s1.

Author Contributions

Conceptualization, O.A.D., P.V.S. and D.A.L.; methodology, A.R.I. and D.A.L.; software, A.R.I. and A.P.C.; validation, A.R.I. and A.P.C.; formal analysis, D.A.L.; investigation, M.Y.Z., A.Y.R., R.M.O., Y.A.I., V.N.T., I.A.V., L.V.D. and I.A.R.; resources, L.I.E., I.A.R., D.A.L., P.V.S. and O.A.D.; data curation, A.R.I. and A.P.C.; writing—original draft preparation, A.R.I., A.P.C. and D.A.L.; visualization, A.R.I., A.P.C. and V.A.A.; supervision, D.A.L., P.V.S. and O.A.D.; project administration, D.A.L. and P.V.S.; funding acquisition, D.A.L. All authors have read and agreed to the published version of the manuscript.

Funding

This study was supported by a grant from the Russian Science Foundation (No. 24-74-00139).

Institutional Review Board Statement

Not applicable.

Informed Consent Statement

Not applicable.

Data Availability Statement

Transcriptomic data used in this work were earlier deposited at NCBI BioProject under the accession number PRJNA889731.

Acknowledgments

We are especially grateful to Maria I. Zvereva for consultation and suggestion of one of the probable mechanisms underlying the induction of our studied marker, as well as to Daniil S. Igumnov for consultation about bioinformatic procedure. HPLC-MS analysis was supported by Lomonosov Moscow State University Program of Development. Salary support from the State Assignment of Lomonosov Moscow State University (project nos. 121031300037-7).

Conflicts of Interest

The authors declare no conflicts of interest.

References

  1. Gelpi, A.; Gilbertson, A.; Tucker, J.D. Magic Bullet: Paul Ehrlich, Salvarsan and the Birth of Venereology. Sex. Transm. Infect. 2015, 91, 68–69. [Google Scholar] [CrossRef] [Scilit] [PubMed]
  2. Fleming, A. On the Antibacterial Action of Cultures of a Penicillium, with Special Reference to Their Use in the Isolation of B. influenzae. 1929. Bull. World Health Organ. 2001, 79, 780–790. [Google Scholar]
  3. Lewis, K. Platforms for Antibiotic Discovery. Nat. Rev. Drug Discov. 2013, 12, 371–387. [Google Scholar] [CrossRef] [Scilit]
  4. Velez, R.; Sloand, E. Combating Antibiotic Resistance, Mitigating Future Threats and Ongoing Initiatives. J. Clin. Nurs. 2016, 25, 1886–1889. [Google Scholar] [CrossRef] [Scilit] [PubMed]
  5. Baym, M.; Stone, L.K.; Kishony, R. Multidrug Evolutionary Strategies to Reverse Antibiotic Resistance. Science 2016, 351, aad3292. [Google Scholar] [CrossRef] [Scilit]
  6. Bikard, D.; Euler, C.W.; Jiang, W.; Nussenzweig, P.M.; Goldberg, G.W.; Duportet, X.; Fischetti, V.A.; Marraffini, L.A. Exploiting CRISPR-Cas Nucleases to Produce Sequence-Specific Antimicrobials. Nat. Biotechnol. 2014, 32, 1146–1150. [Google Scholar] [CrossRef] [Scilit]
  7. Ranjan, A. The Use of Probiotics, Prebiotics, and Synbiotics as an Alternative to Antibiotics. In Alternatives to Antibiotics; Saha, T., Deb Adhikari, M., Tiwary, B.K., Eds.; Springer Nature: Singapore, 2022; pp. 449–465. [Google Scholar]
  8. Hutter, B.; Fischer, C.; Jacobi, A.; Schaab, C.; Loferer, H. Panel of Bacillus Subtilis Reporter Strains Indicative of Various Modes of Action. Antimicrob. Agents Chemother. 2004, 48, 2588–2594. [Google Scholar] [CrossRef] [Scilit]
  9. Wex, K.W.; Saur, J.S.; Handel, F.; Ortlieb, N.; Mokeev, V.; Kulik, A.; Niedermeyer, T.H.J.; Mast, Y.; Grond, S.; Berscheid, A.; et al. Bioreporters for Direct Mode of Action-Informed Screening of Antibiotic Producer Strains. Cell Chem. Biol. 2021, 28, 1242–1252.e4. [Google Scholar] [CrossRef] [Scilit] [PubMed]
  10. Melamed, S.; Naftaly, S.; Belkin, S. Improved Detection of Antibiotic Compounds by Bacterial Reporter Strains Achieved by Manipulations of Membrane Permeability and Efflux Capacity. Appl. Microbiol. Biotechnol. 2014, 98, 2267–2277. [Google Scholar] [CrossRef] [Scilit]
  11. Osterman, I.A.; Komarova, E.S.; Shiryaev, D.I.; Korniltsev, I.A.; Khven, I.M.; Lukyanov, D.A.; Tashlitsky, V.N.; Serebryakova, M.V.; Efremenkova, O.V.; Ivanenkov, Y.A.; et al. Sorting Out Antibiotics’ Mechanisms of Action: A Double Fluorescent Protein Reporter for High-Throughput Screening of Ribosome and DNA Biosynthesis Inhibitors. Antimicrob. Agents Chemother. 2016, 60, 7481–7489. [Google Scholar] [CrossRef] [Scilit]
  12. Müh, U.; Schuster, M.; Heim, R.; Singh, A.; Olson, E.R.; Greenberg, E.P. Novel Pseudomonas aeruginosa Quorum-Sensing Inhibitors Identified in an Ultra-High-Throughput Screen. Antimicrob. Agents Chemother. 2006, 50, 3674–3679. [Google Scholar] [CrossRef] [Scilit]
  13. Sadeeshkumar, H.; Balaji, A.; Sutherland, A.G.; Mootien, S.; Anthony, K.G.; Breaker, R.R. Screening for Small Molecule Inhibitors of SAH Nucleosidase Using an SAH Riboswitch. Anal. Biochem. 2023, 666, 115047. [Google Scholar] [CrossRef] [Scilit]
  14. Abrahams, G.L.; Kumar, A.; Savvi, S.; Hung, A.W.; Wen, S.; Abell, C.; Barry, C.E.; Sherman, D.R.; Boshoff, H.I.M.; Mizrahi, V. Pathway-Selective Sensitization of Mycobacterium tuberculosis for Target-Based Whole-Cell Screening. Chem. Biol. 2012, 19, 844–854. [Google Scholar] [CrossRef] [Scilit]
  15. Cox, J.A.G.; Mugumbate, G.; Del Peral, L.V.-G.; Jankute, M.; Abrahams, K.A.; Jervis, P.; Jackenkroll, S.; Perez, A.; Alemparte, C.; Esquivias, J.; et al. Novel Inhibitors of Mycobacterium tuberculosis GuaB2 Identified by a Target Based High-Throughput Phenotypic Screen. Sci. Rep. 2016, 6, 38986. [Google Scholar] [CrossRef] [Scilit]
  16. Kariv, I.; Cao, H.; Marvil, P.D.; Bobkova, E.V.; Bukhtiyarov, Y.E.; Yan, Y.P.; Patel, U.; Coudurier, L.; Chung, T.D.; Oldenburg, K.R. Identification of Inhibitors of Bacterial Transcription/Translation Machinery Utilizing a Miniaturized 1536-Well Format Screen. J. Biomol. Screen 2001, 6, 233–243. [Google Scholar] [CrossRef] [Scilit]
  17. Campbell, E.A.; Korzheva, N.; Mustaev, A.; Murakami, K.; Nair, S.; Goldfarb, A.; Darst, S.A. Structural Mechanism for Rifampicin Inhibition of Bacterial Rna Polymerase. Cell 2001, 104, 901–912. [Google Scholar] [CrossRef] [Scilit]
  18. Benjamini, Y.; Hochberg, Y. Controlling the False Discovery Rate: A Practical and Powerful Approach to Multiple Testing. J. R. Stat. Soc. Ser. B Stat. Methodol. 1995, 57, 289–300. [Google Scholar] [CrossRef] [Scilit]
  19. Ibrahim, M.; Grochowska, E.; Bednarczyk, M.; Stadnicka, K. Transgenerational Effects of in Ovo Stimulation with Synbiotic and Choline on Gonadal Tissue across Three Generations. Sci. Rep. 2025, 15, 30940. [Google Scholar] [CrossRef] [Scilit] [PubMed]
  20. Jimenez-Duran, G.; Luque-Martin, R.; Patel, M.; Koppe, E.; Bernard, S.; Sharp, C.; Buchan, N.; Rea, C.; de Winther, M.P.J.; Turan, N.; et al. Pharmacological Validation of Targets Regulating CD14 during Macrophage Differentiation. EBioMedicine 2020, 61, 103039. [Google Scholar] [CrossRef] [Scilit]
  21. Ysern, P.; Clerch, B.; Castańo, M.; Gibert, I.; Barbé, J.; Llagostera, M. Induction of SOS Genes in Escherichia coli and Mutagenesis in Salmonella typhimurium by Fluoroquinolones. Mutagenesis 1990, 5, 63–66. [Google Scholar] [CrossRef] [Scilit] [PubMed]
  22. Raouf, A.; Zhao, Y.; To, K.; Stingl, J.; Delaney, A.; Barbara, M.; Iscove, N.; Jones, S.; McKinney, S.; Emerman, J.; et al. Transcriptome Analysis of the Normal Human Mammary Cell Commitment and Differentiation Process. Cell Stem Cell 2008, 3, 109–118. [Google Scholar] [CrossRef] [Scilit] [PubMed]
  23. Peart, M.J.; Smyth, G.K.; van Laar, R.K.; Bowtell, D.D.; Richon, V.M.; Marks, P.A.; Holloway, A.J.; Johnstone, R.W. Identification and Functional Significance of Genes Regulated by Structurally Different Histone Deacetylase Inhibitors. Proc. Natl. Acad. Sci. USA 2005, 102, 3697–3702. [Google Scholar] [CrossRef] [Scilit]
  24. Patterson, T.A.; Lobenhofer, E.K.; Fulmer-Smentek, S.B.; Collins, P.J.; Chu, T.-M.; Bao, W.; Fang, H.; Kawasaki, E.S.; Hager, J.; Tikhonova, I.R.; et al. Performance Comparison of One-Color and Two-Color Platforms within the MicroArray Quality Control (MAQC) Project. Nat. Biotechnol. 2006, 24, 1140–1150. [Google Scholar] [CrossRef] [Scilit]
  25. Ramachandran, K.M.; Tsokos, C.P. Analysis of Variance. In Mathematical Statistics with Applications in R; Elsevier: Amsterdam, The Netherlands, 2021; pp. 369–414. [Google Scholar]
  26. Oliva, B.; O’Neill, A.; Wilson, J.M.; O’Hanlon, P.J.; Chopra, I. Antimicrobial Properties and Mode of Action of the Pyrrothine Holomycin. Antimicrob. Agents Chemother. 2001, 45, 532–539. [Google Scholar] [CrossRef] [Scilit]
  27. Downes, S.G.; Doyle, S.; Jones, G.W.; Owens, R.A. Gliotoxin and Related Metabolites as Zinc Chelators: Implications and Exploitation to Overcome Antimicrobial Resistance. Essays Biochem. 2023, 67, 769–780. [Google Scholar] [CrossRef] [Scilit]
  28. Chan, A.N.; Shiver, A.L.; Wever, W.J.; Razvi, S.Z.A.; Traxler, M.F.; Li, B. Role for Dithiolopyrrolones in Disrupting Bacterial Metal Homeostasis. Proc. Natl. Acad. Sci. USA 2017, 114, 2717–2722. [Google Scholar] [CrossRef] [Scilit]
  29. Orelle, C.; Carlson, S.; Kaushal, B.; Almutairi, M.M.; Liu, H.; Ochabowicz, A.; Quan, S.; Pham, V.C.; Squires, C.L.; Murphy, B.T.; et al. Tools for Characterizing Bacterial Protein Synthesis Inhibitors. Antimicrob. Agents Chemother. 2013, 57, 5994–6004. [Google Scholar] [CrossRef] [Scilit]
  30. Sonenshein, A.L.; Alexander, H.B. Initiation of Transcription in Vitro Is Inhibited by Lipiarmycin. J. Mol. Biol. 1979, 127, 55–72. [Google Scholar] [CrossRef] [Scilit]
  31. Artsimovitch, I.; Seddon, J.; Sears, P. Fidaxomicin Is an Inhibitor of the Initiation of Bacterial RNA Synthesis. Clin. Infect. Dis. 2012, 55, S127–S131. [Google Scholar] [CrossRef] [Scilit] [PubMed]
  32. Cao, X.; Boyaci, H.; Chen, J.; Bao, Y.; Landick, R.; Campbell, E.A. Basis of Narrow-Spectrum Activity of Fidaxomicin on Clostridioides Difficile. Nature 2022, 604, 541–545. [Google Scholar] [CrossRef] [Scilit] [PubMed]
  33. Vékey, K.; Edwards, D.M.F.; Zerilli, L.F. Liquid Chromatographic—Mass Spectrometric Studies on Rifamycin Antibiotics. J. Chromatogr. A 1989, 474, 317–327. [Google Scholar] [CrossRef] [Scilit]
  34. Kim, T.K.; Hewavitharana, A.K.; Shaw, P.N.; Fuerst, J.A. Discovery of a New Source of Rifamycin Antibiotics in Marine Sponge Actinobacteria by Phylogenetic Prediction. Appl. Env. Microbiol. 2006, 72, 2118–2125. [Google Scholar] [CrossRef] [Scilit]
  35. Ganapathy, U.S.; Lan, T.; Krastel, P.; Lindman, M.; Zimmerman, M.D.; Ho, H.; Sarathy, J.P.; Evans, J.C.; Dartois, V.; Aldrich, C.C.; et al. Blocking Bacterial Naphthohydroquinone Oxidation and ADP-Ribosylation Improves Activity of Rifamycins against Mycobacterium abscessus. Antimicrob. Agents Chemother. 2021, 65, e00978-21. [Google Scholar] [CrossRef] [Scilit]
  36. Floss, H.G.; Yu, T.-W. RifamycinMode of Action, Resistance, and Biosynthesis. Chem. Rev. 2005, 105, 621–632. [Google Scholar] [CrossRef] [Scilit]
  37. Traxler, P.; Schupp, T.; Fuhrer, H.; Richter, W.J. 3-Hydroxyrifamycin S and Further Novel Ansamycins from a Recombinant Strain R-21 of Nocardia mediterranei. J. Antibiot. 1981, 34, 971–979. [Google Scholar] [CrossRef] [Scilit] [PubMed]
  38. Marreddy, R.K.R.; Nguyen, N.; Dureja, C.; McKelvey, A.M.; Powell, R.; Olaitan, A.O.; Stephan, C.; Hurdle, J.G. Development of a High-Throughput Screening Platform for C. Difficile Toxin Synthesis Inhibitors Unveils Meclizine as an Antivirulence Agent. Antimicrob. Agents Chemother. 2026, 70, e0096025. [Google Scholar] [CrossRef] [Scilit] [PubMed]
  39. Bento, C.M.; Gomes, M.S.; Silva, T. The Use of Double-Reporter Mycobacterium abscessus Strains to Improve Anti-Biofilm Drug Screening. J. Microbiol. Methods 2025, 238, 107290. [Google Scholar] [CrossRef] [Scilit]
  40. Mulvey, M.C.; Sacksteder, K.A.; Einck, L.; Nacy, C.A. Generation of a Novel Nucleic Acid-Based Reporter System to Detect Phenotypic Susceptibility to Antibiotics in Mycobacterium tuberculosis. mBio 2012, 3, e00312-11. [Google Scholar] [CrossRef] [Scilit]
  41. Vlaming, H.C.; Pol, V.; Van Doodewaerd, B.R.; Moutsiopoulou, A.; Geurink, P.P.; Kim, R.Q.; Van Der Heden Van Noort, G.J. Development and Validation of a High-Throughput Screening Assay for the Legionella ADP-Ribosyl Transferase SdeA. ChemBioChem 2025, 26, e202500513. [Google Scholar] [CrossRef] [Scilit] [PubMed]
  42. Moreira, W.; Ngan, G.J.Y.; Low, J.L.; Poulsen, A.; Chia, B.C.S.; Ang, M.J.Y.; Yap, A.; Fulwood, J.; Lakshmanan, U.; Lim, J.; et al. Target Mechanism-Based Whole-Cell Screening Identifies Bortezomib as an Inhibitor of Caseinolytic Protease in Mycobacteria. mBio 2015, 6, e00253-15. [Google Scholar] [CrossRef] [Scilit]
  43. Urban, A.; Eckermann, S.; Fast, B.; Metzger, S.; Gehling, M.; Ziegelbauer, K.; Rübsamen-Waigmann, H.; Freiberg, C. Novel Whole-Cell Antibiotic Biosensors for Compound Discovery. Appl. Env. Microbiol. 2007, 73, 6436–6443. [Google Scholar] [CrossRef] [Scilit] [PubMed]
  44. Igarashi, K.; Kashiwagi, K. Modulation of Cellular Function by Polyamines. Int. J. Biochem. Cell Biol. 2010, 42, 39–51. [Google Scholar] [CrossRef] [Scilit] [PubMed]
  45. Thongbhubate, K.; Nakafuji, Y.; Matsuoka, R.; Kakegawa, S.; Suzuki, H. Effect of Spermidine on Biofilm Formation in Escherichia coli K-12. J. Bacteriol. 2021, 203, e00652-20. [Google Scholar] [CrossRef] [Scilit]
  46. Lin, Q.; Wang, H.; Huang, J.; Liu, Z.; Chen, Q.; Yu, G.; Xu, Z.; Cheng, P.; Liang, Z.; Zhang, L.-H. Spermidine Is an Intercellular Signal Modulating T3SS Expression in Pseudomonas aeruginosa. Microbiol. Spectr. 2022, 10, e0064422. [Google Scholar] [CrossRef] [Scilit]
  47. Miyamoto, S.; Kashiwagi, K.; Ito, K.; Watanabe, S.; Igarashi, K. Estimation of Polyamine Distribution and Polyamine Stimulation of Protein Synthesis in Escherichia coli. Arch. Biochem. Biophys. 1993, 300, 63–68. [Google Scholar] [CrossRef] [Scilit]
  48. Igarashi, K.; Kashiwagi, K. Modulation of Protein Synthesis by Polyamines. IUBMB Life 2015, 67, 160–169. [Google Scholar] [CrossRef] [Scilit]
  49. Yoshida, T.; Sakamoto, A.; Terui, Y.; Takao, K.; Sugita, Y.; Yamamoto, K.; Ishihama, A.; Igarashi, K.; Kashiwagi, K. Effect of Spermidine Analogues on Cell Growth of Escherichia coli Polyamine Requiring Mutant MA261. PLoS ONE 2016, 11, e0159494. [Google Scholar] [CrossRef] [Scilit]
  50. Song, Z.; Parker, K.J.; Enoh, I.; Zhao, H.; Olubajo, O. Elucidation of Spermidine Interaction with Nucleotide ATP by Multiple NMR Techniques. Magn. Reson. Chem. 2010, 48, 123–128. [Google Scholar] [CrossRef] [Scilit]
  51. Nakai, C.; Glinsmann, W. Interactions between Polyamines and Nucleotides. Biochemistry 1977, 16, 5636–5641. [Google Scholar] [CrossRef] [Scilit]
  52. Chernyshova, A.P.; Marina, V.I.; Tereshchenkov, A.G.; Sagitova, V.E.; Kryakvin, M.A.; Dagaev, N.D.; Yurchenko, E.G.; Arzamazova, K.A.; Guglya, E.B.; Belozerova, O.A.; et al. Characterization of Bacillus velezensis EV17 and K-3618 and Their Polyketide Antibiotic Oxydifficidin, an Inhibitor of Prokaryotic Translation with Low Cytotoxicity. Int. J. Mol. Sci. 2025, 26, 11777. [Google Scholar] [CrossRef] [Scilit] [PubMed]
  53. Shiriaev, D.I.; Sofronova, A.A.; Berdnikovich, E.A.; Lukianov, D.A.; Komarova, E.S.; Marina, V.I.; Zakalyukina, Y.V.; Biryukov, M.V.; Maviza, T.P.; Ivanenkov, Y.A.; et al. Nybomycin Inhibits Both Fluoroquinolone-Sensitive and Fluoroquinolone-Resistant Escherichia coli DNA Gyrase. Antimicrob. Agents Chemother. 2021, 65, e00777-20. [Google Scholar] [CrossRef] [Scilit] [PubMed]
  54. Langmead, B.; Salzberg, S.L. Fast Gapped-Read Alignment with Bowtie 2. Nat. Methods 2012, 9, 357–359. [Google Scholar] [CrossRef] [Scilit]
  55. Li, H.; Handsaker, B.; Wysoker, A.; Fennell, T.; Ruan, J.; Homer, N.; Marth, G.; Abecasis, G.; Durbin, R. 1000 Genome Project Data Processing Subgroup The Sequence Alignment/Map Format and SAMtools. Bioinformatics 2009, 25, 2078–2079. [Google Scholar] [CrossRef] [Scilit] [PubMed]
  56. Liao, Y.; Smyth, G.K.; Shi, W. featureCounts: An Efficient General Purpose Program for Assigning Sequence Reads to Genomic Features. Bioinformatics 2014, 30, 923–930. [Google Scholar] [CrossRef] [Scilit]
  57. Anders, S.; Huber, W. Differential Expression Analysis for Sequence Count Data. Genome Biol. 2010, 11, R106. [Google Scholar] [CrossRef] [Scilit] [PubMed]
  58. Zakalyukina, Y.V.; Pavlov, N.A.; Lukianov, D.A.; Marina, V.I.; Belozerova, O.A.; Tashlitsky, V.N.; Guglya, E.B.; Osterman, I.A.; Biryukov, M.V. A New Albomycin-Producing Strain of Streptomyces globisporus Subsp. globisporus May Provide Protection for Ants Messor Structor. Insects 2022, 13, 1042. [Google Scholar] [CrossRef] [Scilit]
Figure 1. The expression values of sulA gene and potential marker genes measured by RT-qPCR after treatment of E. coli K12 strain with different antibiotics at 2x MICs (* p < 0.05; ** p < 0.01; *** p < 0.001; ns: not significant, by one-way robust ANOVA and mcppb20 post hoc test). (A) Expression values for sulA gene. (B) Expression values for yiaG gene. (C) Expression values for msyB gene. (D) Expression values for ydiZ gene. (E) Expression values for speE gene.
Ijms 27 04829 g001
Figure 2. The structures of rifampicin and fidaxomicin and their schematic impact of their affect on different stages of bacterial transcription. Rifampicin acts as an inhibitor of transcription elongation via binding to the β-subunit deep within the DNA/RNA channel of bacterial RNA polymerase; at the same time, fidaxomicn is mostly an initiation step inhibitor.
Ijms 27 04829 g002
Figure 3. The expression values of sulA and speE genes measured by RT-qPCR after treatment of E. coli lptDmut strain with different antibiotics at 2x MICs (* p < 0.05; *** p < 0.001; ns: not significant, by one-way robust ANOVA and mcppb20 post hoc test). (A) Expression values for sulA gene. (B) Expression values for speE gene.
Ijms 27 04829 g003
Figure 4. Screening of 5 column chromatography fractions from antimicrobial-producing strains (I, II, III, IV, V) using RT-qPCR method with speE gene as a marker (* p < 0.05; *** p < 0.001; ns: not significant, by one-way robust ANOVA and mcppb20 post hoc test).
Ijms 27 04829 g004
Figure 5. Chemical structures of 3,31-dihydroxyrifamycin S and rifamorpholine E. The fragment at m/z 273, characteristic of the naphthofuran moiety common to rifamycins, is highlighted.
Ijms 27 04829 g005
Table 1. Number of differentially expressed E. coli genes after treatment with 3 different antibiotics.
AntibioticNo. of Upregulated GenesNo. of Downregulated GenesNo. of Differentially Expressed Genes (% of Genome)
Rifampicin125013042554 (57.2)
Tetracycline125914062665 (59.7)
Novobiocin115311242277 (51.0)
Table 2. The chosen E. coli genes as potential markers for transcription inhibition with their log2FoldChange values and significance levels for different antibiotic treatments.
Gene IDNameTreatment
RifampicinTetracyclineNovobiocin
log2FoldChangepadjlog2FoldChangepadjlog2FoldChangepadj
b3555putative DNA-binding transcriptional regulator YiaG4.3921.895 × 10−48−1.5277.261 × 10−80.1416.65 × 10−1
b1051acidic protein MsyB3.9719.075 × 10−47−1.1055.213 × 10−60.0698.42 × 10−1
b1724putative endoribonuclease YdiZ3.4354.192 × 10−33−0.0767.934 × 10−10.8354.74 × 10−3
b4014malate synthase A3.2514.931 × 10−29−0.6901.302 × 10−70.0468.77 × 10−1
b4015isocitrate lyase3.0076.987 × 10−25−2.2701.669 × 10−480.1086.80 × 10−1
b2687S-ribosylhomocysteine lyase2.6554.456 × 10−28−1.2231.458 × 10−160.0916.98 × 10−1
b0121spermidine synthase2.5662.859 × 10−18−0.2123.317 × 10−1−1.1741.25 × 10−7
b4269NADPH-dependent aldehyde reductase Ahr2.3791.778 × 10−16−0.7522.014 × 10−3−0.9882.76 × 10−4
Table 3. Primer sequences used for qPCR.
Primer NameGeneSequence (5′-3′)
YiaG_FPutative DNA-binding transcriptional regulator YiaGAAAgATCCAATgCATgAgCTgTTgAgC
YiaG_RTTAgTTCggCACTTgAAggCTTCAC
MsyB_FAcidic protein MsyBCgCAACgCTTgAAgAAgCCAT
MsyB_RACCgCTAAgCATAggTAAACATTCACC
YdiZ_FPutative endoribonuclease YdiZTACCTgACTCgCgACggTTTTTT
Ydiz_RCCCAggTCgTgATggTgATTTC
AceB_FMalate synthase AgACgggCAAATTAACCTgCgT
AceB_RgCCTgATAgTTgTggAAgAAATAgAgCg
AceA_FIsocitrate lyaseCTATCCggCAAACTCggTgC
AceA_RCTTCACTgACgCCAgCTgATCT
LuxS_FS-ribosylhomocysteine lyaseTTCgggTggCgAAAACAATgAAC
LuxS_RgCgTACCAATCAgACTCATATAAAAACCgg
Ahr_FNADPH-dependent aldehyde reductase AhrAggATAAAggTTTgCAggTCggT
Ahr_RCAgTgATATggTgCATCAACAgTgg
SpeE_FSpermidine synthasegATgATgACCCATgTTCCgCTACT
SpeE_RgCCATCgTCgATCACCAgCTTAAA
PpsA_FPhosphoenolpyruvate synthetaseCgCCAgATgATgCgAggT
Ppsa_RCAgAAgATATgCCggACgCTT
SulA_FCell division inhibitor SulATTCTACTgTTgCCATTgTTAC
SulA_RCCgATCACCACACTgTA
RT_23S_F23S ribosomal RNAgCgAAATTCCTTgTCgggTAA
RT_23S_RACTTCAAAgCCTCCCACCTATCC
Disclaimer/Publisher’s Note: The statements, opinions and data contained in all publications are solely those of the individual author(s) and contributor(s) and not of MDPI and/or the editor(s). MDPI and/or the editor(s) disclaim responsibility for any injury to people or property resulting from any ideas, methods, instructions or products referred to in the content.