1. Introduction
The epidermis constitutes the outermost protective barrier of the human body, and its integrity depends critically on tightly regulated lipid homeostasis. The lipidome of keratinocytes, the dominant cell type of the basal layer, is composed primarily of phospholipids, cholesterol (CHOL), and triacylglycerols (TAG). During terminal differentiation into corneocytes, enzymatic cleavage of precursor lipids generates ceramides, free fatty acids (FFAs), and CHOL, which together form the extracellular lipid matrix of the stratum corneum, essential for barrier integrity [
1]. Disruption of this balance carries well-documented pathological consequences, including permeability barrier dysfunction and ichthyosiform phenotypes [
2]. Intracellular neutral lipids are stored in lipid droplets (LDs), dynamic organelles that participate in lipid trafficking, membrane remodelling, and cellular signalling. LD biogenesis is closely linked to neutral lipid synthesis, in which diacylglycerol acyltransferases (DGAT1 and DGAT2) play a key role by catalysing the final step of TAG synthesis [
3,
4].
In keratinocytes, LDs serve as a regulated reservoir of lipid precursors for barrier synthesis, and their dynamics are tightly controlled during epidermal differentiation [
4]. A central regulator of this process is Perilipin 2 (PLIN2), a structural protein of the LD surface and a universally recognised marker of intracellular lipid accumulation [
5]. By coating the LD phospholipid monolayer, PLIN2 physically impedes cytosolic lipases, stabilising stored TAG and reducing lipolytic flux [
6]. Its expression is upregulated in keratinocytes by diverse irritants via calcium-modulated lipid redistribution [
7]. AMPK-mediated phosphorylation of PLIN2, targets it for chaperone-mediated autophagic degradation in hepatocytes, adipocytes, or muscle cells [
8,
9]. However, PLIN2 reduction may also reflect a direct structural loss of LD stabilization and coat integrity [
10]. Whether this regulatory axis operates analogously in keratinocytes, and whether it can be pharmacologically engaged in an epidermal context, remains poorly defined.
Intracellular lipid overload can induce lipotoxicity characterised by oxidative and endoplasmic reticulum (ER) stress, impaired mitochondrial function, and activation of pro-inflammatory signalling [
9]. In keratinocytes, lipid accumulation couples with NLRP3 inflammasome activation, driving release of IL-1β and IL-18 [
11], establishing excess neutral lipid accumulation as an active driver of epidermal stress and inflammation rather than a mere metabolic marker [
12]. The clinical relevance of these mechanisms is further underscored by the association between obesity, dyslipidemia, and impaired epidermal barrier competence [
13,
14], conditions in which elevated circulating palmitic acid (PA) and leptin synergistically enhance keratinocyte inflammatory responses [
15].
Beta vulgaris (red beetroot) is a rich source of betalains, polyphenols, flavonoids, ascorbic acid, and inorganic nitrate, with well-documented antioxidant, hypolipidaemic, and anti-inflammatory activities [
16,
17]. While in vitro-produced biomass of
B. vulgaris has previously been established as a sustainable and standardized source of material, its use has thus far been restricted to root-derived fractions [
10].
The present study proposes
B. vulgaris leaves as a more abundant and equally sustainable alternative, capable of yielding a high-quality and compositionally stable extract, with potential applications in plant-based cosmeceutical formulations aimed at restoring epidermal lipid homeostasis. Among its bioactive constituents, betaine (N,N,N-trimethylglycine) activates hepatic AMPK, inhibiting ACC and suppressing SREBP-1c and fatty acid synthase expression, thereby reducing intracellular lipid accumulation [
18]. Moreover, we also investigated the effect of an aqueous leaf extract of
Beta vulgaris subsp.
vulgaris Beetroot Group on antioxidant defence, intracellular LD accumulation and PLIN2 expression in HaCaT keratinocytes, hypothesising antioxidant and anti-lipogenic effects.
2. Results
2.1. Chemical Characterization of the Beta vulgaris Extract
2.1.1. Betanin and Antioxidant Activity Quantification
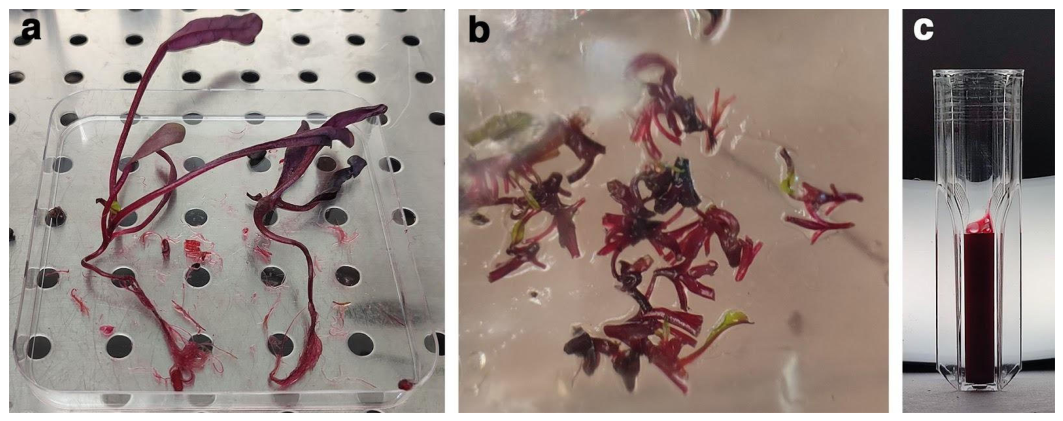
B. vulgaris plants (
Figure 1a) were cultivated in a SETIS
® bioreactor to ensure reproducible biomass production, independent of open-field cultivation or variability in commercially available plant material. After 30 days, leaves were harvested and subdivided into meristematic apices and leaf laminas. The apices were used to initiate a new growth cycle (
Figure 1b), whereas the leaves were weighed (fresh weight, FW), lyophilized, weighed again (dry weight, DW) and stored at −80 °C. The plants grown in the bioreactor were characterized by a very uniform pigmentation, which was also evident at the root level. No signs of hyperhydricity were observed. The extract obtained from the leaves appeared as an intense purple-red solution (
Figure 1c), visually comparable to beetroot juice.
The
Beta vulgaris Extract (BvE) was analyzed for betanin, soluble phenols, flavonoids, nitrate content, and antioxidant activity, and the results are reported in
Table 1.
The extract exhibited a betanin concentration of 0.24 ± 0.03 mg mL
−1, corresponding to 0.52 ± 0.09 mg g
−1 FW, which is lower than that in beetroot juice [
19,
20,
21,
22]. BvE soluble phenolics content had a value of 0.69 ± 0.12 mg Gallic Acid Equivalent (GAE) mL
−1, equivalent to 1.38 ± 0.24 mg GAE g
−1 FW. This value is comparable with the values obtained in beetroot juice [
20,
22,
23,
24]. Regarding the flavonoid concentration, the value obtained in BvE is 0.16 ± 0.04 mg Catechin Equivalent (CE) mL
−1, equivalent to 0.33 ± 0.08 mg CE g
−1 FW, which aligns with the range of values reported for beetroot juice [
24]. The nitrate content of the BvE is 0.22 ± 0.08 mg mL
−1, equivalent to 0.43 ± 0.16 mg g
−1 FW; this is higher with respect to the range reported in previous studies [
24,
25] but is considered low and safe from a health perspective [
26,
27]. The antioxidant capacity was measured at 4.75 ± 1.14 µmol Trolox Equivalents (TE) mL
−1, which corresponds to 10.08 ± 2.50 µmol TE g
−1 FW. The observed antioxidant activity remains within the typical range reported for beetroot juice [
19,
20,
21,
22].
2.1.2. 1H NMR Spectroscopy Composition
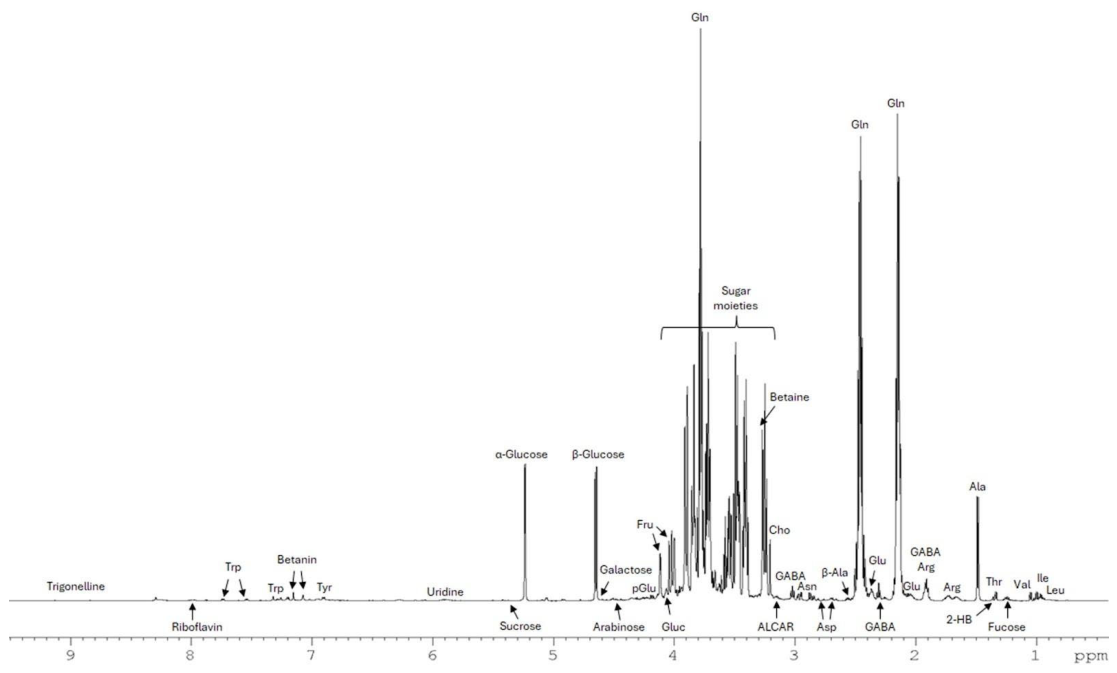
The metabolites identified in the BvE by
1H NMR spectroscopy provide a comprehensive characterization of its chemical composition (
Figure 2;
Table S1). A detailed analysis of the metabolite profile of BvE was performed using 1D and 2D NMR spectra. A representative 1D
1H NMR spectrum (600 MHz) of BvE is reported in
Figure 2. The high-field region from 0.8 to 3.2 ppm includes signals mainly consisting of amino acids, while the mid- to low-field region from 3.2 to 5.5 ppm shows peaks mainly from carbohydrates. The low-field region beyond 6.0 ppm mainly contains aromatic resonances (
Figure 2;
Table S1). Quantification of identified metabolites in BvE was performed using the ratio method, as signal intensity is proportional to the molar concentration of metabolites in the
1H NMR spectrum [
28,
29]. Out of the 38 identified metabolites, 31 were easily quantified, since they showed no signal overlap. Metabolite measurements were calculated as mg/mL of extract based on the integration of their corresponding peaks in the
1H NMR spectra, using TSP as an internal standard (
Table S1).
Amino acids detected in BvE include leucine, isoleucine, valine, threonine, alanine, arginine, glutamine, glutamate, GABA, aspartate, asparagine, and serine in the low–mid-field region, and tyrosine, phenylalanine, and tryptophan in the higher-field region. The presence of choline was suggested by its characteristic methyl peak at 3.22 ppm. The NMR analysis also suggested the presence of organic acids, including propionate, fumarate, and formate. Carbohydrates were the most abundant BvE components, with α- and β-glucose and fructose present at the highest concentrations, indicating that sugars represent a major fraction of the extract, together with betaine (
Figure 2). Consistent with the known composition of beet-derived extracts, betanin was among the most abundant secondary metabolites, as indicated by the characteristic broad singlets in the
1H NMR spectrum at 7.15 and 7.07 ppm and the corresponding
13C signals at 102.5 and 116.8 ppm, respectively [
30] (
Table S1). In addition, trigonelline, a product from vitamin B3 metabolism, and riboflavin signals are visible in the
1H NMR spectrum (
Figure 2;
Table S1). The presence of all the metabolites suggested by the 1D
1H NMR spectra were further confirmed by 2D experiments: COSY, HSQC, HMBC, and J-resolved (
Figures S1–S4).
2.2. Effects of BvE on Cell Viability
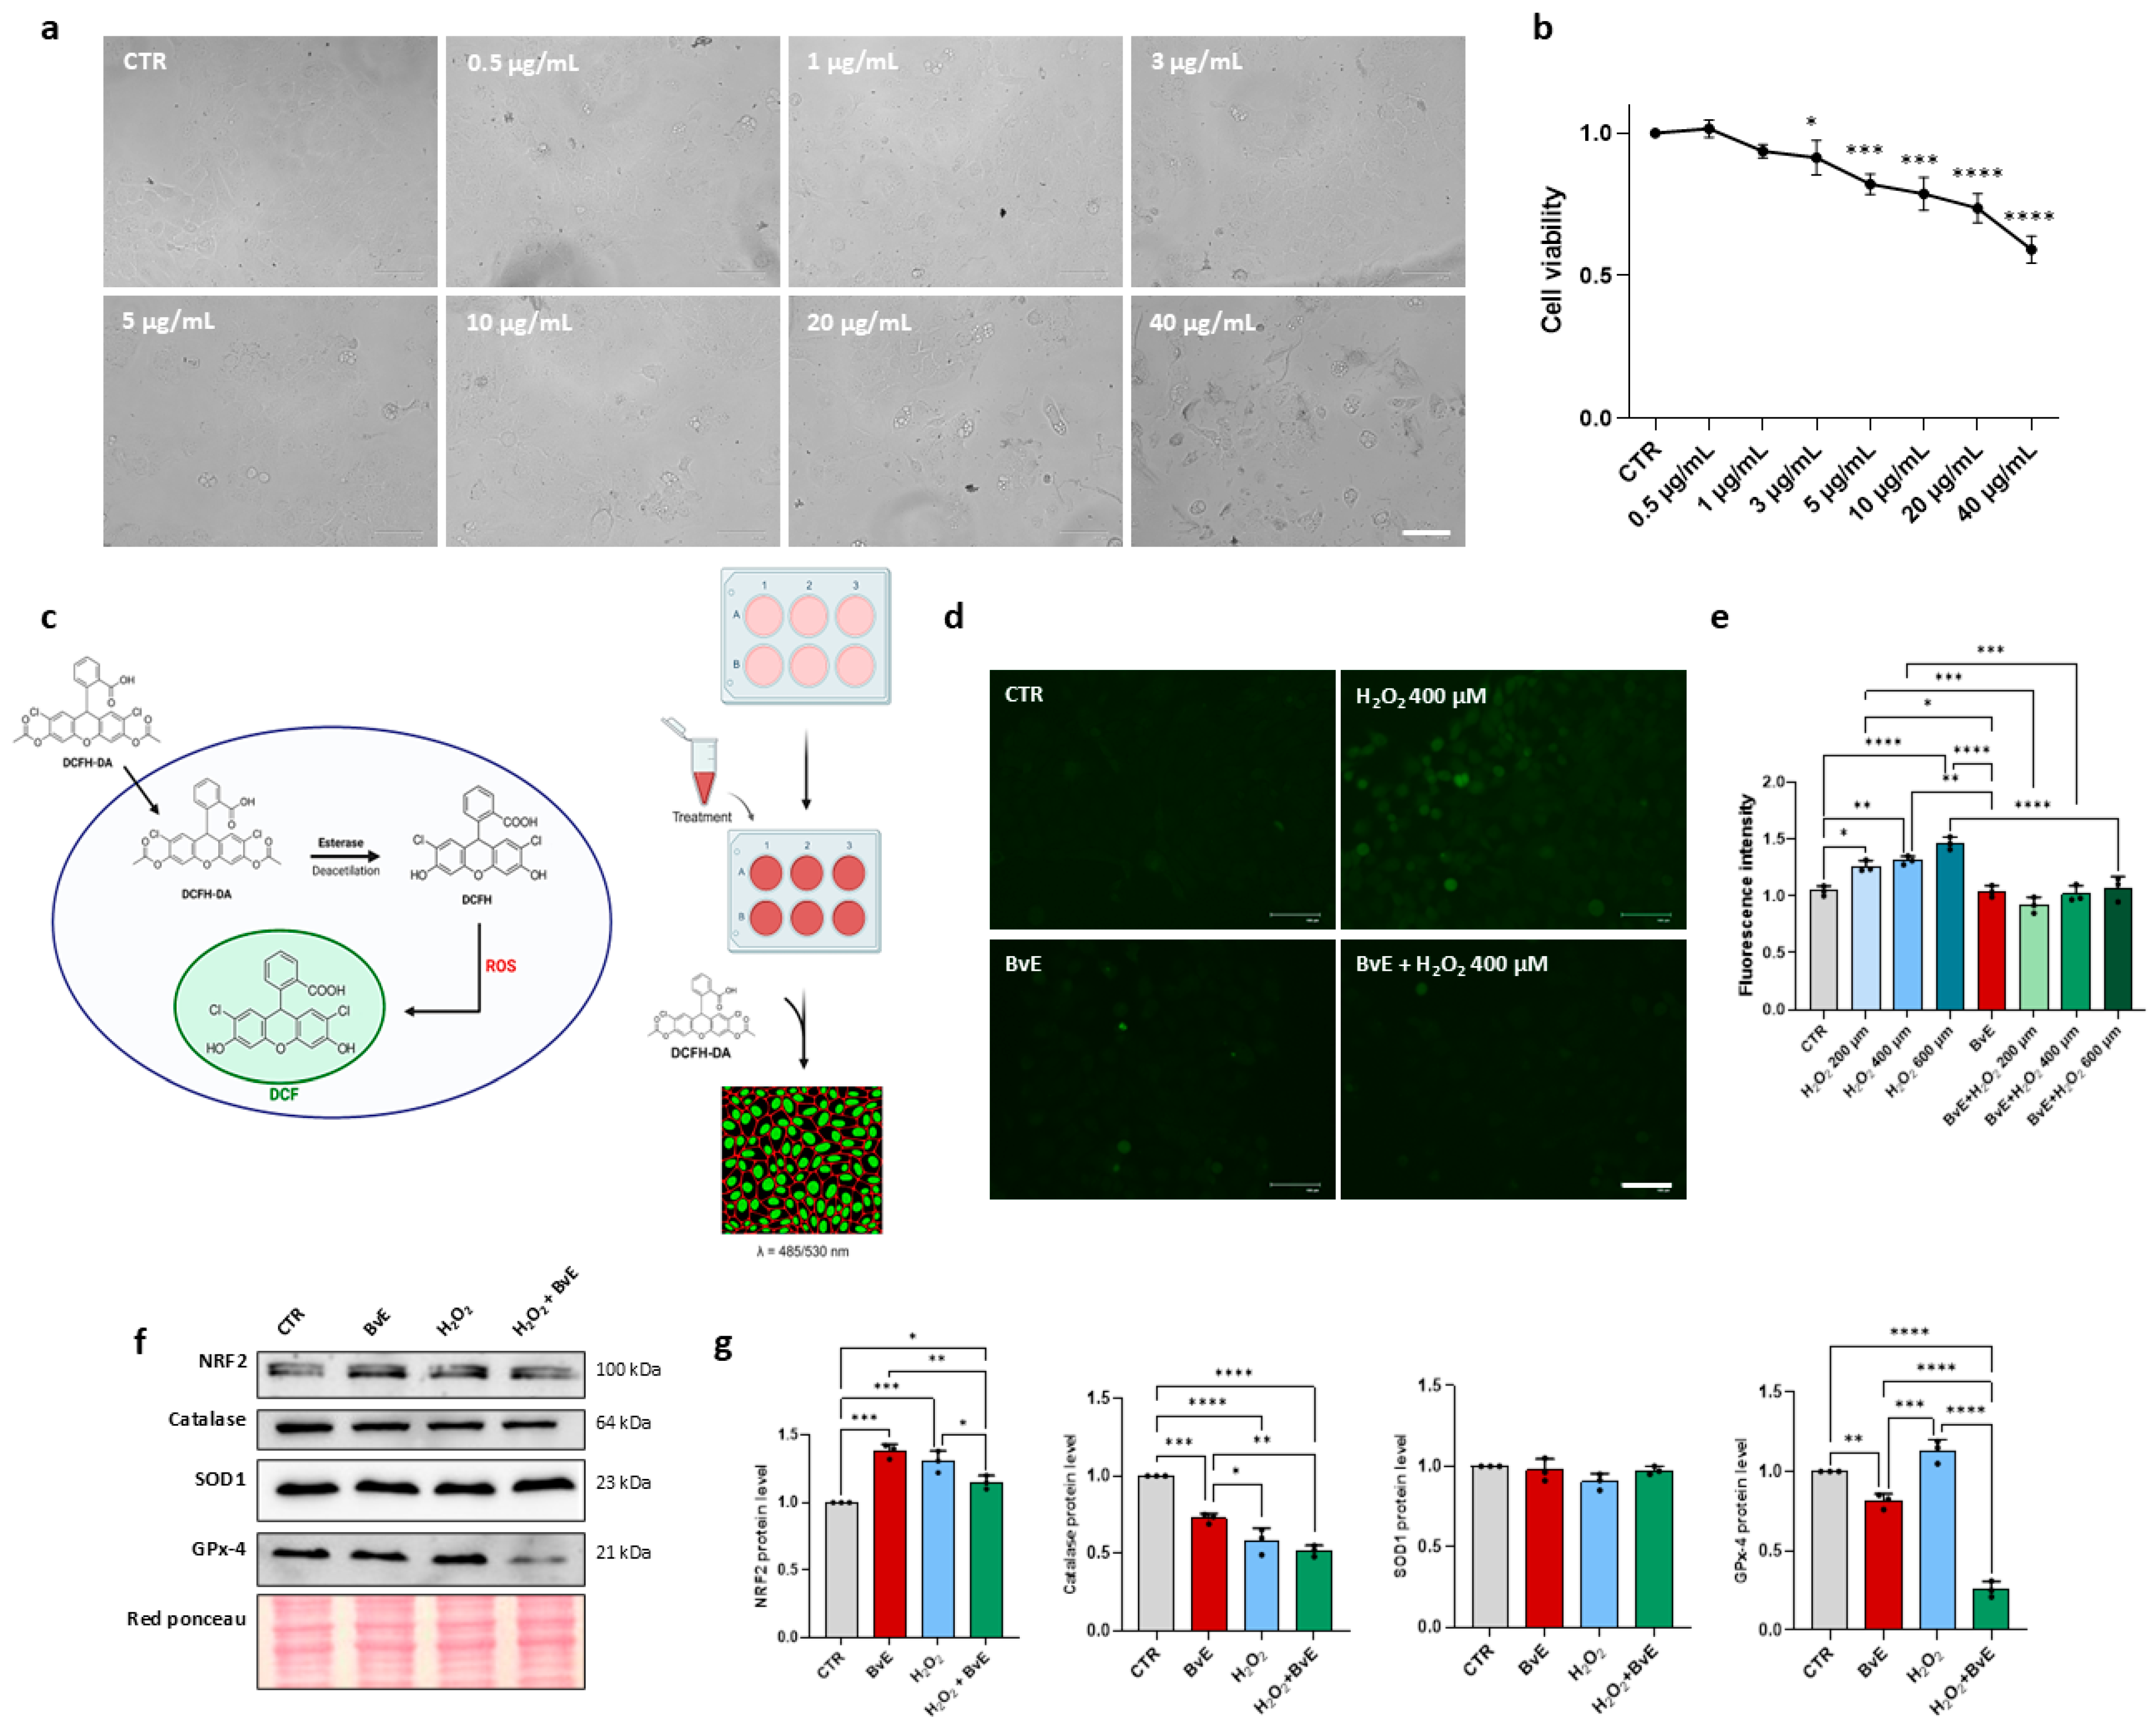
To establish a safe and biologically relevant concentration range for subsequent assays, we first evaluated the cytotoxic profile of BvE on human epidermal keratinocytes (HaCaT cells). Cells were exposed to increasing concentrations of BvE (0.5–40 µg/mL) for 24 h. Phase-contrast microscopy revealed progressive morphological alterations at higher concentrations, including cell rounding and detachment, indicative of cytotoxic stress (
Figure 3a). In line with these observations, cell viability assessment showed a dose-dependent reduction, with statistically significant decreases emerging from 3 µg/mL and reaching approximately 60% viability at the highest tested concentration of 40 µg/mL (
Figure 3b). To determine whether this cytotoxic profile was conserved across different epithelial contexts, the same experimental conditions were applied to HCT15 cells, a human colorectal epithelial cell line. HCT15 cells exhibited an analogous dose-dependent reduction in viability, with a cytotoxic profile comparable to that observed in HaCaT cells (
Figure S5a,b). Based on these findings, a concentration of 1 µg/mL BvE, which preserved full cell viability in both cell models, was selected for all subsequent experiments.
2.3. BvE Reduces Oxidative Stress in Keratinocytes
Given the significant antioxidant capacity of BvE, we next investigated whether this property translated into biologically relevant cytoprotective effects at the cellular level. HaCaT keratinocytes were challenged with increasing concentrations of hydrogen peroxide (H
2O
2; 200, 400, and 600 µM), a well-established inducer of intracellular oxidative stress widely used in in vitro stress models, in the presence or absence of BvE (1 µg/mL) for 24 h. Phase-contrast microscopy revealed that H
2O
2 alone induced progressive, dose-dependent morphological alterations, including cell rounding and detachment, which were markedly attenuated by BvE co-treatment at 200 and 400 µM H
2O
2 (
Figure S6a,b). Cell viability analysis corroborated these observations, showing that H
2O
2 significantly reduced viability, compared with the control (CTR) at all tested concentrations (200 µM, **
p < 0.01; 400 µM, **
p < 0.01; 600 µM, ****
p < 0.001), and that co-treatment with BvE significantly restored viability relative to the respective H
2O
2 condition (
Figure S6a,b).
To identify intracellular oxidative burden, we employed the cell-permeable fluorescent probe DCFH-DA. Upon passive diffusion into the cell, DCFH-DA is deacetylated by cytoplasmic esterases to yield the non-fluorescent intermediate DCFH, which is subsequently oxidized by intracellular ROS to the highly fluorescent compound DCF (2′,7′-dichlorofluorescein), providing a real-time readout of the intracellular redox environment (
Figure 3c). Fluorescence microscopy revealed a marked increase in DCF signal in H
2O
2-treated cells relative to untreated controls, whereas co-treatment with BvE consistently reduced fluorescence to levels comparable to CTR (
Figure 3d). Quantitative analysis confirmed a significant, dose-dependent elevation in intracellular ROS across all H
2O
2 concentrations tested. Notably, BvE co-treatment significantly attenuated H
2O
2-induced oxidative stress at all concentrations (*
p < 0.05 to ****
p < 0.001), restoring DCF fluorescence intensity to near-basal levels (
Figure 3e).
2.4. Molecular Mechanism of the Antioxidant Effect of BvE
To elucidate the molecular mechanisms underlying the antioxidant effects of BvE, HaCaT keratinocytes were exposed to BvE (1 μg/mL), H
2O
2 (400 μM for 24 h), or their combination. The expression levels of key redox-regulatory proteins were subsequently evaluated by Western blot analysis (
Figure 3f,g).
As shown in
Figure 3f,g, exposure to H
2O
2 significantly increased NRF2 protein levels compared to the CTR group (****
p < 0.001), indicating activation of the oxidative stress-responsive antioxidant pathway. Treatment with BvE alone also induced a statistically significant upregulation of NRF2 relative to CTR (*
p < 0.05), suggesting an intrinsic antioxidant or cytoprotective potential of the extract. Notably, co-treatment with H
2O
2 and BvE resulted in NRF2 levels that remained significantly elevated compared to CTR (*
p < 0.05) but were moderately reduced relative to H
2O
2 treatment alone. This pattern may indicate a modulatory effect of BvE on NRF2 activation under oxidative stress conditions, potentially preventing excessive activation.
Catalase protein expression was significantly decreased following treatment with BvE (*** p < 0.005), H2O2 (**** p < 0.001), and their combination (**** p < 0.001 vs. CTR), with no statistically significant differences observed between the H2O2 and H2O2 + BvE groups. In contrast, SOD1 protein levels remained unchanged across all experimental conditions, indicating that this enzyme is not significantly affected by either oxidative stress or BvE treatment in this model.
Regarding GPx-4, BvE alone induced a significant downregulation compared to CTR (** p < 0.01), whereas H2O2 treatment resulted in a marked increase in GPx-4 expression (*** p < 0.005 vs. BvE). Importantly, co-treatment with H2O2 and BvE led to a pronounced reduction in GPx-4 levels compared to all other conditions (**** p < 0.001 vs. H2O2, BvE, and CTR), suggesting a strong regulatory effect of BvE on this enzyme under oxidative stress.
Collectively, these findings indicate that BvE exerts a significant antioxidant effect in HaCaT keratinocytes exposed to H2O2-induced oxidative stress, primarily through modulation of the NRF2 signaling pathway and selective regulation of GPx-4 expression.
2.5. BvE Counteracts Pathological Lipid Accumulation and Attenuates ER Stress in Epithelial Cells
Keratinocytes rely on tightly regulated lipid metabolism for epidermal barrier integrity, and excess saturated fatty acids are known to trigger lipotoxic cascades, including oxidative stress and ER stress via Unfolded Protein Response (UPR) activation, that underline several inflammatory skin conditions [
12]. Given that BvE demonstrated the ability to modulate oxidative damage in keratinocytes, we next investigated whether it could interfere with both intracellular lipid accumulation and the downstream ER stress response.
To induce a lipotoxic state, HaCaT cells were challenged with a combination of PA and oleic acid (OA), two fatty acids widely used to recapitulate pathological intracellular LD accumulation in vitro [
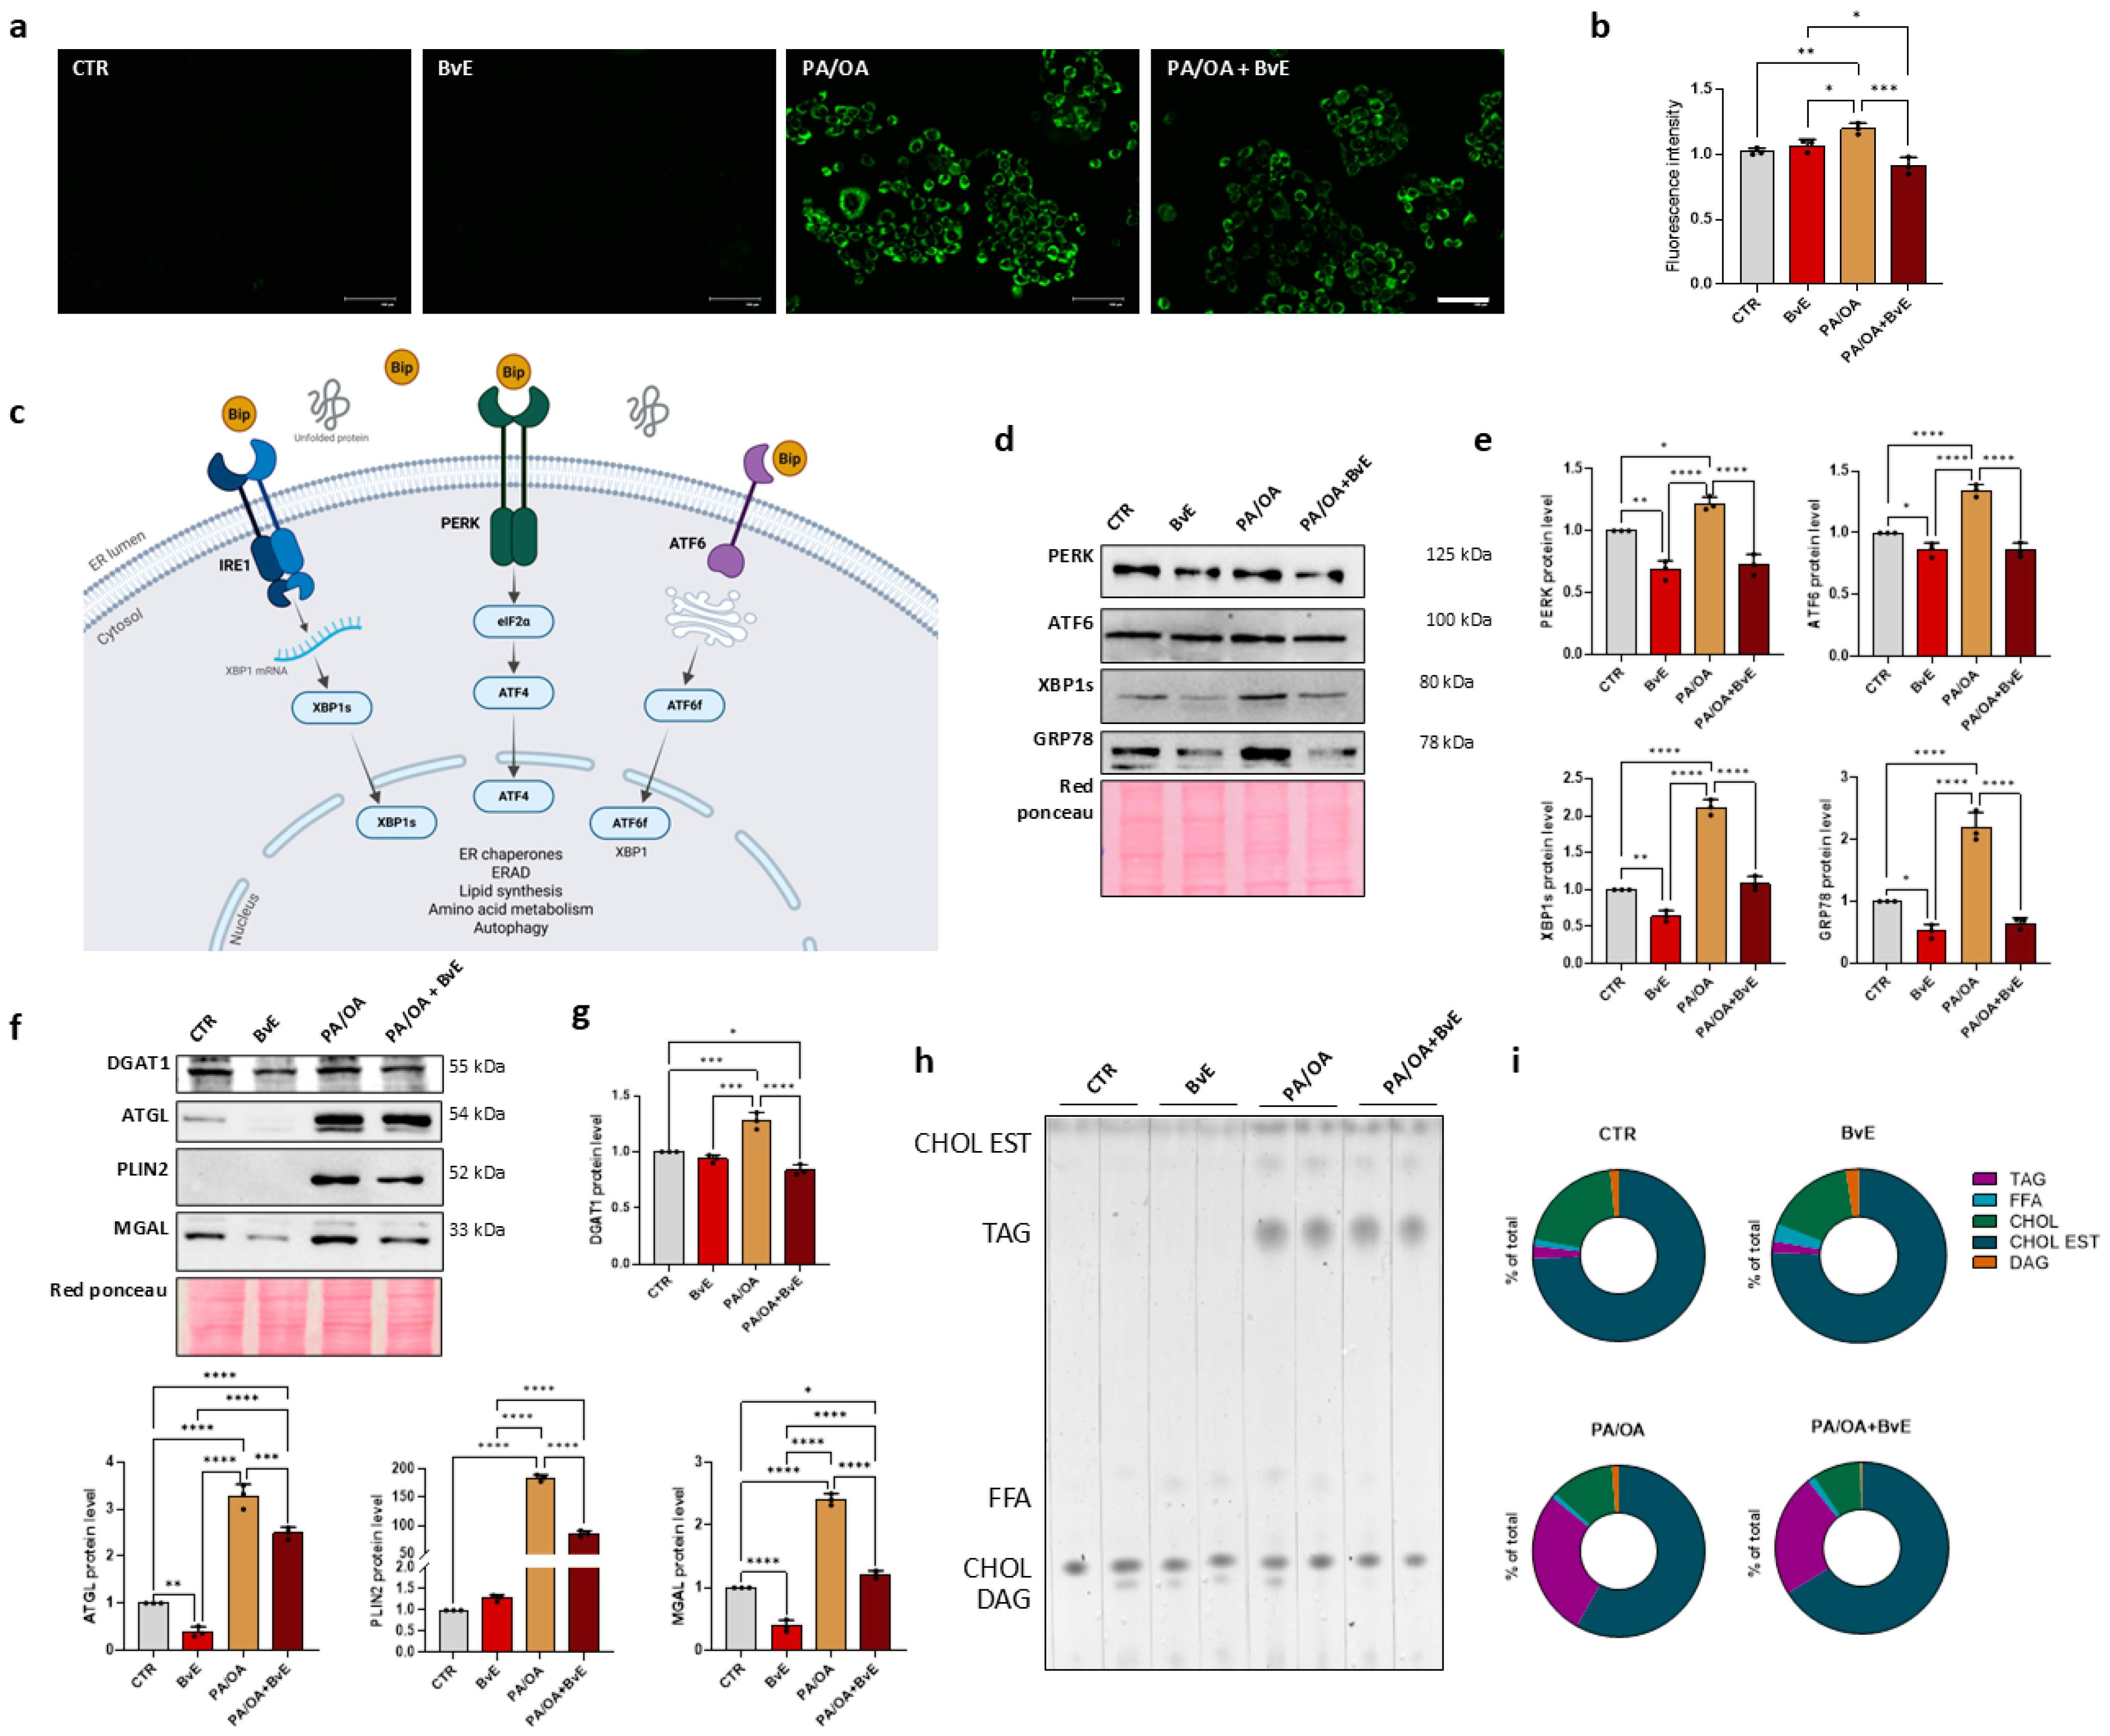
31]. Cells were treated with PA/OA for 48 h in the presence or absence of BvE (1 µg/mL), added during the last 24 h of incubation. Intracellular lipid content was assessed using the BODIPY fluorescent probe by fluorescence microscopy (
Figure 4a,b). PA/OA treatment induced a striking accumulation of intracellular LDs compared to control cells, while cells co-treated with BvE displayed fluorescence levels comparable to untreated controls, suggesting a marked anti-adipogenic effect of the extract. Measurement of fluorescence confirmed that PA/OA significantly increased BODIPY staining compared to both CTR (**
p < 0.01) and BvE-treated cells (*
p < 0.05), while PA/OA + BvE co-treatment significantly reduced lipid accumulation compared to PA/OA alone (***
p < 0.005), restoring fluorescence to levels at or below those of untreated cells (
Figure 4b). It should be noted that BvE likewise reduced PA/OA-induced lipid accumulation in another epithelial cell model, HCT15 intestinal cells (
Figure S7a,b), indicating that this property is not restricted to keratinocytes.
We next examined whether BvE could also regulate the ER stress response elicited by lipid overload. The UPR operates through three main signaling branches, IRE1α/XBP1s, PERK/eIF2α/ATF4, and ATF6, schematically illustrated in
Figure 4c. PA/OA treatment significantly increased the protein levels of PERK, ATF6, XBP1s, and the ER chaperone GRP78 compared to untreated controls, confirming that lipid overload is sufficient to activate all three UPR branches in keratinocytes (
Figure 4d,e). Notably, BvE alone (1 µg/mL) significantly reduced the basal expression of all four UPR markers, while co-incubation with PA/OA effectively reduced lipotoxicity-induced ER stress, restoring PERK (****
p < 0.001), ATF6 (****
p < 0.001), XBP1s (****
p < 0.001), and GRP78 (****
p < 0.001) protein levels compared with PA/OA alone. A consistent pattern of UPR downregulation upon BvE treatment was also observed in HCT15 intestinal epithelial cells (
Figure S5c,d), suggesting that the capacity of BvE to attenuate ER stress represents a broader property of the extract across epithelial tissues.
2.6. Mechanism of BvE-Regulated LD Dynamics in Keratinocytes
To elucidate the mechanisms underlying the anti-adipogenic effect of BvE, the expression of key LD remodelling enzymes was assessed by Western blot (
Figure 4f,g).
LD turnover is tightly regulated by a coordinated series of enzymatic activities. LD formation is primarily driven by enzymes involved in TAG synthesis, including DGAT1 and DGAT2, while LD degradation proceeds through a sequential lipolytic cascade mediated by adipose triglyceride lipase (ATGL/PNPLA2) and monoacylglycerol lipase (MAGL), which complete fatty acid liberation by releasing FFA and glycerol. The structural integrity and growth of LDs are further governed by PLIN2, an LD-coating protein that controls lipase accessibility to the lipid core.
Analysis of LD-associated proteins revealed a comprehensive modulation of lipid metabolism by BvE. DGAT1 was significantly upregulated by PA/OA treatment compared to control (***
p < 0.005), but markedly reduced upon BvE co-treatment relative to both control (*
p < 0.05) and PA/OA alone (****
p < 0.001) (
Figure 4f,g), suggesting that BvE limits LD biogenesis at the level of lipid esterification. PLIN2 was dramatically upregulated by PA/OA (****
p < 0.001) and significantly reduced by BvE co-treatment (****
p < 0.001 vs. PA/OA), indicating a decreased stabilization and coating of newly formed LDs.
BvE also modulated the expression of lipolytic enzymes. ATGL levels were modestly reduced compared with the control (**
p < 0.01) by BvE alone and significantly increased by PA/OA treatment (****
p < 0.001); however, BvE co-treatment markedly attenuated this increase compared with PA/OA alone (***
p < 0.005) (
Figure 4f,g). Similarly, MAGL expression was significantly reduced by BvE alone compared to control (****
p < 0.001), markedly induced by PA/OA (****
p < 0.001), and substantially restored toward basal levels by PA/OA + BvE co-treatment (****
p < 0.001 vs. PA/OA).
2.7. BvE Induces Lipid Class Redistribution in HaCaT Keratinocytes
To characterize the changes in intracellular lipid composition induced by BvE, a thin-layer chromatography (TLC)-based lipid profiling approach was employed. TLC separation of total lipid extracts revealed distinct differences in the lipid class distribution across experimental conditions (
Figure 4h,i). Semiquantitative analysis of the relative lipid class distribution, expressed as a percentage of total lipid content, confirmed these observations (
Figure 4i). In CTR cells, the lipid profile was dominated by CHOL esters (74.48%) and CHOL (20.29%), with minimal TAG (2.34%), FFA (1.21%), and diacylglycerol (DAG, 1.68%) content. BvE-treated cells displayed a largely similar lipid composition (CHOL EST 75.59%, CHOL 16.61%, TAG 2.15%, FFA 3.21%, DAG 2.45%), indicating that BvE alone does not substantially alter the basal lipid profile. In contrast, PA/OA treatment induced a profound remodeling of the intracellular lipid landscape, with TAG becoming the dominant fraction (27.78%), at the expense of CHOL EST (58.11%) and CHOL (11.93%), reflecting the lipotoxic lipid overload. Notably, co-treatment with PA/OA and BvE partially restored the lipid class distribution towards a profile similar to CTR cells, with a relative reduction in TAG content (23.14%) and a partial recovery of CHOL EST (66.20%) compared to PA/OA alone, while CHOL levels remained low (9.11%). As TLC-based lipid analysis resolves lipid classes at a bulk level and does not provide information on the molecular species composition within each class, including fatty acid chain length, degree of unsaturation, or regioisomeric identity, the observed changes in lipid class distribution can be interpreted as broad alterations in neutral lipid homeostasis rather than precise molecular remodelling of the keratinocyte lipidome. Taken together, these findings demonstrate that PA/OA induces a significant TAG-driven remodeling of the intracellular lipid landscape in HaCaT keratinocytes, and that BvE co-treatment partially counteracts this lipotoxic lipid redistribution by reducing TAG accumulation and partially restoring CHOL ester levels.
2.8. BvE Reduces Lipid Accumulation Through the Modulation of the Autophagic–Lysosomal Pathway
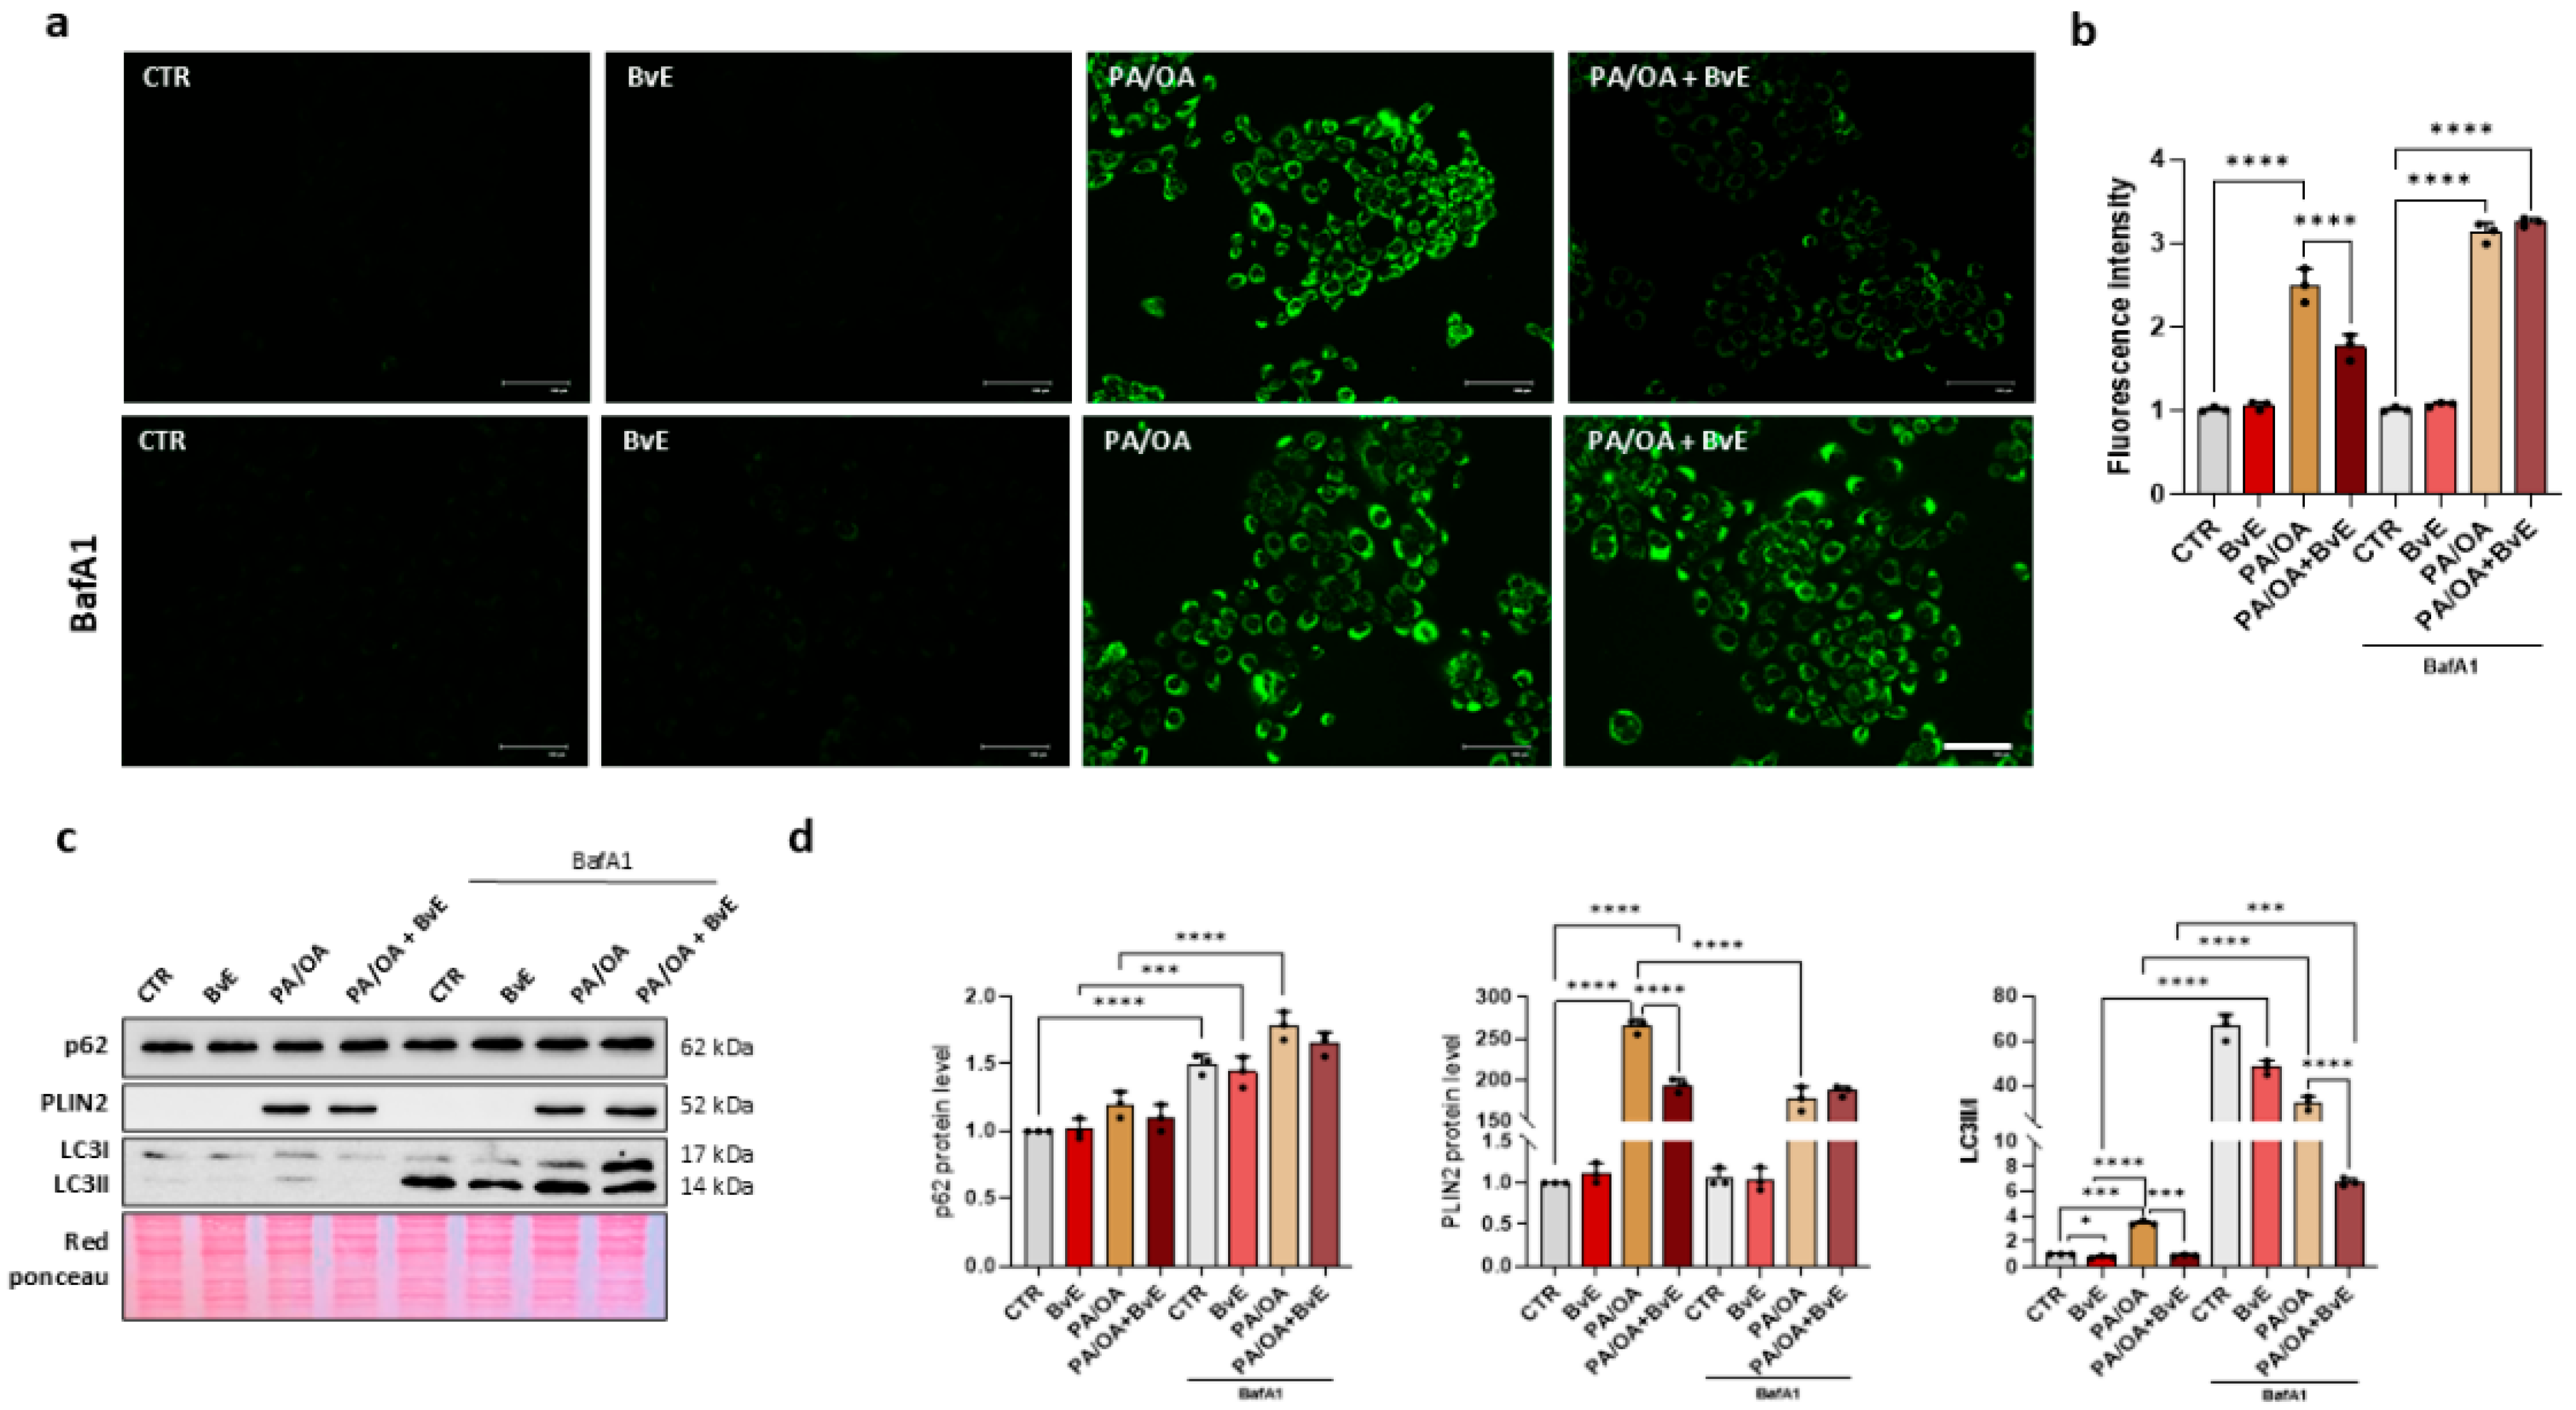
To investigate whether the anti-adipogenic effect of BvE is related to changes in the autophagy flux, LD accumulation and PLIN2 expression were studied in the presence of Bafilomycin A1 (BafA1), a well-established autophagy inhibitor that blocks lysosomal acidification and autophagosome–lysosome fusion.
As shown in
Figure 5a,b, in the absence of BafA1, PA/OA treatment significantly increased LD accumulation compared to control cells, as evidenced by enhanced fluorescence intensity. BvE co-treatment markedly reduced LD content in PA/OA-treated cells, restoring fluorescence levels close to those observed in control conditions. Consistently, Western blot analysis, in the absence of BafA1 (
Figure 5c,d), revealed that PA/OA treatment induced, compared to control, a significant (****
p < 0.001) PLIN2 accumulation. The LC3II/LC3I ratio was increased, compared with the control (***
p < 0.005) under this condition, suggesting an autophagic blockade associated with impaired LD turnover.
BvE alone reduced the LC3II/LC3I ratio compared with control cells (*
p < 0.05), a finding compatible with enhanced autophagic turnover. PA/OA + BvE co-treatment significantly reduced PLIN2 protein levels in PA/OA-treated cells compared with PA/OA alone (***
p < 0.005), while further modulating LC3II/LC3I levels in a manner consistent with enhanced autophagic flux. p62 protein level was unchanged (
Figure 5c,d).
When autophagy was pharmacologically inhibited by BafA1, the ability of BvE to reduce LD content was substantially abolished, with fluorescence intensity remaining elevated in PA/OA + BvE + BafA1 cells compared to the non-inhibited counterpart (
Figure 5a,b). Consistently, the BvE-mediated reduction in PLIN2 protein levels was largely prevented in the presence of BafA1, indicating that PLIN2 degradation induced by BvE is autophagy-dependent (
Figure 5c,d). As expected, BafA1 treatment caused accumulation of both LC3II/LC3I and p62 protein levels in BvE, PA/OA and PA/OA + BvE, confirming effective autophagy block.
2.9. BvE Suppresses De Novo Lipogenesis and Modulates Key Lipid Metabolism Regulators in PA/OA-Loaded Keratinocytes
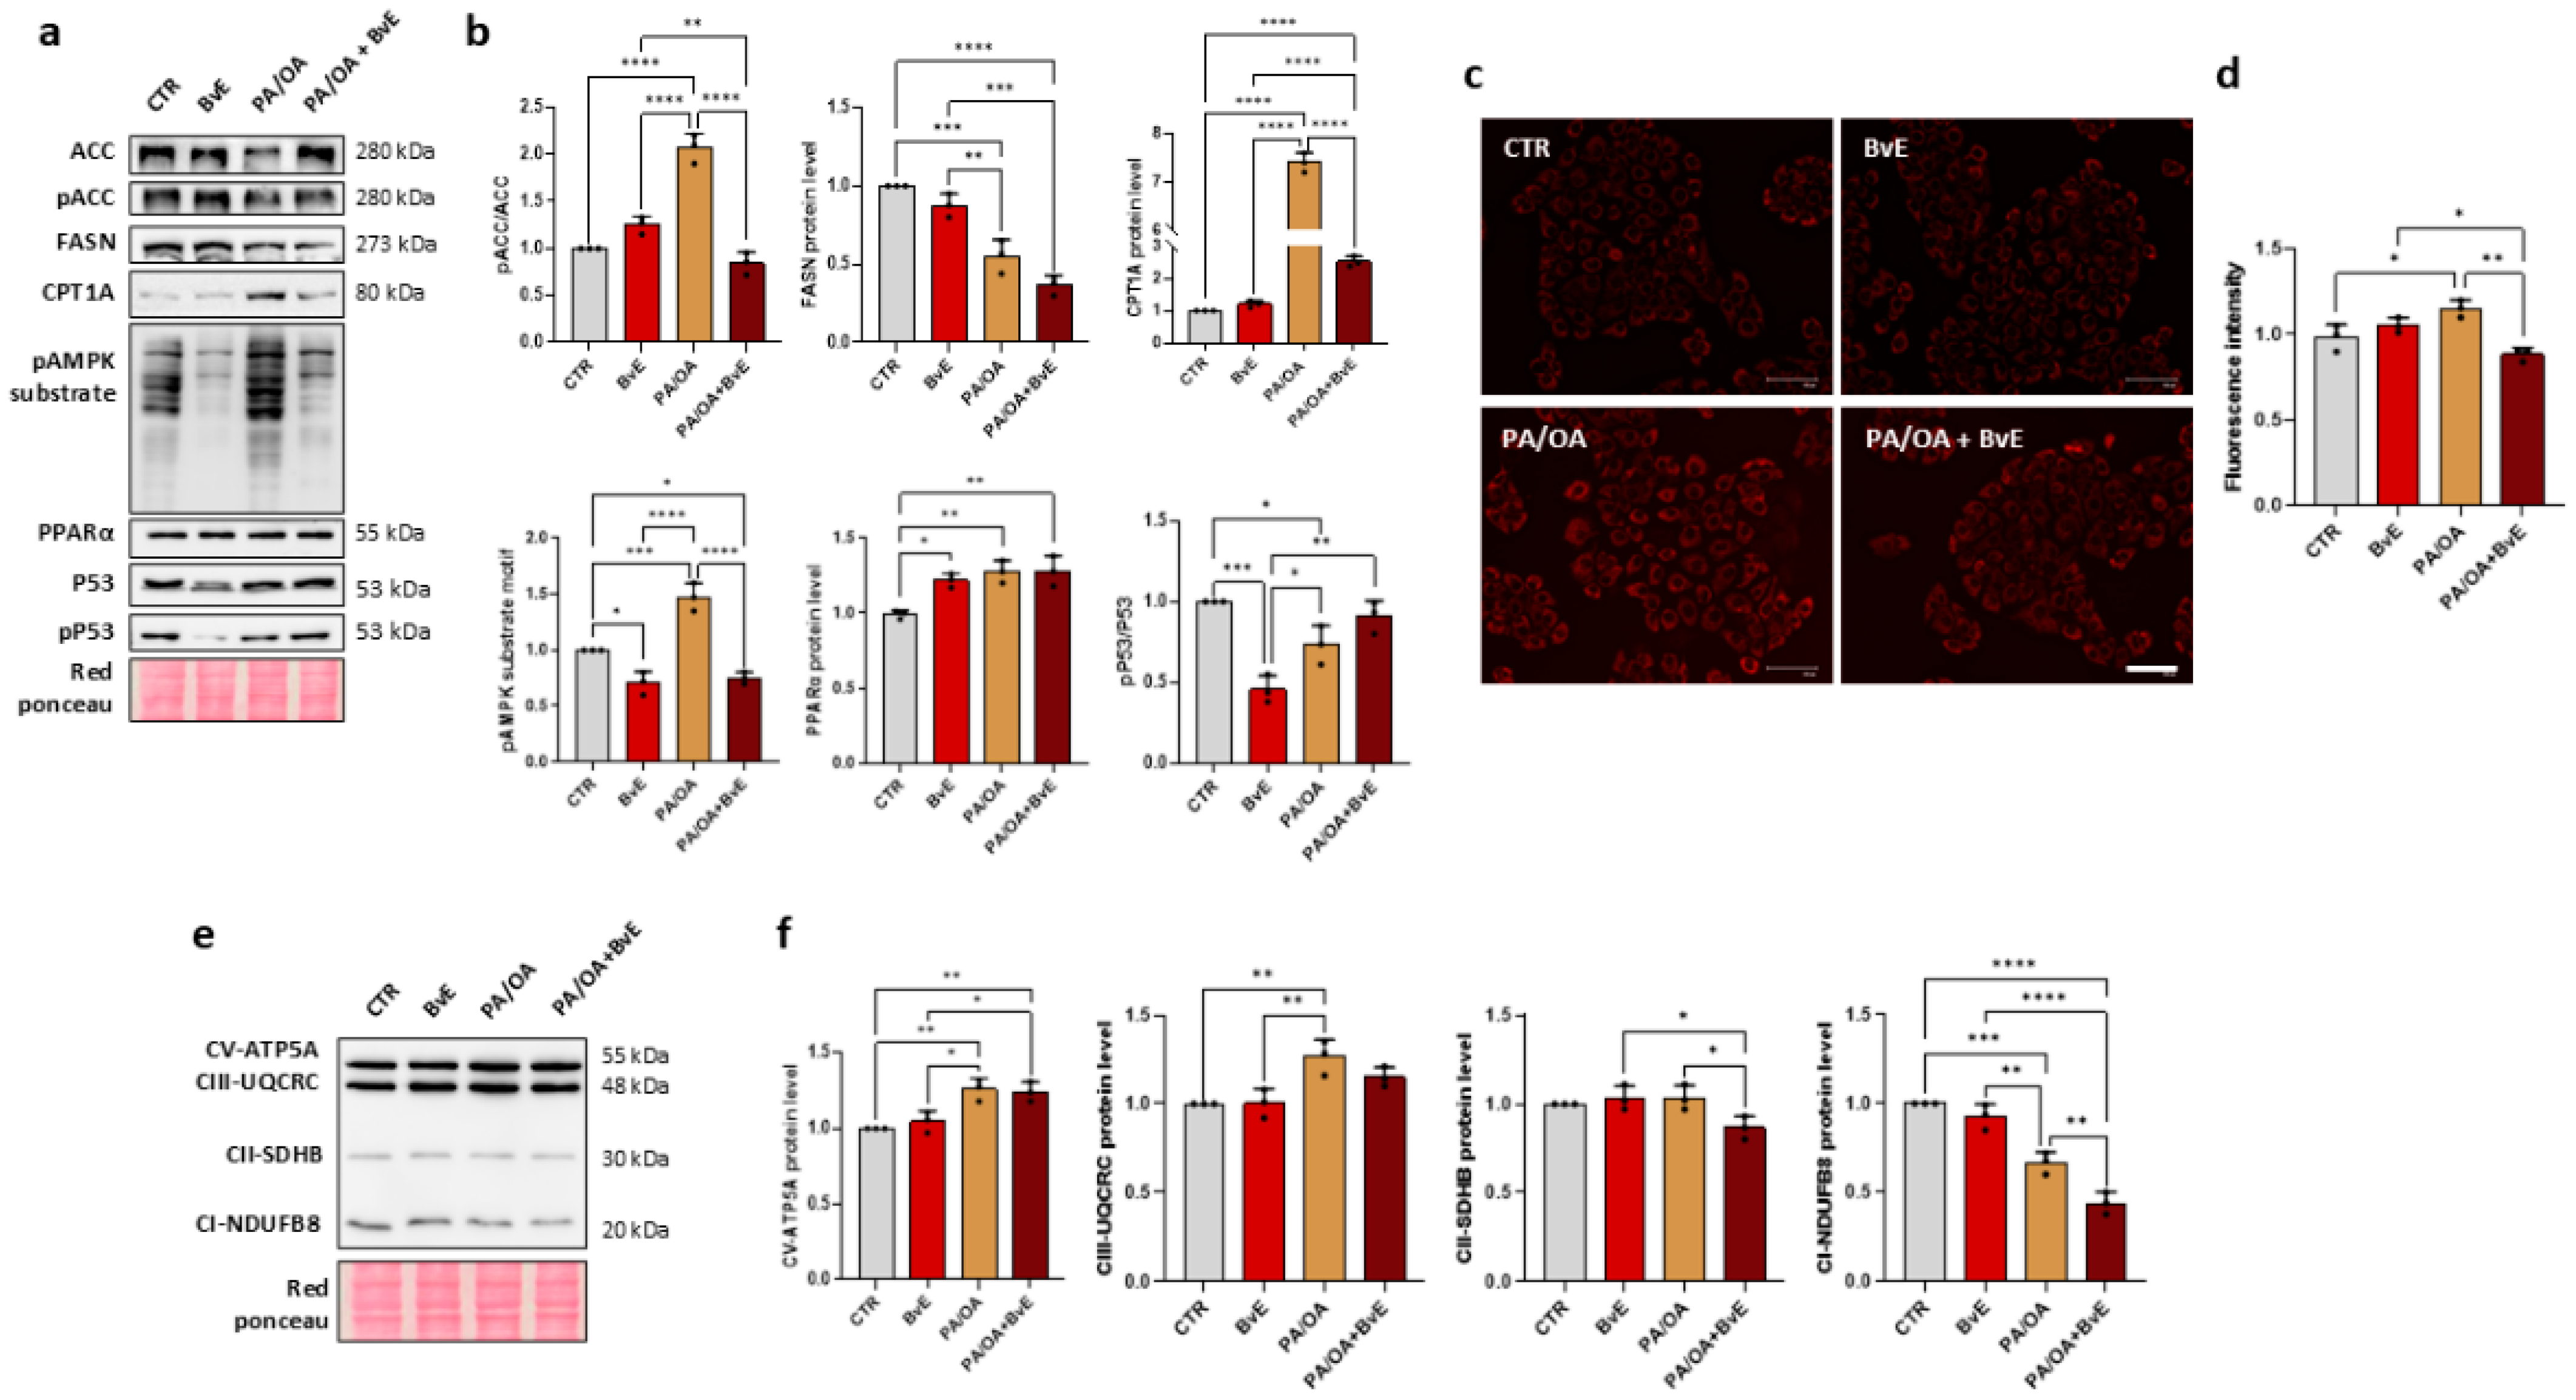
Given BvE’s ability to regulate lipid accumulation in keratinocytes, its impact on key enzymatic pathways of lipid metabolism was further investigated (
Figure 6a,b). The analysis was structured to follow the physiological hierarchy of lipid metabolic regulation, proceeding from
de novo lipogenesis (DNL) to upstream energy sensing and downstream catabolic programs.
DNL was assessed through two markers: the phosphorylation state of acetyl–CoA carboxylase (ACC) and the expression of fatty acid synthase (FASN). ACC is the rate-limiting enzyme of fatty acid synthesis, whose catalytic activity is allosterically suppressed upon phosphorylation at Serine 79 (pACC-Ser79). FASN catalyzes the terminal step of the DNL pathway.
In PA/OA-treated cells, pACC-Ser79 level was significantly increased (****
p < 0.001) and FASN expression was significantly reduced (***
p < 0.005) compared to CTR, reflecting a feedback inhibition of endogenous fatty acid synthesis in response to exogenous lipid overload. BvE co-treatment reduced pACC-Ser79 levels compared to PA/OA alone (****
p < 0.001), while FASN expression was unchanged compared with PA/OA, indicating that BvE consolidates the inhibition of DNL at multiple enzymatic nodes (
Figure 6a,b).
To contextualize these findings within the broader framework of cellular energy sensing, the AMPK signalling pathway was investigated, as AMPK represents the canonical upstream signal system responsible for ACC phosphorylation at Ser79 and a master regulator of the anabolic-to-catabolic metabolic switch.
PA/OA treatment significantly increased the phosphorylation of its downstream targets compared to CTR (*** p < 0.005). Notably, both BvE alone and PA/OA + BvE co-treatment significantly reduced AMPK phosphorylation compared to the PA/OA group (**** p < 0.001), indicating that BvE attenuates the hyperactivation of this energy-sensing pathway.
Downstream of AMPK, the expression of CPT1A, the rate-limiting enzyme governing the mitochondrial import and subsequent β-oxidation (FAO) of long-chain fatty acids, was markedly upregulated by PA/OA compared to CTR (**** p < 0.001). BvE co-treatment significantly antagonized this induction, reducing CPT1A expression compared with PA/OA alone (**** p < 0.001).
PPARα, the master transcriptional regulator of CPT1A, was similarly upregulated in both PA/OA and PA/OA + BvE conditions compared to CTR and BvE alone (** p < 0.01), further supporting the activation of a PPARα/CPT1A-mediated lipolytic program that BvE does not antagonize but potentially reinforces.
Finally, given the established role of p53 as a multi-stress sensor operating at the intersection of oxidative stress, ER homeostasis, and lipid metabolism, p53 phosphorylation was assessed as an integrative readout of the overall cellular response to BvE treatment. The pP53/P53 ratio was significantly reduced in both BvE-treated (***
p < 0.005) and PA/OA-treated cells (*
p < 0.05) compared to CTR (
Figure 6a,b).
2.10. BvE Modulates Mitochondrial Functions Under Lipotoxic Conditions
To assess whether AMPK activation paralleled functional changes at the mitochondrial level, mitochondrial membrane potential was evaluated using the MitoTracker™ Red CMXRos probe (
Figure 6c). PA/OA-treated cells showed a significant increase in fluorescence intensity compared with CTR (*
p < 0.05), indicative of mitochondrial hyperpolarization under lipotoxic conditions. At the same time, BvE alone did not significantly alter mitochondrial membrane potential. Strikingly, PA/OA + BvE co-treatment significantly reduced fluorescence intensity compared to PA/OA alone (**
p < 0.01) and compared to untreated CTR (*
p < 0.05), demonstrating that BvE attenuates PA/OA-induced mitochondrial alterations (
Figure 6d). To further characterize mitochondrial respiratory chain function, the expression of key oxidative phosphorylation (OXPHOS) complex subunits was assessed by Western blot (
Figure 6e,f). PA/OA treatment significantly upregulated CV-ATP5A (**
p < 0.01) and CIII-UQCRC2 (**
p < 0.01) compared to CTR, with levels partially maintained in the PA/OA + BvE condition. In contrast, CII-SDHB was significantly reduced upon co-treatment compared with PA/OA alone (*
p < 0.05). Most strikingly, CI-NDUFB8, a subunit of Complex I, was significantly downregulated by PA/OA (**
p < 0.01) and further reduced in the PA/OA + BvE condition (****
p < 0.001).
3. Discussion
To our knowledge, this is the first study to investigate the effects of an aqueous Beta vulgaris extract (BvE) on lipid metabolism and cellular stress responses in human keratinocytes. We demonstrate that BvE, standardized for betanin content and antioxidant capacity, exerts significant antioxidant, anti-lipogenic, and cytoprotective effects in HaCaT keratinocytes.
NMR metabolite profiling revealed a compositionally rich extract dominated by carbohydrates, glutamine, betanin, betaine, proteinogenic amino acids, and minor components including riboflavin and trigonelline. This complexity is consistent with previously reported profiles of beet-derived aqueous extracts and reflects the high metabolic activity of leaves grown in liquid bioreactor culture [
32,
33,
34,
35]. The SETIS
® temporary immersion bioreactor system ensures highly standardized and reproducible plant material, a critical prerequisite for mechanistic in vitro studies. Although betanin concentration (0.52 ± 0.09 mg g
−1 FW) was lower than typically found in commercial beetroot extracts, antioxidant capacity, soluble phenolics content (1.38 ± 0.24 mg GAE g
−1 FW), and flavonoid concentration (0.32 ± 0.08 mg GAE g
−1 FW) fell within the range reported for cultivated
B. vulgaris varieties [
19,
20,
21,
22,
23,
24], confirming the biological relevance of the tested concentrations. Betaine (0.085 ± 0.009 mg ml
−1), detected alongside betanin and polyphenolic pigments, is of metabolic interest given its established capacity to inhibit hepatic lipogenesis via SREBP-1c and FASN suppression. Its co-presence with other bioactive constituents may underline a multi-component synergy that explains why effects at 1 µg/mL BvE exceed predictions from any single purified constituent [
36].
DCFH-DA assay provides a global measure of intracellular ROS accumulation without distinguishing between specific reactive species such as superoxide, hydrogen peroxide, or hydroxyl radicals. By using this probe, we detected a significant reduction by BvE in oxidative burden in H
2O
2-exposed HaCaT cells. This was accompanied by elevated NRF2 protein levels even in the absence of exogenous stress, suggesting intrinsic activation of the KEAP1-NRF2 pathway, consistent with previously reported betanin-mediated NRF2 nuclear translocation in neuronal and hepatic models [
37]. The observed downregulation of catalase and GPx-4 under basal BvE treatment likely reflects reduced cellular demand for enzymatic antioxidant activity, a homeostatic adjustment consistent with the oxidative stress compensation model, rather than impairment of antioxidant defence. Under H
2O
2 co-treatment, the strong suppression of GPx-4 alongside maintained NRF2 elevation suggests that BvE provides upstream chemical interception of lipid-peroxidizing species, reducing the substrate load for GPx-4 and thus the physiological necessity for its induction. This is consistent with the established capacity of betalains to directly quench lipid peroxyl radicals [
33,
38]. Unchanged SOD1 levels across all conditions confirm that the response is specific to the peroxidative cascade [
39].
The central finding of this study is the marked attenuation of PA/OA-induced LD accumulation, quantified by BODIPY fluorescence, accompanied by mechanistically coherent changes in LD-regulatory protein expression. DGAT1, which catalyzes the committed rate-limiting step of TAG biosynthesis, was upregulated by PA/OA and partially reversed by BvE, suggesting suppression of terminal lipogenic flux [
40,
41]. The concomitant reduction in ATGL and MAGL, enzymes canonically associated with LD mobilization, is interpreted in the context of a global attenuation of lipid metabolic flux: by reducing LD biogenesis upstream via DGAT1 suppression, BvE likely diminishes the substrate availability that drives compensatory lipolytic upregulation [
42].
PLIN2, the dominant structural coat protein of LDs in non-adipose cells [
43], was massively induced by PA/OA and substantially reduced by BvE co-treatment, coherent with the reduction in LD accumulation. Inhibition of autophagy by BafA1 abolished the BvE-mediated reduction in both LD and PLIN2 protein levels, providing direct evidence that the extract exerts its lipid-lowering effect through an autophagy-dependent mechanism.
TLC-based lipid class analysis confirmed a profound PA/OA-induced remodelling of the neutral lipid landscape, elevating TAG from ~2% to ~28% of total neutral lipids at the expense of cholesterol esters. BvE co-treatment partially reversed this pattern, reducing TAG to ~23% and partially restoring cholesterol ester content to ~66%, indicating a preferential effect on TAG metabolism. The residual TAG elevation likely reflects the kinetics of experimental design, as BvE was administered only during the final 24 h of a 48-h PA/OA exposure, providing a therapeutic rather than preventive window. Nonetheless, the ~16% relative reduction in TAG content within this constrained timeframe argues for an acute modulatory effect on TAG turnover.
AMPK was robustly activated by PA/OA, indicating activation of a catabolic response. AMPK simultaneously inactivates ACC, the rate-limiting enzyme of DNL, and upregulated CPT1A [
44]. Consequently, FASN was progressively downregulated by PA/OA and further suppressed by BvE, with AMPK-mediated ACC inhibition depleting the malonyl–CoA substrate pool. The coordinated upregulation of PPARα and CPT1A in PA/OA and PA/OA + BvE conditions further supports induction of a compensatory mitochondrial catabolic program, which BvE does not antagonize.
The AMPK axis has been extensively characterized in metabolically active non-epidermal cell types. In hepatocytes and adipocytes, AMPK activation promotes phosphorylation of PLIN2 at Ser492, targeting it for chaperone-mediated autophagic degradation and restoring lipolytic access to the LD core [
8]. In skeletal muscle, a comparable mechanism has been linked to exercise-induced lipid mobilisation. However, whether this axis is functionally operative in keratinocytes has not been previously demonstrated. The present findings showing a concomitant reduction in AMPK signaling and PLIN2 protein levels following BvE treatment under lipotoxic conditions.
Although AMPK and PLIN2 were both upregulated under PA/OA-induced lipotoxic conditions, this co-elevation likely reflects a state of metabolic overload in which the transcriptional induction of PLIN2, driven by the massive accumulation of neutral lipids [
45], overwhelms the capacity of AMPK-mediated phosphorylation to target PLIN2 for chaperone-mediated autophagic degradation. Conversely, BvE co-treatment reduced both AMPK activation and PLIN2 protein levels, suggesting that BvE acts upstream of this axis by attenuating LD biogenesis, thereby diminishing the primary stimulus for PLIN2 transcriptional induction rather than directly modulating the AMPK-PLIN2 degradation axis itself.
BvE also induced a broad suppression of all three canonical UPR branches (IRE1α/XBP1s, PERK/eIF2α, and ATF6) and the master ER chaperone GRP78/BiP in HaCaT cells. Simultaneous downregulation across all branches suggests reduction in the global ER proteostatic load rather than selective antagonism of a single sensor, consistent with reduced lipid-induced bilayer stress, a recognized primary trigger for IRE1α and PERK oligomerization. Downregulation of GRP78 should be interpreted because of diminished ER stress rather than reduced ER folding capacity. These effects were reproduced in HCT15 intestinal epithelial cells, extending the cytoprotective profile of BvE across the epithelial lineage [
46,
47].
At the mitochondrial level, PA/OA induced significant hyperpolarization of mitochondrial membrane potential (ΔΨm), an early pathophysiological indicator of lipotoxic dysfunction reflecting over-reduction in the electron transport chain (ETC) and consequent ROS generation. BvE co-treatment significantly attenuated this hyperpolarization, suggesting a protective effect on mitochondrial bioenergetics. OXPHOS subunit analysis revealed selective downregulation of CI-NDUFB8 by PA/OA, further accentuated by BvE, alongside significant reduction in CII-SDHB in the combined condition, suggesting a broader mitochondrial remodelling consistent with hormetic mitochondrial adaptation. Furthermore, although direct functional assays like Seahorse respirometry or ATP measurements were not performed, the convergent evidence from ΔΨm quantification and OXPHOS profiling provides a consistent overview of BvE’s mitochondrial effects, establishing a solid baseline for future functional investigations.
Finally, the progressive downregulation of the pP53/P53 ratio across treatment conditions provides an integrative readout of the cellular stress landscape. The broad suppression of UPR signalling by BvE would be expected to reduce PERK-mediated p53 phosphorylation, consistent with resolved ER stress, while AMPK-mediated FASN repression may provide an additional transcriptional brake on lipogenesis via p53-dependent mechanisms.
These observed biological effects correlate well with the comprehensive chemical profile of BvE outlined in
Figure 2. Specifically, the high abundance of sugars, alongside specific lipotropic compounds like betaine, provides a clear functional and chemical rationale for the subsequent molecular modifications, directly linking the extract’s composition to the mitigation of cellular stress and lipid dysregulation.
4. Materials and Methods
4.1. Seed Sterilization, Pre-Germination, and TIBs SETIS™ Seedling Growth
Beta vulgaris L. subsp. vulgaris Beetroot Group ‘Aplastada de Egipto’ seeds were sterilized in a desiccator using chlorine gas [
48] with slight modifications; 35 mL of 5% titrated bleach (Niclor 5, OGNA, Milan, Italy) and 4 mL of 34% HCl were used to generate chlorine gas, and the seeds were exposed to it for 20 min. After exposure, the chlorine gas was removed by activating a vacuum pump. The sterile seeds were vernalized at 4 °C for 48 h and germinated on Petri dishes containing sterile solid MS medium pH 5.75, including 2.2 g/L MS, 10 g/L sucrose, and 10 g/L agar (Duchefa Biochemie, Haarlem, The Netherlands). Seedlings were incubated in a growth chamber with 22 ± 1 °C, 70–90 µmol m
−2 s
−1 light flux and a 16-h light/8-h dark photoperiod. Once germinated, the seedlings were transferred into TIBs (Temporary Immersion Bioreactors) SETIS™ (Vervit, Lochristi, Belgium) filled with sterile MS medium pH 5.75 containing 4.4 g/L MS and 15 g/L sucrose (Duchefa Biochemie, Haarlem, The Netherlands) with Plant Preservative Mixture (PPM, Plant Cell Technology, Washington, DC, USA) at 0.1% (
v/
v). The TIBs were maintained in the same growth chamber with identical conditions as during germination. Seedlings were submerged in the liquid medium for 2 min every 6 h [
49,
50].
4.2. Leaf Harvesting and BvE Preparation, and Quantification
Long-term culture in TIBs was established from 30-day plants grown in TIBs. These were harvested and sectioned under sterile conditions into roots (which were eliminated), leaves (useful for extract preparation), and vegetative apexes (1–2 cm), which were transferred to a new TIBs SETIS™ containing a fresh growing medium to restart biomass production in 30-day cycles. The leaves collected every 30 days were placed in 50 mL Falcon tubes, freeze-dried, and stored at −80 °C. The FW and the DW of the material in each Falcon tube were recorded. BvE was obtained in water, used as an extraction buffer due to its superior ability to recover betalains from plant tissues [
51]. The extraction procedure consisted of two steps: first, the material was rehydrated to its corresponding fresh weight; subsequently, additional water was added to reach a final fresh weight-to-liquid ratio of 1:2. The extracts were obtained by grinding the leaves with water in a chilled glass mortar. The mixture was centrifuged at 4500 rpm (3900×
g) for 10 min at 4 °C. The supernatant was collected, divided into 1 mL aliquots, and stored at −80 °C.
Betanin concentration was determined using the Lambert–Beer equation by measuring absorbance at 538 nm, the characteristic wavelength for betacyanin, with betanin being one of the most abundant pigments. A molar extinction coefficient of 60,000 and a molecular weight of 550 g/mol were employed for calculations [
33,
51,
52]. Spectrophotometric measurements were performed using the UV2600 spectrophotometer (Shimadzu, Kyoto, Japan). Betanin concentration is reported as the mean and standard deviation across three independent batches.
4.3. Determination of BvE Soluble Phenolics Content
The soluble phenolics content of the BvE was quantified utilizing the Folin–Ciocalteu assay [
53] with slight modifications. Specifically, 5 µL of BvE was diluted to a final volume of 50 µL with RPE water, followed by the addition of 450 µL of RPE water and 50 µL of Folin–Ciocalteu reagent, with thorough mixing. After a five-minute incubation, 500 µL of 7% Na
2CO
3 solution and 200 µL of RPE water were added, bringing the final volume to 1250 µL, and the samples were mixed again. For the blank, 5 µL of RPE water replaced the BvE. The samples were then incubated in darkness at 20 °C for 90 min, and absorbance was measured at 750 nm. Phenol concentration was determined via a calibration curve constructed with gallic acid standards (10, 20, 40, 80, 100, 120 µg/mL) prepared in RPE water. Spectrophotometric readings were acquired using a Shimadzu UV2600 spectrophotometer (Kyoto, Japan). Phenols concentration is reported as the mean and standard deviation across three independent batches.
4.4. Determination of BvE Flavonoid Content
The flavonoid content of the BvE was quantified following the method described in [
53], with slight modifications. A volume of 10 µL of BvE was diluted to 500 µL with RPE water. Subsequently, 30 µL of 5% NaNO
2 solution was added, and the mixture was homogenized. After 5 min at 20 °C, 60 µL of 10% AlCl
3 solution was incorporated. The samples were mixed again, and after 6 min, 200 µL of 1 M NaOH and 210 µL of RPE water were added, bringing the final volume to 1000 µL. The mixture was thoroughly mixed. A blank was prepared by replacing BvE with 10 µL of RPE water. Absorbance measurements were taken at 510 nm using a UV2600 spectrophotometer (Shimadzu, Kyoto, Japan). A calibration curve was established with known concentrations of catechin standard (3.125, 6.25, 12.5, 25, 50, 100, 200, 400 µg/mL) in RPE water. Flavonoid concentration is reported as mean and standard deviation across three independent batches.
4.5. Determination of BvE Nitrate Content
The nitrate content of the BvE was determined following the method outlined in [
54], with some modifications. A 5 µL aliquot of BvE was diluted to a final volume of 25 µL with RPE water. To this, 80 µL of 5% salicylic acid solution prepared in concentrated H
2SO
4 was added, and the samples were mixed. After incubation for 20 min at 20 °C, 950 µL of RPE water was added, and the mixture was briefly mixed before adding 950 µL of 4 M NaOH. The samples were mixed again. Due to the pigmentation of BvE, blanks were prepared individually for each sample using a 5 µL aliquot of BvE, but substituting the salicylic acid solution with only concentrated H
2SO
4. Following centrifugation at 13,000 rpm (15,500×
g) for 1 min, absorbance was measured at 410 nm. A calibration curve was constructed using known concentrations of NO
3-N (20, 40, 60, 80, 100, 120 µg/mL) to quantify nitrate levels. The NO
3-N stock solution (0.500 µg/mL) was prepared by dissolving 0.1805 g of KNO
3 in 50 mL of RPE water. Results were expressed as NO
3–N and converted to NO
3− using the molecular weight ratio NO
3−/N = 4.43. Spectrophotometric measurements were performed on a UV2600 spectrophotometer (Shimadzu, Kyoto, Japan). Nitrate concentration is reported as mean and standard deviation across three independent batches.
4.6. Determination of BvE Antioxidant Activity
The determination of antioxidant activity was carried out using the TEAC (Trolox Equivalent Antioxidant Capacity) assay [
55] with slight modifications. The ABTS·
+ solution was diluted 1:90 in 5 mM Phosphate-Buffered Saline (PBS), pH 7.4. Three aliquots of 10 µL of each BvE were transferred into 2 mL microcentrifuge tubes, and 1 mL of diluted ABTS·
+ solution was added for the determination of hydrophilic antioxidant capacity. Control samples (0 µM Trolox) were prepared by adding 10 µL of methanol to 1 mL of ABTS·
+ solution, while the blank consisted of 1 mL of PBS. The reaction mixtures were incubated for 15 min at 20 °C in the dark, after which they were transferred into cuvettes and the absorbance was measured at 734 nm. A linear calibration curve ranging from 0 to 15 µM Trolox was prepared in PBS for quantifying antioxidant activity. Spectrophotometric measurements were performed using the UV2600 spectrophotometer (Shimadzu, Kyoto, Japan). The antioxidant capacity of BvE was expressed as Trolox equivalents (TE) and reported as µmol TE mL
−1 and µmol TE g
−1. Antioxidant capacity is reported as the mean and standard deviation across three independent batches.
4.7. NMR Analysis of BvE
BvE was lyophilized and redissolved in the same volume of deuterium oxide (D
2O) (99.9 atom %D) containing 0.05% wt 3-(trimethylsilyl)propionic-2,2,3,3 d4 acid sodium salt (TSP) (Sigma-Aldrich, St. Louis, MO, USA). Then, samples were spun down in a microcentrifuge at 10,000 g for 10 min at 4 °C, and the supernatants were transferred to 5 mm NMR tubes. All measurements were performed on a Bruker Avance III 600 Ascend NMR spectrometer (Bruker, Ettlingen, Germany), operating at 600.13 MHz for
1H observation, equipped with a TCI cryoprobe (triple resonance inverse cryoprobe) incorporating a z-axis gradient coil and automatic tuning matching (ATM). Experiments were acquired at 300 K. For each sample a 1D sequence with pre-saturation and composite pulse for selection (zgcppr Bruker standard pulse sequence) was acquired, with 128 transients, 16 dummy scans, 5 s relaxation delay, a size of Free Induction Decay (FID) of 64K data points, a spectral width of 12,019.230 Hz (20.0276 ppm), and an acquisition time of 2.73 s. Spectra were processed in a standardized manner using Topspin 4.1.4 (Bruker, Biospin, Italy) with 0.3 Hz line-broadening, Fourier transformation, phasing, and baseline correction [
56]. Metabolite identifications were based on
1H (
1H-
1H J-resolved,
1H-
1H COSY correlation spectroscopy) and
13C (
1H-
13C heteronuclear single quantum correlation, HSQC;
1H−
13C heteronuclear multiple bond correlation, HMBC) assignment by 1D and 2D omo- and heteronuclear experiments and by comparison with literature data. Quantification of metabolites was performed using the ratio method [
29]; TSP (δ = 0.00 ppm) was used as an internal standard. The compositional reproducibility of BvE was evaluated by analyzing three independent batches.
4.8. Cell Treatments and Viability Test
Human colon cancer cell line HCT15 and human immortalized keratinocytes HaCaT were maintained in Dulbecco’s Modified Eagle Medium (DMEM, D5546, Sigma-Aldrich, St. Louis, MO, USA) supplemented with 10% fetal bovine serum (FBS, Capricorn HI-12A), 100 U/mL penicillin, 100 μg/mL streptomycin (#P4333, Sigma-Aldrich, St. Louis, MO, USA), and 2 mM glutamine (G7513, Sigma-Aldrich, St. Louis, MO, USA). Cells were cultured at 37 °C in a humidified atmosphere with 5% CO2 and regularly screened for mycoplasma contamination using a Mycoplasma Detection Kit (Aurogene, Roma, Italy, REP-MYSNC-100).
To induce lipid accumulation and metabolic stress, cells were exposed to a mixture of PA (COD. 506345) and OA (COD. 75090) (Sigma-Aldrich, St. Louis, MO, USA). Fatty acids were dissolved in fatty-acid-free bovine serum albumin (BSA, COD. 03117057001) at 8 mM concentration and were subsequently diluted to the desired final concentration in DMEM immediately before cell treatments. For cell treatments with PA and OA, we chose the concentration of 0.2 mM, which represents the physiological postprandial intestinal concentration [
57,
58] and is within the concentration range of FFAs in human plasma (i.e., 0.2–2 mM) [
58,
59]. To evaluate the therapeutic potential of BvE, the treatment was administered in a post-insult phase: after the first 24 h of PA/OA exposure, the medium was supplemented with BvE (1 µg/mL) for the remaining 24 h of the experiment. For oxidative stress induction, hydrogen peroxide (H
2O
2, COD. 216763) was used as a positive control at a final concentration of 400 µM for 24 h. For lysosomal degradation inhibition, BafA1 (COD. 54645s, Santa Cruz Biotechnology, Dallas, TX, USA) was used as positive control at a final concentration of 200 nM, added 3 h before the end of the treatment.
For viability assay, HCT15 and HaCaT cells were seeded at 5 × 10⁴ cells/well in 96-well plates in DMEM supplemented with 10% FBS and 1% antibiotics. After treatment, Alamar Blue reagent was added. The plate was incubated for 4 h at 37 °C in a humidified atmosphere with 5% CO2. Fluorescence was read at 560/590 nm by a Biotek Cytation 5 Cell Imaging Multimode Reader (Agilent Technologies, Santa Clara, CA, USA).
4.9. Fluorimetric Assessments
Intracellular ROS level was assessed using the cell-permeable fluorescent probe 2′,7′-dichlorodihydrofluorescein diacetate (DCFH-DA, D399). HCT15 and HaCaT cells were seeded in 12-well plates. After treatments, cells were washed with PBS and incubated with a fresh serum-free culture medium containing 20 μM DCFH-DA for 30 min at 37 °C, in the dark. Following incubation, cells were washed twice with PBS to remove the extracellular dye and resuspended in PBS for imaging. Images were captured using a fluorescence microscope (Cell Imaging Station Microscope, Invitrogen™, FLoid™ Cell Imaging Station, 10 213–412, ThermoFisher Scientific, Waltham, MA, USA) at 20× magnification with a scale bar of 100 μm. The mean fluorescence intensity, proportional to ROS production, was quantified using ImageJ 1.54 software (NIH, Bethesda, MD, USA). Fluorescence intensity was measured at 485/530 nm by a Biotek Cytation 5 Cell Imaging Multimode Reader (Agilent Technologies, Santa Clara, CA, USA) and normalized to protein content.
For the BODIPY stain protocol, used for LD analysis, cells were seeded onto coverslips in 12-well plates at 60–80% confluence. After treatment, cells were washed twice with PBS and incubated for 15 min at 37 °C with BODIPY 493/503 at a dilution of 1:1000 in PBS from a 1 mg/mL stock solution. Thereafter, cells were washed three times with PBS and used for rapid image acquisition. Images were captured using a Cell Imaging Station microscope (Invitrogen™, FLoid™ Cell Imaging Station, 10-213-412, ThermoFisher Scientific, Waltham, MA, USA) at 20× magnification with a scale bar of 100 μm. Fluorescence intensity was measured at 485/530 nm by a Biotek Cytation 5 Cell Imaging Multimode Reader (Agilent Technologies, Santa Clara, CA, USA) and normalized to protein content.
Mitochondrial membrane potential was evaluated using the MitoTracker™ Red CMXRos fluorescent probe (ThermoFisher Scientific, #M7512). Following the experimental treatments, HCT15 and HaCaT cells seeded in 12-well plates were washed twice with PBS to remove serum traces and metabolic byproducts. Cells were then incubated with a 100 nM MitoTracker™ Red solution, diluted in serum-free medium or PBS, for 20 min at 37 °C in a humidified atmosphere with 5% CO2. To minimize background fluorescence, cells were washed again with PBS after incubation. For quantitative assessment, the fluorescence intensity was measured at 570/620 nm by a Biotek Cytation 5 Cell Imaging Multimode Reader (Agilent Technologies, Santa Clara, CA, USA) and normalized to protein content. Images were captured using a Cell Imaging Station microscope (Invitrogen™, FLoid™ Cell Imaging Station, 10 213412, ThermoFisher Scientific) at 20× magnification with a scale bar of 100 μm.
4.10. TLC Analysis of Lipids
Total lipids were extracted from HaCaT and HCT15 cells using methyl-tert-butyl ether as an extraction solvent, as reported in [
60]. Extracted lipids were loaded on silica gel plates for TLC analysis. Plates were developed with hexane/ethyl ether/acetic acid (70/30/1;
v/
v/
v). After development, plates were uniformly sprayed with 10% cupric sulfate in 8% aqueous phosphoric acid, allowed to dry for 10 min at room temperature, and then placed into a 145 °C oven for 10 min, as reported in [
61]. Different lipid species were identified by developing specific standards under the same experimental conditions. Spot intensity was measured by densitometric analysis.
4.11. Western Blot Analyses
Cellular proteins were extracted from cells using RIPA lysis buffer (Cell signaling Technology, Danvers, MA, USA, #9806). Total protein level was determined using the Bradford method (Bio-Rad Laboratories, Hercules, CA, USA, Cat. no 5000201). After boiling for 5 min, proteins were loaded and separated by SDS polyacrylamide gel electrophoresis. The samples were then transferred onto a nitrocellulose membrane (Bio-Rad Laboratories, Hercules, CA, USA, Cat. no 1620115) and blocked at room temperature for 1 h using 5% (
w/
v) non-fat milk in TBS-Tris buffer (Tris-buffered saline (TBS) plus 0.5% (
v/
v) Tween−20, TTBS). The membranes were incubated with the primary antibodies (
Table S2). After washing with TTBS, the blots were incubated with peroxidase-conjugated monoclonal secondary antibodies (Cell signaling Technology, Danvers, MA, USA, #7074 or #7076s) at 1:10,000 dilutions at room temperature for 1–2 h. The blots were then washed thoroughly in TTBS. Western blotting analyses were performed using the Amersham ECL Advance Western Blotting Detection Kit (GE Healthcare, Little ChaOEAnt, UK), and the ChemiDoc system (Bio-Rad Laboratories, Hercules, CA, USA, Cat. no 12003153) was used for 6 chemiluminescence measurements. Densitometric analysis of the immunoblots was performed using Image LabTM Version 6.0.1 2017 (Bio-Rad Laboratories, Hercules, CA, USA) software.
4.12. Statistical Analysis
All experiments were performed in at least three independent biological replicates. Data are expressed as mean ± standard deviation (SD). Given the nature of the data and the number of replicates, parametric testing was applied assuming approximate normality. Statistical analysis was performed using GraphPad Prism 9.1.0. Comparisons between two groups were made using a two-tailed Student’s t-test. Multiple group comparisons were performed by one-way analysis of variance (ANOVA); where all pairwise comparisons were of interest, ANOVA was followed by Tukey’s honestly significant difference (HSD) post hoc test. A p-value < 0.05 was considered statistically significant.




 ,
,