2.1. Chemical Analysis of Photochromic Pigment
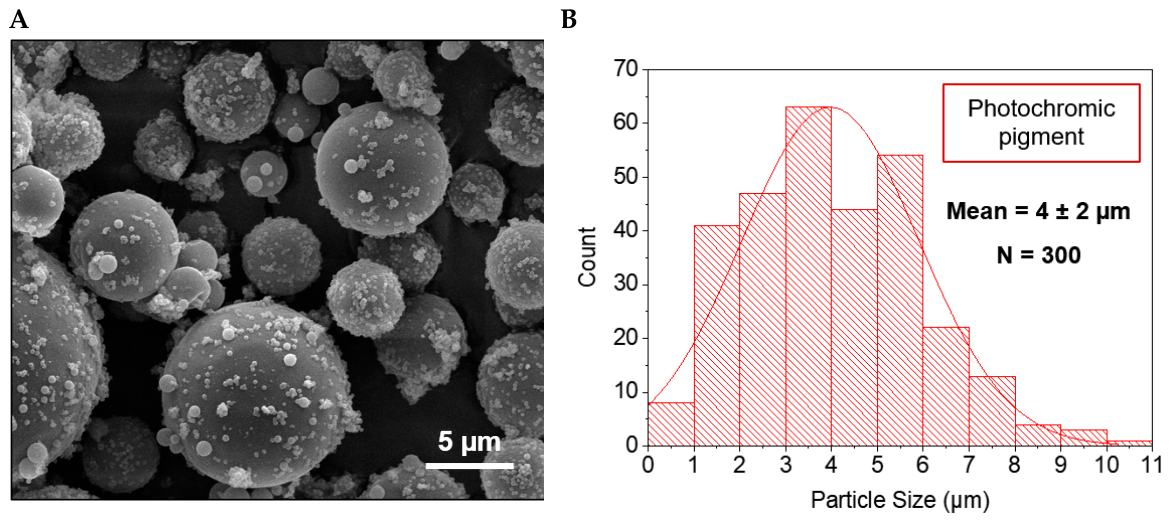
In the first stage of chemical analysis, the purchased pigment was subjected to solubility tests, which were carried out using various solvents: water, methanol, ethanol, acetone, toluene, isopropyl alcohol, pyridine, and dimethylformamide (DMF). For this purpose, 1 mg of colourant was mixed with 10 mL of pure solvent using a magnetic stirrer. After 120 min of continuous mixing at a rotation speed of 250 rpm, the mixtures were assessed organoleptically up to 7 days after their preparation. In the case of acetone and DMF, the mixture was heated to 60 °C. In none of the variants was the added colourant observed to dissolve. In all variants, a white turbid precipitate remained, which still changed colour to pink after UV irradiation, except for acetone and hot DMF. From data from other manufacturers of similar chemical compounds, e.g., QCR Solutions Corp., it appears that these may also be photochromic microencapsulated dyes, which are specially designed for use in non-aqueous-based ink systems, and they can be used to formulate non-aqueous-based flexographic, UV, screen, offset, gravure, and epoxy ink formulations. However, analysing the results obtained for the solvents used, it was decided to maintain the conclusion that the purchased chemical compound is a photochromic pigment.
To determine the chemical composition of the compound purchased for research, an analysis was performed using spectroscopic methods.
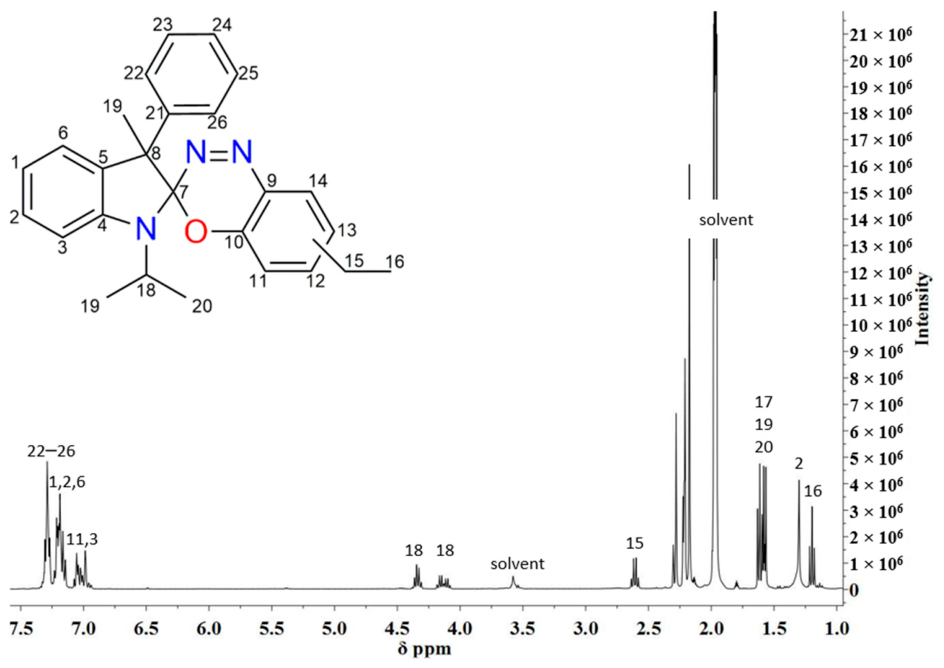
Figure 1 and
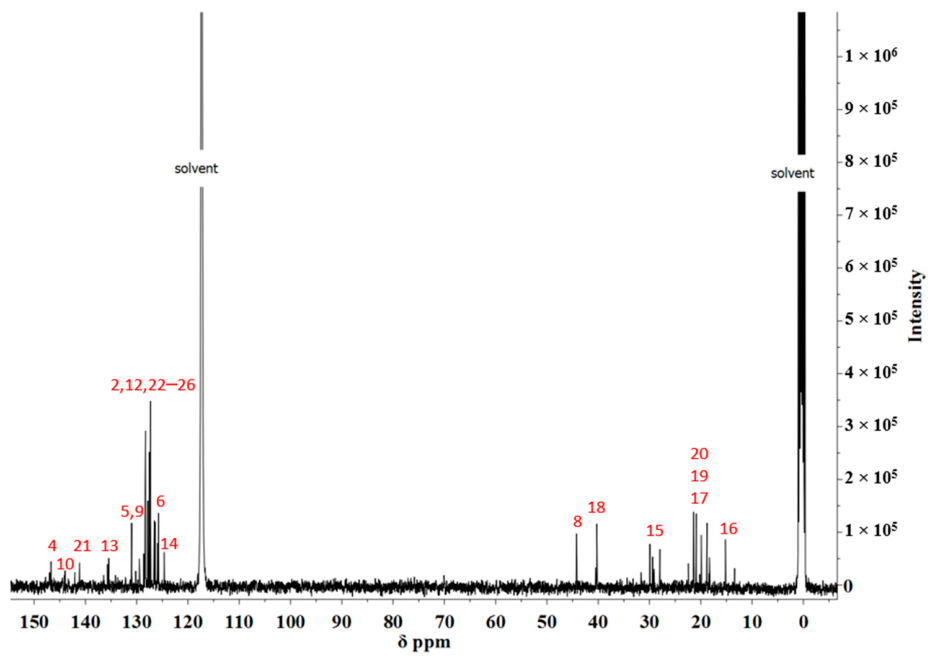
Figure 2 depict the representative
1H NMR and
13C NMR spectra, with peak assignments labelled accordingly in the structural formulas. In the
1H NMR spectrum (400 Hz, CD
3CN) of the analysed pigment, distinct signals were detected at the following chemical shifts: δ (ppm) = 1.20 (3H, t, 12-CH
2-C
H3), 1.30 (3H, s, 8-CH
3), 1.55–1.64 (6H, m, -N-CH-(C
H3)
2), 2.61 (2H, q, 13-C
H2-CH
3), 4.35 (1H, p, -N-C
H-(CH
3)
2), 6.92–7.10 (3H, m, 11-H, 1-H, 3-H), 7.13–7.23 (4H, m, 24-H, 26-H, 2-H, 14-H), 7.25–7.34 (5H, m, 8-C
6H
5) (
Figure 1). The
13C NMR spectrum (400 Hz, CD
3CN) of the photochromic pigment revealed signals with chemical shifts: δ (ppm) = 15.19 (1C, 12-CH
2-
CH
3), 18.80–20.90 (2C, -N-CH-(
CH
3)
2), 21.43 (1C, 8-CH
3), 27.99–29.9 (1C, 13-
CH
2-CH
3), 40.5 (1C, -N-
CH-(CH
3)
2), 44.2 (1C, 8-Cq), 124.6 (1C, 9-
C-CH=), 125.8 (1C, 5C=
CH-CH=), 126.5–127.8 (5C, 8-
C6H
5; 1C,1-CH=
CH-CH=; 1C, 11-CH=
CH-CH=), 128.2 (1C, 6-CH=
C-C; 1C =N-
C-CH=), 131.0 (1C, 14-CH=
C-CH
2-), 135.4 (1C, 8-
C6H
5), 141.1 (1C, 7-O-
C=C), 146.7 (1C, 5-CH=
C-N) (
Figure 2).
The assignment of proton signals in the
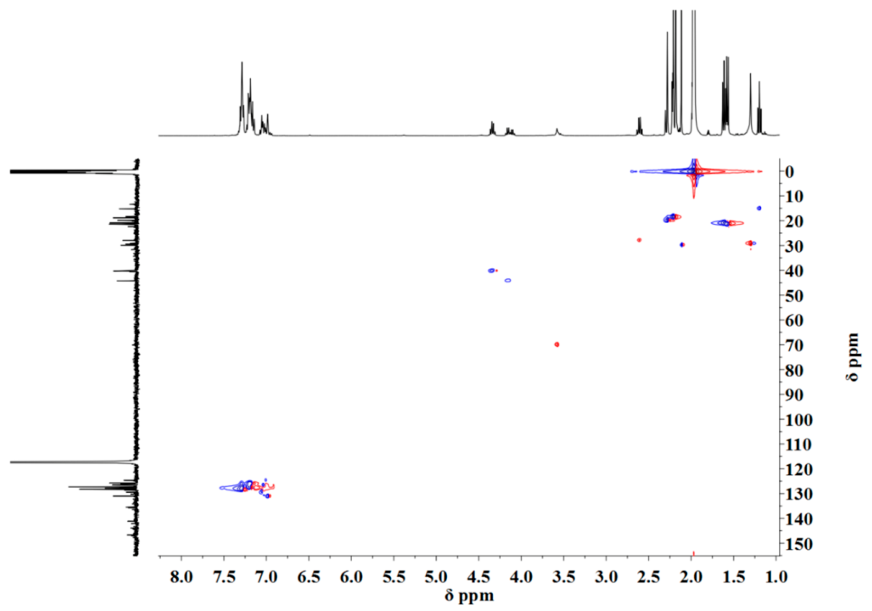
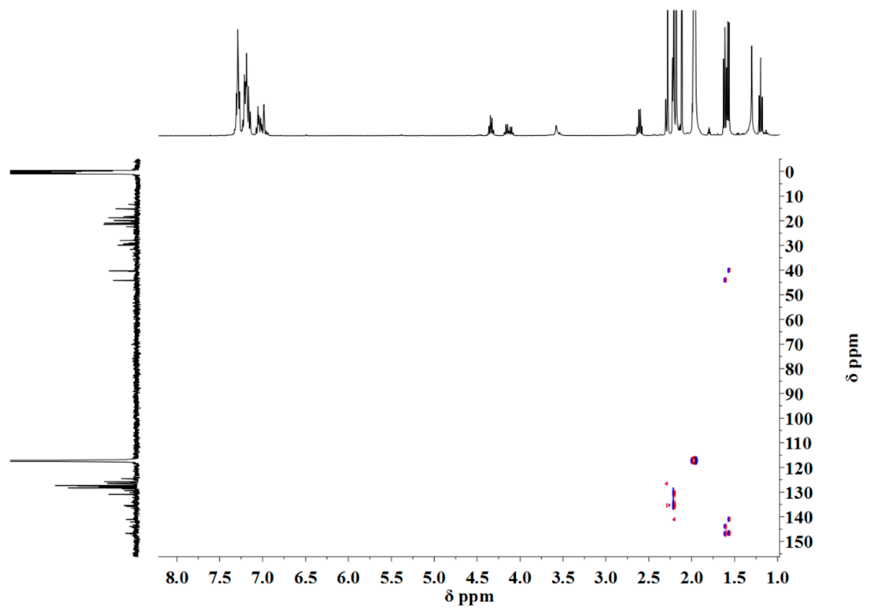
1H NMR spectrum was supported through the analysis of two-dimensional NMR techniques. The HSQC and HMBC spectra provided information on direct and long-range correlations between protons and corresponding carbon atoms (
Figure 3 and
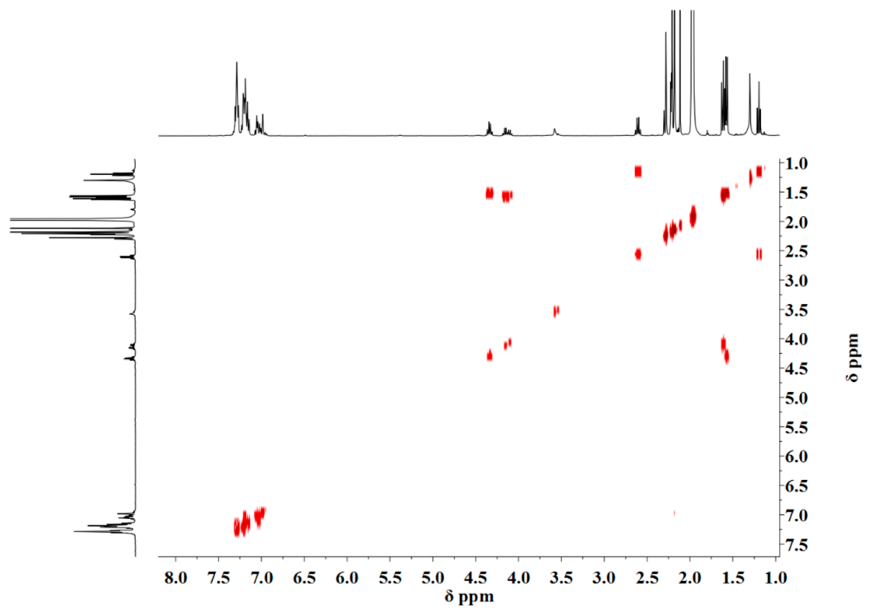
Figure 4). COSY correlates the chemical shifts of spins that share a mutual J-coupling and was utilised to investigate couplings between protons (
Figure 5). All signals that appear in the one-dimensional spectrum will show a peak along the diagonal in the COSY spectrum. The cross-peaks (off-diagonal peaks) show which hydrogens share a J-coupling through the correlation between the two chemical shifts [
31,
32]. The cross-peaks observed in the spectrum provided valuable information on proton connectivity and facilitated the identification of distinct spin systems within the pigment structure. The COSY spectra confirmed scalar couplings within the ethyl and isopropyl groups and facilitated identification of proton spin systems in the aromatic region. The 2D NMR experiments allowed improved differentiation of partially overlapping aromatic signals observed in the downfield region of the
1H NMR spectrum. The combined analysis of
1H,
13C, HSQC, HMBC, and COSY spectra enabled the proposed structural interpretation of the investigated photochromic pigment. Based on literature data concerning aromatic substitution patterns and characteristic functional groups of photochromic compounds, together with spectral predictions generated using Mnova 15.1.0 software for various photochromic systems, the pigment was assigned to an ethyl-3′-methyl-3′-phenyl-1′-(propan-2-yl)-1′,3′-dihydrospiro[[4,1,2]benzoxadiazine-3,2′-indole]-type structure [
33,
34,
35,
36].
Elemental composition analysis (CHNS) confirmed the presence of carbon (77.23%), hydrogen (7.42%), nitrogen (9.75%), and oxygen (5.60%) in the photochromic pigment. These results align with the theoretical values (C: 78.56%; H: 6.85%; N: 10.57%; O: 4.02%) for structurally related compounds, such as ethyl-3′-methyl-3′-phenyl-1′-(propan-2-yl)-1′,3′-dihydrospiro[[4,1,2]benzoxadiazine-3,2′-indole] with the molecular formula C26H27N3O and average mass 397.51 g mol−1. A slight discrepancy in the above values may be related to the presence of a dispersant additive in the photochromic pigment, which is also indicated by the overlapping signals in some areas in the NMR spectra.
The chemical bonding structure was obtained from FTIR-ATR spectroscopy.
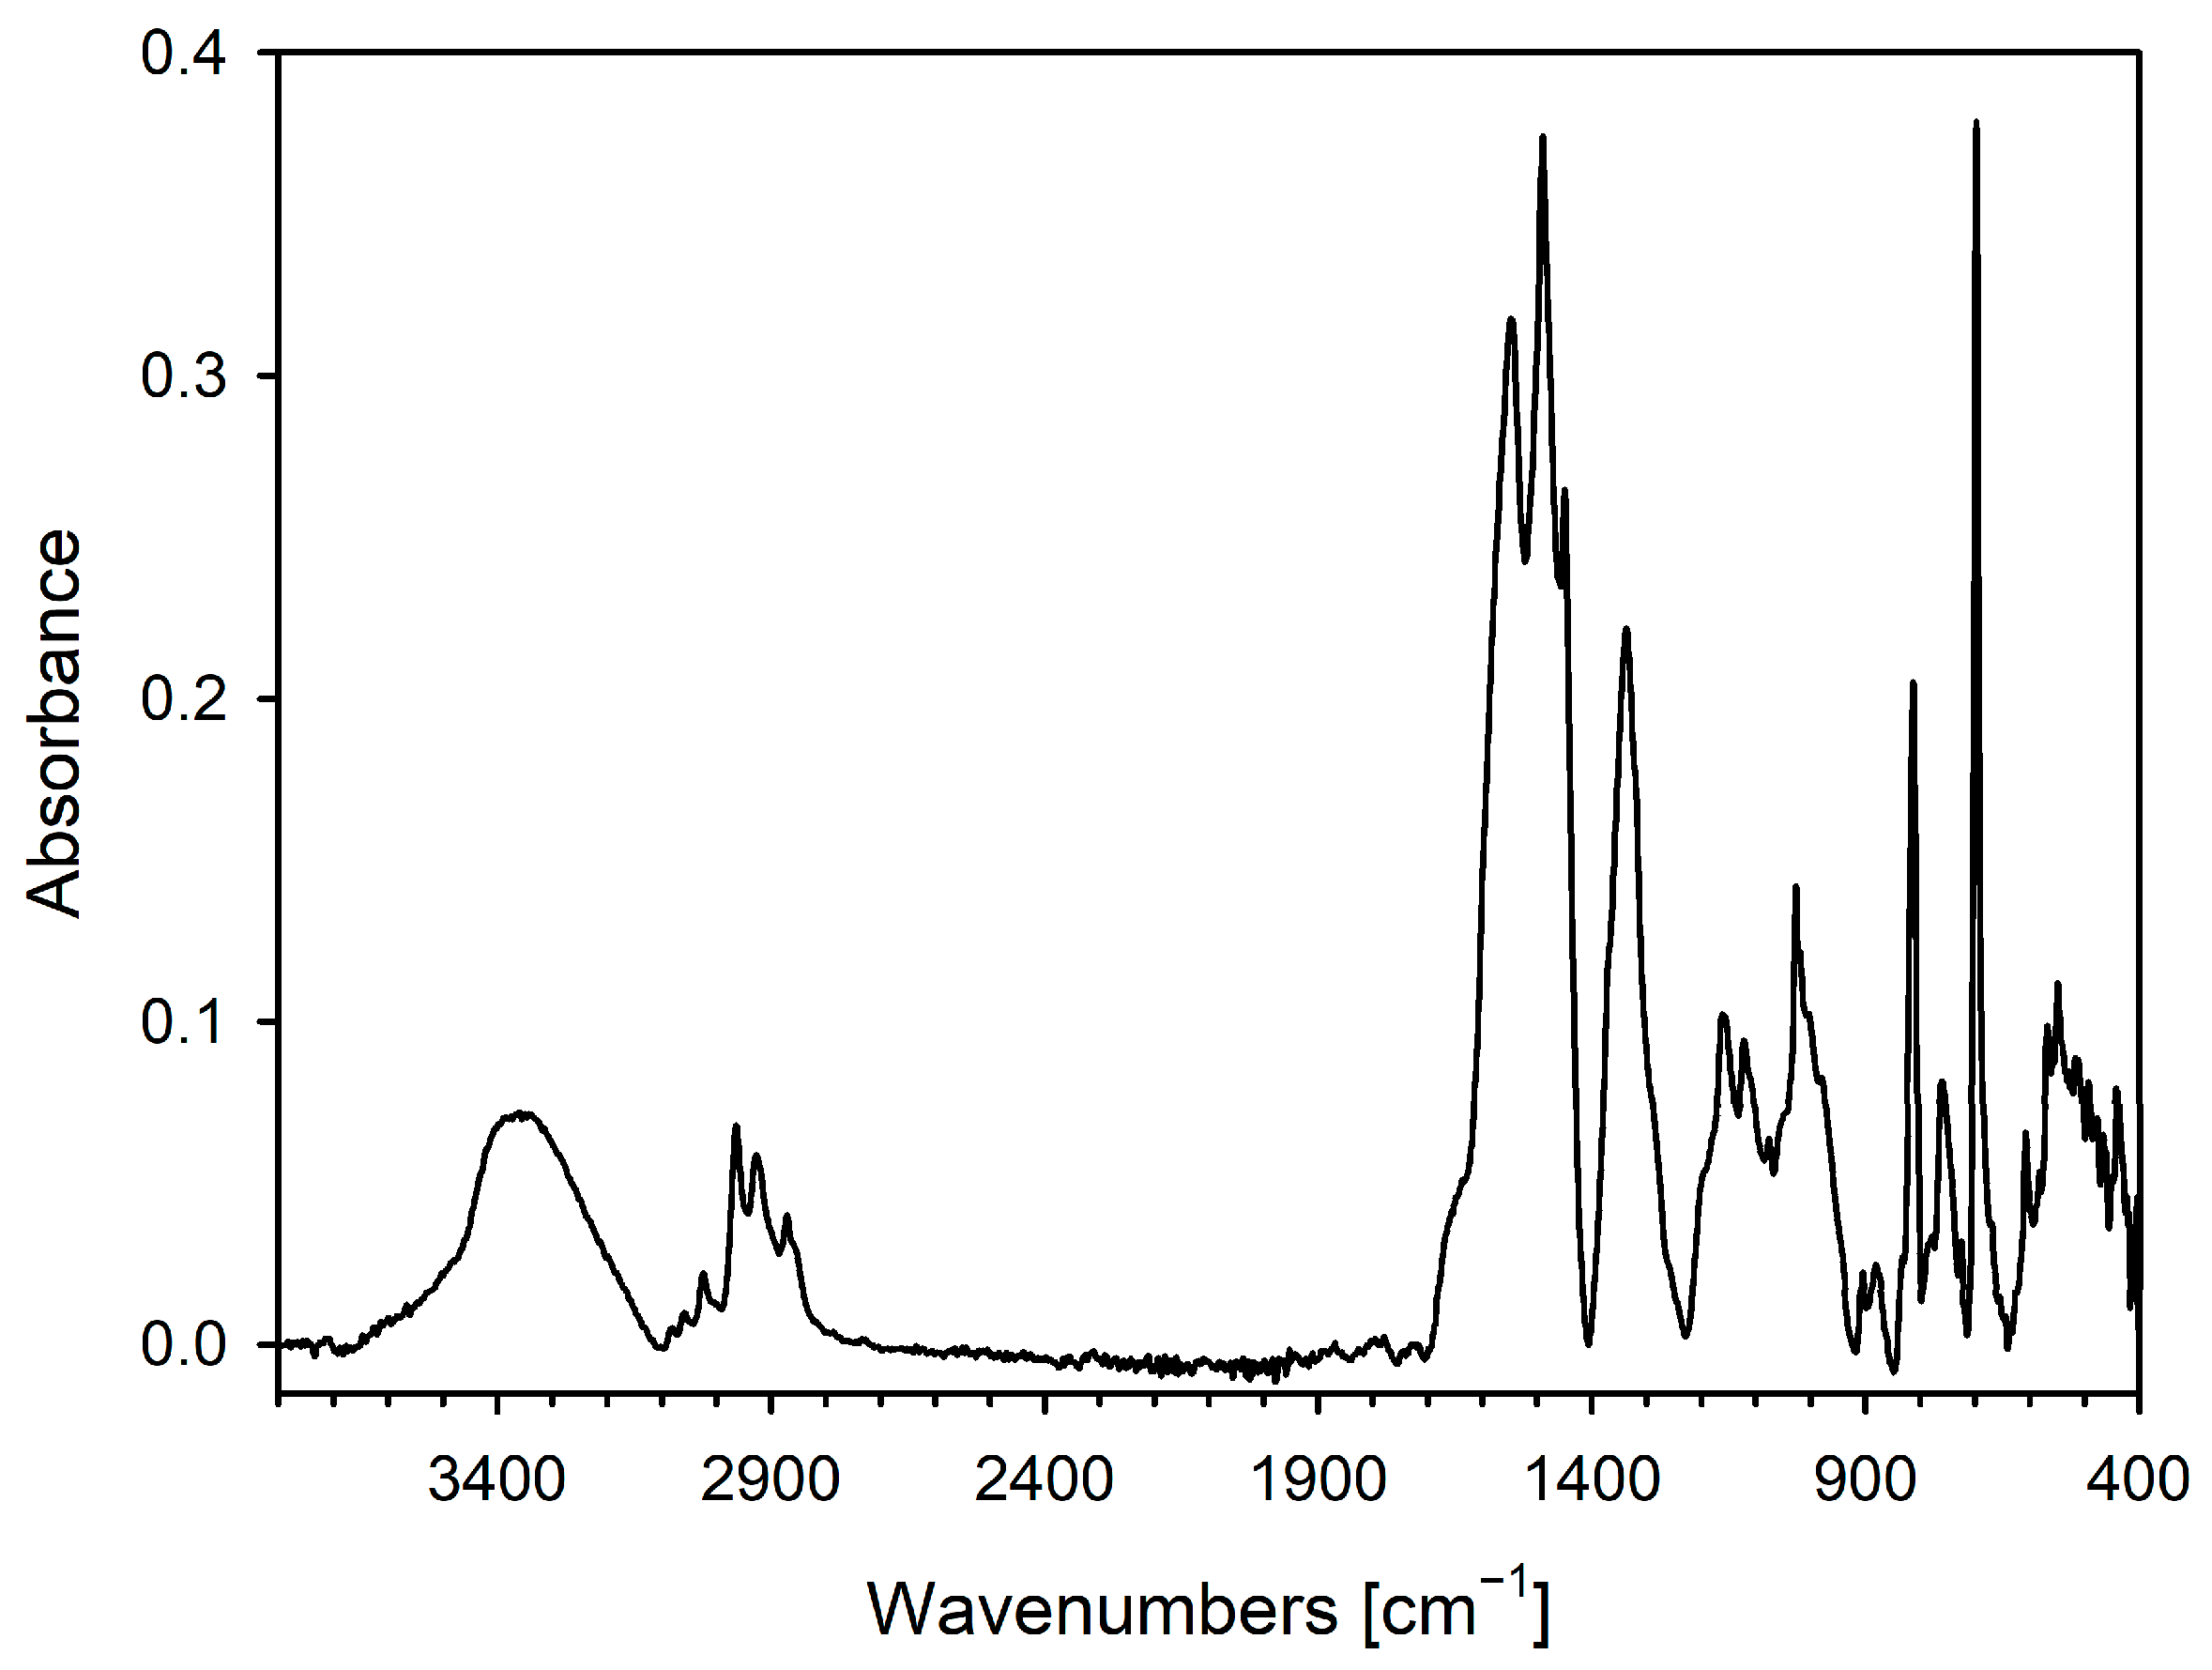
Figure 6 shows the FTIR spectrum of the analysed photochromic pigment. In the spectra, the peak at 3359 cm
−1 contributes to the absorption of O-H stretching vibration and indicates the presence of water in the pigment [
37]. In this wavenumber range, both O-H stretches and N-H stretches can occur; however, in our case, N-H bonds are not present. The O-H bonds are more polar than N-H bonds, therefore form stronger hydrogen bonds, and hence have wider peaks than N-H bonds. The analysed spectrum contains several peaks confirming the presence of unsaturated aromatic rings [
38,
39]. The peaks in the region of 3100–3000 cm
−1 can be attributed to C-H stretching vibrations, the peaks from 1600 to 1400 cm
−1 are ring modes (C-C stretching vibrations in the ring), while the peaks at 812 cm
−1 and 697 cm
−1 indicate benzene ring substitution (aromatic C-H wagging) and the presence of ring bend, respectively. The absorption peaks at 2964, 2926 and 2869 cm
−1 are the CH
3 asymmetric C-H stretch, the CH
2 asymmetric stretch, and the CH
3 symmetric stretch, respectively. The FTIR spectrum exhibits also distinct absorption band at 1336 cm
−1 including C-N stretching vibration present in the spirobenzoxadiazine molecule [
33,
40]. The bands in the region of 1200–900 cm
−1 are typically assigned to C-O stretching vibrations of aromatics. To sum up, the absorption peaks visible in the FTIR spectrum indicate that the analysed photochromic pigment belongs to the group of spirobenzooxadiazine [
33] and at the same time confirm that it may be a compound with the molecular formula C
26H
27N
3O.
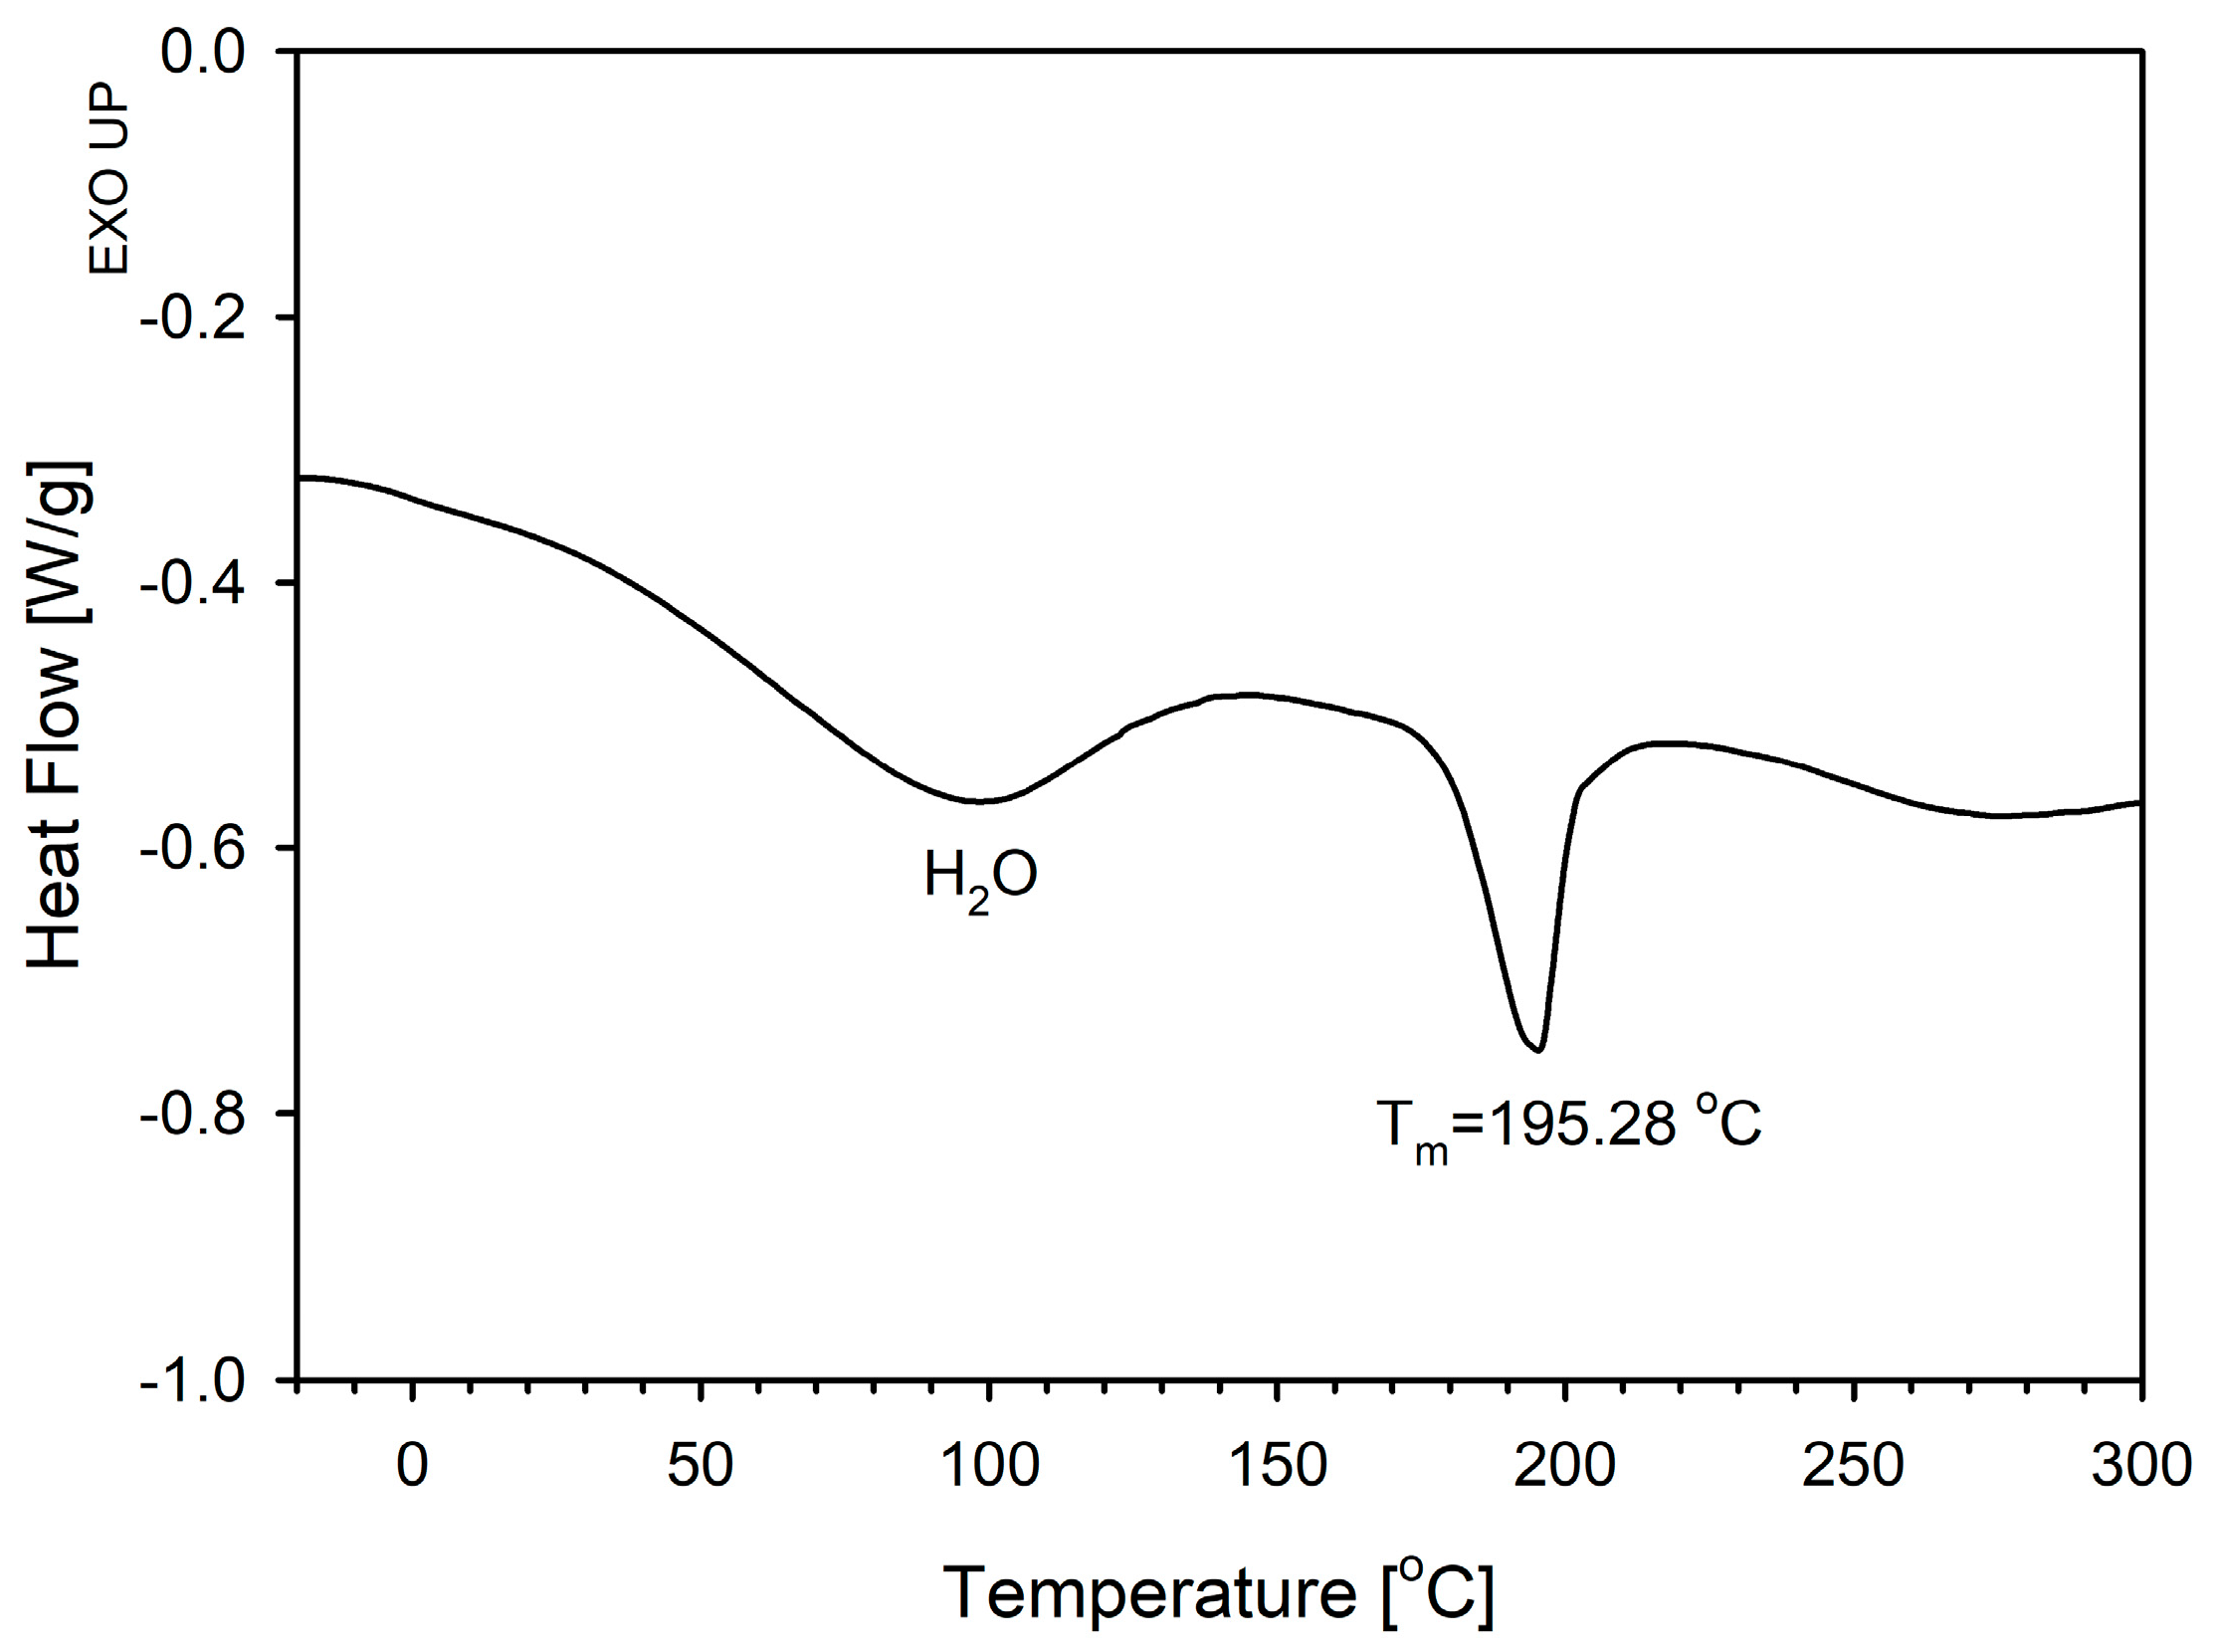
Additionally, differential scanning calorimetry (DSC) analysis was performed for the examined pigment.
Figure 7 shows the endothermic peaks from the first heating curves of the photochromic pigment. From the DSC thermogram, it can be observed that samples of photochromic pigment display two thermal transitions: water evaporation from the sample (T = 94.70 °C) and the melting temperature (T
m = 195.28 °C) of photochromic pigment. During the analysis, it was confirmed that the NMR spectra obtained for the purchased photochromic pigment do not coincide with the spectrum of the compound declared by the manufacturer and described by CAS number 114747-45-4 (1,3,3-Trimethylindoline-6′-(1-piperidinyl)spironaphthoxazine) in the technical specification. Based on the conducted spectroscopic analysis, elemental composition analysis, thermal properties, and multiple literature sources [
34,
41,
42,
43,
44,
45], it can be concluded that the analysed pigment does not belong to the spiropyran or spirooxazine group. In addition, differences between theoretical and measured values in the CHNS analysis (e.g., higher hydrogen and oxygen content compared to the model) are typical for technical pigments containing hygroscopic additives and organic excipients (e.g., dispersants and surfactants), as confirmed by the presence of a water signal in the FTIR spectrum (3359 cm
−1) and an endothermic peak in the DSC curve (94.70 °C).
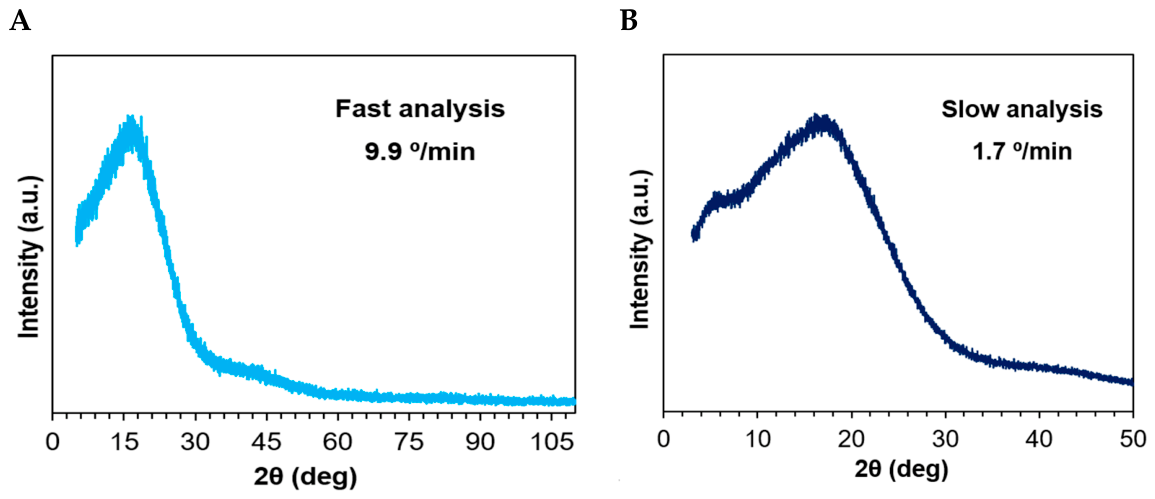
In parallel to the NMR studies, X-ray diffraction (XRD) analysis was conducted to investigate the morphological structure of the tested photochromic pigment. Two measurements were performed at different scan rates: 9.9°/min and 1.7°/min. The slower analysis was performed to increase the measurement resolution and determine a better signal-to-noise ratio. In both cases, broad diffraction peaks were observed in the 2θ range of 10–30°, with the maximum intensity around 20 degrees (
Figure 8A,B). Due to the lack of sharp diffraction peaks and notable differences between the two XRD plots, the previous assumptions that the tested pigment is amorphous material were confirmed.
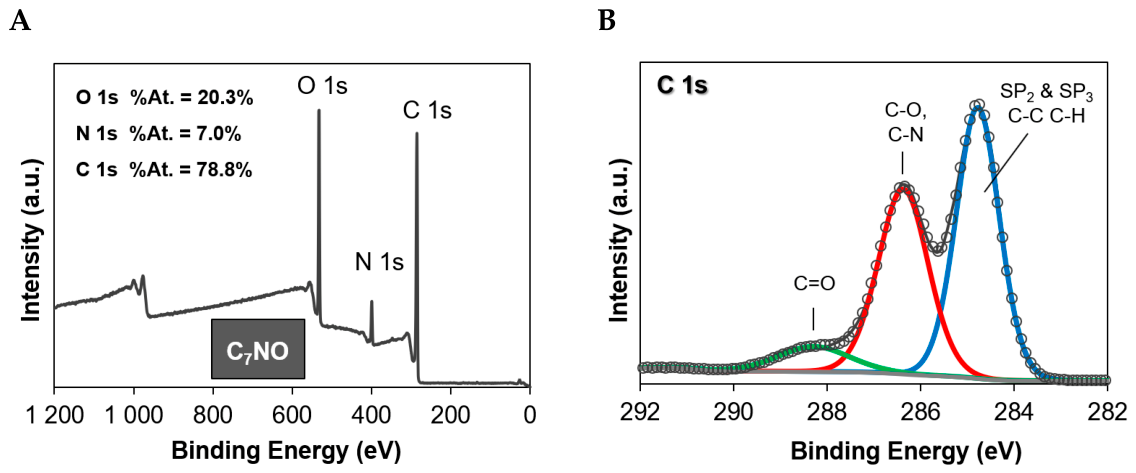
Additionally, XPS analysis was performed, which showed the general elemental composition of the analysed sample. Three main peaks visible in
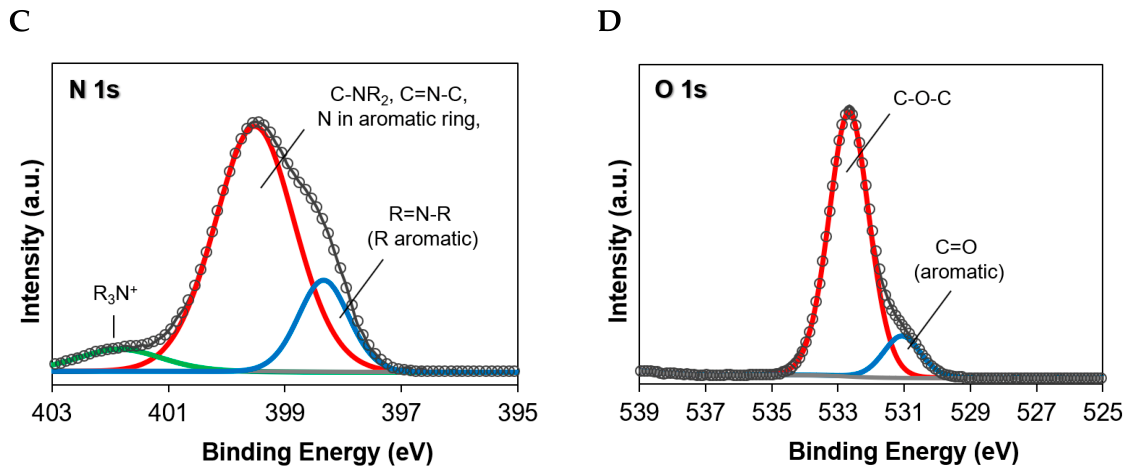
Figure 9A correspond to carbon (peak around 285 eV), nitrogen (peak around 400 eV), and oxygen (peak around 532 eV). Based on the obtained results, the percentage share of individual elements was also determined, which was 7.0%, 20.3%, and 78.8% for nitrogen, oxygen, and carbon, respectively. Deconvolution spectra for high-resolution C 1s, N 1s, and O 1s spectra are shown in
Figure 9B–D. In the case of carbon spectrum analysis (
Figure 9B), it was shown that there are three different types of carbon bonds in the sample: (i) carbon in sp
2 hybridisation (band at 284.8 eV) with low bond energy, which usually occurs in aramid or double C=C rings, and carbon in sp
3 hybridisation (band at 286.3 eV) characteristic of aliphatic chains or single C-C and C-H bonds; (ii) carbon bonds with oxygen or nitrogen (band at 286.3 eV) with higher bond energy, which are characteristic of alcohols, ethers (C-O), or amines (C-N); and (iii) carbonyl bonds (band at 288.6 eV) with the highest C=O bond energy, which are characteristic of aldehydes, ketones, or carboxylic acids. In the case of nitrogen spectrum analysis (
Figure 9C), it was shown that the molecule has two types of nitrogen bonds in the sample: (i) nitrogen in the aromatic ring (band at 399.3 eV) or bonded to carbon in the form of C-NR
2 (characteristic bond for secondary amines) and C=N-C (characteristic bond for imine); and (ii) nitrogen in azo bonds with aromatic groups R=N-R (band at 398.2 eV). Additionally, it was shown that in the band at 401.7 eV there are also bonds with higher bond energy, suggesting the occurrence of the R
3N
+ group, which are characteristic of ammonium salts or are formed as a result of protonation of amine groups. Analysing the oxygen spectrum (
Figure 9D), two types of bonds were observed in the molecule: (i) oxygen bonds in single bonds with carbon atoms (band at 533.0 eV) characteristic of ether groups and alcohols; and (ii) oxygen bonds in carbonyl groups C=O (band at about 531.6 eV), which is characteristic of systems associated with an aromatic ring, e.g., in quinones and carboxylic acids. Thus, the chemical analysis performed confirmed the occurrence of characteristic photochromic pigment bonds. The presence of bands corresponding to carbonyl groups (C=O) in the XPS spectrum, in the absence of these in the structure of the main chromophore, is attributed to the presence of carrier resins or pigment coating substances (microencapsulation), which is consistent with the information about the pigment’s intended use in non-aqueous ink systems (flexo, offset, UV). Based on the assumptions, it was possible to establish a model of the molecule, although its exact structural configuration remains uncertain. This ambiguity may be attributed to the fact that the purchased compound is a synthetic pigment, likely developed through the partial combination of various molecular fragments. However, further investigation into its detailed structure goes beyond the scope of the presented work.
2.2. Cytotoxicity
A cytotoxicity assessment was conducted to evaluate whether the tested photochromic pigment poses a risk to human skin cells, particularly primary dermal fibroblasts, which play a key role in maintaining skin structure and function. The chemical composition and toxicological profile of such pigments are often poorly characterised, raising concerns about their potential effects on human health and the environment. Considering the possible use of photochromic pigments in skin-contact materials, such as textiles or wearable products, a biocompatibility assessment following the ISO 10993-5 standard was employed [
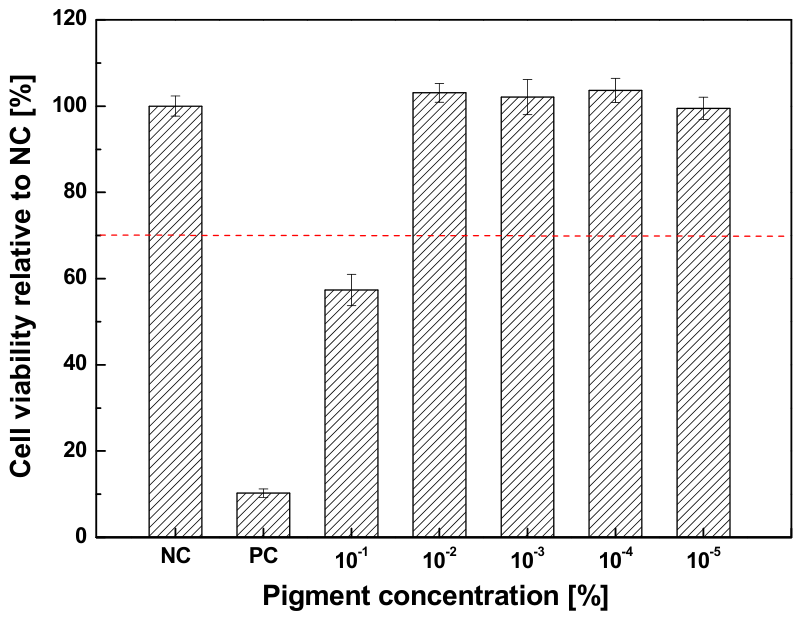
46]. Although this standard is primarily used for medical device evaluation, it also provides a relevant framework for assessing cytotoxicity in other applications where direct skin contact may occur. This approach ensures a high level of safety assessment at an early stage of product development and supports informed decisions regarding the pigment’s suitability for future commercial use. The cytotoxicity analysis of the photochromic pigment in suspension revealed a concentration-dependent effect on cell viability (
Figure 10). The highest tested concentration (0.1%
w/
v) resulted in a reduction of fibroblast viability to 57.36%, which, according to ISO 10993-5 criteria [
46], indicates a cytotoxic response (threshold for cytotoxicity <70% viability relative to control). This suggests that at high concentrations, the pigment suspension may adversely affect cell viability under the applied in vitro conditions. However, the exact mechanism responsible for the observed effect was not investigated in the present study. In contrast, all lower concentrations (ranging from 0.01% to 0.00001%) maintained cell viability at levels comparable to the untreated control (close to 100%), indicating an absence of cytotoxicity. These results indicate that lower pigment concentrations did not induce cytotoxic effects under the applied experimental conditions, whereas higher concentrations should be interpreted with caution.
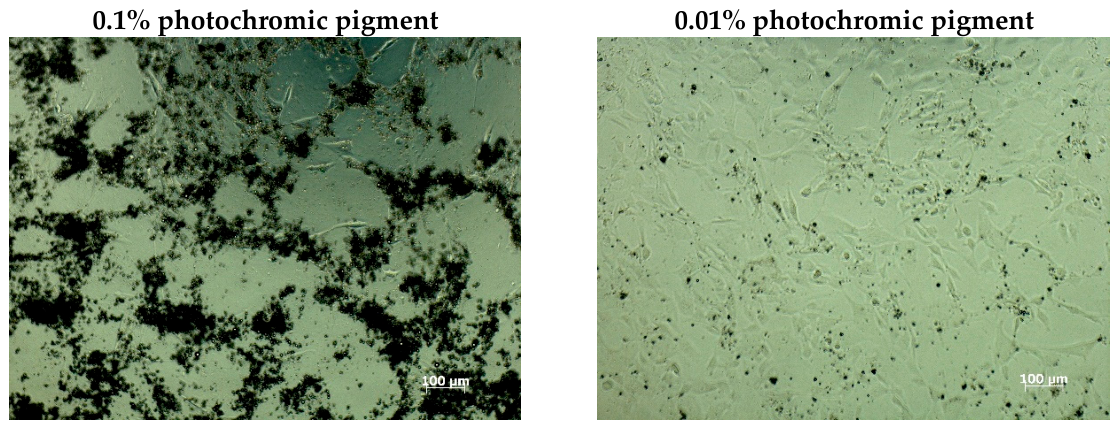
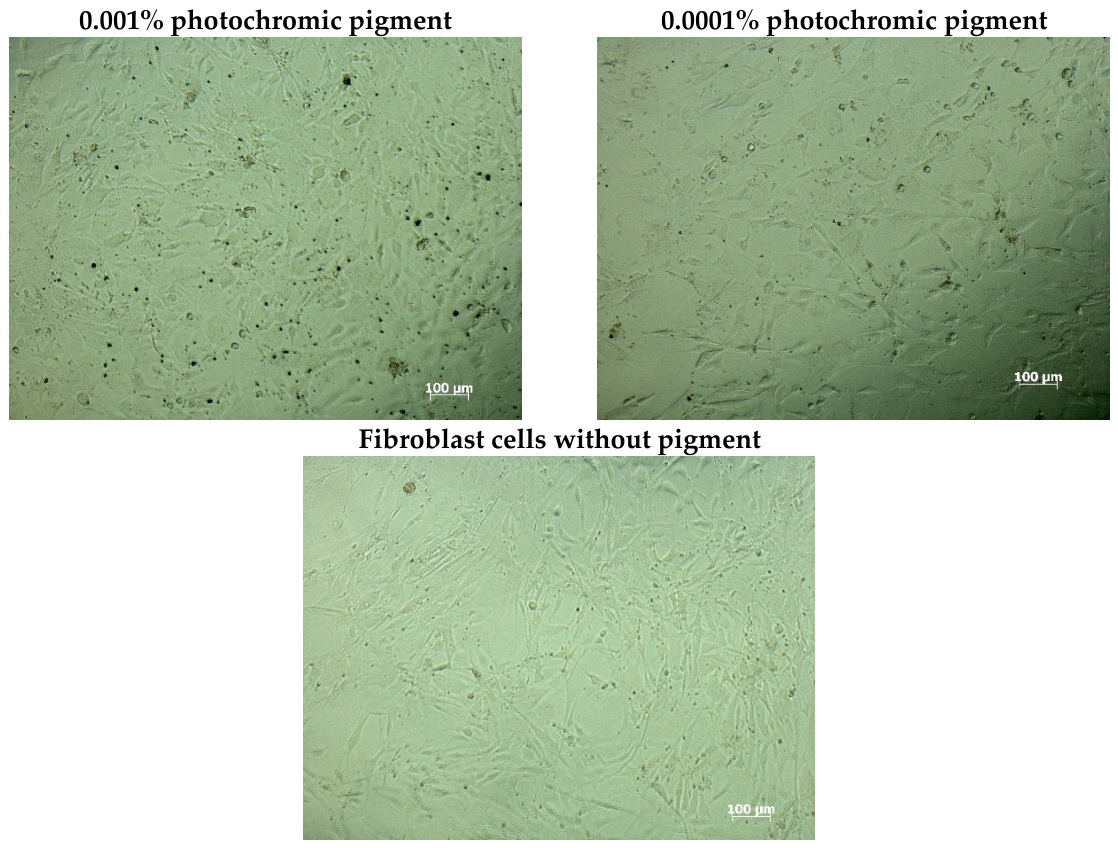
This concentration-dependent behaviour highlights the importance of concentration selection in product development and underlines the need for proper dispersion protocols and formulation strategies to minimise potential cytotoxic effects. Microscopic observations in transmitted light provided additional insight into the behaviour of the pigment in vitro (
Figure 11). At 0.1% concentration, visible pigment particles sedimented onto the bottom of the well, forming a dense layer directly over the cells. These aggregates appeared to physically cover and surround fibroblasts, possibly limiting their access to nutrients or mechanically restricting their ability to proliferate. While fewer cells were present compared to the untreated control, individual cells retained typical morphology, they appeared well-spread and structurally intact, suggesting that the pigment does not induce direct cell lysis but may interfere with cell division at high concentrations. As the pigment concentration decreased, the number and distribution of cells improved, and only sparse pigment particles were observed. The fibroblasts appeared both morphologically healthy and more numerous, indicating the restoration of normal proliferation. These findings indicate that the observed reduction in cell viability at the highest tested concentration may be associated with both direct interactions between the pigment suspension and the cells, as well as physical interactions caused by sedimented particles covering the cell layer. Importantly, exposure conditions corresponding to prolonged direct contact of skin cells with high concentrations of free pigment particles are not expected under realistic use conditions of the printed textile material. In the next stage of the study, the cytotoxic potential of eluates obtained from textile materials was evaluated. The test included eluates from raw wool, wool printed with plain paste (without pigment), and wool printed with the photochromic pigment. Eluates were prepared according to ISO 10993-12 [
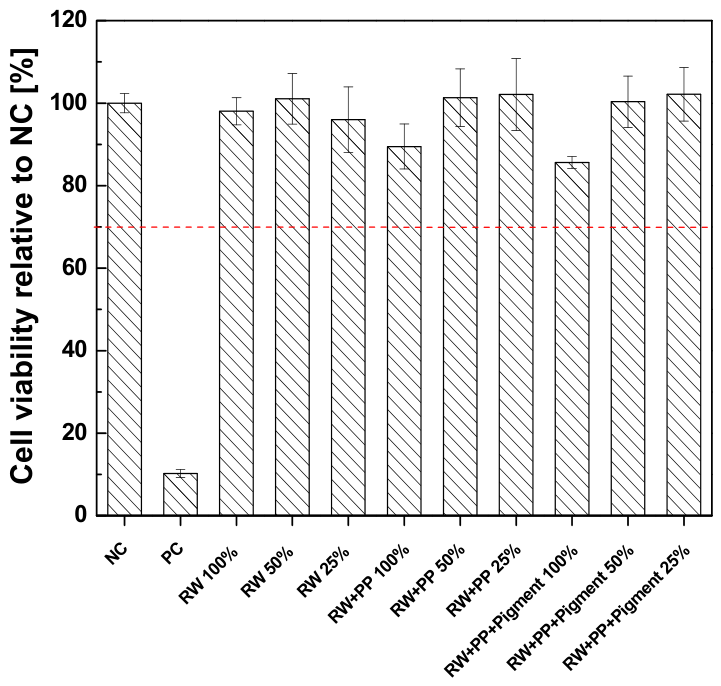
47] and applied to human dermal fibroblasts at 100%, 50%, and 25% concentrations. Culture medium served as the negative control (
Figure 12). Across all samples and dilutions, cell viability remained above the ISO 10993-5 [
46] cytotoxicity threshold of 70%, indicating no cytotoxic effects. Eluates from raw wool showed high biocompatibility, with cell viability values of 98%, 101%, and 96% for 100%, 50%, and 25% eluate concentrations, respectively. Similarly, wool printed with plain paste yielded viability values of 89.5% (100%), 101% (50%), and 102% (25%), suggesting that the printing formulation itself does not adversely affect fibroblast viability.
The eluates from wool printed with photochromic pigment showed slightly reduced viability at the highest concentration (85.6% for 100% eluate), but values at 50% and 25% dilutions were 100% and 102%, respectively, comparable to the control and to the paste-only formulation. This indicates that the presence of the photochromic pigment does not significantly increase cytotoxicity compared to the paste alone, even in undiluted eluates. Taken together, these findings demonstrate that none of the textile samples released cytotoxic substances under the extraction conditions used. The pigment, when incorporated into the textile matrix, did not release biologically relevant amounts of potentially harmful compounds under the applied extraction conditions. Thus, the obtained results suggest limited cytotoxic potential of the printed textile system under the applied experimental conditions. Overall, the results demonstrated a concentration-dependent reduction in cell viability in direct pigment suspension tests, whereas eluates obtained from pigment-printed textiles did not induce cytotoxic effects under the applied extraction conditions. The observed reduction in cell viability at the highest tested concentration may have resulted from both the presence of sedimented pigment particles and direct interactions between the pigment suspension and the cells. Importantly, this concentration represents a stringent in vitro exposure scenario that is not expected under normal conditions of textile use. Furthermore, eluates from pigment-printed textiles did not induce cytotoxic effects at any tested dilution, suggesting limited release of biologically relevant amounts of potentially harmful compounds from the printed material. These findings support the further investigation of the developed printed textile system for applications involving occasional or indirect skin contact.
2.3. Calibration and Dose–Response to UV Radiation of Printed Wool Sensors
Based on the chemical composition analysis, it was determined that the pigments would be applied to the surface of the textile material using the screen printing method. The use of printing paste ensured good binding of the pigment to the textile substrate while maintaining the elasticity and flexibility of the product. Woven wool fabric samples were printed with paste containing photochromic pigment according to the method described in
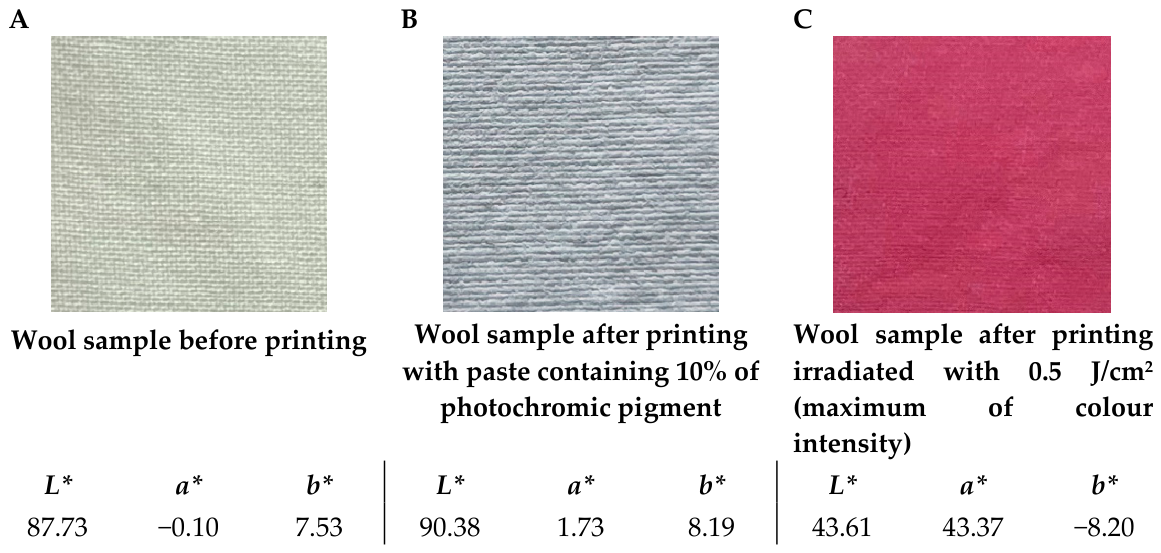
Section 3.3. After drying, the samples coated with the paste layer were less yellow and brighter than the raw wool fabric sample (
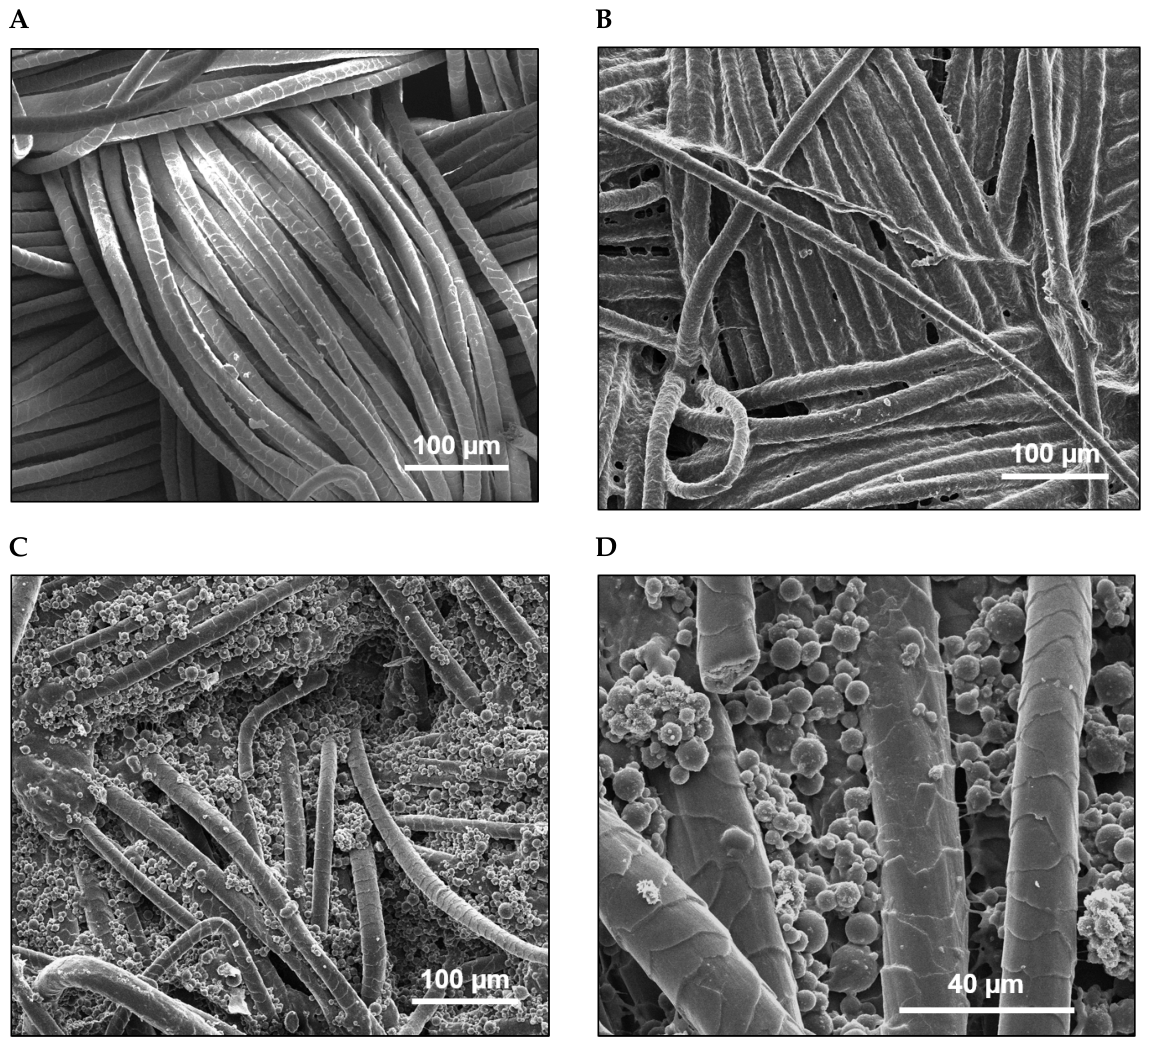
Figure 13A,B). This effect may result from filling the fabric structure with printing paste, which causes a different reflection of light from the surface of the textile product. The addition of pigment may also cause a change in the shade and luminosity of the sample because the photochromic pigment used for printing is a white powder without a distinct colour. As a result of UV irradiation, the white surface of the printed sample changes to an intense pink colour.
Figure 13C shows the maximum intensity of the colour change after exposure to a dose of 0.5 J/cm
2 of UVA radiation. The colour coordinate values in the CIE L*a*b* system are also provided below the sample photographs. Comparing the photographs, it can also be seen that covering the surface of the sample with printing paste changes the visibility of the weave of the wool fabric. Despite the plain weave used in the fabric and the slight difference in the number of threads in both thread systems, it seems that the paste reduces the visibility of the warp threads more. Therefore, the slightly thicker cross-section and less compact structure of the weft threads may cause greater water absorption, which may result in a slightly larger amount of printing paste being deposited on their surface. This aspect was not investigated in the further stages of the presented results because no other structures or textile raw materials were used to develop the printed UV sensor. To check the response of the printed wool samples to UV radiation, three samples were irradiated with a dose of 0.005 J/cm
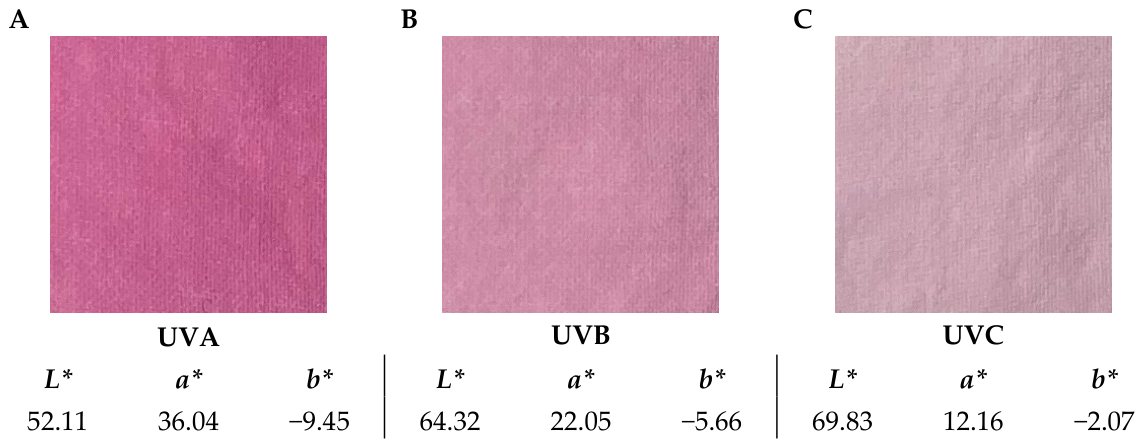
2 using UVA (315–400 nm; peak at 369 nm), UVB (280–360 nm; peak at 306 nm), and UVC (range: 100–280 nm; peak at 253.7 nm) cabinets. Upon UV irradiation, they all changed colours from white to pink, as shown in
Figure 14.
The intensity of the colour depends on the dose and type of UV radiation. Comparing the samples, it can be seen that the greatest change in colour intensity occurs after irradiation of the sample with UVA radiation, which is also confirmed by the obtained results of CIE L*a*b* colour coordinate measurements. Thus, the samples irradiated with UVB and UVC have 23% and 34% lower colour intensity than the sample irradiated with UVA. Based on this observation and the fact that UV radiation reaching the Earth contains about 95% UVA and 5% UVB, only UVA radiation was selected for further studies. The studies also did not include a combination of UVA and UVB radiation to simulate the conditions of sunlight irradiation. Due to the rapid colour reversibility of printed samples after switching off the UV light and inserting them into the second chamber, the measurement uncertainty significantly impacts the obtained results. In the next step, the samples were irradiated with UVA radiation in the range of up to 0.5 J/cm
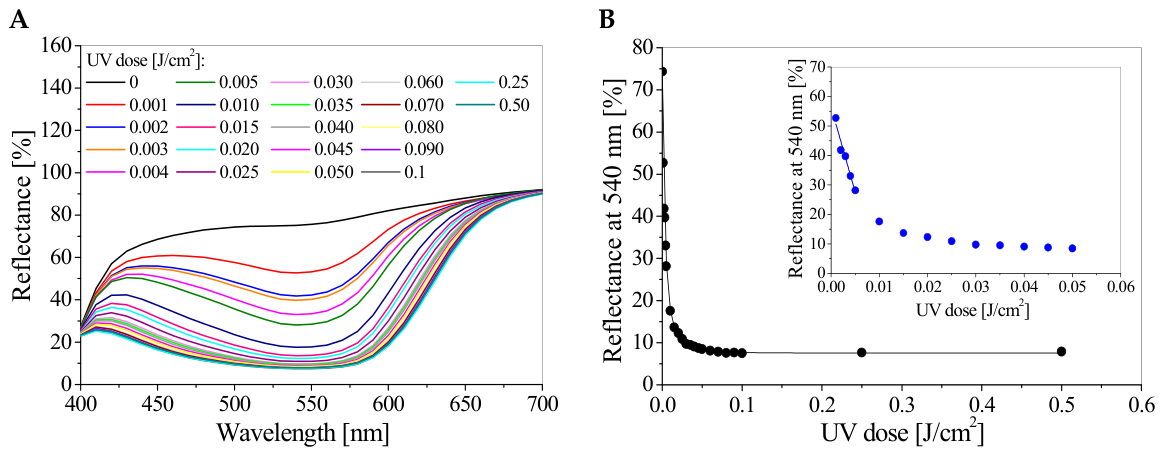
2. For each sample, light reflectance was measured using a wavelength range of 400–700 nm (
Figure 15A). The pink colour intensity of the sample increases with the radiation dose. The reflectance of the light decreases with the absorbed dose in the wavelength range of 500–600 nm, with a maximum at 540 nm. Thus, the calibration relationship in the dose range of 0.001–0.5 J/cm
2 was determined and is presented in
Figure 15B. The intensity of the pink colour reaches a plateau above 0.05 J/cm
2. In the dose range of 0.1–0.5 J/cm
2, no significant changes in reflectance were observed, indicating that saturation of the colour occurred. In addition, to characterise the response of printed wool samples to a UVA radiation dose, an equation describing the obtained calibration curve in the range of dynamic and linear dose–responses was determined. Dose–response equation with fitted curves for dynamic range of the UVA radiation dose ranges: y = 7.55 + 42.87e
−x/4.48×10−3 + 14.73e
−x/4.64×10−4 + 9.21e
−x/0.02 (R
2 = 0.998); linear range: y = −5783x + 56.42 (R
2 = 0.945). Based on the above equations, the sensor parameters were characterised. The dynamic dose range of the printed sensors covers the region from 0.001 to 0.1 J/cm
2, above which the system reaches a saturation plateau and no further colour changes occur. The sensor’s dose sensitivity corresponds directly to the slope of the linear regression curve. In the narrow linear range (up to 0.01 J/cm
2), the sensor exhibits high dose sensitivity of −5783 ± 694%· cm
2/J (
p-value < 0.01) indicating a rapid decrease in reflectance at 540 nm per unit UVA dose. For the broader dynamic dose range (up to 0.1 J/cm
2), the sensor’s response becomes non-linear and transitions into a saturation plateau, which is accurately described by the third-order exponential decay equation (adjusted R
2 = 0.9980, reduced χ
2 = 0.6357). The obtained results show that the developed printed sensors are capable of measuring the UVA radiation dose in the range of up to 0.1 J/cm
2. The biggest problem in measuring the light reflectance of developed sensors is the time of holding the information about the absorbed radiation dose. Immediately after the end of irradiation, the obtained colour intensity of the sensor begins to decrease. In the case of other sensors based on textiles and radiation-sensitive precursors such as NBT, TTC, LCV, or LMG, the linear response to UVA and UVB radiation doses and the measurement range of these systems, depending on the development methods and concentration, are up to 0.1 and 1 J/cm
2, respectively [
25,
26,
27,
28]. However, it should be emphasised that these systems are not reversible, and their selection and potential applications strictly depend on their sensitivity to the UV range and postradiation stability. Comparing the obtained results with other textile-based photochromic sensors poses a significant challenge due to the wide range of photochromic compounds used, differing in chemical structure and kinetic properties. The method of manufacturing such sensors and the textile substrate used can also lead to erroneous conclusions. It is worth emphasising that, although the general mechanism of this class of compounds’ response to UV radiation and visible light is known, commercially available solutions do not provide quantitative research results regarding their interaction with UVA and UVB radiation. Furthermore, no results were found regarding the pigment identified in this study, including the assessment of uniformity and the potential application of such modifications for monitoring two-dimensional UV radiation dose distribution.
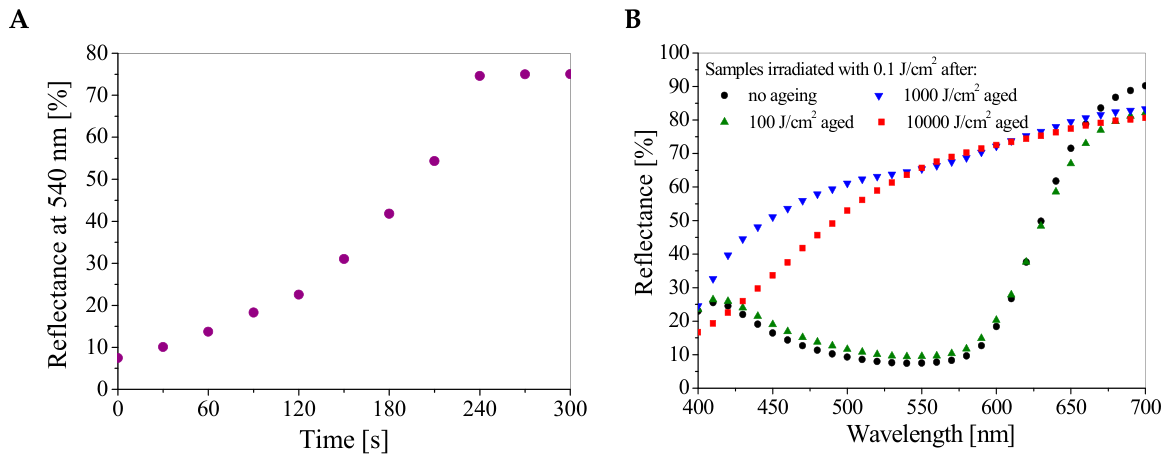
Figure 16A presents the change in light reflectance for the irradiated sample within five minutes after the end of irradiation with a dose of 0.5 J/cm
2.
The obtained results show that the sample, after reaching maximum colour saturation, returns to white within four minutes. It has been shown that radiation-aged samples change their spectral characteristics. Increasing the radiation dose does not extend the time of retaining information about the colour intensity of the sample. Immediately after the irradiation process ends, the colour begins to bleach. The effect of sample ageing on the ability to continue irradiation and sensor stability was also examined. For this purpose, the samples were irradiated with high doses of UVA radiation above the saturation dose (100, 1000, and 10,000 J/cm
2). After ageing, the samples were additionally irradiated with a dose of 0.1 J/cm
2 to verify their continued functionality. Long-term exposure to UV radiation reduces the performance of the developed sensors, which results from the destruction of the chemical structure of photochromic pigment. For the sample aged with 100 J/cm
2, after further irradiation with a dose of 0.1 J/cm
2, a difference in the reflectance spectrum is visible, which is about 26% compared to the unaged sample (
Figure 16B). In the case of samples aged with 1000 and 10,000 J/cm
2, further irradiation was not possible because the samples were destroyed.
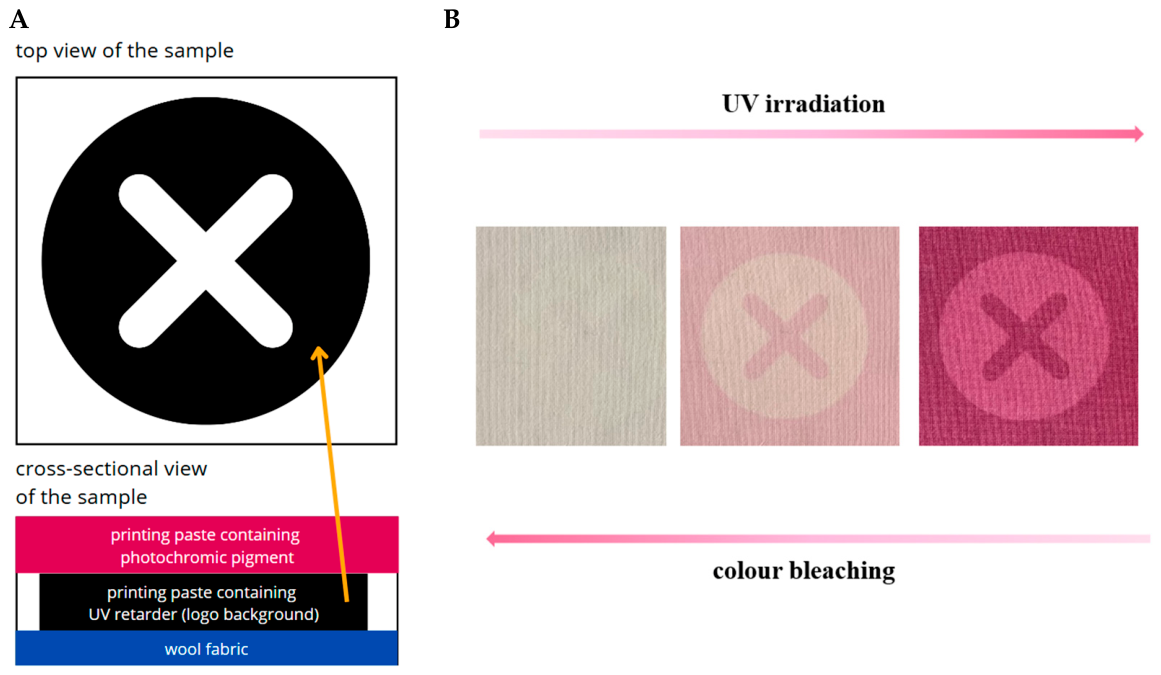
To slow down the colour reaction during irradiation, samples containing the UVA retarder Rayosan
® C were also prepared, which was used to partially print the surface of the samples.
Figure 17 shows the effect obtained after irradiating the samples with a dose of 0.5 J/cm
2, necessary to obtain the maximum intensity of the sample. Unfortunately, this procedure did not affect the sample bleaching time after the irradiation process was completed.
Similar to samples without an additional printing layer containing a UV retarder, the sample turned white within five minutes after the end of irradiation. However, the obtained results may be intriguing from the point of view of designing sensors protecting textile products against counterfeiting. Using different concentrations of UV retarder, it is possible to produce printed areas with varying dose sensitivity.
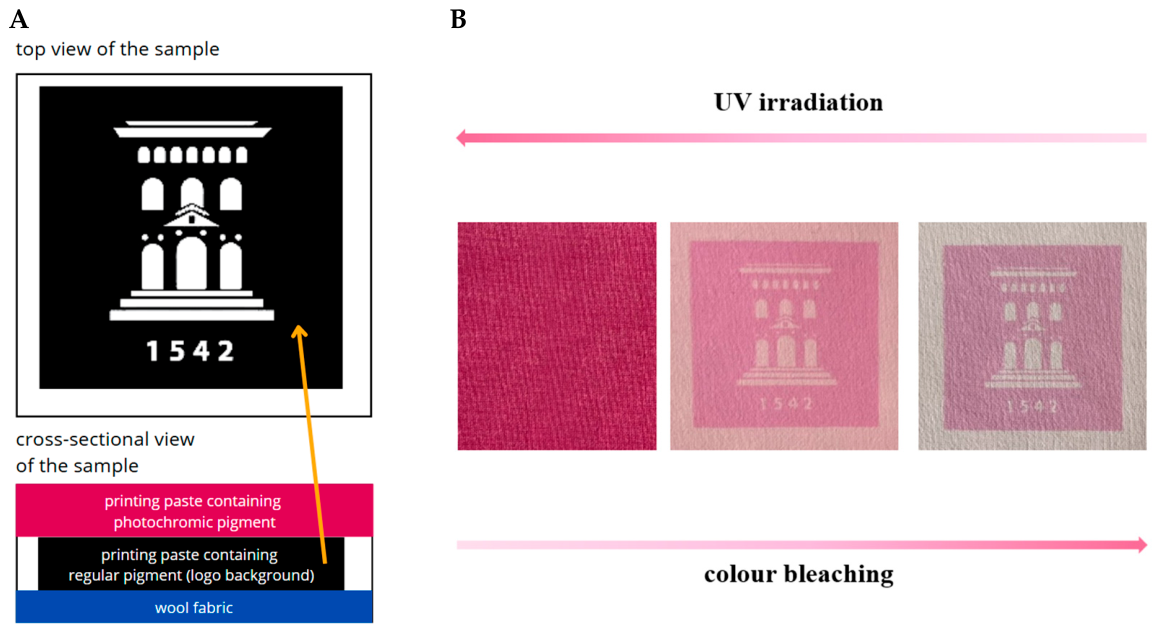
Figure 18 also presents the possibility of using photochromic pigment printing to cover patterns made using standard pigments for printing on the surface of textile products. Appropriate selection of the colour of the print made with the standard pigment and the colour intensity of the photochromic pigment layer after exposure to a specified dose of radiation results in complete coverage of the pattern. A properly designed pattern, in addition to providing information about the absorbed dose, can also act as a hidden security feature for textile or paper products. Such security sensors are not very popular in the textile production sector but are known for securing banknotes, papers, and packaging, e.g., medicines.
2.4. Measurement of UV Radiation Dose Distribution
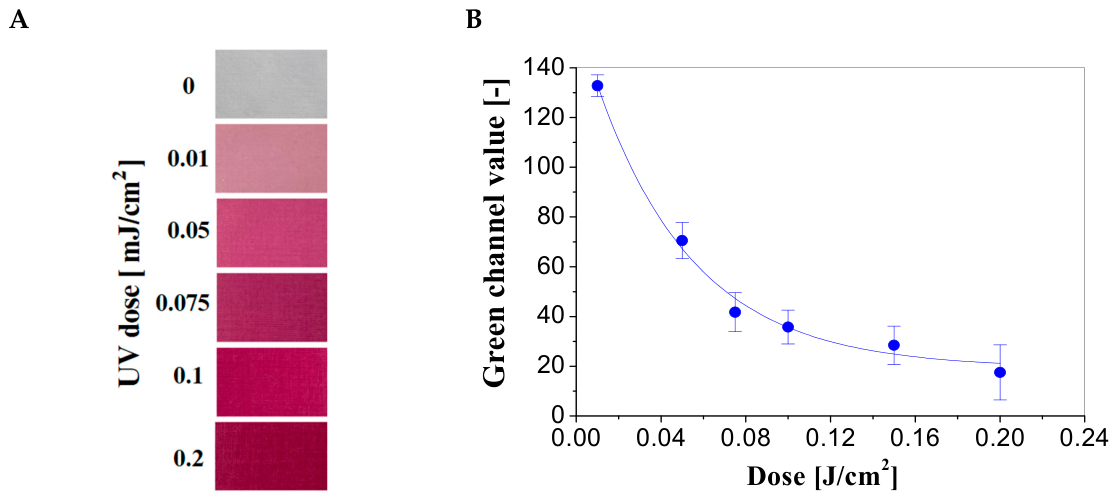
To analyse the possibility of measuring the UVA dose distribution of the developed sensor, calibration samples were prepared, irradiated in the range of 0–0.5 J/cm
2 and scanned using a flatbed scanner. Images of irradiated wool fabric samples after scanning are shown in
Figure 19A. The visible structure of the fabric impacts the scanning of the samples, which was analysed in previous studies [
29,
48]. It is known that the parameters characterising the developed dosimeters for UV radiation measurements are greatly influenced by, among others, the type of raw material, fabric weave, scanner control software settings, scanning resolution, and data averaging after scanning.
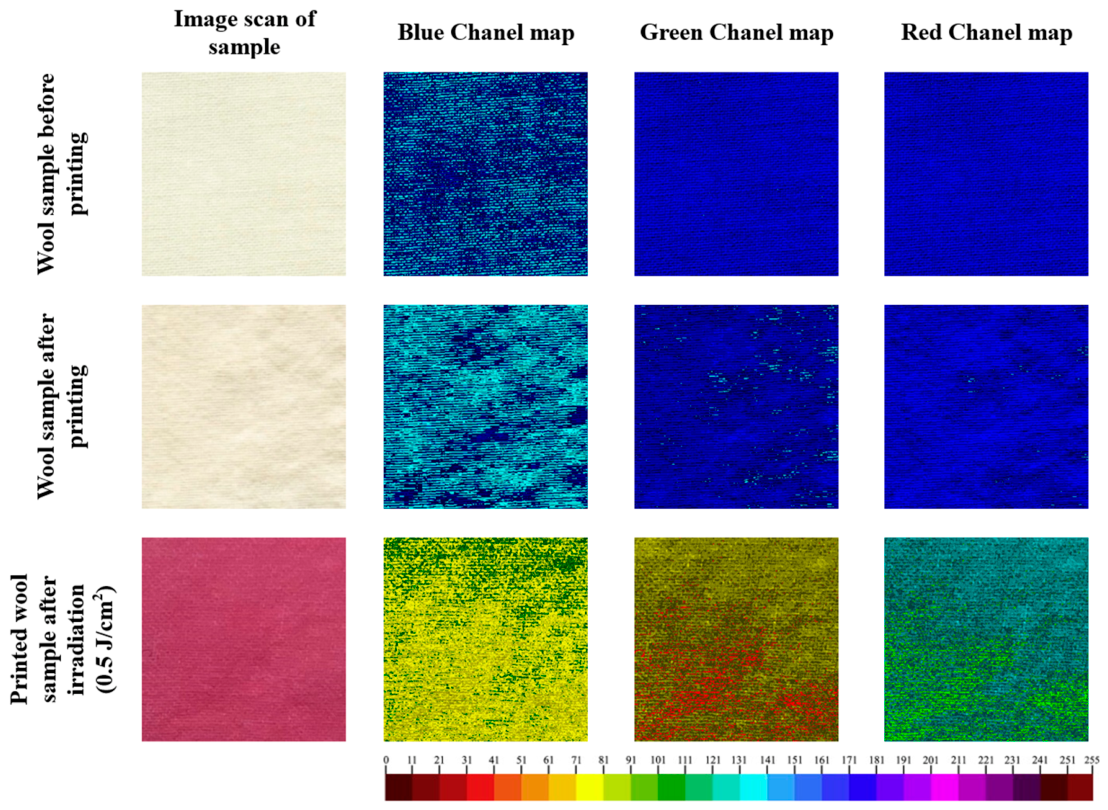
To improve the quality of the obtained image, the samples were scanned at 75 dpi, and no sharpening or colour adjustment filters were applied. The sample images after scanning were decomposed into colour channels in the RGB colour model. Based on the comparison of the values from the red, green, and blue channels, it was decided that the green channel should be selected for further analysis. The calibration sample images (green channel) were prepared for the following settings of image processing: kernel size: 3 mm, kernel mode: 2D, iterations: 2, mean filter. A calibration relation between the values of the green channel of the RGB colour model and the absorbed dose was prepared, which is presented in
Figure 19B. Each measurement point in
Figure 19B is the average value from the image of the entire sample, an area of 7000–10,000 points with standard deviation bars marked. Thus, the calibration equation of second-order exponential decay was determined: y = 6.06e
−x/49.72 + 2.31e
−x/44.09 + 18.08 (R
2 = 0.982). Analysing the response of the developed 2D sensor, the following conclusions can be drawn: (i) the dynamic dose–response is up to about 0.2 J/cm
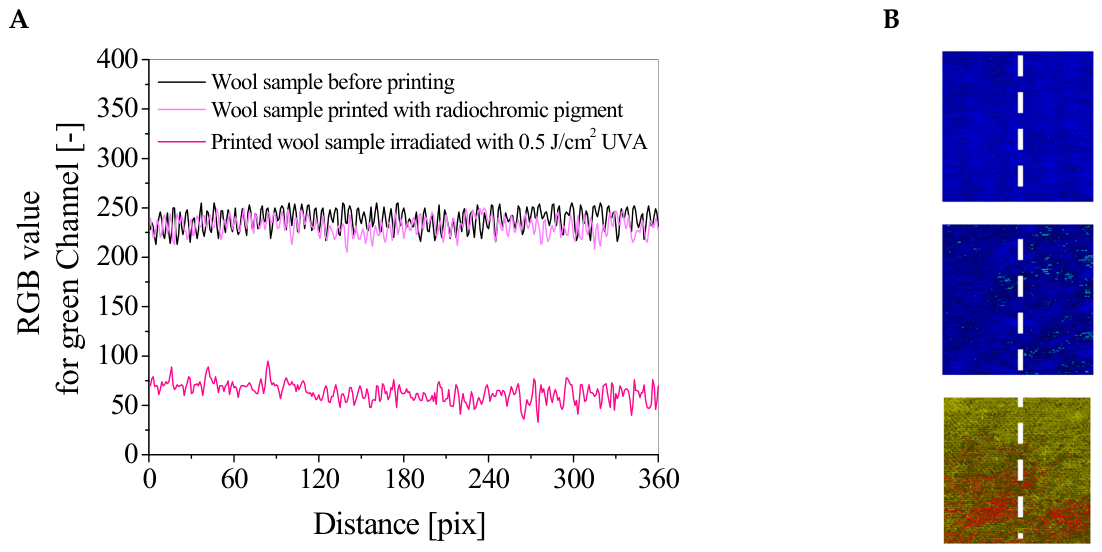
2, (ii) the decrease in the green channel value as a function of the absorbed dose can be described by the calibration equation, (iii) the dose sensitivity decreases with increasing pink colour intensity. Samples of sensors printed with photochromic dye are stable. However, the biggest disadvantage is their dynamic loss of dose information. Selecting conditions that slow down the photochromic reaction would also allow the use of the developed sensors for monitoring the dose distribution over a longer period of time, which was not assessed in this study. In the next step, the scanned image of the non-homogeneously irradiated sample (0.5 J/cm
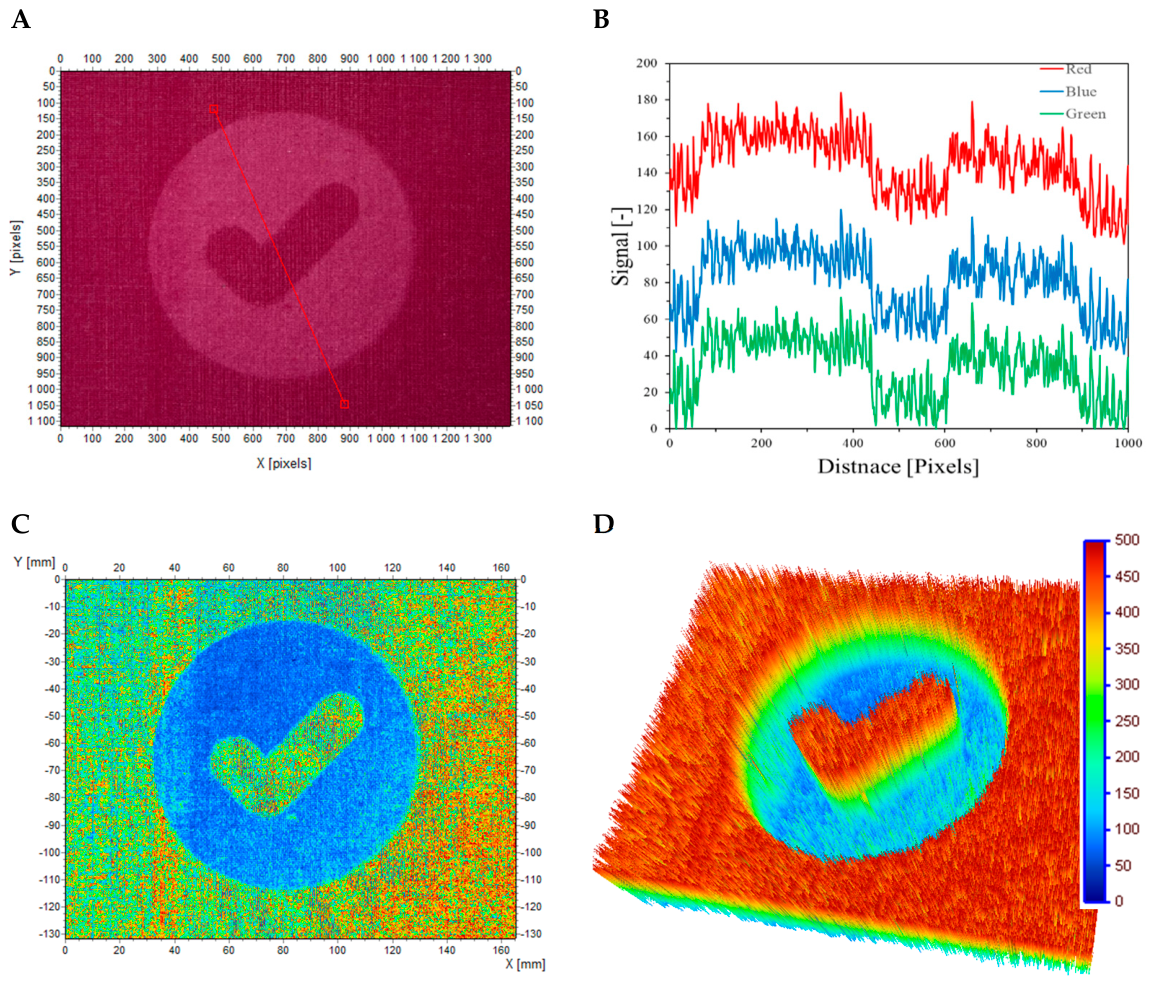
2) was converted into RGB channels, and the green channel values were converted into dose values after applying the calibration relationship (
Figure 20A,B). As a result of this operation, a two-dimensional dose distribution map of UVA radiation was produced, as shown in
Figure 20C,D. The obtained results show that the maximum recorded radiation dose is about 0.5 J/cm
2. The obtained results match the actual dose emitted by the UV radiator used in the study and confirm the possibility of using the printed wool sensor for radiation measurements.
2.6. Application Possibilities
Due to the dynamic pace of textile development, the solution proposed in this article, using photochromic pigments, can be a functional element of a wide range of technical, decorative, and personal products. The use of innovative solutions and the selection of materials are key to balancing the textile industry and attracting the attention of average users to the opportunity to invest in more interesting and durable products. In light of the new regulations regarding so-called “textile passports,” it is also important to provide information about the chemicals used to modify products. In the case of commercially available dyes and pigments, it is sometimes difficult to determine the origin and chemical structure of the compounds used in their production. Information provided by manufacturers or sales agents does not always provide complete information on the chemical structure of the compounds and is often inconsistent, for example, due to changes in trade names and the interchangeable use of the terms “dye” and “pigment” [
2,
3,
4,
12,
49,
50,
51]. Dyes and pigments are essentially chemical colouring substances, but they differ in chemical structure, solubility, binding mechanism, and application possibilities. In the case of pigments, bath dyeing methods cannot be used because pigments are chemical compounds, usually inorganic, that do not dissolve in water or common solvents. They are typically produced in dispersions, which are used to colour polymers by volume, for example, in the production of dyed polyester fibres or in textile printing processes. Therefore, modifying the surface of textile products requires a medium that binds the pigment to the fibre. Two-component printing pastes are typically used for this purpose, consisting of a thickener and a binder, which are mixed with water in the appropriate proportion. After printing, drying and annealing are necessary to polymerise the print paste, which permanently bonds the pigment to the printed textile product. This type of textile surface finish is faster and easier to prepare. At the same time, selecting the right printing pastes ensures excellent pigment bonding with any textile substrate. A properly prepared sample also ensures separation of the functional layer from environmental factors and limits skin contact, for example, when such a component is used as protective clothing [
23]. When using such printed sensors as components in clothing construction, selecting the appropriate paste is crucial, as it will ensure the durability of the functional finish throughout the product’s life cycle. In this study, the selection of printing paste components (Lutexal Hit and Helizarin Binder) was dictated by their established position as industry standards, known for ensuring high durability and flexibility of prints. These pastes, combined with other UV-sensitive compounds, have already been tested for resistance, including washing, as documented in previous studies [
52,
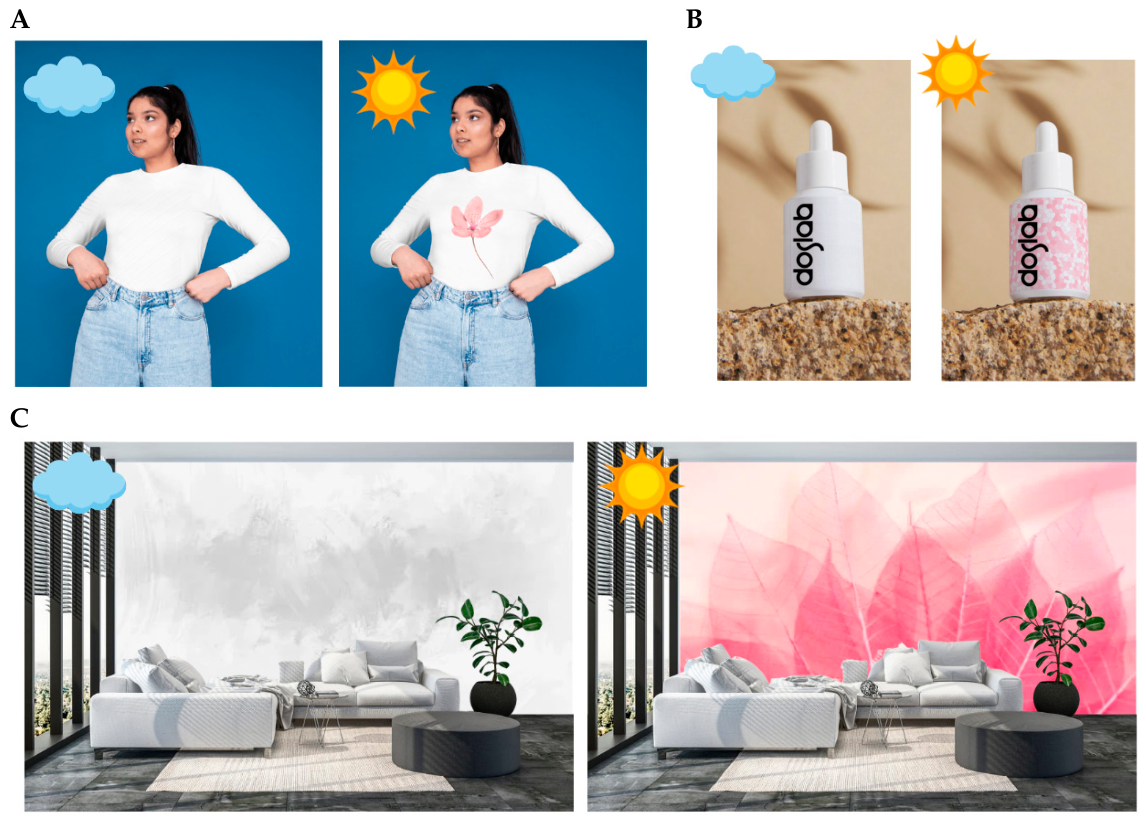
53]. The printing paste used was shown to have good adhesion to various fibres, including cellulose and polyamide, and to be wash-resistant for up to 50 cycles. Naturally, such materials should also be tested for their resistance to ageing, washing, and abrasion, but due to the complexity of these issues, they were not addressed in this work. With the appropriate selection of printing paste, it is also possible to print such sensors on other substrates, such as foils or paper, allowing for product marking in the packaging industry as well. Example applications of the developed sensors based on photochromic pigments are shown in
Figure 25. Furthermore, such solutions can also be part of overt and covert security systems, which can be used to protect various products, including textiles and packaging, against counterfeiting. Thanks to the ability to monitor doses and two-dimensional UV radiation distribution, the developed sensors can also act as indicators of ageing or improper storage of products. Therefore, the possible applications could be much broader and include the production of personal protection sensors or structural components, including composites.




 ,
,