Article

An Exploratory Analysis of Transcriptional Responses to Peanut Exposure in Drosophila melanogaster


1
Department of Biology, University of Nebraska at Kearney, Kearney, NE 68849, USA
2
Department of Genetics, Cell Biology and Anatomy, University of Nebraska Medical Center, Omaha, NE 68198, USA
*
Author to whom correspondence should be addressed.
These authors contributed equally to this work.
Int. J. Mol. Sci. 2026, 27(10), 4545; https://doi.org/10.3390/ijms27104545
Submission received: 9 April 2026 / Revised: 7 May 2026 / Accepted: 16 May 2026 / Published: 19 May 2026
(This article belongs to the Special Issue Drosophila: A Versatile Model in Biology and Medicine—3rd Edition)

Abstract

Much remains to be learned about how the innate immune system responds following exposure to food allergens, such as peanut. Drosophila melanogaster is an untapped model system for examining this topic because of its conserved innate immune pathways, although it lacks adaptive immunity. The objective of this study was to determine if innate immune-regulated genes within the D. melanogaster genome were transcriptionally regulated by exposure to peanut. RNA samples were analyzed by qRT-PCR and next-generation sequencing. qRT-PCR data shows a significant downregulation of Dorsal and Relish at day 24. Next-generation sequencing data identified a limited number of differentially expressed genes at days 15 and 30, including those involved in structural, metabolic, and digestive functions. Taken together, our data suggests modest and limited transcriptional changes associated with peanut exposure. This study provides an initial framework for investigating how food allergens, such as peanut, likely influence innate immune-associated gene expression.

1. Introduction

Food allergies represent a growing global health challenge, with peanut allergy among the most severe and persistent forms of food hypersensitivity. In the United States, peanut allergies affect nearly six million children and adults and remain a leading cause of fatal food-induced anaphylaxis [1]. The prevalence of food allergies appears to be increasing in recent decades. However, evidence that supports an increased frequency remains incomplete due to the high cost and potential risks of conducting oral food challenges in large populations; instead, most rely on self-reporting or parental reporting [2]. Studies that do utilize oral food challenges estimate prevalence between 5 and 10% in Westernized regions, with peanut being among the most common allergens in older children (>5 years) [3]. This increasing prevalence could reflect multiple converging factors, including changes in diet, specifically outdated guidance to avoid peanuts in infancy, environmental exposures, and immune dysregulation. To date, the underlying mechanisms of allergic sensitization remain incompletely understood [4]. Current clinical approaches, including strict allergen avoidance and emergency epinephrine, are reactive rather than preventive and do not address the molecular pathways that initiate or perpetuate allergic disease [2]. As the incidence of food allergies continues to rise, there is a pressing need for model systems capable of dissecting the innate immune components that shape early responses to dietary allergens. Traditional mammalian models, especially mice, have provided insights into IgE-mediated hypersensitivity. Nevertheless, their use is limited by experimental constraints associated with oral sensitization, inhalation sensitization, and adaptive immunity, which can obscure the analysis of early innate signaling events [5,6]. D. melanogaster is particularly well suited to innate immunity investigation, due to the conserved nature of its immune pathways and lack of adaptive immunity [7,8]. Many human disease-related genes have clear homologs in Drosophila, and functional parallels between fly and mammalian immunity are well documented [9].
Innate immunity in D. melanogaster is mediated primarily by two Nuclear Factor-kappa B (NF-κB)-associated pathways: the Toll pathway and the Immune Deficiency (Imd) pathway. The Toll pathway is activated in response to fungi and Gram-positive bacteria and is structurally homologous to mammalian Toll-like receptor (TLR) signaling [9,10]. Upon activation, the inhibitory protein, Cactus (Cact), which is homologous to mammalian Inhibitor of kappa B (IκB), is degraded, allowing nuclear translocation of the NF-κB transcription factors, Dorsal (Dl) and Dorsal-related immunity factor (Dif), leading to the transcription of antimicrobial peptide (AMP) genes drosomycin (Drs) and immune induced molecule 1 (IM1) [11,12]. The Imd pathway responds mainly to Gram-negative bacteria and is homologous to mammalian Tumor Necrosis Factor (TNF) receptor signaling [13,14]. When activated, the NF-κB factor Relish (Rel) is proteolytically cleaved, allowing for transcription of AMP genes Diptericin (Dpt) and AttacinA (AttA) [12].
Emerging evidence suggests that allergens, much like microorganisms, can activate or modulate the innate immune pathways. A previous study demonstrated that Dermatophagoides pteronyssinus allergen 1 (Der p 1), the major allergen of the house dust mite, triggers activation of the Imd pathway via Rel and peptidoglycan recognition protein LC (PGRP-LC) [15]. This study established that allergens can act as immune stimuli in Drosophila. However, current research focuses largely on AMP induction rather than upstream regulators, such as Dl, Dif, Cact, or Rel, thus leaving gaps in our understanding of allergens’ influence on early innate immune signaling.
In mammals, peanut allergens are known to engage C-type lectin receptors (CLRs) and other innate components that lead to downstream inflammatory responses, thus suggesting the possibility that similar events occur in D. melanogaster [16]. Specifically, the degree to which TLRs play a role in driving the development of allergic responses to peanut remains unclear. Prior to this study, the interaction between food allergens and immune pathways in Drosophila had never been examined, specifically upstream immune regulators such as Dl, Dif, Cact, and Rel. Therefore, the present study aims to determine whether exposure to peanut induces measurable changes in innate immune gene expression in D. melanogaster. Because D. melanogaster lacks adaptive immunity, it cannot model a classical allergic reaction. Instead, it provides an opportunity to investigate how dietary allergens, such as peanut, may influence transcriptional changes in innate immune-associated genes and pathways.

2. Results

2.1. Survival Analysis

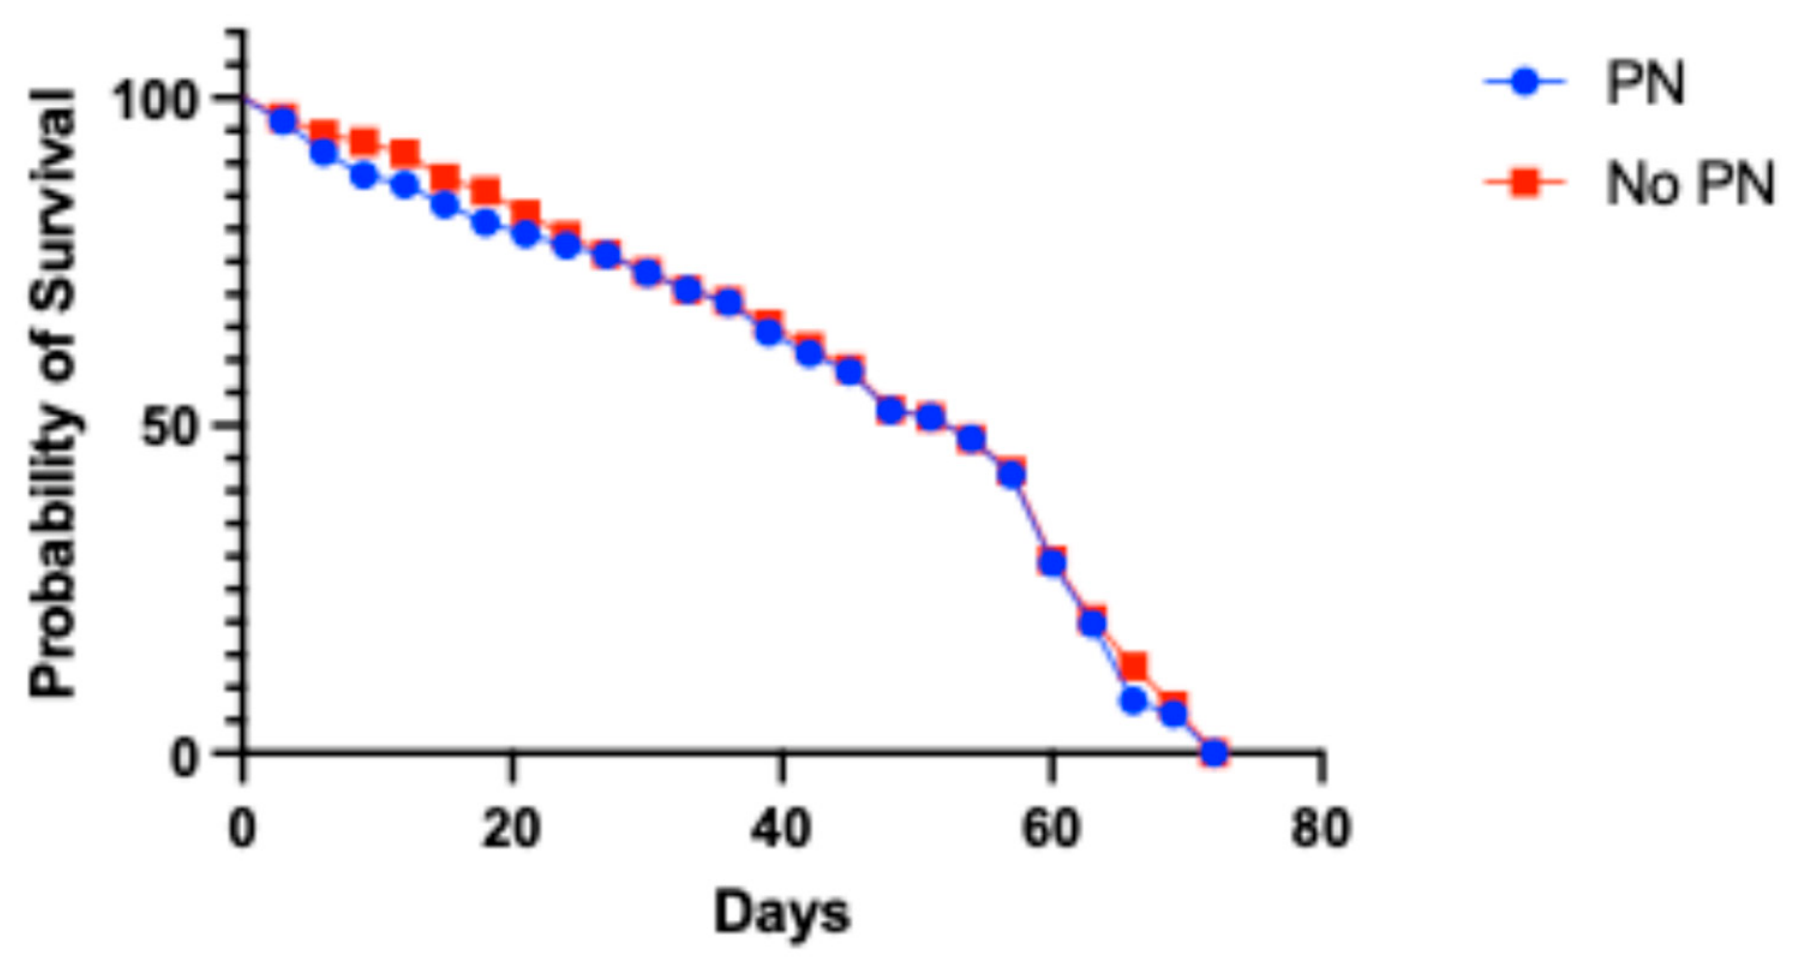
The Kaplan–Meier survival analysis using a log-rank Mantel–Cox test showed no significant difference in the longevity between the peanut (PN)-exposed and no PN-exposed groups (p = 0.4354). The median survival for both groups was 54 days (Figure 1).

2.2. Gene Expression of PN-Exposed Versus No PN-Exposed Controls

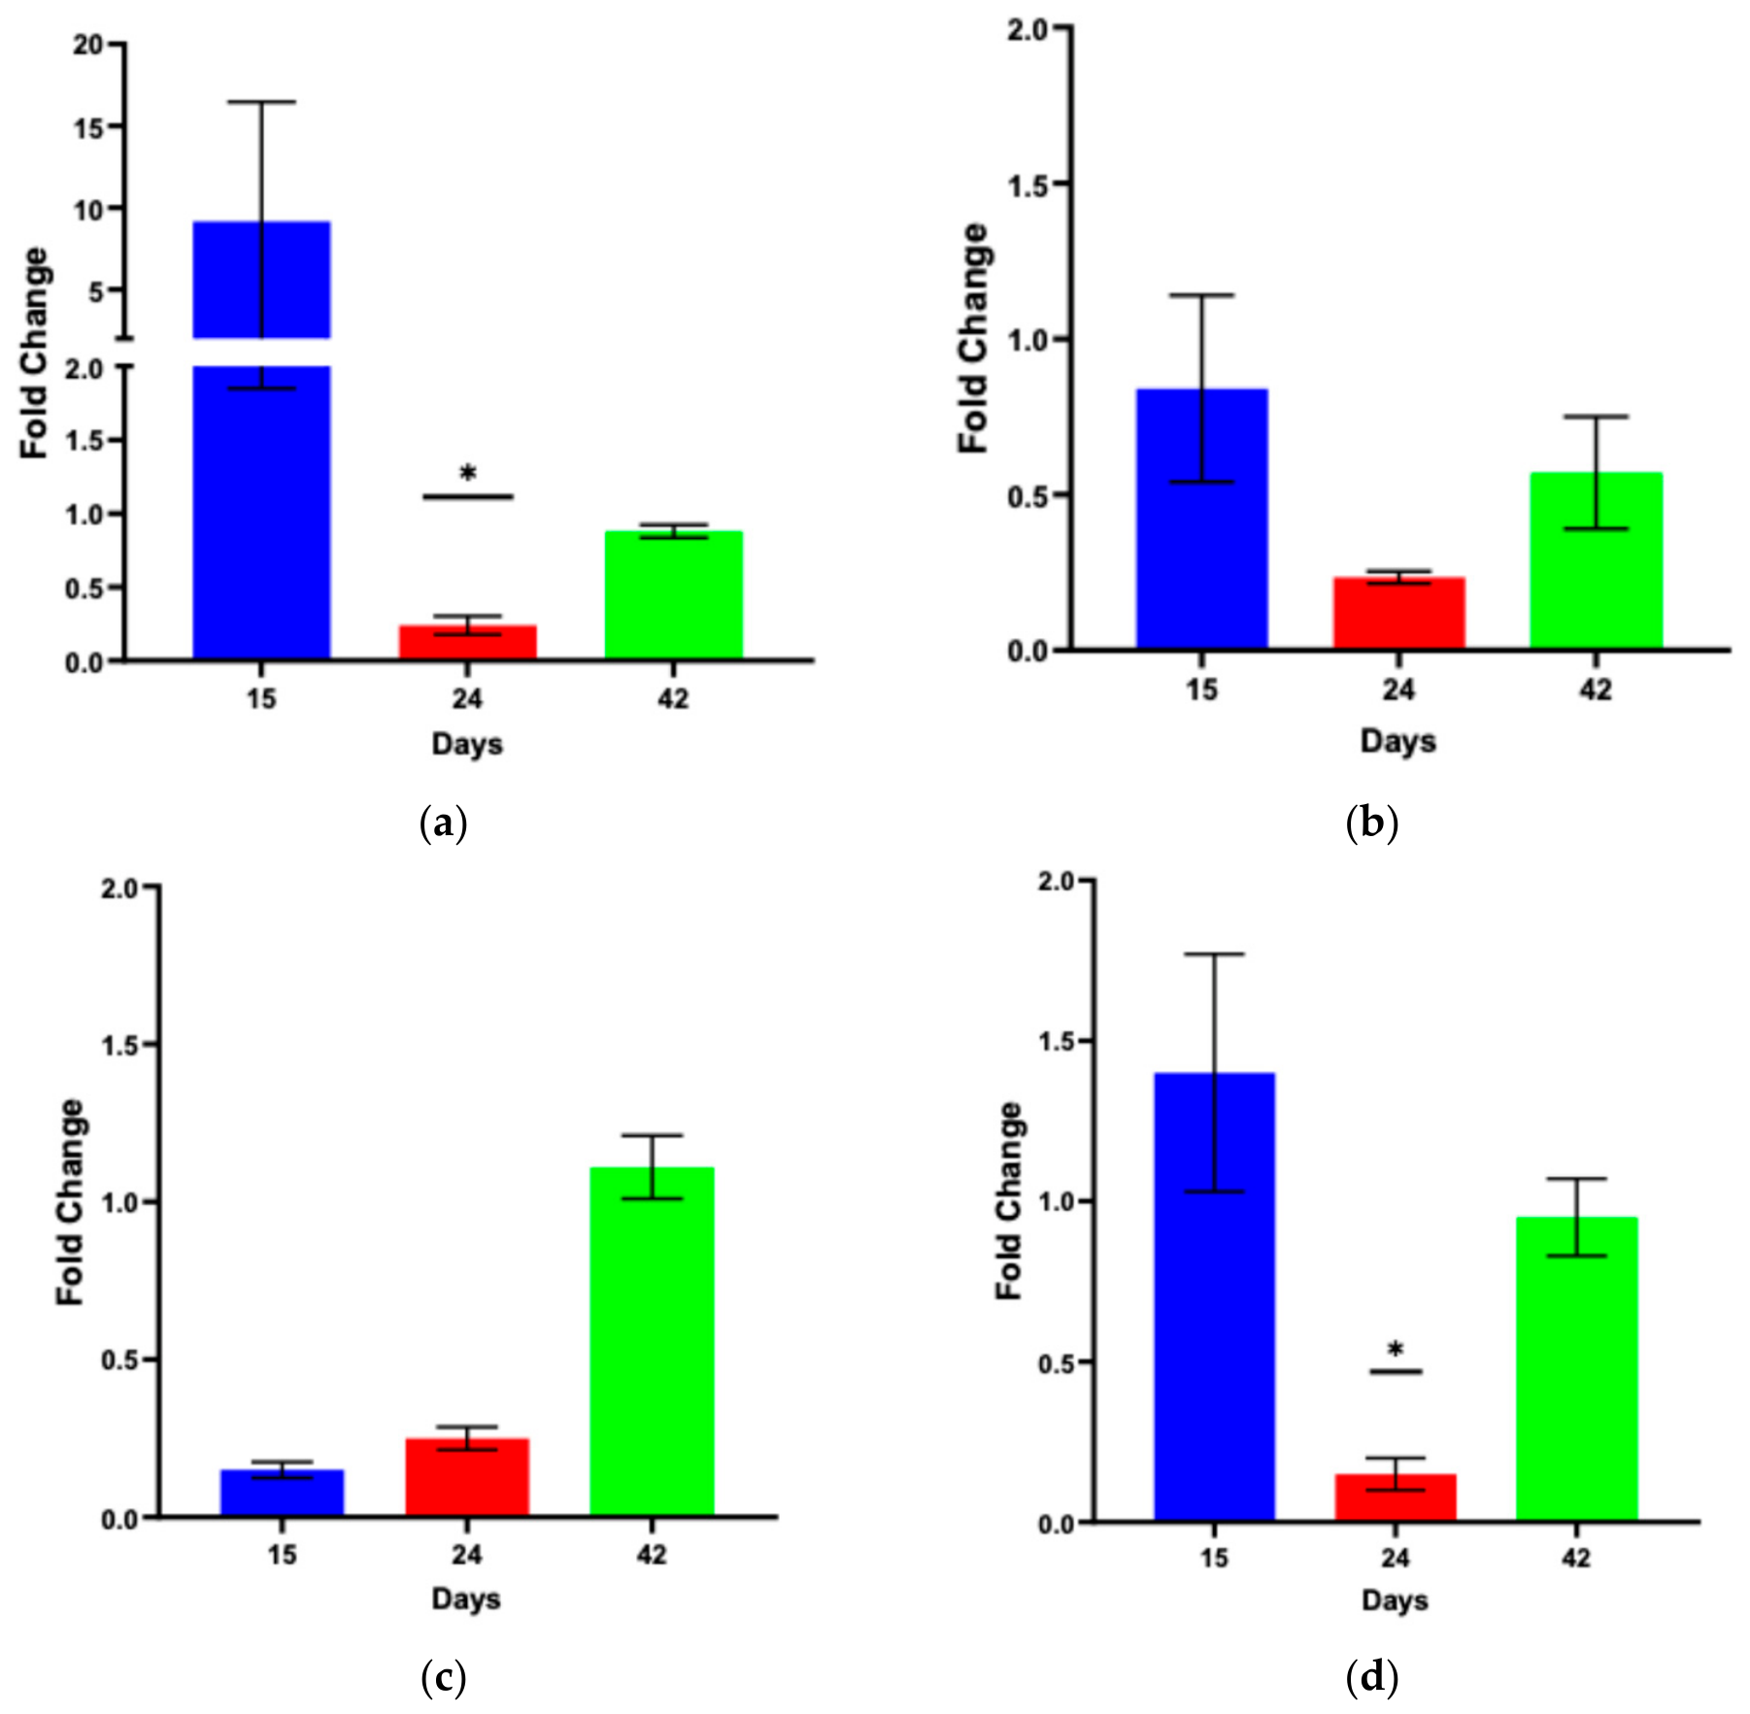
Quantitative RT-PCR was used to determine relative gene expression at three time points (days 15, 24, and 42). Analysis of age-matched treatment and control groups revealed a significant downregulation of both Dl and Rel at day 24 (p = 0.045; p = 0.016, respectively; Figure 2). All other time points and gene expressions showed no significant differences (Figure 2).
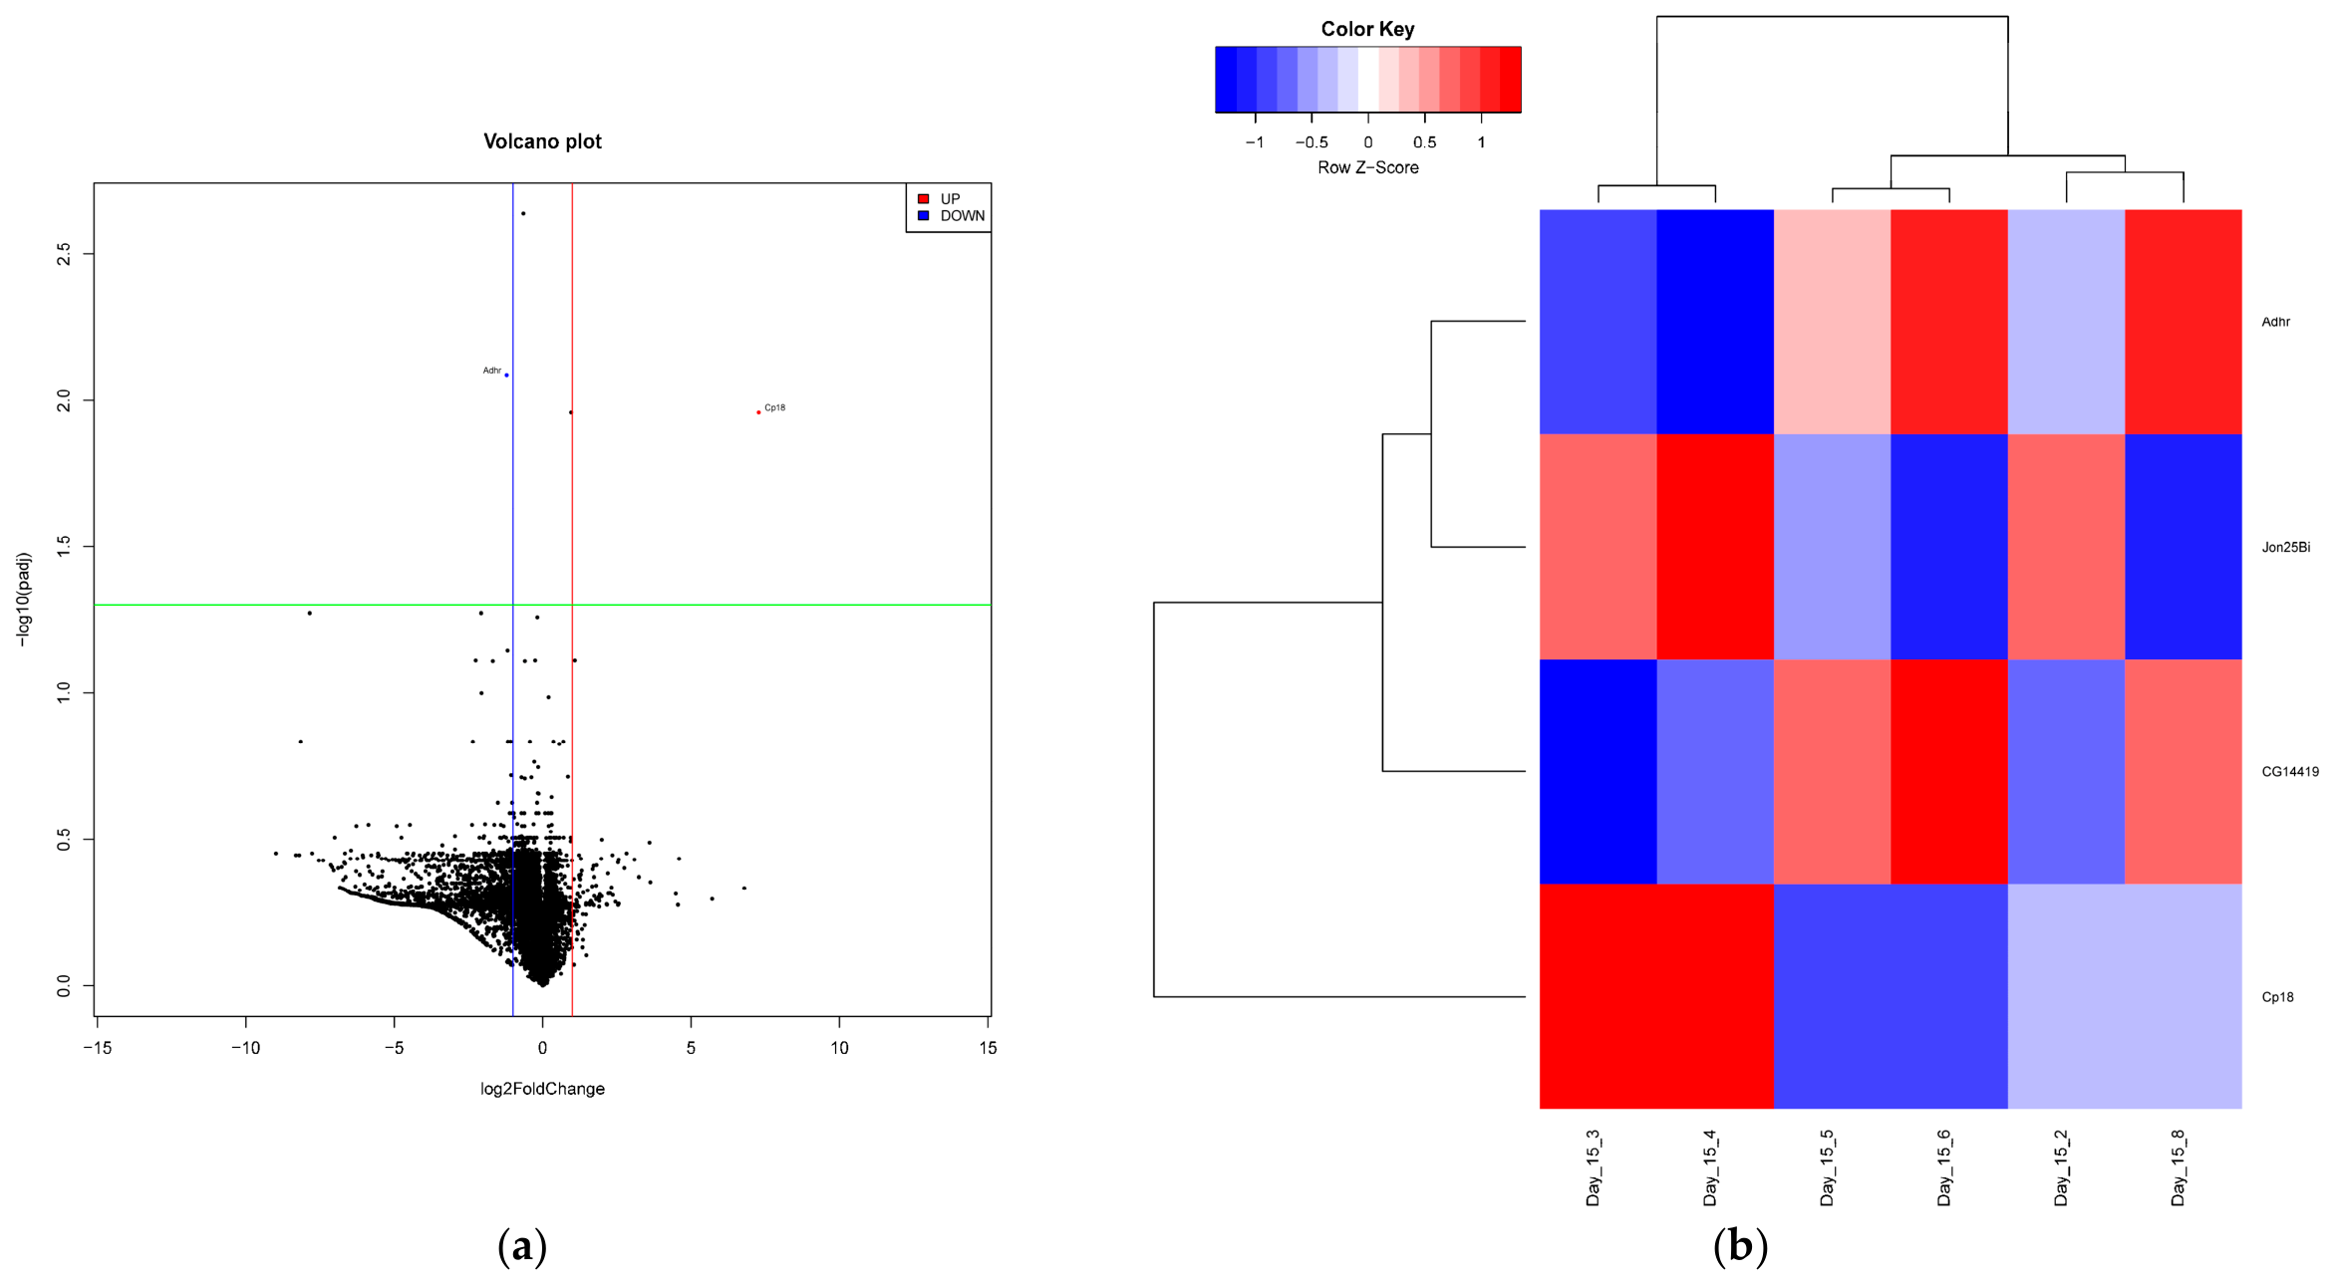
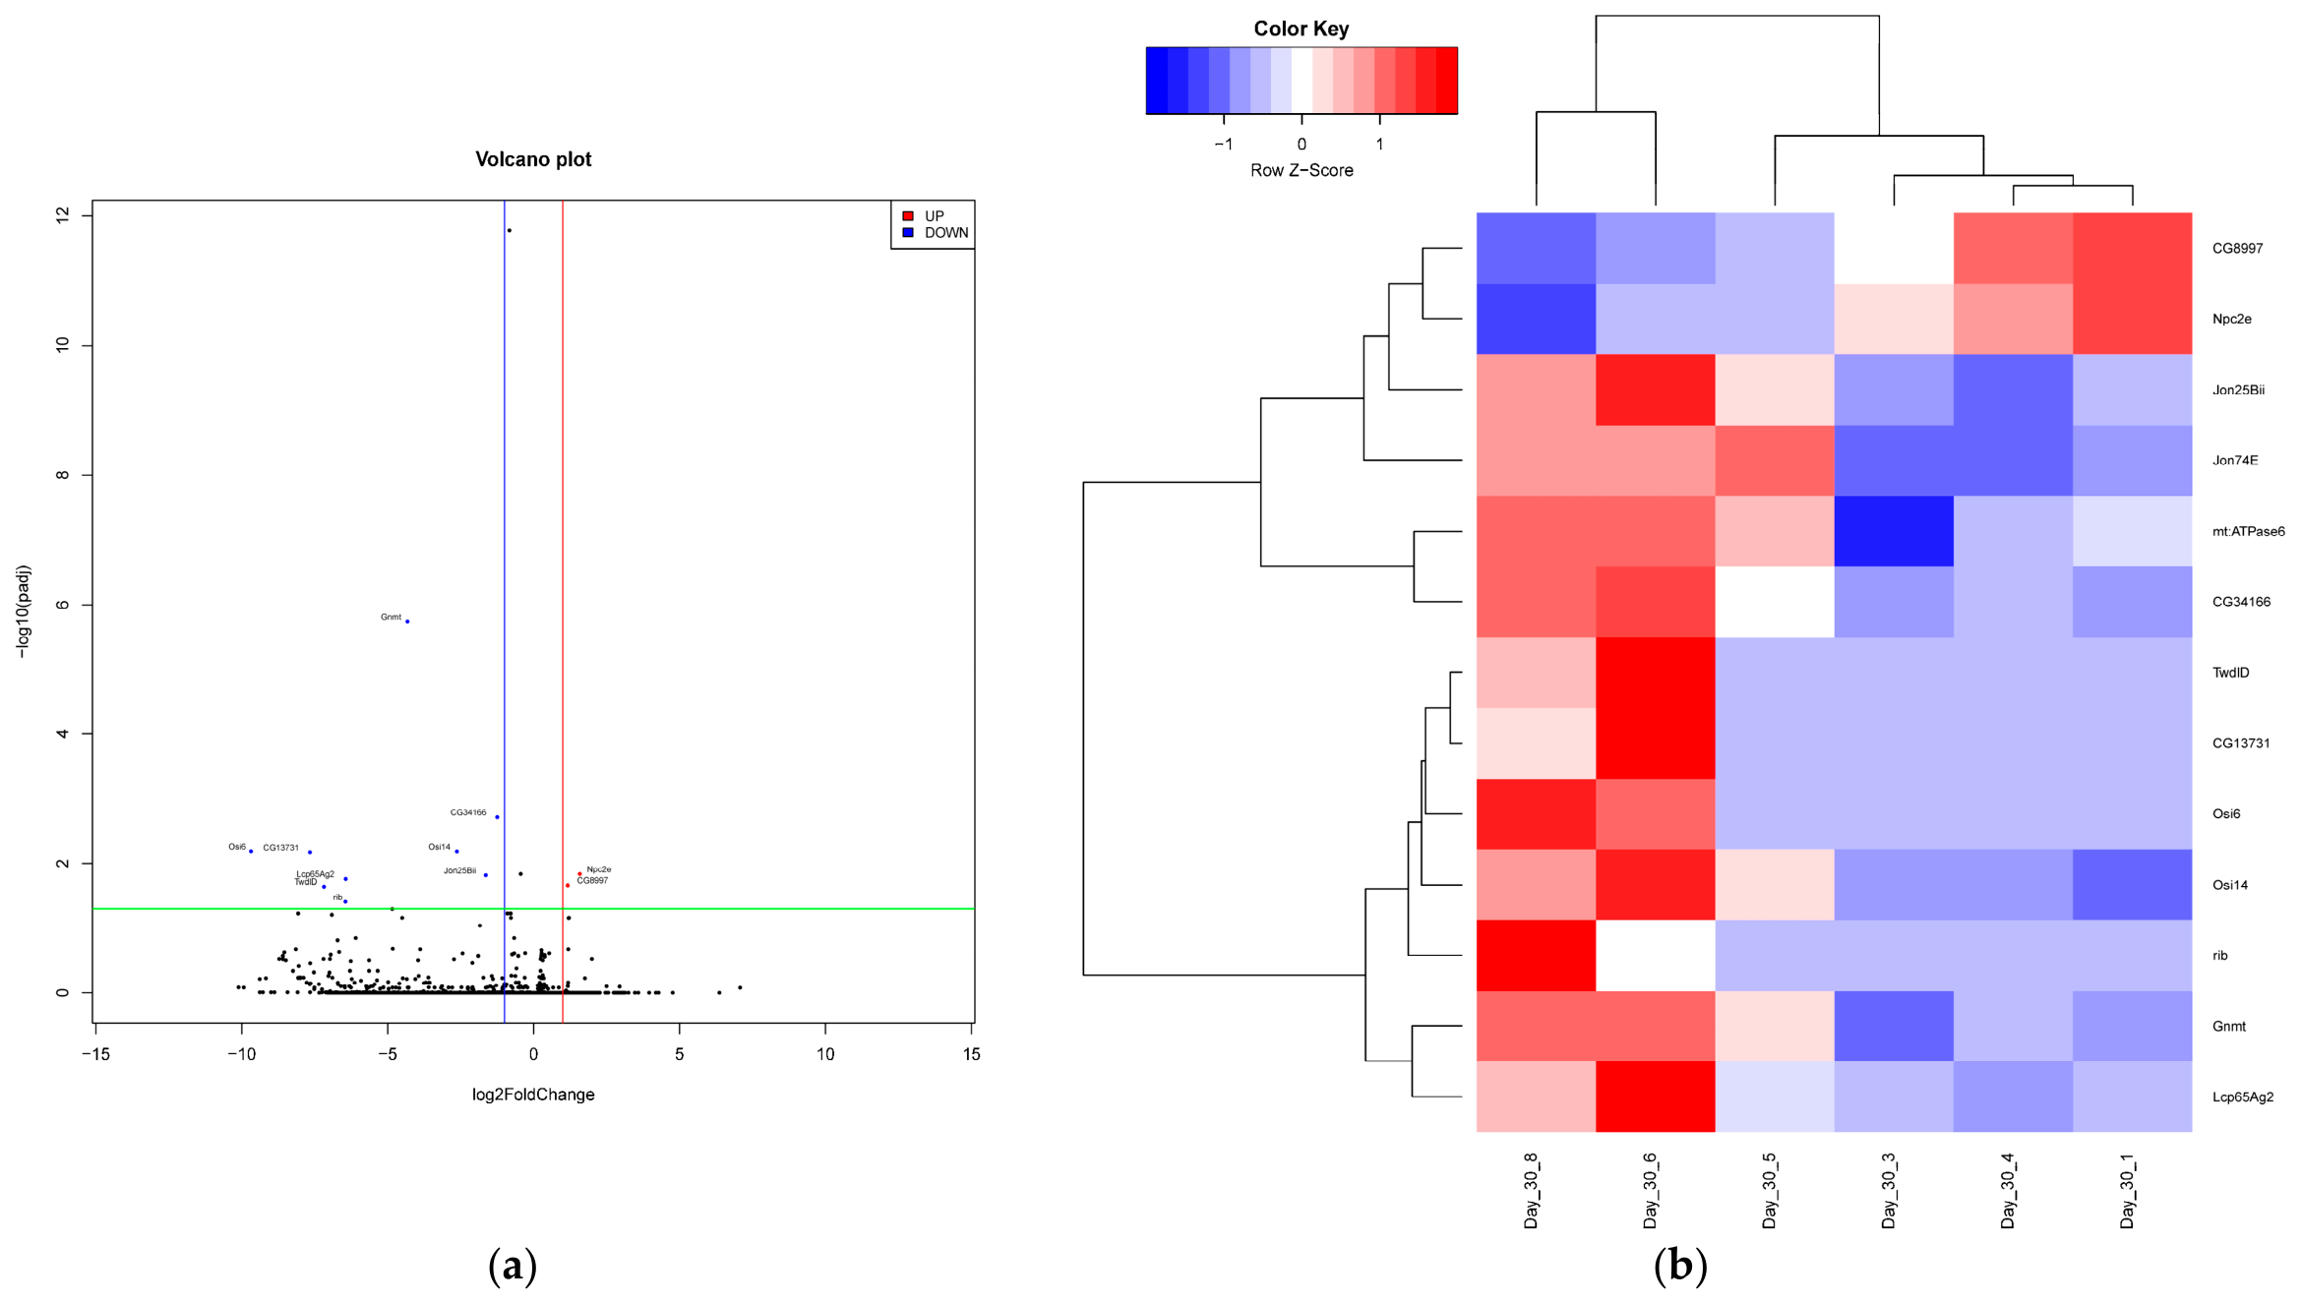
Additionally, next-generation sequencing was conducted on PN-exposed and no PN-exposed total RNA extractions at days 0, 15, and 30 to evaluate the effects of PN exposure on whole-genome expression over time. Total RNA extractions for each time point were sequenced, and gene expression was evaluated by comparing the sequences to a reference D. melanogaster genome. Gene expression was measured by calculating fold change values between sets of samples and assessing statistical significance (p < 0.05). An additional cut-off for statistically significant genes was used to determine differentially expressed genes by evaluating fold change (log2 ≥ 1 or ≤ −1), categorized as either upregulated or downregulated. In the age-matched treatment and control groups, multiple genes were either up- or downregulated at day 15 and day 30, as shown by the volcano plot and heatmaps (Figure 3 and Figure 4). At day 15, Cp18 (chorion protein 18) and Jon25Bi (Jonah 25Bi) were significantly upregulated (padj = 0.010982 and padj = 0.010982, respectively; Figure 3). Comparisons at day 15 also revealed that CG14419 and Adhr (Adh-related) were downregulated (padj = 0.002302 and padj = 0.008221, respectively; Figure 4). At day 30, Npc2e (Niemann–Pick type C-2e) and CG8997 were significantly upregulated (padj = 0.014671 and padj = 0.021739, respectively; Figure 4). Conversely, mt:ATPase6 (mitochondrial ATPase subunit 6), Jon74E (Jonah 74E), CG34166, Jon25Bii (Jonah 25 Bii), Osi14 (Osiris 14), Gnmt (glycine N-methyltransferase), Lcp65Ag2, rib (ribbon), TwdlD (TweedleD), CG13731, and Osi6 (Osiris 6) were all significantly downregulated (padj = 0.014671, padj = 1.67 × 10⁻¹², padj = 0.001968, padj = 0.015334, padj = 0.00657, padj = 1.83 × 10⁻⁶, padj = 0.017466, padj = 0.038688, padj = 0.022723, padj = 0.006766, and padj = 0.006535, respectively).

3. Discussion

This study provides novel evidence that D. melanogaster exposed to peanut exhibits measurable, yet modest, transcriptional changes in a limited number of genes. The first step in using this model was to confirm that PN exposure would not be lethal to the flies. As shown in Figure 1, the longevity and median survival of both treatment groups were not statistically significant. Further, each immune pathway required investigation at the transcriptional level: Dl, Dif, and Cact for Toll and Rel for Imd. Gene expression was assessed by qRT-PCR, and we found that at 24 days post-exposure, both Dl and Relish are significantly downregulated (Figure 2).
To better elucidate the interaction between PN exposure and immune activation, NGS was performed at 15 and 30 days post-exposure. In total, 17 genes were found to be differentially regulated: four at day 15 and 13 at day 30 (Figure 3 and Figure 4). Of the genes differentially regulated, 10 have known functions. Both Cp18 and Jon25Bi were found to be upregulated at day 15 (Figure 3). Cp18 is involved in chorion assembly and is a structural constituent of the chorion [17]. Jonah genes have shown exclusive expression in the Drosophila gut, leading to speculation that they are involved in the breakdown of dietary proteins, due to homology with mammalian trypsin and chymotrypsin [18]. However, other serine proteases have been implicated in the melanization reaction via proteolytic cleavage of prophenoloxidase [19]. Melanization is an important response in invertebrates triggered by microorganism entry and results in melanin deposition and phenol oxidation [20]. In contrast, two other Jonah genes (Jon25Bii and Jon74E) were found to be downregulated at day 30 (Figure 4), which was seen in a transcriptional response study using sigma virus to infect male and female flies [21]. Additionally, Lcp65Ag2, a structural constituent of the larval cuticle, and ribbon (rib) were also downregulated at day 30 (Figure 4). Several other genes were also found to be downregulated at day 30, including mitochondrial ATPase subunit 6 (mt:ATPase6) and TweedleD (TwdlD; Figure 4). mt:ATPase6 encodes a protein necessary for oxidative phosphorylation [22], and TwdlD encodes a chitin-binding protein and serves as a structural constituent of the larval cuticle [23]. Although these genes were differentially regulated, they are structural or metabolic genes. The difference in their expression may be due to the feeding, digestion, or processing of peanut rather than immune inactivation.
Also downregulated at day 30 (Figure 4) was glycine N-methyltransferase (Gnmt), but, in contrast to our findings, Gnmt has previously been shown to be upregulated during Toll activation. However, our findings could suggest a form of energy conservation, as the phenotype observed during that study was energy wasting due to lipolysis [24]. In mice, Gnmt downregulation or absence has been shown to increase inflammatory responses [25,26]. Additionally, flies overexpressing Gnmt exhibit increased longevity [27], further suggesting a detrimental response to PN exposure, but once again, this could be due to feeding on peanut. Further investigation will be needed to determine if Gnmt plays a role in innate immune activation.
At day 30, only one gene was significantly upregulated with a known function, Niemann-Pick type C-2e (Npc2e; Figure 4). This gene controls sterol homeostasis and steroid biosynthesis and has been extensively studied for its role in neurodegeneration. In humans, Niemann–Pick type C disease is a progressive neurodegenerative disorder marked by the accumulation of free cholesterol in late endosome- and lysosome-like compartments and results from a mutation in either NPC1 or NPC2, in which Npc2e is a homolog for the latter [28,29]. More recently, Npc2e has been implicated in immune function within D. melanogaster. In flies challenged with toxic fungus Aspergillus nidulans, Npc2e was found to be significantly upregulated [30]. Similarly, during bacterial challenge with both Gram-positive and Gram-negative cells, multiple npc2 genes were found to be upregulated, and NPC2 proteins were able to bind to lipopolysaccharide, peptidoglycan, and lipoteichoic acid, all components of the bacterial cell wall. Additionally, overexpression of NPC2e activated the diptericin promoter, an AMP produced via the Imd pathway, but not the Drs promoter, an AMP produced via the Toll pathway, in S2 cells [31]. While this observation is interesting in the context of immune reactions, we are cautious in the interpretation. Future studies will need to be performed to determine if this result is consistently observed.
Several limitations of this study should be acknowledged. First, changes in mRNA levels alone are not sufficient to demonstrate pathway activation. Future studies will need to include testing downstream canonical targets, reporter assays, and possibly pathway mutants/RNAi experiments. Secondly, whole-body RNA sequencing limits tissue-specific responses. Peanut is delivered through the diet; therefore, the gut should be examined, as well as the fat body for systematic immune responses. Finally, feeding rate and food preference were not controlled for; therefore, the metabolic gene changes could reflect altered feeding or nutrient intake. This also needs to be determined.
In toto, the results of this study indicate that peanut exposure is associated with limited transcriptional responses in D. melanogaster. This study provides an initial exploratory framework for examining how dietary allergens may influence immune-associated gene expression. Future studies will be required to determine whether these transcriptional changes reflect biologically meaningful immune responses.

4. Materials and Methods

4.1. D. melanogaster Husbandry and Longevity Experiment

Canton S wild-type D. melanogaster (Bloomington Drosophila Stock Center, Bloomington, IN, USA) were maintained in an incubator at 25 °C on a standard cornmeal, torula yeast, molasses medium with a diurnal light cycle. Once adequate stocks were established, stock bottles were expanded for fly collection by transferring into new bottles. The next generation of flies was allowed to eclose, and virgin female flies were collected for further analysis. Female flies were used based on previous mouse model studies showing that female mice undergo more severe anaphylaxis symptoms than their male counterparts [32]. The flies were placed in pint cages with air ventilation, a food vial, and an access point for a mouth aspirator to remove and add flies. The following conditions were established: peanut-exposed (PN), where food was supplemented with a 5% peanut solution allowed to dry on top, or no PN exposure, where distilled water was allowed to dry on top of the food. One hundred virgin female flies were added to an individual cage, and four cages were set up per condition, for a total of eight cages. The food was changed every 72 h, at which time dead flies were collected and stored at −80 °C for subsequent analysis. This was continued until all flies were dead (72 days). The statistical significance of longevity between treatment groups was determined using Kaplan–Meier analysis.

4.2. RNA Extraction and qRT-PCR Analysis

Total RNA extraction was performed at 15, 24, and 42 days post-exposure using TRIzol® per the manufacturer’s instructions (ThermoFisher Scientific, Waltham, MA, USA). These sample dates were chosen as a preliminary method to determine if an immune response was induced when exposed to PN prior to the median survival (54 days). Each sample was quantified using a NanoDropTM ONE spectrophotometer (ThermoFisher Scientific) to assess RNA purity (260/280 ≈ 2.0) and concentration. TaqMan Gene Expression Assay kits (Applied Biosystems, Foster City, CA, USA) and a QuantStudio 5 Real-Time PCR System (Applied Biosystems) were used to perform reverse transcription quantitative PCR (qRT-PCR) according to the manufacturer’s instructions. Each reaction was prepared with 200 ng of RNA. The Taqman probe sets were Ribosomal protein L32 (RpL32; endogenous control; assay #Dm02151827_g1), Dorsal (Dl; assay #Dm0180803_g1), Dorsal-related immunity factor (Dif; assay #DM01810798_g1), Cactus (Cact; assay #Dm0187757_g1), and Relish (Rel assay #Dm02134843_g1). Duplicate reactions for each of 3 experiments (n = 6) were carried out under the following conditions: 45 °C for 10 min and 95 °C for 10 min (95 °C for 15 s, 60 °C for 45 s) repeated for 40 cycles. The PCR products were analyzed in the linear range for amplification with RpL32 using QuantStudio 5 qPCR Data Analysis Software v1.5.1 (Applied Biosystems). Grubbs’ test was used to exclude any outliers within Ct values [33,34]. The relative quantitative results were used to determine changes in gene expression on a Log2 scale via the ΔΔCt method [35]. Ct values standardized to the reference gene RpL32 (ΔCt values) were subjected to hypothesis testing with unpaired Student’s t-tests with a Welch correction, where appropriate [36].

4.3. Next-Generation Sequencing

An independent batch of virgin females was collected at days 0, 15, and 30 using the same method described above. Next-generation sequencing was used to compare triplicate samples of PN-exposed and no PN-exposed flies at different time points (0, 15, and 30 days post-exposure) to assess genes upregulated and downregulated during PN exposure. These days were chosen based on the preliminary results obtained from qRT-PCR. Specifically, days 15 and 30 were chosen to capture both early and late transcriptional changes. Day 30 was intended to capture sustained or downstream responses following the qRT-PCR time point (day 24) when the initial changes in Dl and Rel expression were detected. Total RNA samples were submitted to the UNMC Genomics Core Facility for quality control (QC), library preparation, and sequencing. Initial QC utilized the RNA integrity number (RIN), calculated from an Agilent 2100 Bioanalyzer, followed by mRNA-seq library preparation according to the Tecan (formerly NuGEN) Universal Plus mRNA-seq Library Preparation Kit protocol. Briefly, polyadenylated RNA was enriched from total RNA, followed by fragmentation, first and second strand cDNA synthesis, end repair, barcoded adapter ligation, and PCR amplification. Library quality and fragment size distribution were evaluated using a Bioanalyzer, and barcoded sample libraries were quantified and pooled prior to sequencing. Single-end 75 bp sequencing was performed on an Illumina NextSeq 550 platform using a High Output flow cell.

4.4. RNA Sequencing (RNA-Seq) and Bioinformatics Data Analysis

The original RNA-seq reads were trimmed by Trim Galore (Trim Galore! v0.6.7; available at https://github.com/FelixKrueger/TrimGalore; accessed on 13 May 2024) to remove adapters, terminal unknown bases (Ns) and low quality 3’ regions (Phred score < 20). The trimmed fastq files were processed by FastQC (FastQC: a quality control tool for high-throughput sequence data; available online at https://www.bioinformatics.babraham.ac.uk/projects/fastqc/; accessed on 13 May 2024) and MultiQC [37] for quality control. The trimmed fastq files were mapped to the BDGP6 Drosophila melanogaster reference genome (Ensemble 112 version) by the STAR aligner and were then subject to the RSEM tool for gene-level annotation and quantification [38,39]. The raw read counts were used for differentially expressed gene (DEG) analysis by the R package DESeq2 v1.44.0 [40]. The raw p-values were adjusted for the false discovery rate [41]. Significant DEGs were determined by padj ≤ 0.05. A volcano plot for each comparison was generated by R 4.3.1, and a 2D hierarchical clustering heatmap for each comparison was plotted by the gplots 3.1.3 package in R 4.3.1.

Author Contributions

Conceptualization, C.H., A.M.H., J.J.D. and K.A.C.; methodology, C.H., A.M.H., J.J.D. and K.A.C.; validation, C.H., A.M.H., J.J.D. and K.A.C.; formal analysis, C.H., A.M.H. and P.X.; investigation, C.H. and A.M.H.; resources, J.J.D. and K.A.C.; data curation, P.X. and K.A.C.; writing—original draft preparation, C.H., A.M.H. and P.X.; writing—review and editing, J.J.D. and K.A.C.; visualization, C.H., A.M.H., P.X. and K.A.C.; supervision, K.A.C.; project administration, K.A.C.; funding acquisition, J.J.D. and K.A.C. All authors have read and agreed to the published version of the manuscript.

Funding

The project described was supported by the National Institute of General Medical Science (NIGMS) of the National Institutes of Health (NIH), grant award number GM103427, and an Institutional Development Award (IDeA) grant from NIGMS, grant award number GM115458.

Data Availability Statement

The raw data supporting the conclusions of this article will be made available by the authors on request.

Acknowledgments

The authors thank the members of the Carlson crew for their mentorship, technical assistance, and constructive feedback throughout the course of this project. This work was supported by the Nebraska INBRE Program, the Great Plains IDeA-CTR, the Undergraduate Research Fellows (URF) Program at the University of Nebraska at Kearney (UNK), the UNK Biology Department, the UNK Summer Student Research Program (SSRP), and the UNK INSpRE Core. The authors also acknowledge the University of Nebraska Medical Center (UNMC) laboratories for performing the next-generation sequencing (NGS) and for providing critical support with NGS data processing and analysis, which were essential to the completion of this study. This work was supported by the National Center for Research Resources (5P20RR016469) and the National Institute for General Medical Science (NIGMS) (5P20GM103427), a component of the National Institutes of Health (NIH). This work was assisted by UNMC’s Genomics Core Facility RRID, SCR_023539, which receives partial support from the National Institute of General Medical Sciences (NIGMS) INBRE–P20GM103427 award. The contents are the sole responsibility of the authors and do not necessarily represent the official views of the NIH or NIGMS. We also thank the Bioinformatics and Systems Biology Core at UNMC for performing the bioinformatics data analysis, which receives support from Nebraska Research Initiative (NRI) and NIH (2P20GM103427 and 5P30CA036727).

Conflicts of Interest

The authors declare no conflicts of interest. The funders had no role in the design of the study; in the collection, analyses, or interpretation of data; in the writing of the manuscript; or in the decision to publish the results.

References

  1. Sicherer, S.H.; Sampson, H.A. Food allergy: Epidemiology, pathogenesis, diagnosis, and treatment. J. Allergy Clin. Immunol. 2014, 133, 291–307. [Google Scholar] [CrossRef]
  2. Schneider Chafen, J.J.; Newberry, S.J.; Riedl, M.A.; Bravata, D.M.; Maglione, M.; Suttorp, M.J.; Sundaram, V.; Paige, N.M.; Towfigh, A.; Hulley, B.J.; et al. Diagnosing and managing common food allergies: A systematic review. JAMA 2010, 303, 1848–1856. [Google Scholar] [CrossRef]
  3. Prescott, S.L.; Pawankar, R.; Allen, K.J.; Campbell, D.E.; Sinn, J.K.H.; Fiocchi, A.; Ebisawa, M.; Sampson, H.A.; Beyer, K.; Lee, B.-W. A global survey of changing patterns of food allergy burden in children. World Allergy Organ. J. 2013, 6, 1–12. [Google Scholar] [CrossRef] [PubMed]
  4. Logan, K.; Bahnson, H.T.; Ylescupidez, A.; Beyer, K.; Bellach, J.; Campbell, D.E.; Craven, J.; Du Toit, G.; Mills, E.N.C.; Perkin, M.R.; et al. Early introduction of peanut reduces peanut allergy across risk groups in pooled and casual inference analyses. Allergy 2023, 78, 1307–1318. [Google Scholar] [CrossRef]
  5. Li, X.-M.; Serebrisky, D.; Lee, S.-Y.; Huang, C.-K.; Bardina, L.; Schofield, B.H.; Stanley, J.S.; Burks, A.W.; Bannon, G.A.; Sampson, H.A. A murine model of peanut anaphylaxis: T- and B-cell responses to a major peanut allergen mimic human responses. J. Allergy Clin. Immunol. 2000, 106, 150–158. [Google Scholar] [CrossRef]
  6. Dolence, J.J.; Kobayashi, T.; Iijima, K.; Krempski, J.; Drake, L.Y.; Dent, A.L.; Kita, H. Airway exposure initiates peanut allergy by involving the IL-1 pathway and T follicular helper cells in mice. J. Allergy Clin. Immunol. 2018, 142, 1144–1158.e8. [Google Scholar] [CrossRef] [PubMed]
  7. Meng, X.; Khanuja, B.S.; Ip, Y.T. Toll receptor-mediated Drosophila immune response requires Dif, an NFκB factor. Genes Dev. 1999, 13, 792–797. [Google Scholar] [CrossRef] [PubMed]
  8. Costa, A.; Jan, E.; Sarnow, P.; Schneider, D. The Imd pathway is involved in antiviral immune responses in Drosophila. PLoS ONE 2009, 4, e7436. [Google Scholar] [CrossRef]
  9. Lemaitre, B.; Hoffmann, J. The host defense of Drosophila melanogaster. Annu. Rev. Immunol. 2007, 25, 697–743. [Google Scholar] [CrossRef]
  10. Lemaitre, B.; Nicolas, E.; Michaut, L.; Reichart, J.-M.; Hoffmann, J.A. The dorsoventral regulatory gene cassette spatzle/Toll/cactus controls the potent antifungal response in Drosophila adults. Cell 1996, 86, 973–983. [Google Scholar] [CrossRef]
  11. Belvin, M.P.; Jin, Y.; Anderson, K.V. Cactus protein degradation mediates Drosophila dorsal-ventral signaling. Genes Dev. 1995, 9, 783–793. [Google Scholar] [CrossRef]
  12. Tanji, T.; Hu, X.; Weber, A.N.R.; Ip, Y.T. Toll and IMD pathways synergistically activate an innate immune response in Drosophila melanogaster. Mol. Cell. Biol. 2007, 27, 4578–4588. [Google Scholar] [CrossRef] [PubMed]
  13. Lemaitre, B.; Reichart, J.-M.; Hoffmann, J.A. Drosophila host defense: Differential induction of antimicrobial peptide genes after infection by various classes of microorganisms. Proc. Natl. Acad. Sci. USA 1997, 94, 14614–14619. [Google Scholar] [CrossRef]
  14. Sekiya, M.; Ueda, K.; Okazaki, K.; Kikuchi, H.; Kurata, S.; Oshima, Y. A cyclopentanediol analogue selectively suppresses the conserved innate immunity pathways, Drosophila Imd and TNF-α pathways. Biochem. Pharmacol. 2008, 75, 2165–2174. [Google Scholar] [CrossRef] [PubMed]
  15. Warmbold, C.; Uliczka, K.; Rus, F.; Suck, R.; Petersen, A.; Silverman, N.; Ulmer, A.J.; Heine, H.; Roeder, T. Dermatophagoides pternyssinus major allergen 1 activates the innate immune response of the fruit fly Drosophila melanogaster. J. Immunol. 2013, 190, 366–371. [Google Scholar] [CrossRef]
  16. Shreffler, W.G.; Castro, R.R.; Kucuk, Z.Y.; Charlop-Powers, Z.; Grishina, G.; Yoo, S.; Welsey Burks, A.; Sampson, H.A. The major glycoprotein allergen from Arachia hypogaea, Ara h 1, is a ligand of dendritic cell-specific ICAM-grabbing nonintegrin and acts as a Th2 adjuvant in vito. J. Immunol. 2006, 177, 3677–3685. [Google Scholar] [CrossRef]
  17. Griffin-Shea, R.; Thireos, G.; Kafatos, F.C. Organization of a cluster of four chorion genes in Drosophila and its relationship to developmental expression and amplification. Dev. Biol. 1982, 91, 325–336. [Google Scholar] [CrossRef] [PubMed]
  18. Fernandez-Ayala, D.J.M.; Chen, S.; Kemppainen, E.; O’Dell, K.M.C.; Jacobs, H.T. Gene expression in a Drosophila model of mitochondrial disease. PLoS ONE 2010, 5, e8549. [Google Scholar] [CrossRef]
  19. Söderhäll, K.; Cerenius, L. Role of the prophenoloxidase-activating system in invertebrate immunity. Curr. Opin. Immunol. 1998, 10, 23–28. [Google Scholar] [CrossRef]
  20. Christensen, B.M.; Li, J.; Chen, C.-C.; Nappi, A.J. Melanization immune responses in mosquito vectors. Trends Parasitol. 2005, 21, 192–199. [Google Scholar] [CrossRef]
  21. Carpenter, J.; Hutter, S.; Baines, J.F.; Roller, J.; Saminadin-Peter, S.S.; Parsch, J.; Jiggins, F.M. The transcriptional response of Drosophila melanogaster to infection with sigma virus (rhabdoviridae). PLoS ONE 2009, 4, e6838. [Google Scholar] [CrossRef]
  22. Kaneko, M.; Satta, Y.; Matsuura, E.T.; Chigusa, S.I. Evolution of the mitochondrial ATPase 6 gene in Drosophila: Unusually high level of polymorphism in D. melanogaster. Genet. Res. 1993, 61, 195–204. [Google Scholar] [CrossRef]
  23. Guan, X.; Middlebrooks, B.W.; Alexander, S.; Wasserman, S.A. Mutation of TweedleD, a member of an unconventional cuticle protein family, alters body shape in Drosophila. Proc. Natl. Acad. Sci. USA 2006, 103, 16794–16799. [Google Scholar] [CrossRef]
  24. Obata, F.; Kuranaga, E.; Tomioka, K.; Ming, M.; Takeishi, A.; Chen, C.-H.; Soga, T.; Miura, M. Necrosis-driven systemic immune response alters SAM metabolism through the FOXO-GNMT axis. Cell Rep. 2014, 7, 821–833. [Google Scholar] [CrossRef]
  25. Li, C.-H.; Lin, M.-H.; Chu, A.-H.; Tu, P.-H.; Fang, C.-C.; Yen, C.-H.; Liang, P.-I.; Huang, J.C.; Su, Y.-C.; Sytwu, H.-K.; et al. Role of glycine N-methyltransferase in the regulation of T-cell responses in experimental autoimmune encephalomyelitis. Mol. Med. 2014, 20, 684–696. [Google Scholar] [CrossRef] [PubMed]
  26. Stewart, D.; Nichol, A. Inflammation, immunity, and allergy. Anaesth. Intensive Care 2021, 22, 488–493. [Google Scholar] [CrossRef]
  27. Obata, F.; Miura, M. Enhancing S-adenosyl-methionine catabolism extends Drosophila lifespan. Nat. Commun. 2015, 6, 8332. [Google Scholar] [CrossRef] [PubMed]
  28. Huang, X.; Warren, J.T.; Buchanan, J.; Gilbert, L.I.; Scott, M.P. Drosophila Niemann-Pick Type C-2 genes control sterol homeostasis and steroid biosynthesis: A model of human neurodegenerative disease. Development 2007, 134, 3733–3742. [Google Scholar] [CrossRef] [PubMed]
  29. Patterson, M.M. A riddle wrapped in a mystery: Understanding Niemann-Pick Disease, Type C. Neurologist 2003, 9, 301–310. [Google Scholar] [CrossRef] [PubMed]
  30. Trienens, M.; Kraaijeveld, K.; Wertheim, B. Defensive repertoire of Drosophila larvae in response to toxic fungi. Mol. Ecol. 2017, 26, 5043–5057. [Google Scholar] [CrossRef]
  31. Shi, X.-Z.; Zhong, X.; Yu, X.-Q. Drosophila melanogaster NPC2 proteins bind bacterial cell wall components and may function in immune signal pathways. Insect Biochem. Mol. Biol. 2012, 42, 545–556. [Google Scholar] [CrossRef]
  32. Rajput, S.; Vininski, M.S.; Lehmann, L.-A.; Hobbs, N.J.; Dolence, J.J. Androgen receptor signaling protects male mice from the development of immune response to peanut. Am. J. Clin. Exp. Immunol. 2023, 12, 60–71. [Google Scholar]
  33. Grubbs, F.E. Procedure for detecting outlying observations in samples. Technometrics 1969, 11, 1–21. [Google Scholar] [CrossRef]
  34. Burns, M.J.; Nixon, G.J.; Foy, C.A.; Harris, N. Standardisation of data from real-time quantitative PCR methods—Evaluation of outliers and comparison of calibration curves. BMC Biotechnol. 2005, 5, 31. [Google Scholar] [CrossRef]
  35. Livak, K.J.; Schmittgen, T.D. Analysis of relative gene expression data using real-time quantitative PCR and the 2−ΔΔCT method. Methods 2001, 25, 402–408. [Google Scholar] [CrossRef]
  36. Yuan, J.S.; Reed, A.; Chen, F.; Stewart, C.N. Statistical analysis of real-time PCR data. BMC Bioinform. 2006, 7, 85. [Google Scholar] [CrossRef]
  37. Ewels, P.; Magnusson, M.; Lundin, S.; Käller, M. MultiQC: Summarize analysis results for multiple tools and samples in a single report. Bioinformatics 2016, 32, 3047–3048. [Google Scholar] [CrossRef] [PubMed]
  38. Dobin, A.; Davis, C.A.; Schlesinger, F.; Drenkow, J.; Zaleski, C.; Jha, S.; Batut, P.; Chaisson, M.; Gingeras, T.R. STAR: Ultrafast universal RNA-seq aligner. Bioinformatics 2013, 29, 15–21. [Google Scholar] [CrossRef] [PubMed]
  39. Li, B.; Dewey, C.N. RSEM: Accurate transcript quantification from RNA-seq data with or without a reference genome. BMC Bioinform. 2011, 12, 323. [Google Scholar] [CrossRef]
  40. Love, M.I.; Huber, W.; Anders, S. Moderated estimation of fold change and dispersion for RNA-seq data with DESeq2. Genome Biol. 2014, 15, 550. [Google Scholar] [CrossRef] [PubMed]
  41. Benjamini, Y.; Hochberg, Y. Controlling the false discovery rate: A practical and power approach to multiple testing. J. R. Stat. Soc. B 1995, 57, 289–300. [Google Scholar] [CrossRef]
Figure 1. Survivorship analysis of PN-exposed flies and no PN controls. Kaplan–Meier survivorship analysis did not demonstrate a significant difference between the two groups (p = 0.4354).
Ijms 27 04545 g001
Figure 2. qRT-PCR analysis demonstrating average fold change in Dl (a), Dif (b), Cact (c), and Rel (d) gene expression in females at days 15, 24, and 42 between PN-exposed flies and no PN controls. Student’s t-tests determined that Dl and Relish are significantly downregulated at day 24 (p = 0.045; p = 0.016, respectively (marked by an asterisk)). The error bars represent standard error and n = 6.
Ijms 27 04545 g002
Figure 3. Differential gene expression in PN-exposed flies and no PN controls at day 15. (a) All genes are plotted on a volcano plot showing statistically significant up- (red) and downregulation (blue) (log2FoldChange above 1 (red line) or below −1 (blue line) and corrected p-value ≤ 0.05 (green line)). (b) 2D hierarchical clustering analysis of all significant genes (corrected p-value ≤ 0.05) showing statistically significant up- (red) and downregulation (blue).
Ijms 27 04545 g003
Figure 4. Differential gene expression in PN-exposed flies and no PN controls at day 30. (a) All genes are plotted on a volcano plot showing statistically significant up- (red) and downregulation (blue) (log2FoldChange above 1 (red line) or below −1 (blue line) and corrected p-value ≤ 0.05 (green line)). (b) 2D hierarchical clustering analysis of all significant genes (corrected p-value ≤ 0.05) showing statistically significant up-(red) and downregulation (blue).
Ijms 27 04545 g004
Disclaimer/Publisher’s Note: The statements, opinions and data contained in all publications are solely those of the individual author(s) and contributor(s) and not of MDPI and/or the editor(s). MDPI and/or the editor(s) disclaim responsibility for any injury to people or property resulting from any ideas, methods, instructions or products referred to in the content.