1. Introduction
Uterine corpus endometrial carcinoma (UCEC) represents the major histological subtype of corpus uteri cancer and is among the most common gynecologic malignancies worldwide. UCEC exhibits substantial biological heterogeneity, resulting in marked variability in clinical outcomes [
1,
2]. In the IARC Global Cancer Observatory, endometrial cancer is largely represented within the category of corpus uteri cancer, which accounted for approximately 420,368 new cases and 97,723 deaths globally in 2022, with an estimated 5-year prevalence of approximately 1.59 million cases. Moreover, GLOBOCAN Cancer Tomorrow projections estimate that the annual number of new corpus uteri cancer cases will increase to approximately 676,296 by 2050, corresponding to an approximately 60% increase from 2022 [
3,
4]. These epidemiological data underscore the growing global burden of endometrial cancer and support the need for improved molecular prognostic tools. Although many patients are diagnosed at an early stage and achieve favorable prognosis following standard surgical management, a clinically meaningful subset experience disease recurrence or progression despite apparently low-risk clinicopathological features [
5,
6]. This discordance between conventional clinicopathological risk stratification and clinical outcome highlights the limitations of staging- and histology-based frameworks and underscores the need for molecular stratification strategies that more accurately reflect underlying tumor biology and prognostic risk [
7,
8].
Advances in transcriptomic profiling have enabled the development of numerous gene expression-based prognostic signatures for UCEC and other solid tumors [
9,
10]. These molecular models have demonstrated prognostic value complementary to established clinical parameters [
11]. However, many reported signatures primarily emphasize the optimization of predictive performance, while the biological programs represented by these models—and their relationships to immune-related and tumor-intrinsic transcriptional processes—often remain insufficiently characterized [
12,
13].
From a methodological perspective, several challenges persist in current prognostic modeling strategies for UCEC. Many studies rely on survival-driven feature selection pipelines or focus on single-dimensional biological axes, such as immune-related gene sets, without systematically integrating transcriptional programs associated with tumor proliferation, vascular adaptation, or genomic maintenance. Moreover, limited attention has been paid to whether selected prognostic genes reflect coordinated biological states or represent collections of statistically associated markers lacking functional coherence [
13,
14].
The tumor immune microenvironment has emerged as an important determinant of cancer progression and therapeutic response [
15]. In UCEC, immune infiltration and immune-associated gene expression patterns have been linked to clinical outcomes, fostering the assumption that impaired antitumor immunity or immune evasion underlies poor prognosis [
16,
17]. Nevertheless, accumulating evidence across multiple cancer types indicates that immune-related transcriptional signals do not uniformly translate into effective antitumor immune responses or favorable survival outcomes. Instead, immune signaling may reflect context-dependent or functionally constrained immune states, highlighting the complexity of immune–tumor interactions and challenging simplified interpretations of immune activation signatures [
15,
18].
In parallel, tumor-intrinsic transcriptional programs—including cell cycle dysregulation, DNA damage response, angiogenesis, and epithelial–mesenchymal transition—have been implicated in aggressive tumor behavior and resistance to therapy [
7,
19,
20]. These processes may act independently of, or in coordination with, immune-associated mechanisms to shape disease trajectory. However, the relative contributions and integration of immune-related and tumor-intrinsic programs within prognostic gene signatures for UCEC remain incompletely defined.
Beyond predictive accuracy, an additional analytical challenge lies in balancing prognostic performance with biological interpretability. While penalized regression and multivariable modeling approaches are effective for identifying prognostic gene sets, the resulting signatures are frequently treated as black-box models [
13], as emphasized in recent methodological reviews [
21]. Systematic functional annotation and integrative downstream analyses are therefore essential to bridge statistical prediction with biological understanding.
Several transcriptomic prognostic signatures have been proposed for UCEC, and many have demonstrated potential value for risk stratification. However, most existing models primarily emphasize predictive performance, whereas the biological interpretation of the inferred risk state remains incompletely characterized. In particular, how adverse transcriptomic risk states reflect the balance between immune activation, immune effector function, and tumor-intrinsic proliferative programs remain insufficiently understood. Therefore, beyond constructing another prognostic gene signature, there is a need to identify biologically interpretable transcriptomic states that may explain why certain UCEC tumors exhibit poor clinical outcomes despite evidence of inflammatory immune signaling.
In this study, we aimed to develop and validate a transcriptomic risk signature for UCEC and to determine whether the resulting high-risk state reflects a biologically interpretable pattern of immune–tumor uncoupling. Here, immune–tumor uncoupling is defined as a transcriptomic state in which IFNG-associated inflammatory signaling is preserved or elevated, but downstream effector immune programs, including CD8 T cell-related and cytotoxic activity signatures, are not correspondingly activated. By integrating survival modeling, functional enrichment, immune signature scoring, and external clinicopathological assessment, this study sought to move beyond risk prediction alone and to characterize a biologically meaningful transcriptomic state associated with poor prognosis in UCEC.
3. Discussion
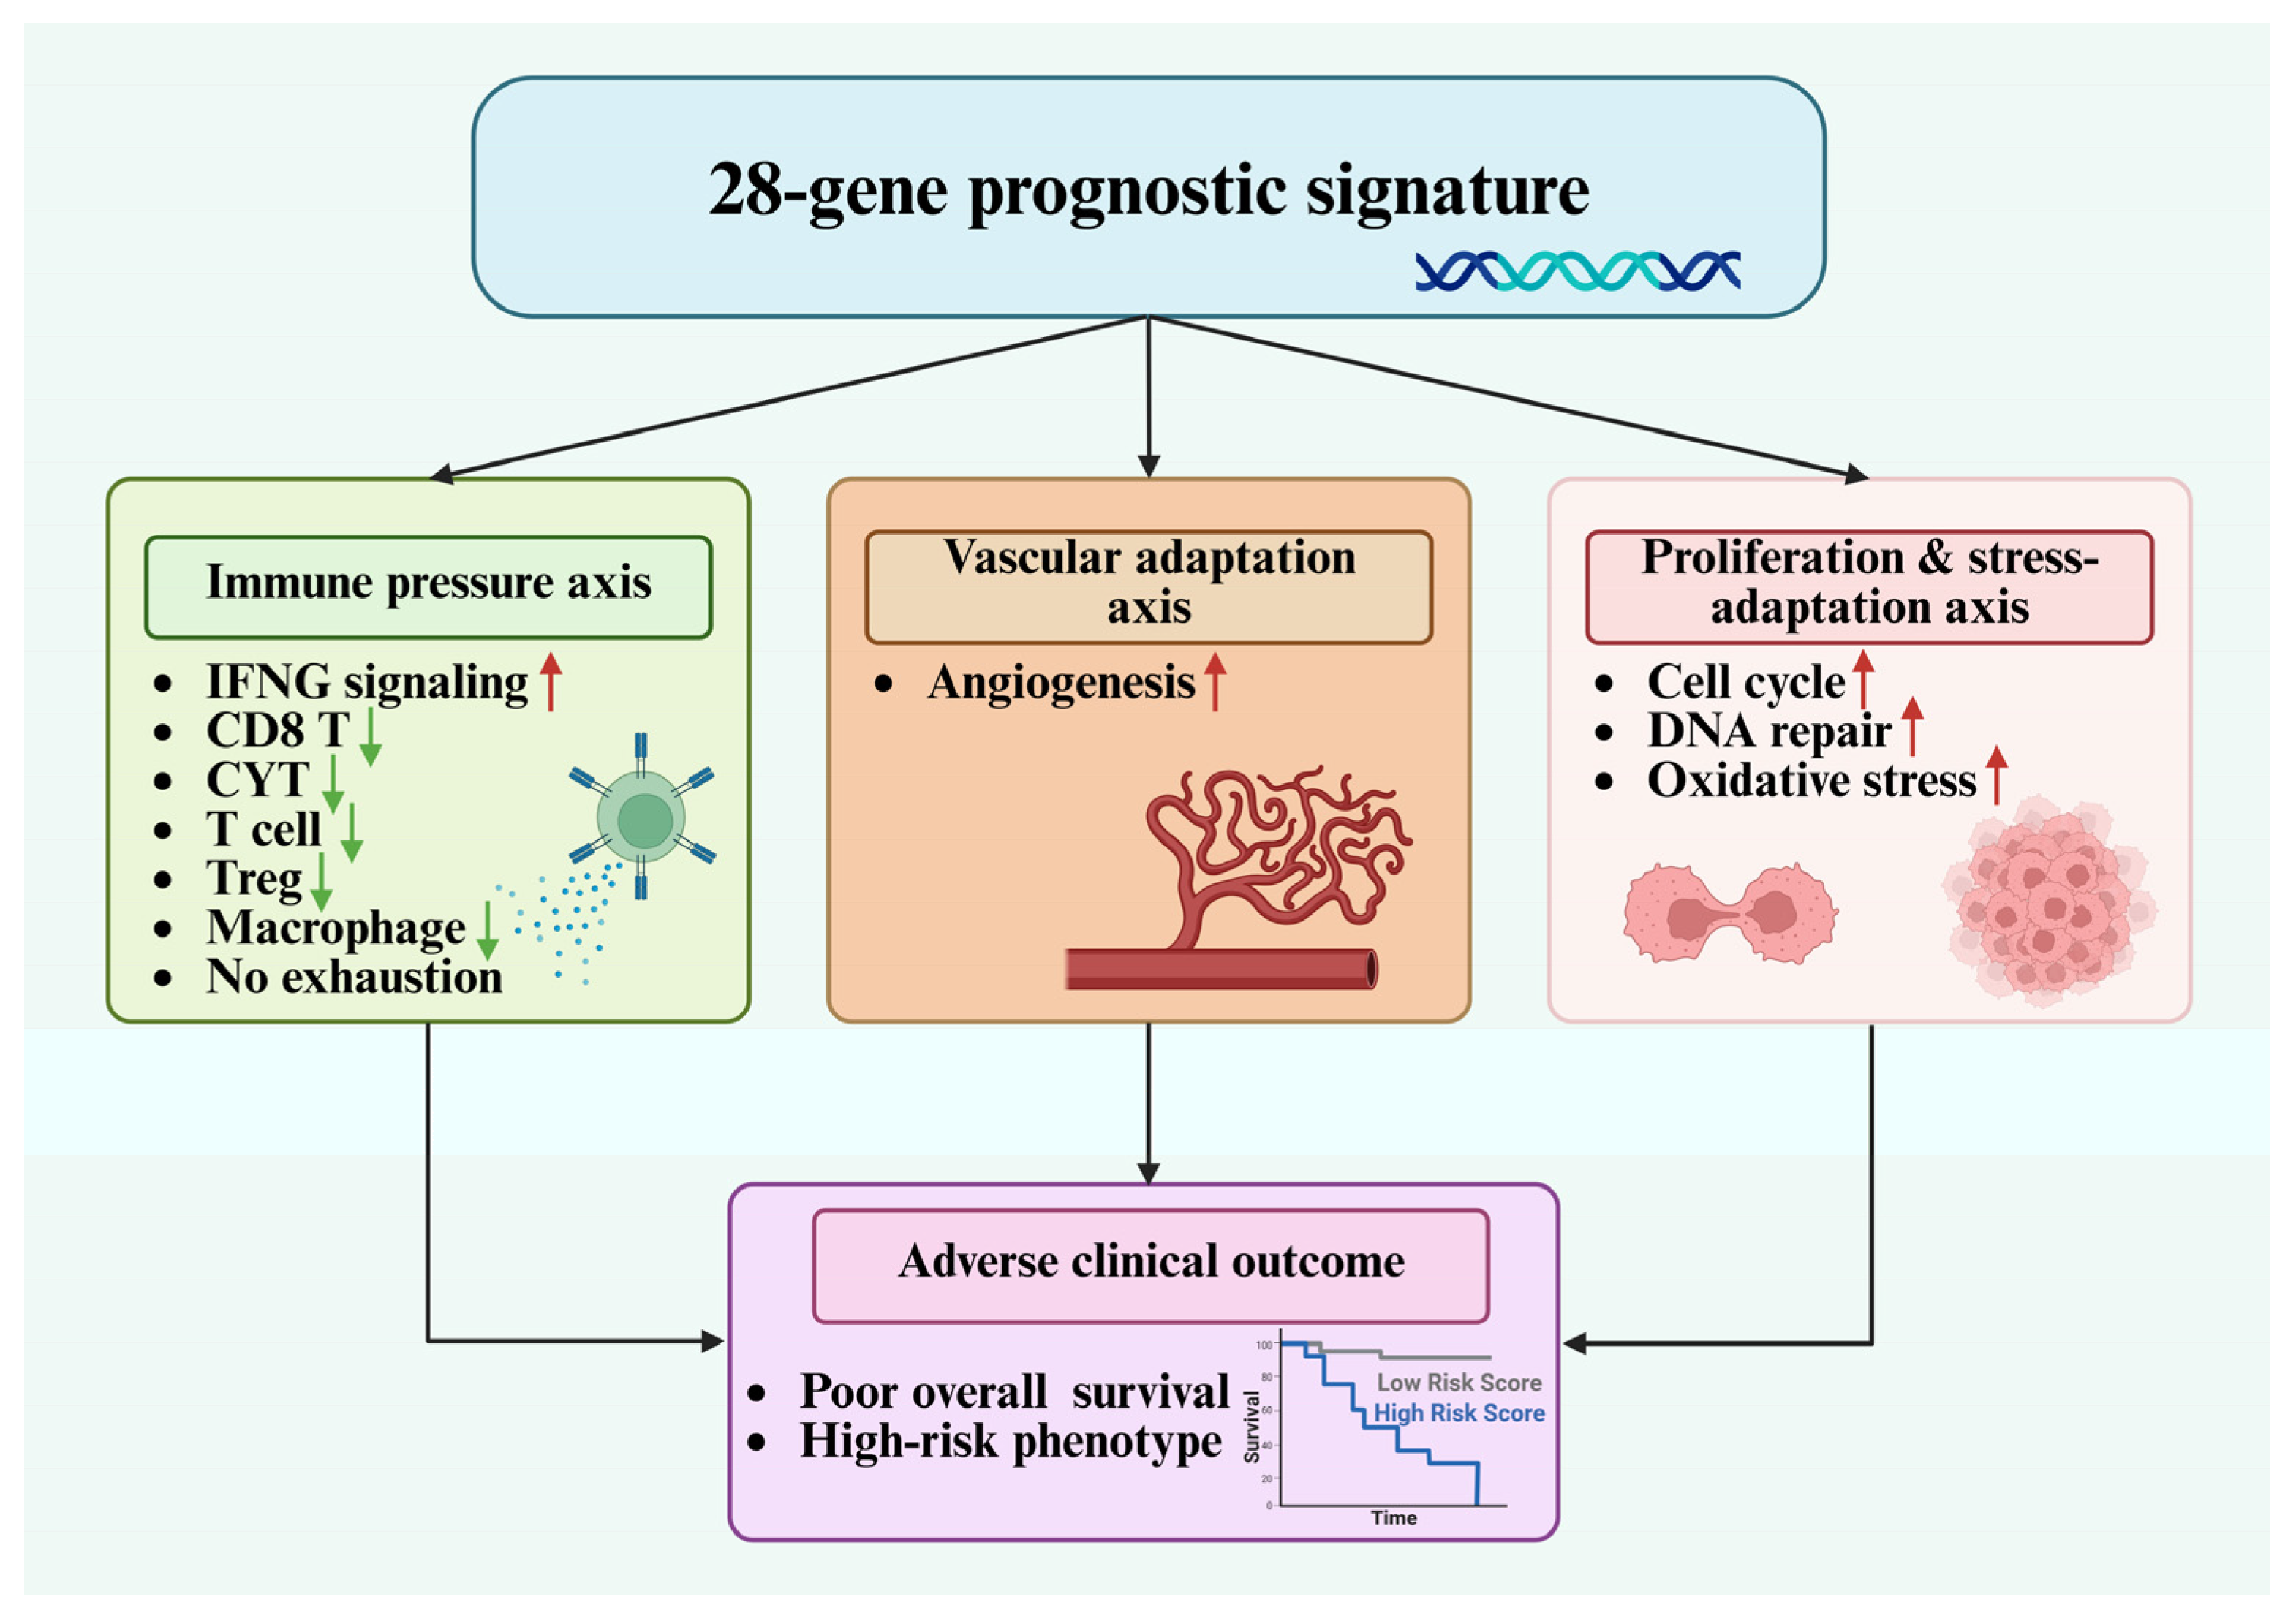
To integrate the molecular features underlying the 28-gene prognostic signature, we constructed an integrative framework summarizing the major transcriptomic programs associated with adverse outcomes in UCEC (
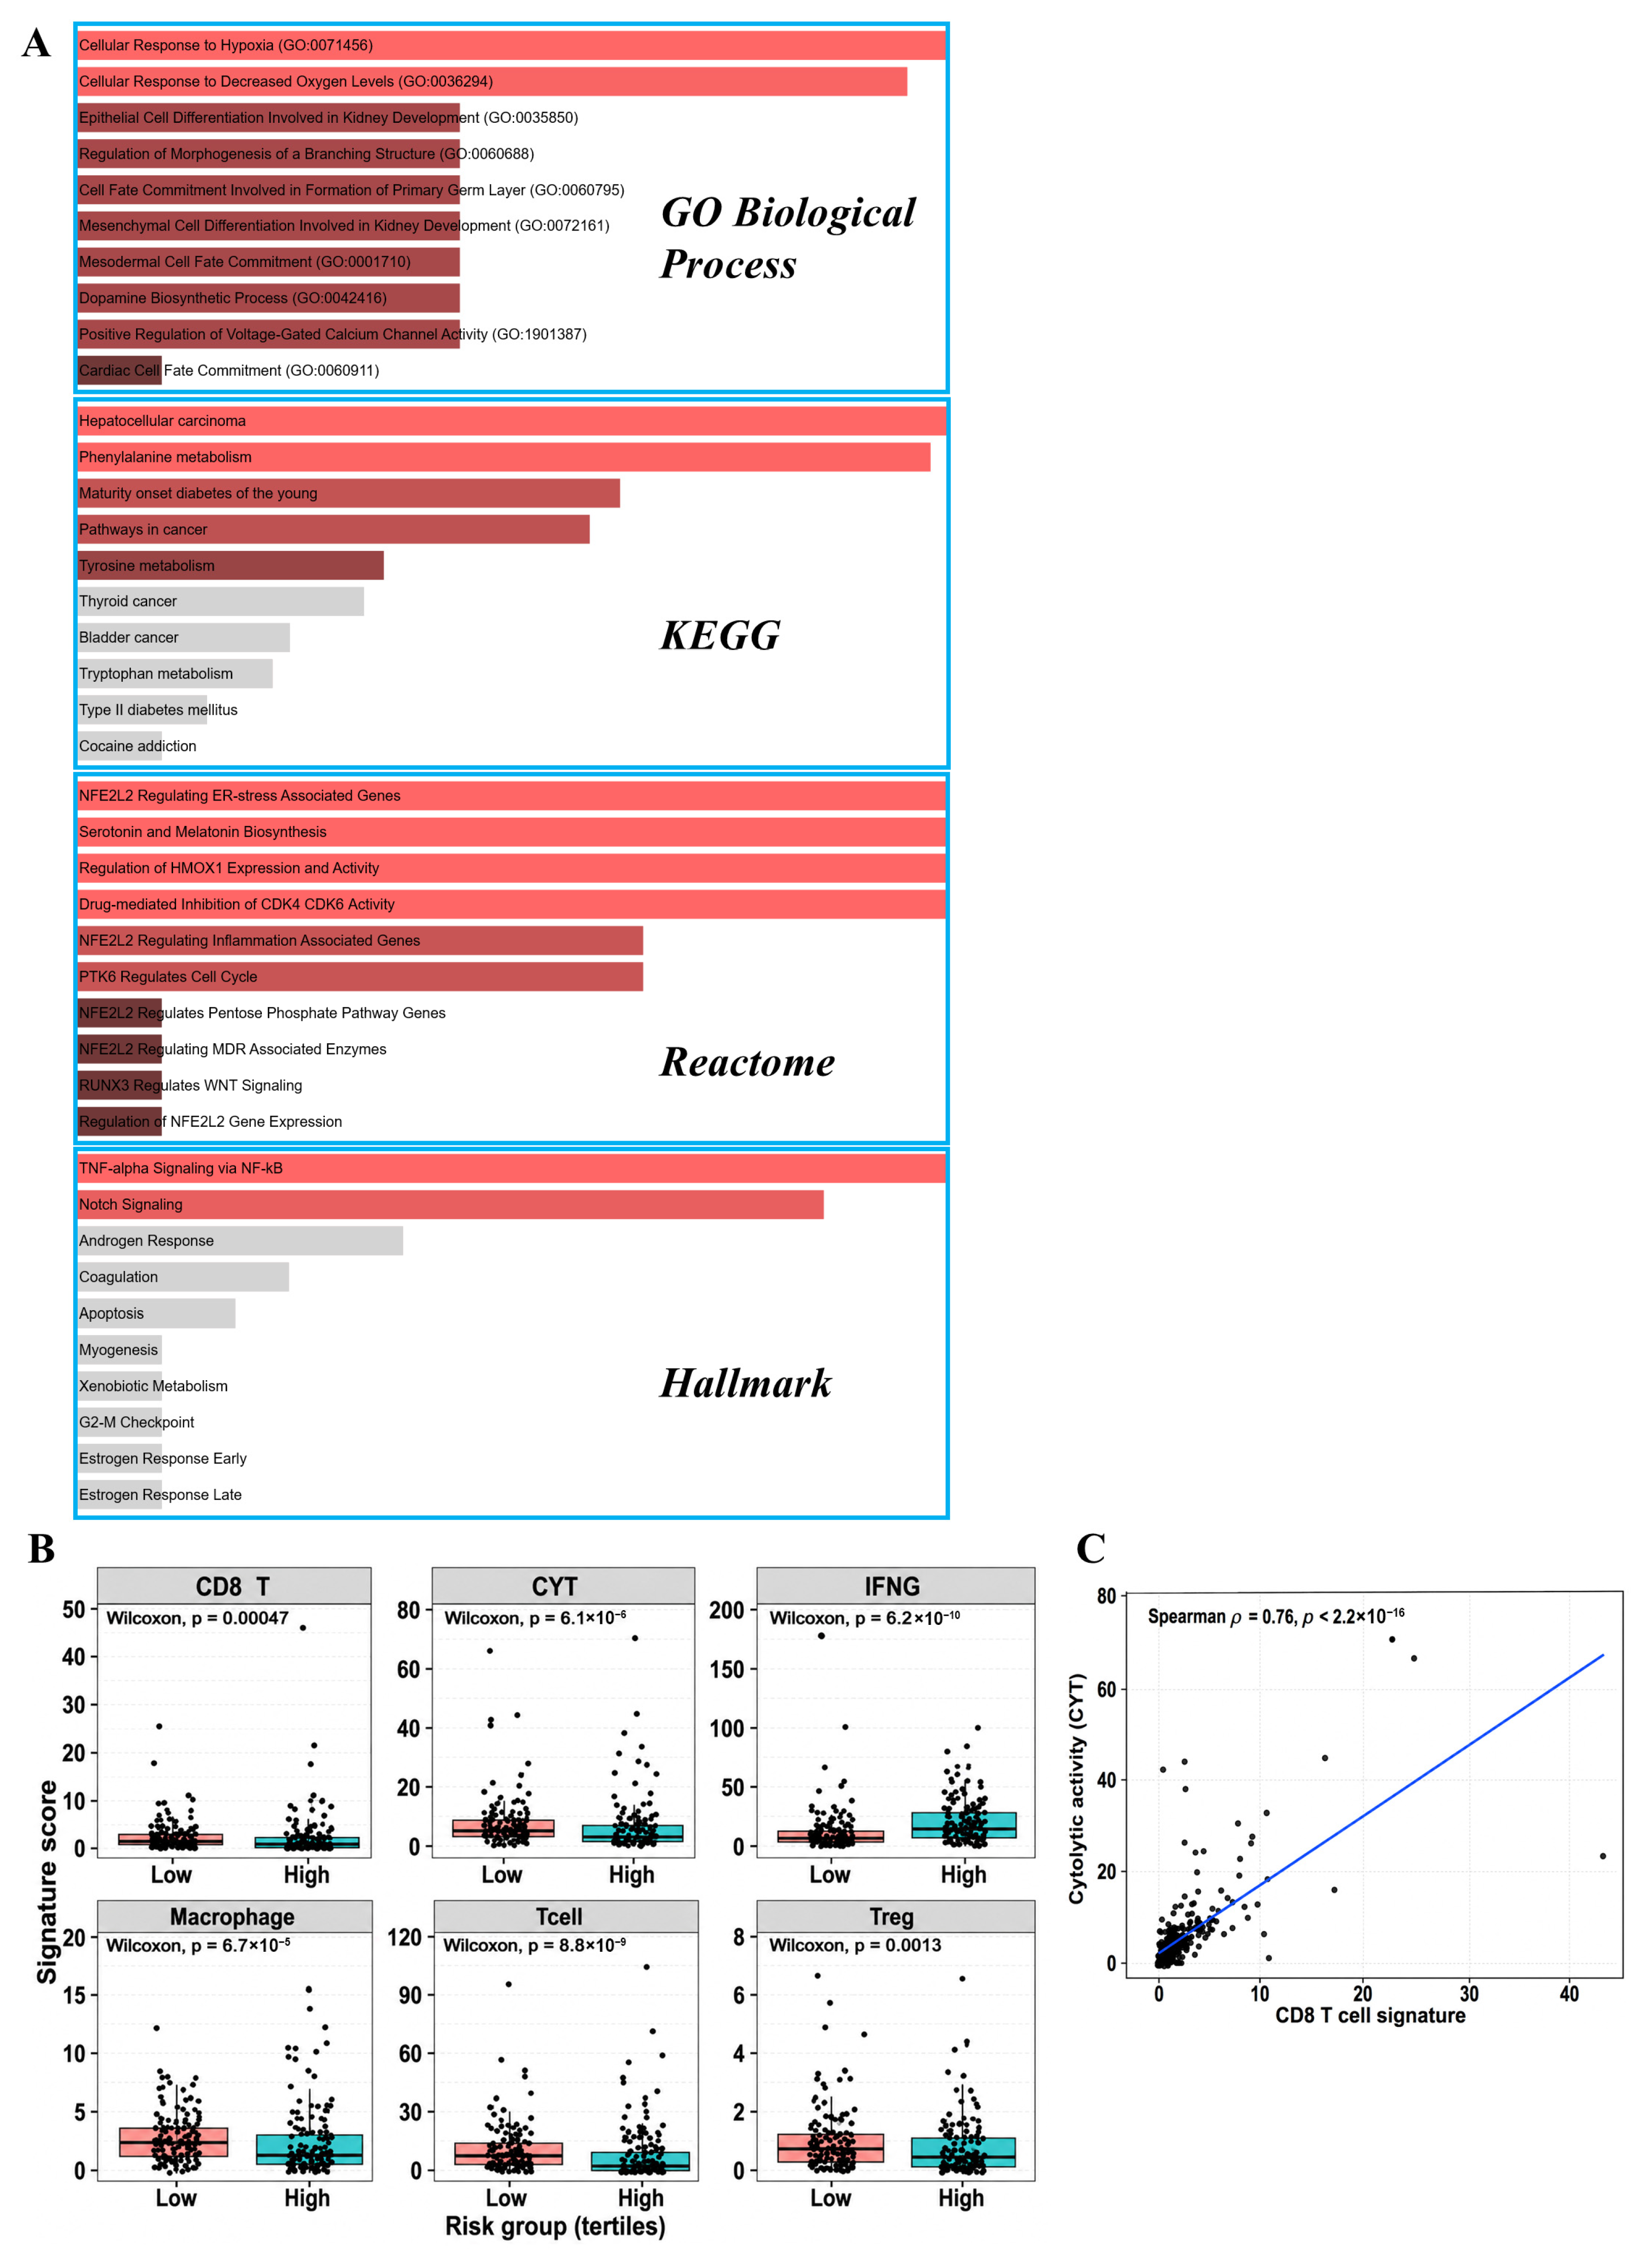
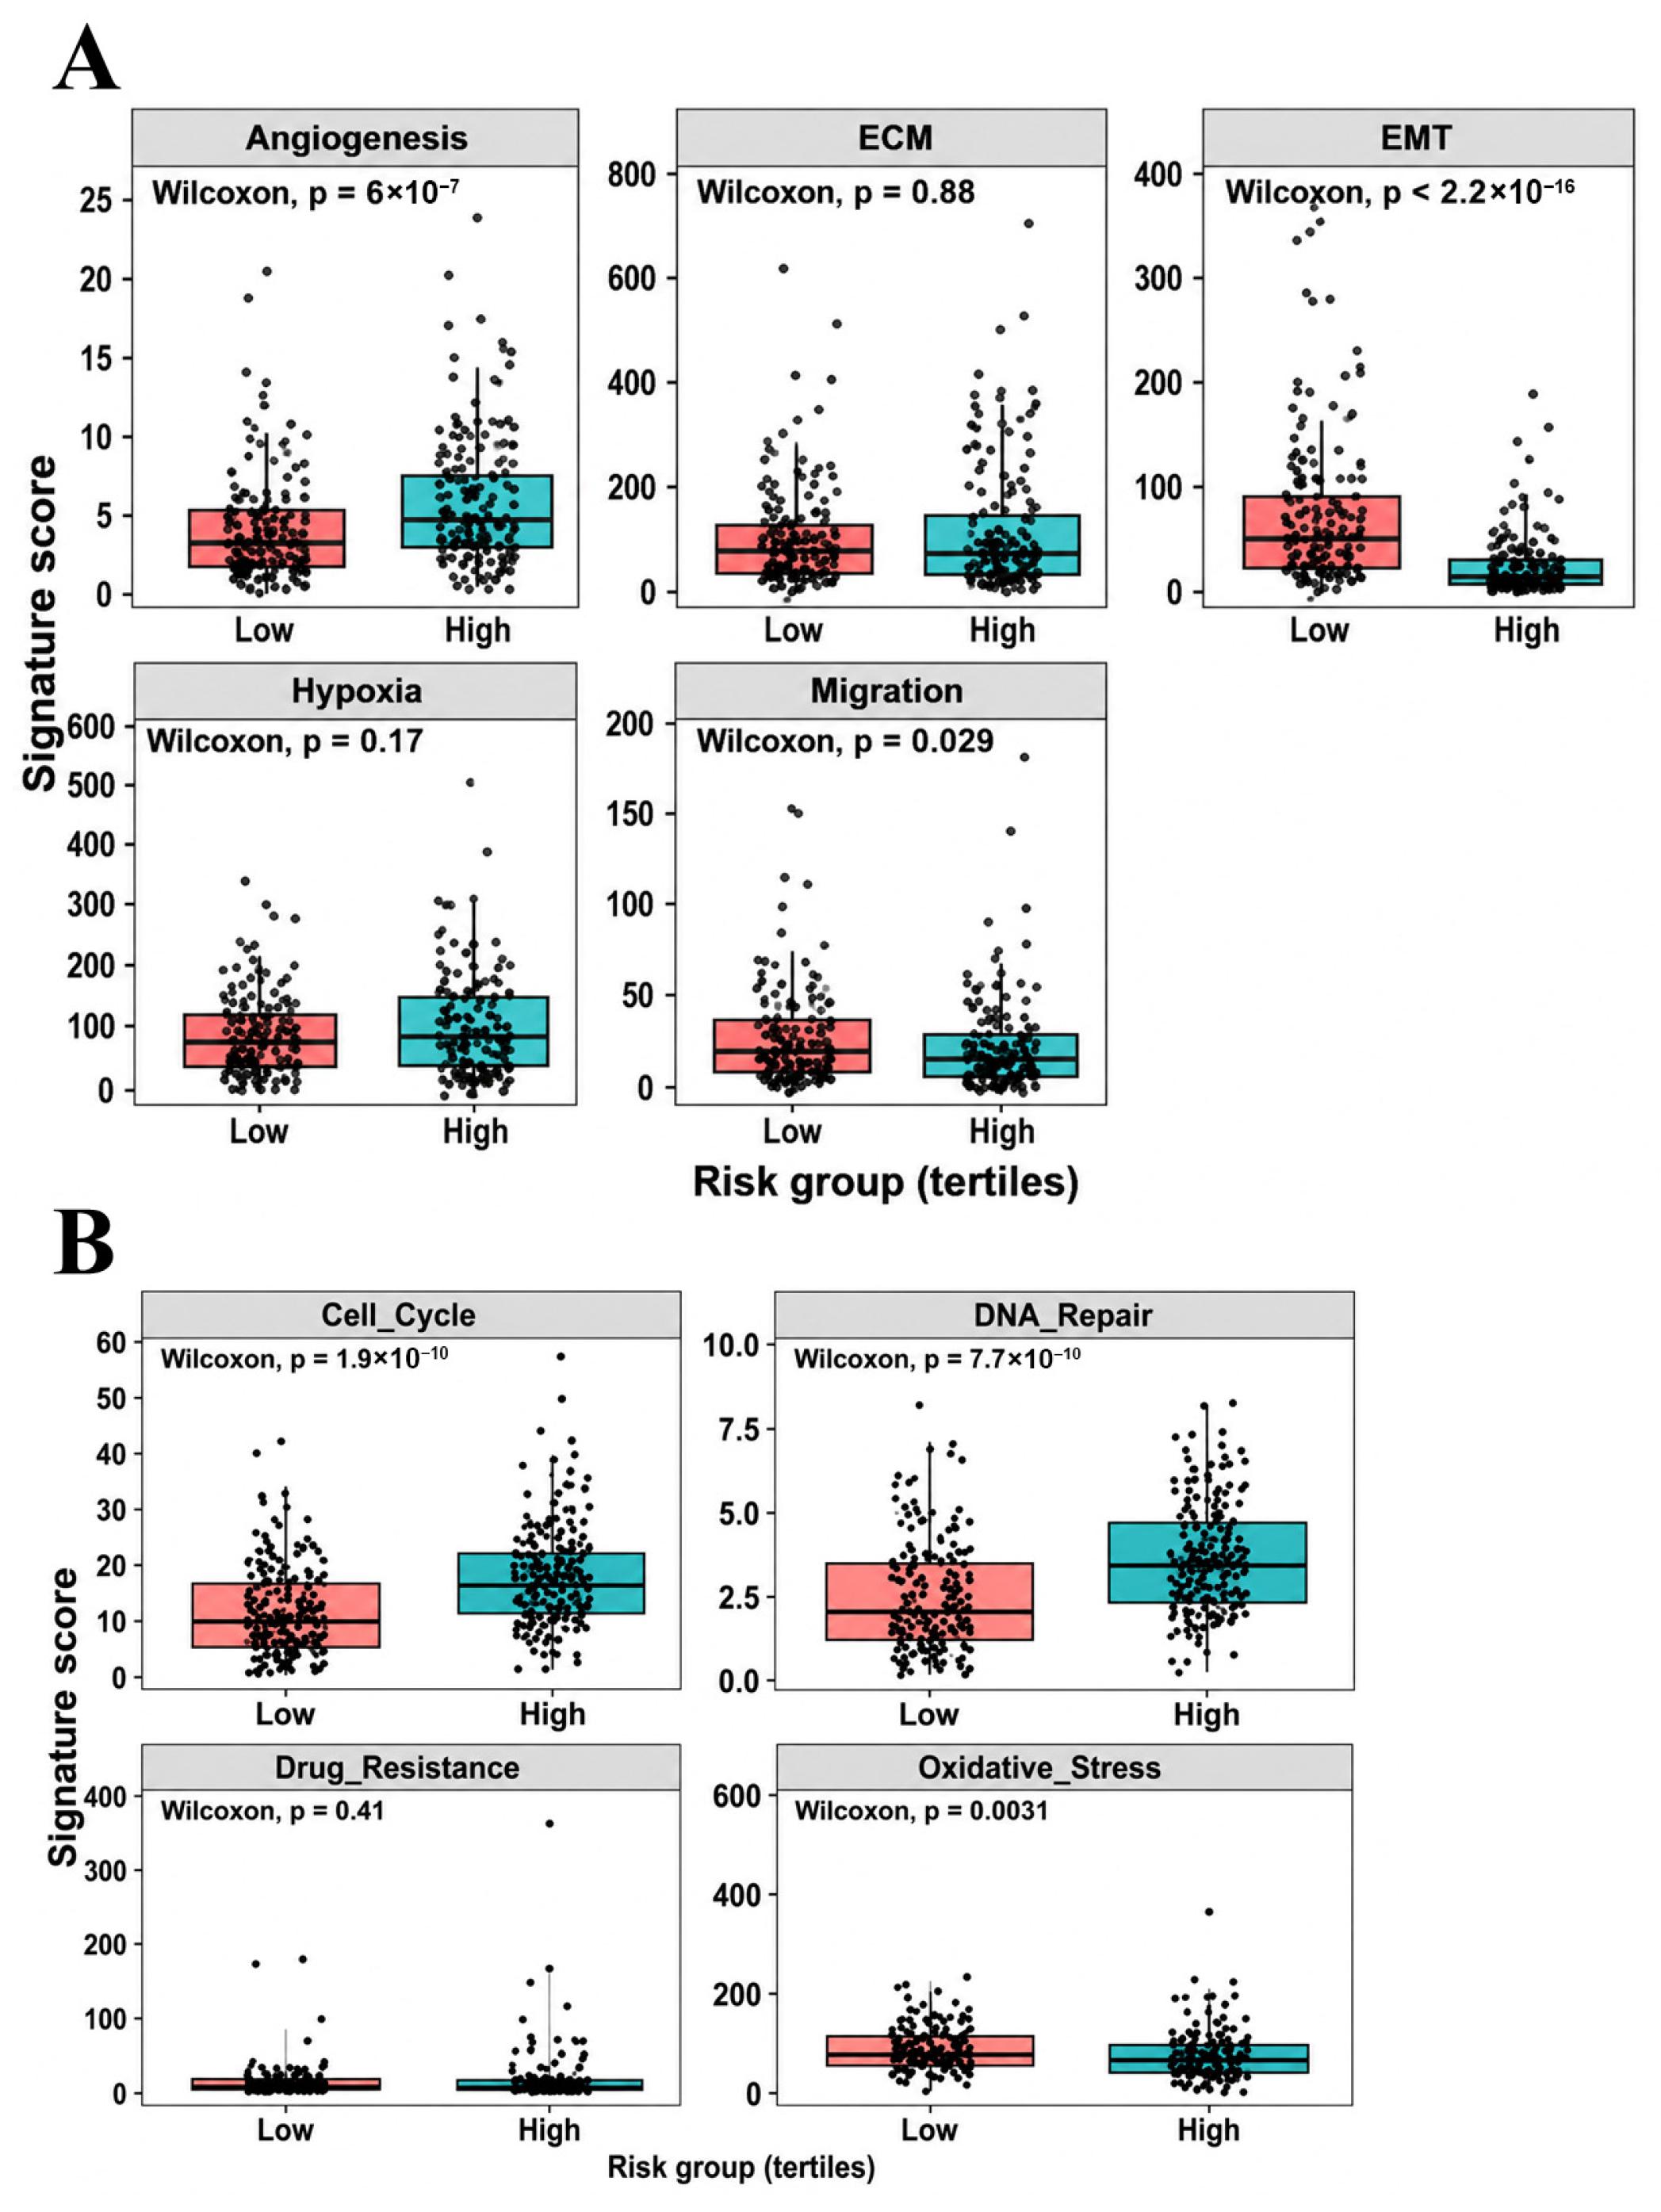
Figure 9). Rather than reflecting a single dominant process, the signature defines a coordinated high-risk transcriptomic state characterized by the coexistence of immune-associated inflammatory signaling and tumor-intrinsic adaptation programs. One possible interpretation is that preserved IFNG-associated signaling reflects inflammatory stimulation or immune recognition, whereas reduced CD8 T cell-related and cytotoxic programs suggest a failure of downstream effector immune execution. In this context, high-risk tumors may maintain an inflammatory transcriptional background while simultaneously acquiring tumor-intrinsic proliferative, DNA repair, and stress-adaptive programs that reduce the effectiveness of antitumor immunity. This dissociation may therefore represent a state in which immune activation signals are present but insufficient to produce coordinated cytotoxic immune activity. This interpretation is supported by risk-stratified functional analyses (
Figure 4), which demonstrated preserved IFNG-related signaling alongside attenuated effector immune programs and enhanced proliferation- and stress-related pathways.
More broadly, transcriptomic profiles should be interpreted as dynamic biological snapshots that may be shaped by tissue-level stress responses, hypoxia-associated signaling, angiogenic remodeling, metabolic adaptation, and recovery-like processes. These dynamic processes may influence the apparent relationship between inflammatory signaling and effector immune activity, particularly when functional states are inferred from bulk transcriptomic data. Therefore, immune–tumor uncoupling should be regarded as a dynamic tumor-state phenotype rather than a fixed or fully resolved functional mechanism.
The main contribution of this study is not the introduction of a new statistical modeling algorithm, but the identification of a biologically interpretable transcriptomic risk state in UCEC. Although the analytical framework used established approaches, including differential expression analysis, Cox regression, and LASSO-based feature selection, the 28-gene signature was not interpreted solely as a predictive score. Instead, it was used to characterize a high-risk tumor state marked by immune–tumor uncoupling, attenuated effector immune activity, and enhanced tumor-intrinsic proliferative and DNA repair-associated programs. This biologically oriented interpretation distinguishes the present study from purely predictive transcriptomic signature studies. Importantly, this framework highlights a functional dissociation between immune signaling and effective antitumor immune execution, rather than classical immune-inflamed or immune-desert phenotypes [
22,
23,
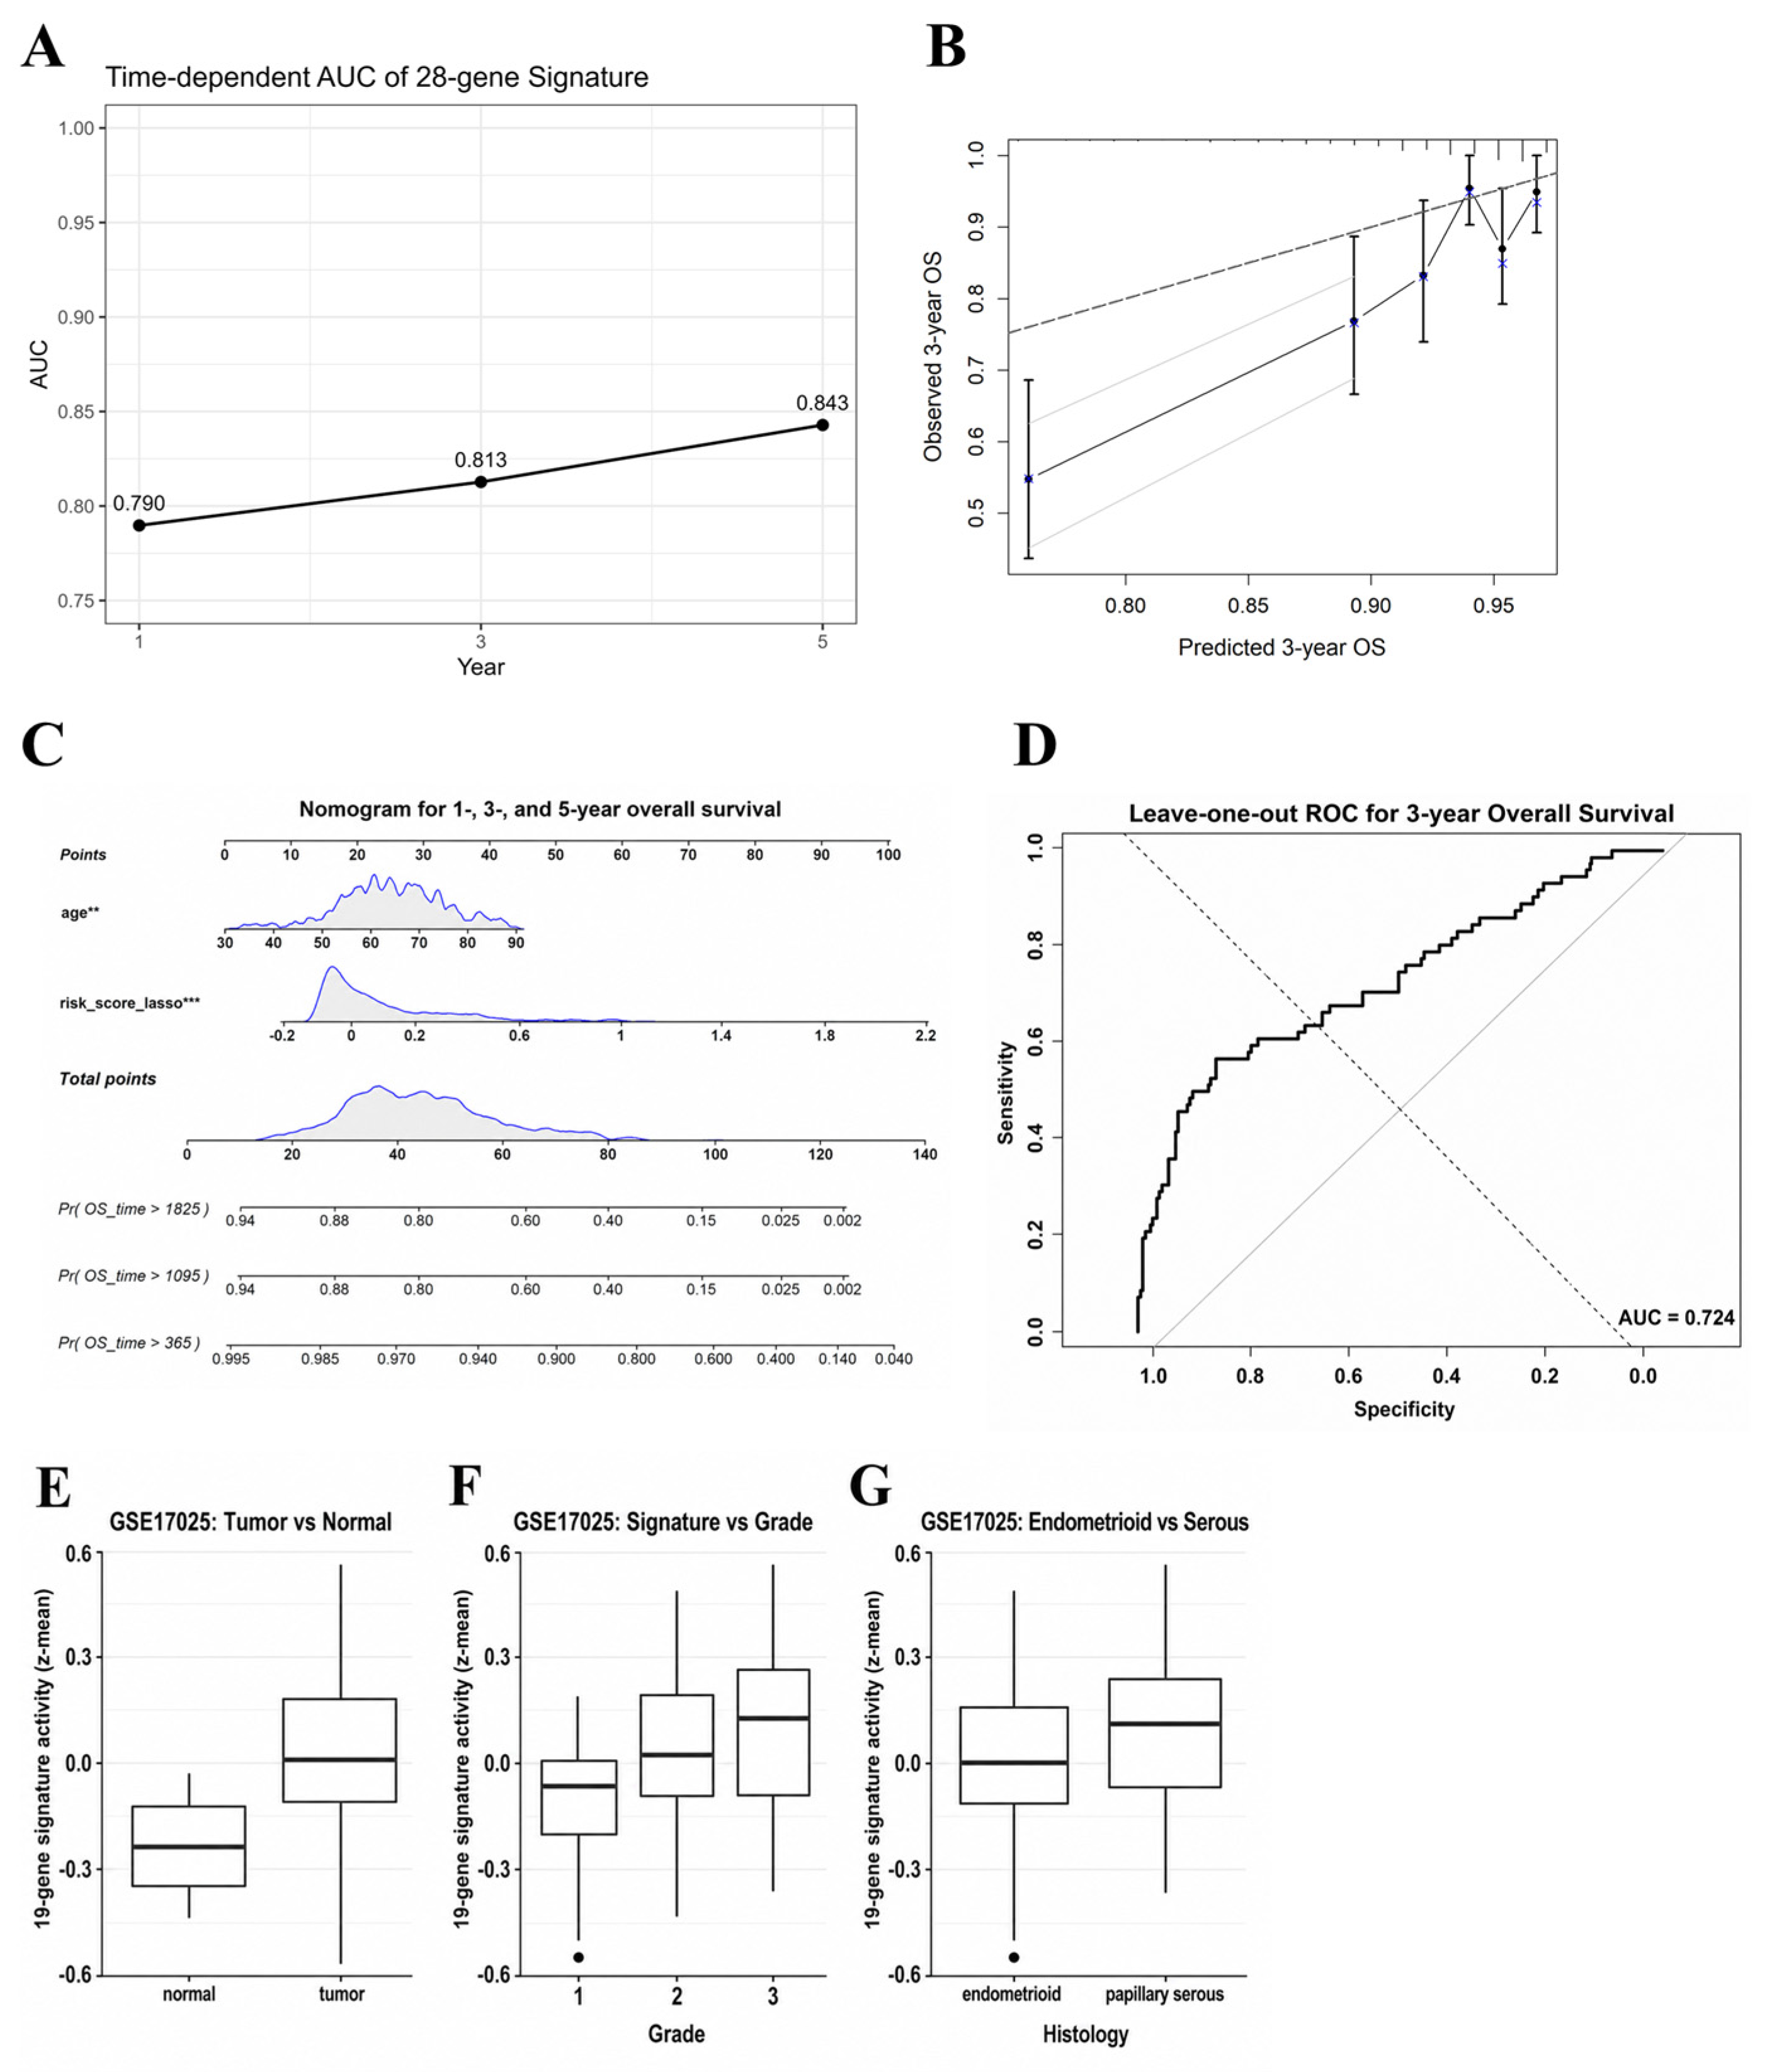
24]. Consistent tumor–normal separation and grade-associated trends observed in an independent cohort (GSE17025), despite reduced gene coverage, further support that this transcriptional program reflects conserved features of disease progression.
Previous transcriptome-based prognostic signatures in UCEC have primarily emphasized predictive performance metrics such as C-index or time-dependent AUC [
14]. However, cross-study comparisons are limited by heterogeneity in cohorts, platforms, and analytical strategies. Many models rely on survival-driven feature selection, which may not capture biologically coherent or system-level programs, and often provide limited mechanistic insight [
13,
25,
26]. In contrast, the present study identifies a biologically interpretable high-risk transcriptomic state, emphasizing robustness and integrative biological characterization rather than direct benchmarking.
Although the present study was based on tumor bulk transcriptomic data rather than germline genotyping, the identified transcriptional programs can be interpreted in the context of prior GWAS and genetic association studies of endometrial cancer. GWAS studies have identified multiple susceptibility loci for endometrial cancer, including regions near CYP19A1, HNF1B, MYC, KLF5, AKT1, EIF2AK4, and related candidate genes, implicating hormonal regulation, transcriptional control, cell proliferation, and oncogenic signaling in disease susceptibility. While these germline susceptibility loci are not expected to directly overlap with a tumor-derived prognostic expression signature, they provide complementary evidence that dysregulated proliferative and tumor-intrinsic programs are central to endometrial cancer biology. Consistent with this concept, our high-risk transcriptomic state was characterized by elevated cell cycle and DNA repair-associated programs, together with immune–tumor uncoupling. Therefore, the present findings should be viewed as complementary to GWAS-based susceptibility studies: GWAS highlights inherited risk architecture, whereas our transcriptomic analysis captures tumor-state programs associated with disease progression and prognosis.
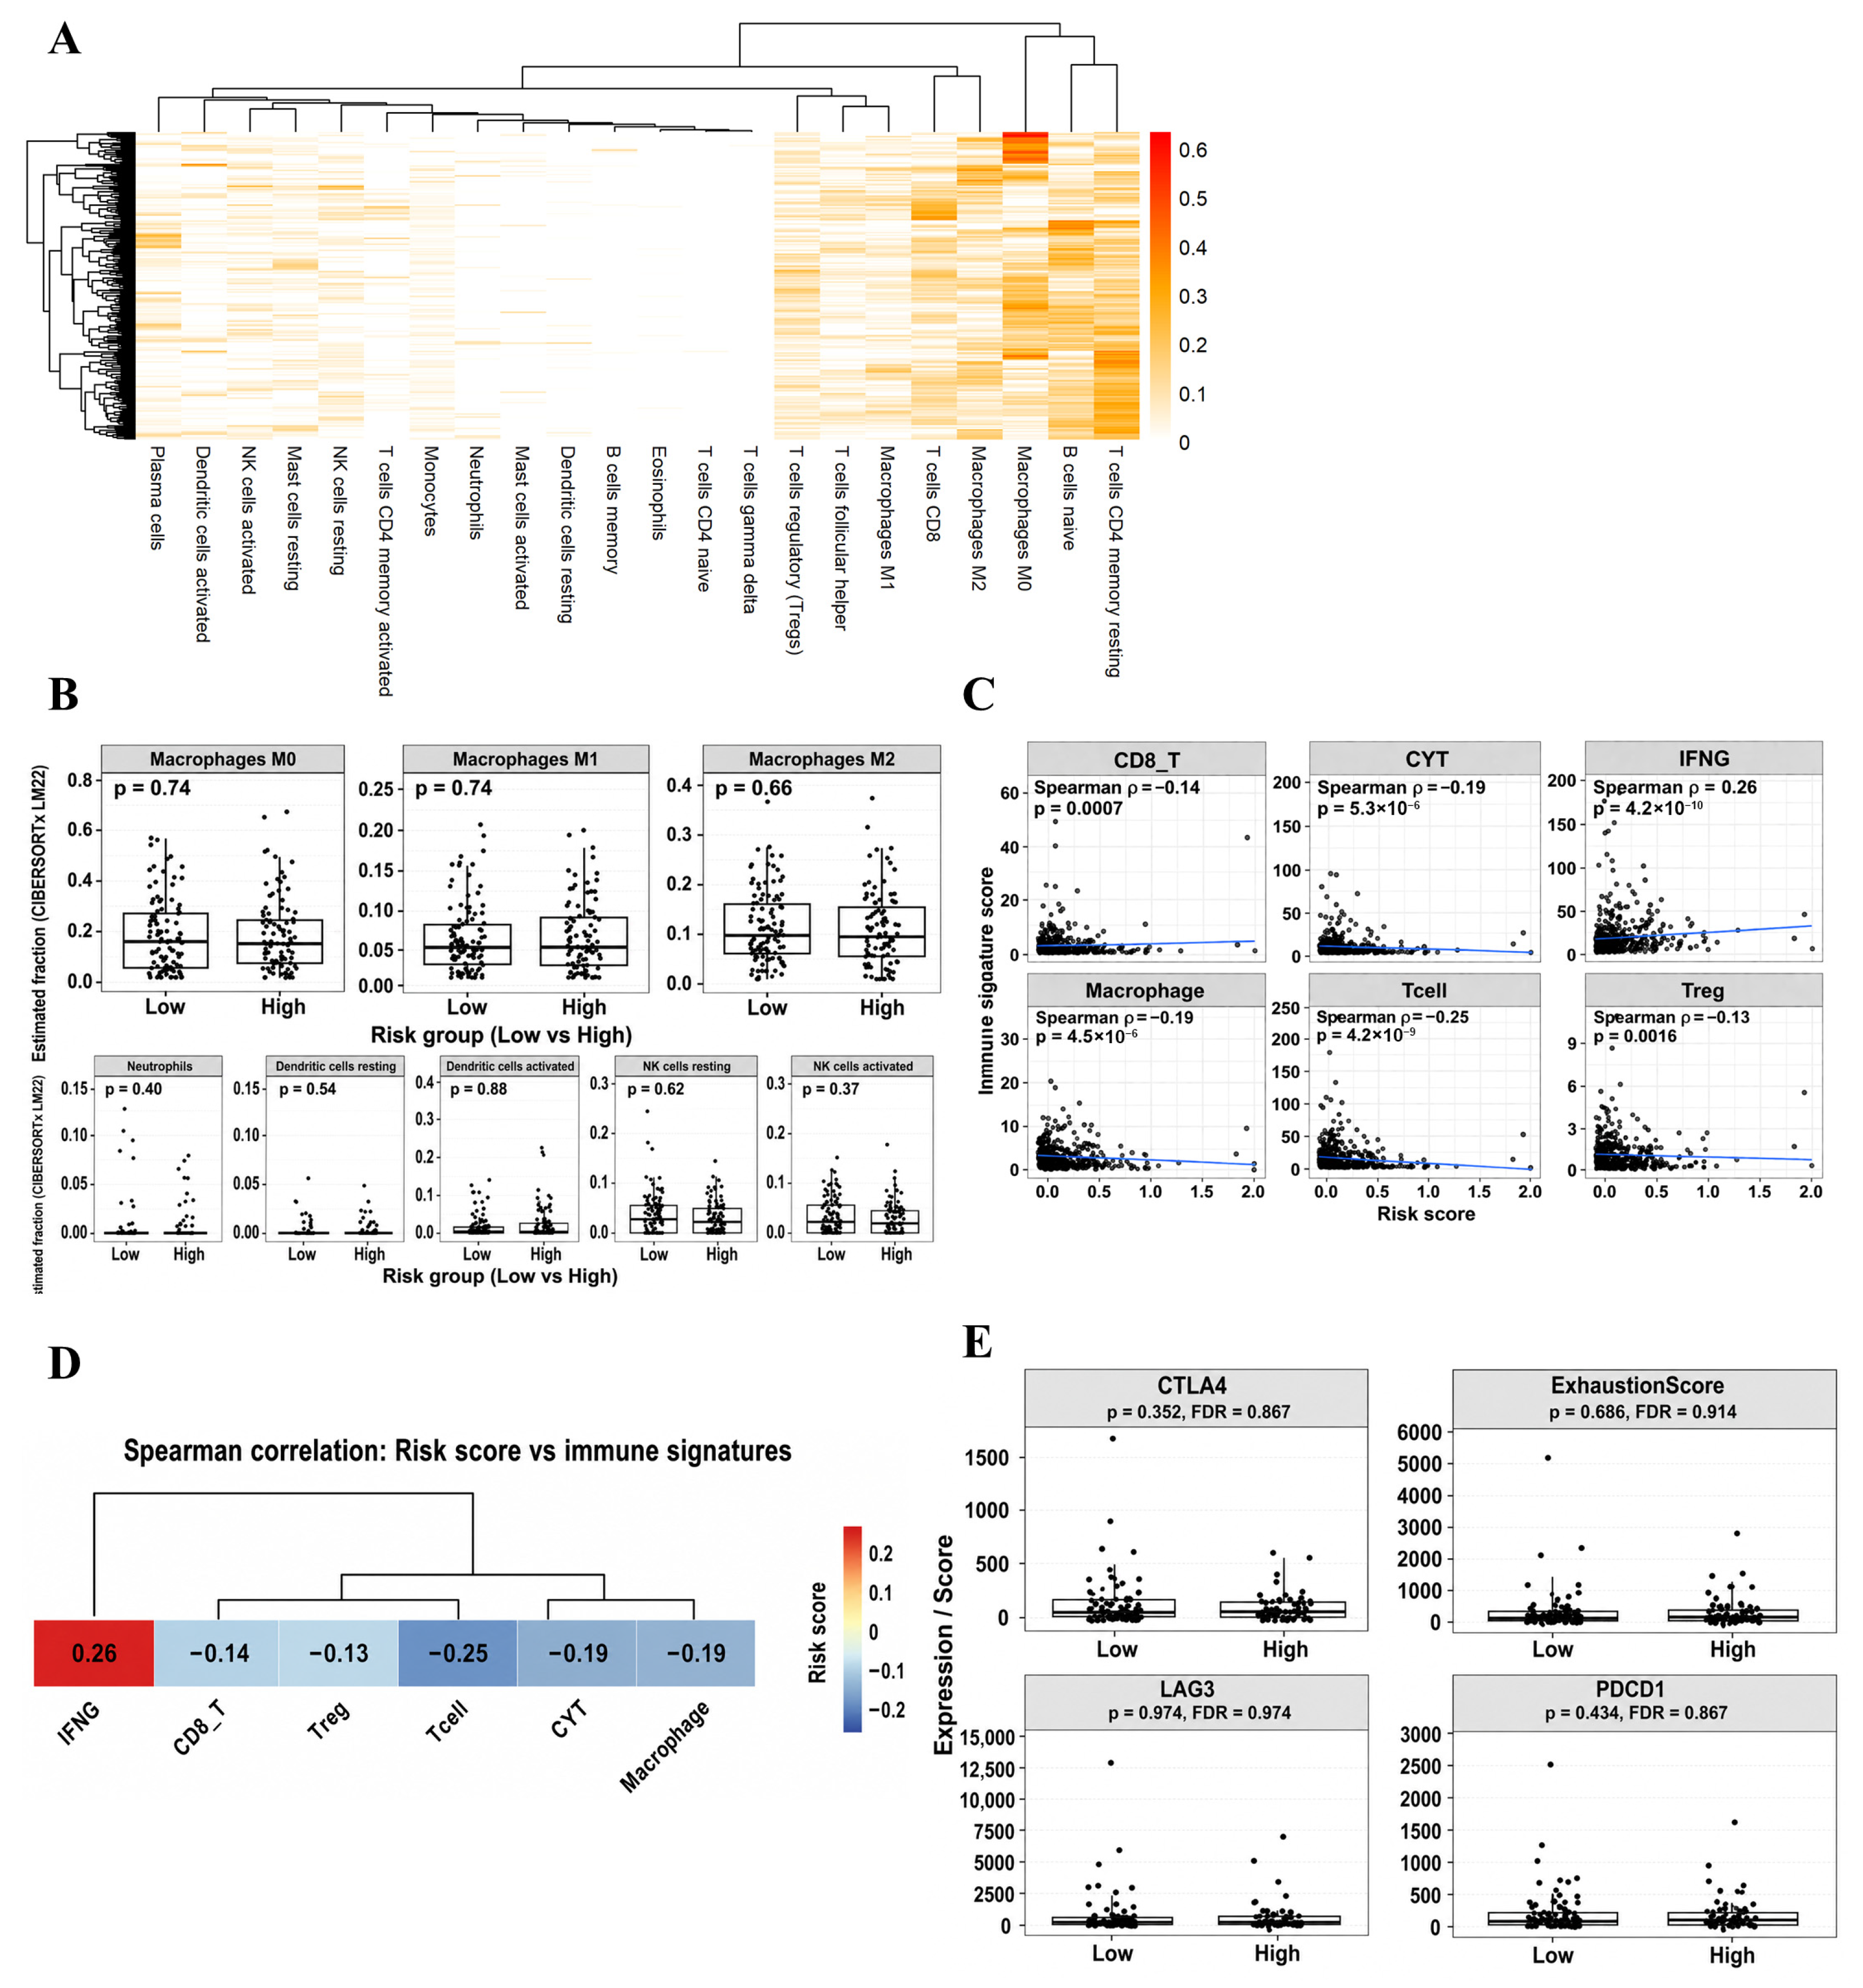
At the immune level, high-risk tumors exhibited elevated IFNG-associated signaling but reduced effector immune programs, including CD8 T cell signatures, cytotoxic activity, and overall T cell-related transcriptional profiles. Notably, canonical exhaustion markers (
PDCD1,
CTLA4, and
LAG3) and composite exhaustion scores did not differ between risk groups (
Figure 5). These findings define an IFNG-high but effector-low immune context, indicating a functional disconnect between inflammatory signaling and immune execution. However, these findings should be interpreted as transcriptomic evidence of an immune–tumor uncoupling phenotype rather than direct functional proof of impaired antitumor immunity. This immune context is not consistent with classical T cell exhaustion [
27,
28], but instead reflects a state of chronic immune pressure and sustained interferon exposure, in which inflammatory signals persist without coordinated cytotoxic responses. Such IFN-γ-adapted states have been increasingly recognized as context-dependent immune phenotypes associated with functional constraint rather than effective tumor clearance [
29]. In contrast, tumor-intrinsic programs emerged as dominant drivers of adverse outcomes. High-risk tumors showed coordinated upregulation of angiogenesis, cell cycle progression, and DNA repair pathways (
Figure 4), indicating enhanced proliferative capacity and stress tolerance. These features likely outweigh any protective effects of inflammatory signaling, contributing to disease progression [
30]. Notably, this aggressive phenotype was not associated with uniform activation of invasion-related programs. Although angiogenesis-related signatures were elevated, EMT- and migration-associated programs were not consistently activated, suggesting that poor prognosis is driven by selective engagement of proliferative and vascular pathways rather than global mesenchymal transition [
31]. Similarly, although hypoxia-related terms were enriched at the annotation level, hypoxia-associated transcriptomic scores did not differ significantly between groups, indicating partial or context-dependent pathway involvement. This highlights the importance of distinguishing enrichment signals from coordinated functional activation when interpreting gene signatures [
13,
21].
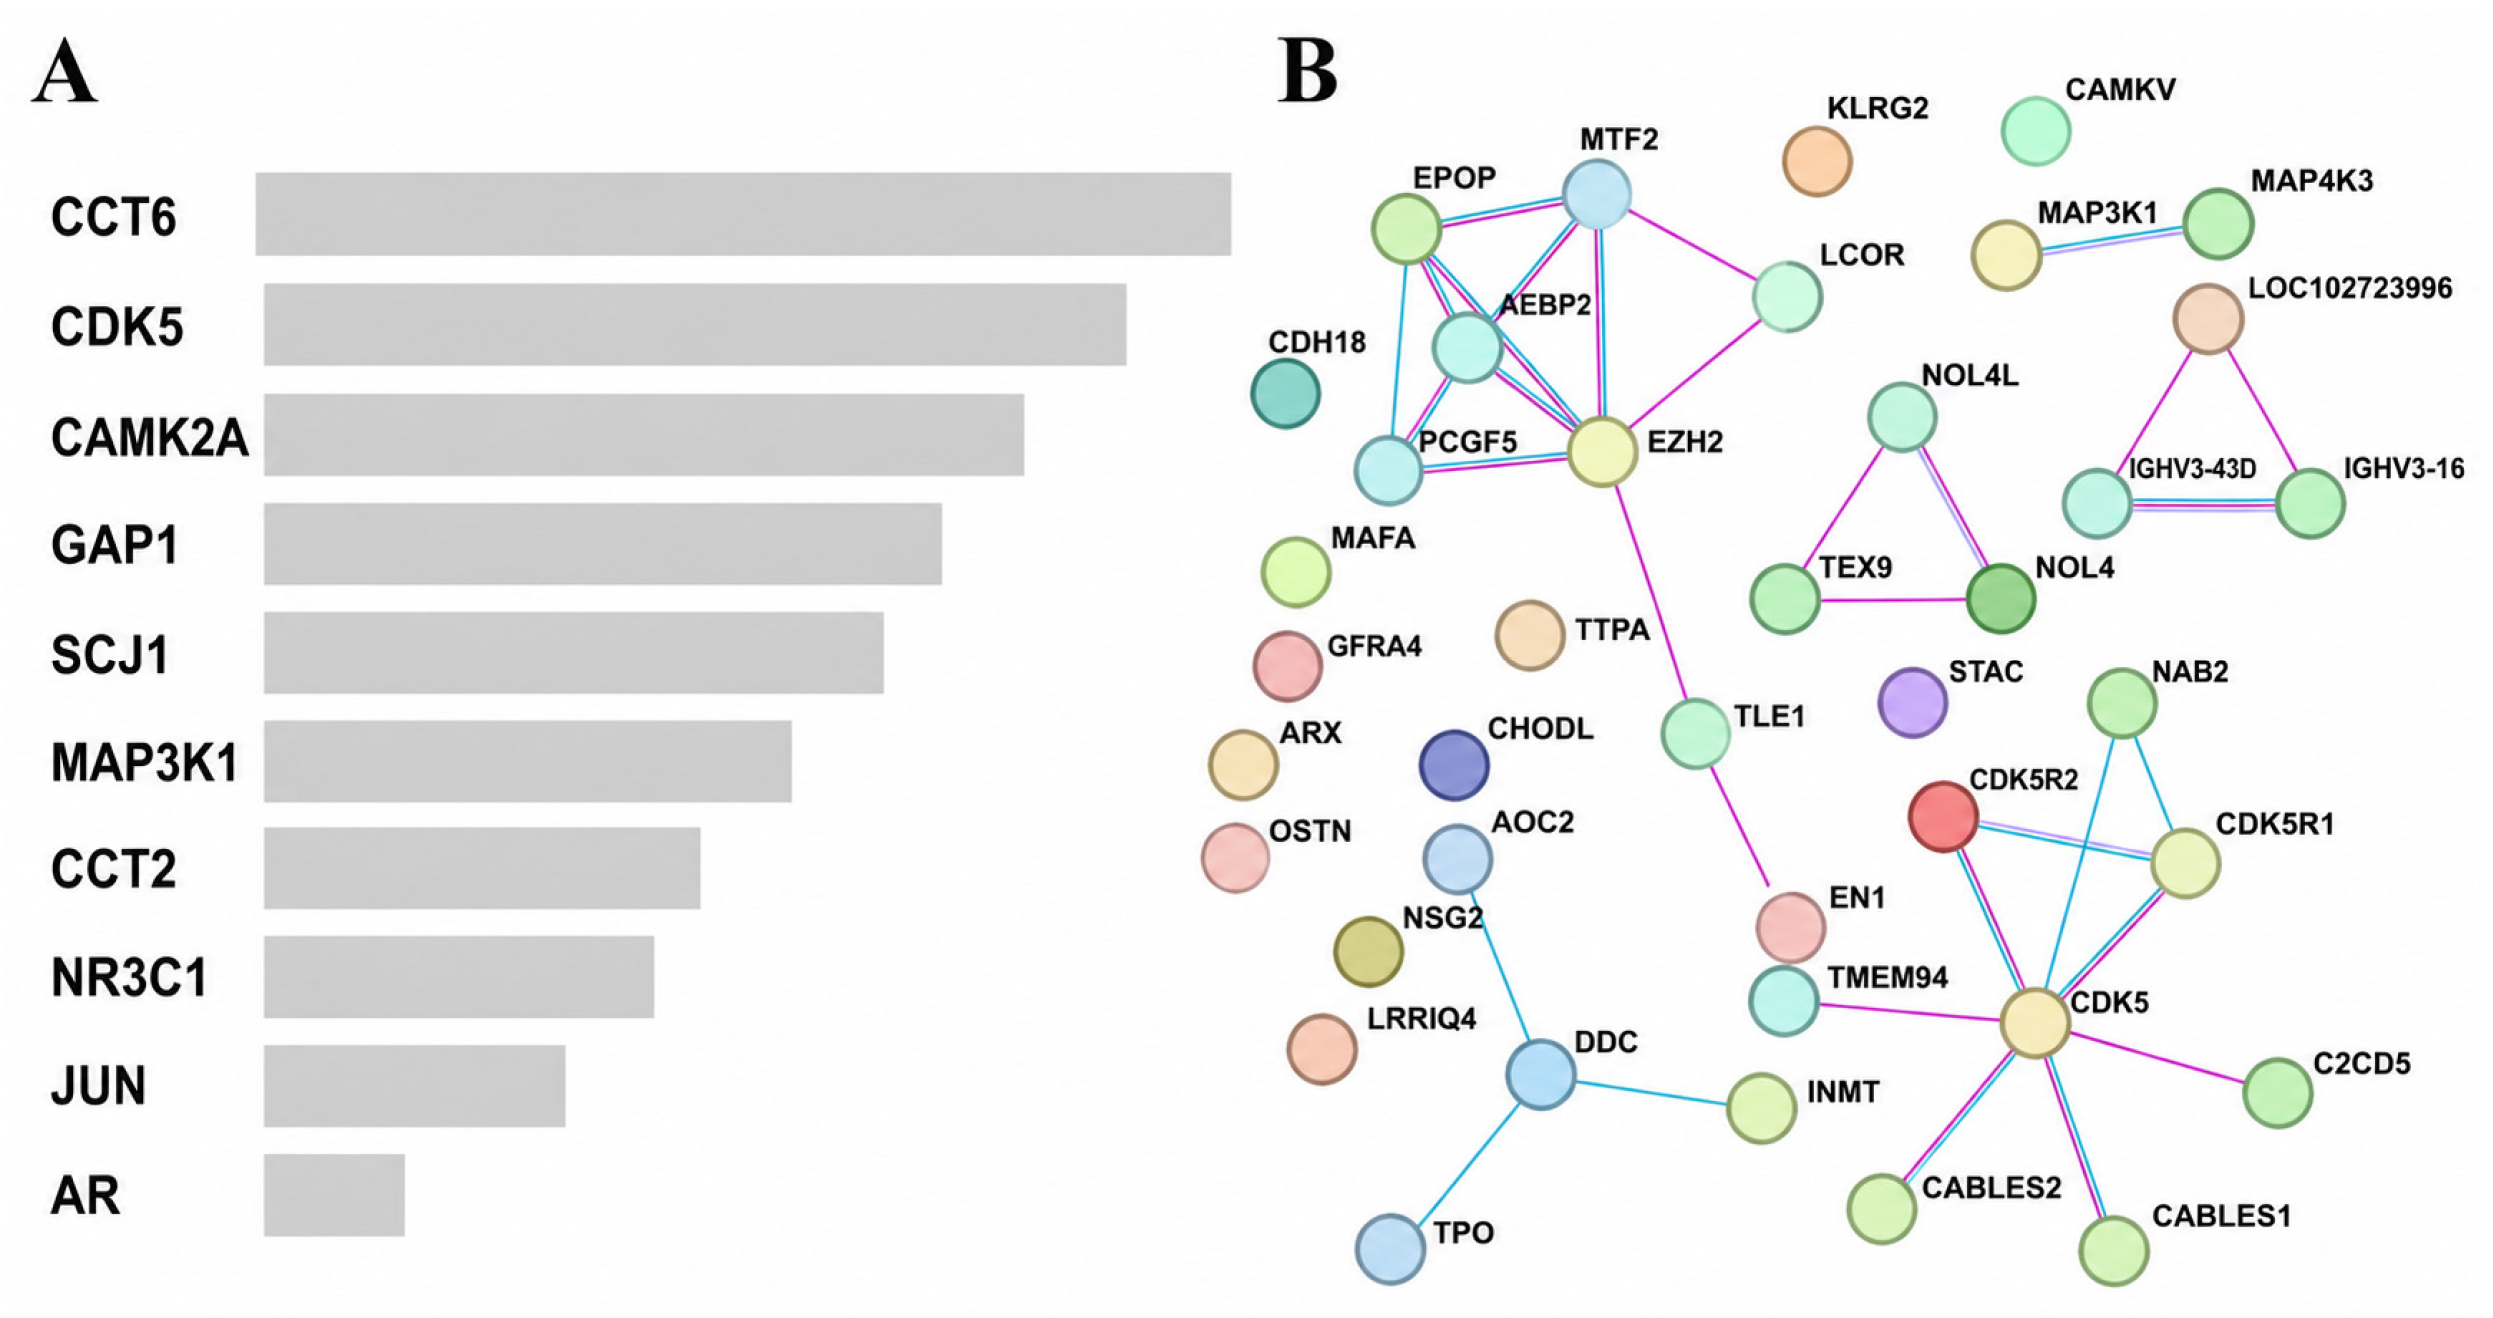
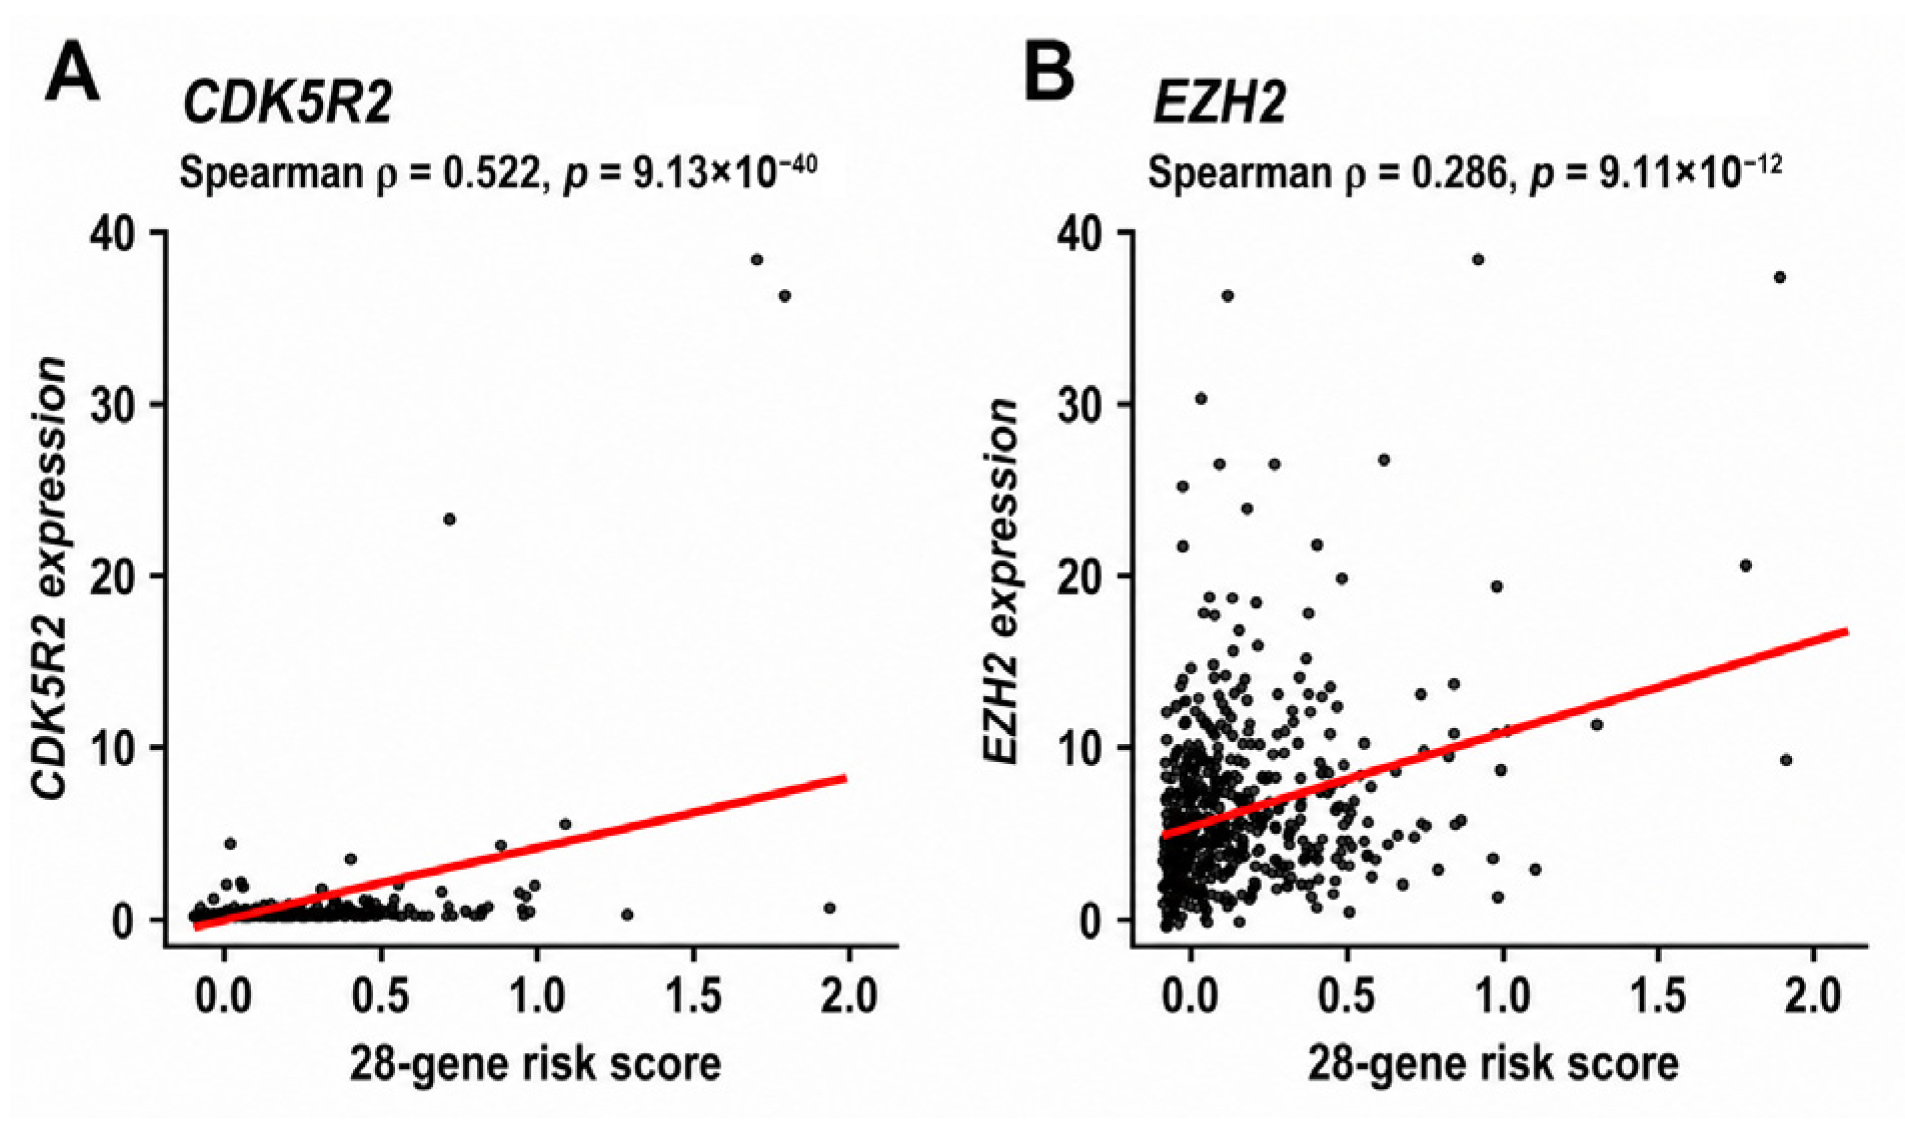
At the systems level, PPI network analysis (
Figure 7) identified regulatory hubs such as
EZH2, an epigenetic regulator [
32,
33], and a
CDK5-centered axis involving
CDK5R2 [
34,
35], supporting the biological coherence of the signature. Their association with higher risk scores further indicates that prognostic relevance arises from coordinated regulatory networks rather than individual genes. Collectively, these findings support a model in which the 28-gene signature defines a refined high-risk transcriptomic state, where tumor-intrinsic proliferative and vascular programs dominate over functionally constrained immune signaling. This selective, rather than global, pathway activation underscores a non-uniform biological basis of poor prognosis.
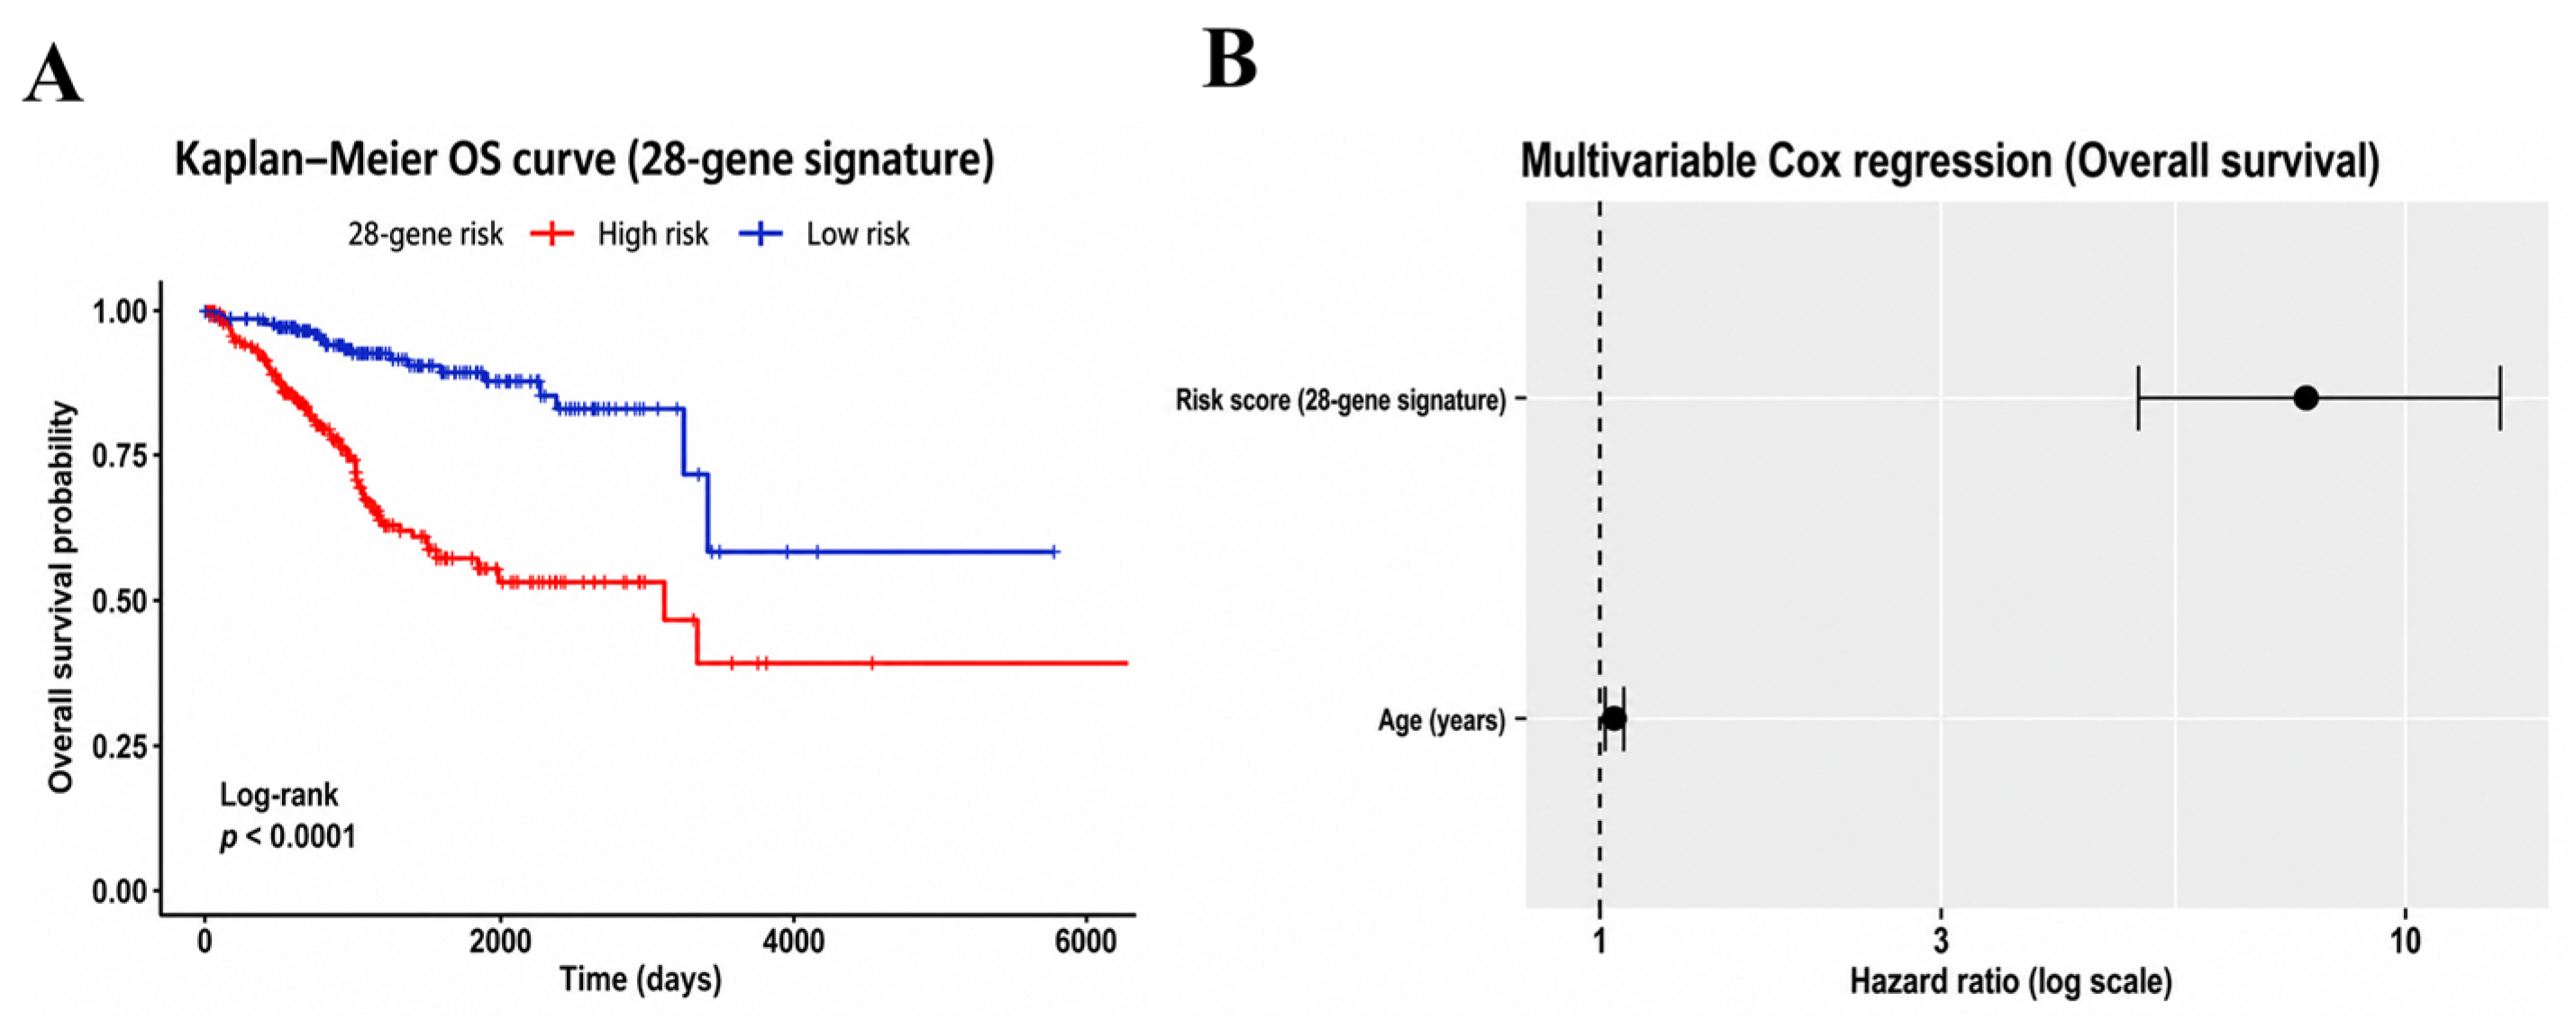
From an analytical perspective, this study highlights the value of integrative modeling strategies that capture coordinated gene behavior through multi-step approaches, including differential expression, survival screening, penalized modeling, and robustness assessment. From a clinical perspective, the risk score remained an independent prognostic factor after adjustment for stage and grade, suggesting additive value for refined risk stratification. Several limitations should be acknowledged. First, the present study was based on bulk transcriptomic mRNA-level data, and therefore cannot directly resolve protein-level regulation, spatial cellular organization, or functional immune activity within the tumor microenvironment. Second, external validation was performed using a microarray cohort with partial coverage of the 28-gene signature, and complete external survival validation of the full model was not feasible in this dataset. Nevertheless, the consistent associations between signature activity, tumor status, and histological grade support the biological and clinicopathological reproducibility of the underlying transcriptional program. Third, direct benchmarking against previously published UCEC prognostic signatures was not performed in the present study. Because existing models differ in gene composition, coefficient availability, transcriptomic platforms, preprocessing methods, and clinical endpoint definitions, rigorous head-to-head comparison would require harmonized datasets and standardized evaluation metrics. Therefore, while the present study emphasizes the biological interpretability of the 28-gene signature and its association with an immune–tumor uncoupling state, future studies will be required to determine its incremental predictive value relative to existing prognostic models. Fourth, a direct statistical correlation between the 28-gene risk signature and GWAS-derived polygenic risk scores could not be performed because matched germline genotype data and GWAS-derived risk scores were not available in the present analysis. Fifth, although the immune–tumor uncoupling phenotype was inferred from multiple transcriptomic analyses, functional experimental validation was not performed in the present study. Future studies integrating germline genetics, tumor transcriptomics, spatial profiling, proteomics, and experimental models may further clarify the biological mechanisms and clinical relevance of this transcriptomic risk state in UCEC.
In summary, poor prognosis in UCEC was associated with a transcriptomic tumor state characterized by increased proliferative and stress-adaptive programs alongside preserved inflammatory signaling but attenuated effector immune activity. This non-classical high-risk configuration supports the value of system-level transcriptomic analysis beyond performance-driven prognostic modeling and provides a framework for interpreting disease progression at the transcriptomic level. Further studies, including functional and experimental validation, are required to elucidate the underlying biological mechanisms and determine their clinical relevance.
4. Materials and Methods
4.1. Data Sources and Preprocessing
RNA sequencing (RNA-seq) expression profiles and corresponding clinical information for UCEC patients were obtained from The Cancer Genome Atlas (TCGA-UCEC) cohort, downloaded in December 2025. Only primary tumor samples with available overall survival (OS) data were included in downstream analyses. Patients lacking survival information or with incomplete clinical annotation were excluded.
Gene expression matrices were processed at the transcriptome-wide level. Gene identifiers were standardized to Ensembl gene IDs, and genes with consistently low expression across samples were filtered out prior to differential expression and survival analyses. All analyses were performed using R (version 4.5.2). Key analytical procedures were implemented using well-established R packages, including glmnet (v4.1-8) for LASSO Cox regression, survival (v3.5-7) for Cox proportional hazards modeling, and survivalROC (v1.0.3) for time-dependent receiver operating characteristic (ROC) analysis. Differential expression analyses were conducted using DESeq2 (v1.38.3), while data manipulation and visualization were performed using tidyverse (v2.0.0) and ggplot2 (v3.5.0). DESeq2 normalization was applied to raw count data to account for library size and compositional differences across samples [
36]. No additional batch correction was performed, as all samples were derived from a single TCGA cohort and processed using a unified sequencing and bioinformatics pipeline.
Genes with consistently low expression across samples were excluded prior to downstream analyses to reduce noise and improve statistical robustness. Specifically, genes were retained if they showed detectable expression in a sufficient proportion of tumor samples, resulting in 20,318 expressed genes used for subsequent differential expression and survival analyses. For downstream survival modeling and risk score construction, count-based normalized expression values were used. FPKM and TPM values were not adopted, as these measures are less appropriate for cross-sample comparisons and regression-based survival analyses due to potential compositional bias. Instead, count-based normalization approaches were consistently applied throughout the study to ensure statistical robustness and comparability across samples. Gene-set-based signature scoring and downstream functional analyses were performed using custom R scripts in conjunction with publicly available gene signature resources.
4.2. Identification of Stage-Associated Differentially Expressed Genes
To identify genes associated with disease progression, patients were stratified according to pathological stage into early-stage and late-stage groups. Differential expression analysis was conducted by comparing normalized RNA-seq expression levels between these two groups. Genes exhibiting statistically significant expression differences were defined as stage-associated differentially expressed genes (DEGs).
The global distribution of DEGs was visualized using volcano plots, displaying log2 fold changes and false discovery rate (FDR)-adjusted p-values. Genes with an absolute log2 fold change ≥ 1 and a FDR < 0.05 were defined as differentially expressed.
4.3. Survival-Associated Gene Screening
To identify genes associated with patient prognosis, univariate Cox proportional hazards regression was performed for each gene using overall survival as the endpoint. Genes with statistically significant associations with OS were defined as survival-associated genes. Genes with a univariate Cox regression p value < 0.05 were considered survival-associated genes and retained for downstream analysis.
Candidate genes for prognostic model construction were obtained by intersecting stage-associated DEGs with survival-associated genes, thereby enriching for genes with both biological relevance to tumor progression and clinical relevance to patient outcome.
4.4. Construction of the Prognostic Gene Signature
Candidate genes were first evaluated using univariate Cox regression to estimate individual hazard ratios. To reduce multicollinearity and mitigate overfitting, least absolute shrinkage and selection operator (LASSO) Cox regression was applied using 10-fold cross-validation.
Two commonly used penalty parameters were evaluated: the minimum criteria (λ_min), which yields the lowest cross-validated partial likelihood deviance, and the one-standard-error criterion (λ_1se), which favors a more parsimonious model. In this study, λ_min was selected to retain genes with potential biological relevance while maintaining optimal model performance, as our primary objective was not only risk prediction but also downstream biological and mechanistic interpretation. LASSO Cox regression was performed with an alpha value of 1 using the glmnet package, and cross-validation was conducted with a fixed random seed (seed = 10403) to ensure reproducibility. The genes with non-zero coefficients under λ_min were subsequently subjected to stepwise multivariable Cox regression to further refine the model. This integrative approach resulted in the construction of a final 28-gene prognostic signature.
4.5. Risk Score Calculation and Patient Stratification
A prognostic risk score was calculated for each patient as a weighted sum of expression levels of the 28 genes, with weights corresponding to their Cox regression coefficients. For primary survival analyses and clinical association testing, patients were dichotomized into high-risk and low-risk groups using the median risk score to ensure balanced group sizes and robust statistical power. To further assess whether the risk score reflected a continuous biological gradient rather than an arbitrary binary cutoff, additional stratification into tertiles (low, intermediate, and high risk) was performed for selected analyses evaluating risk-dependent trends. Baseline clinicopathological characteristics of the dichotomized risk groups are summarized in
Table S4, and the multivariable Cox regression model incorporating the 28-gene risk score, FIGO stage, and tumor grade is presented in
Table S5.
The prognostic risk score was calculated for each patient as a linear combination of gene expression levels weighted by their corresponding regression coefficients derived from the final Cox model:
where βi represents the regression coefficient of gene i. The full list of coefficients used for risk score calculation is provided in
Table S6.
4.6. Survival Analysis and Model Evaluation
Kaplan–Meier survival analysis and log-rank tests were used to compare overall survival between risk groups. Univariate and multivariable Cox proportional hazards regression analyses were performed to assess whether the risk score was independently associated with survival after adjustment for clinical covariates, including age.
The proportional hazards assumption of the Cox regression models was evaluated using Schoenfeld residual-based global tests, and no significant violations were detected, supporting the validity of the Cox proportional hazards models applied in this study. Time-dependent ROC curves were generated to evaluate the predictive performance of the 28-gene signature at 1-, 3-, and 5-year time points. Model calibration and discrimination were further assessed using nomogram analysis and area under the curve (AUC) metrics.
To evaluate model robustness at the sample level, sample-level leave-one-out cross-validation (LOO-CV) was performed by iteratively excluding one patient at a time, refitting the prognostic model on the remaining samples, and recalculating the 3-year time-dependent AUC. In addition, leave-one-gene-out sensitivity analysis was conducted as a complementary robustness assessment, in which each gene was sequentially removed from the 28-gene signature and the resulting change in 3-year AUC (ΔAUC) was evaluated to assess the contribution of individual genes to overall model performance.
4.7. External Biological and Clinicopathological Validation
An independent microarray dataset (GSE17025; downloaded in January 2026) was used for external validation. After probe-to-gene mapping, only genes from the original 28-gene signature that were available on the GSE17025 platform were retained, resulting in a 19-gene subset for validation analyses. Expression values were standardized at the gene level using z-score normalization to enhance comparability across platforms. Signature activity was calculated using the same z-score-based aggregation strategy as applied in the TCGA cohort, without any cross-cohort model refitting. Associations between signature activity and tumor–normal status, histological subtype, and tumor grade were evaluated using non-parametric statistical tests.
4.8. Functional Enrichment and Biological Pathway Analysis
To explore the biological relevance of the 28-gene signature, functional enrichment analyses were performed using the Enrichr web-based platform (
https://maayanlab.cloud/Enrichr/; accessed on 22 December 2025). Gene Ontology (GO), Kyoto Encyclopedia of Genes and Genomes (KEGG), Reactome, and Hallmark gene sets were queried to identify biological processes and pathways significantly overrepresented among the signature genes. Enrichment significance was evaluated using the statistical framework implemented in Enrichr, and enriched terms were ranked according to adjusted
p values. These enrichment analyses were used to provide functional context for the 28-gene signature, whereas downstream transcriptomic signature-based analyses were conducted independently using predefined marker gene sets, rather than enrichment-derived gene lists.
Protein–protein interaction (PPI) analysis was performed using the STRING database (version 12.0). To balance network connectivity and interaction reliability in a relatively small gene set, a confidence score cutoff of 0.300 was applied, which is slightly below the default medium-confidence threshold (0.400) but above low-confidence interactions. This setting allowed inclusion of biologically plausible interactions while avoiding excessive noise from weakly supported associations.
4.9. Immune-Related Signature Analysis
To characterize the immune context associated with the prognostic signature, immune-related transcriptomic signature scores were compared between low- and high-risk groups defined by the extreme tertiles of the risk score, a strategy adopted to enhance sensitivity for detecting risk-associated immune transcriptional differences. The analyzed signatures included those reflecting CD8+ T cell infiltration, cytotoxic activity (CYT), IFNG signaling, macrophage-associated programs, global T cell signatures, and regulatory T cell (Treg)-related signatures. Group-wise differences were evaluated using the Wilcoxon rank-sum test. In parallel, Spearman correlation analyses were performed to assess associations between continuous risk scores and immune signature scores, as well as to examine the internal coherence among immune activation-related metrics.
Immune cell fractions were estimated using CIBERSORTx (
https://cibersortx.stanford.edu/; accessed on 31 December 2025) with the LM22 signature matrix [
37]. Gene expression profiles derived from bulk RNA-seq data were used as input, with quantile normalization disabled, as recommended by the developers for RNA-seq-based analyses. To enhance computational stability and reduce noise, the mixture matrix was restricted to genes overlapping with the LM22 reference. Statistical significance was evaluated using 100 permutations. In addition to predefined immune transcriptomic signatures, selected LM22 immune cell subsets, including macrophage polarization states (M0, M1, and M2), neutrophils, dendritic cell states (resting and activated), and NK cell states (resting and activated), were further examined to explore whether risk stratification was associated with specific immune cell compositions. These analyses were conducted in an exploratory manner and are reported in the
Supplementary Information, without being used as primary determinants of biological interpretation or mechanistic inference. Accordingly, downstream analyses and biological interpretations primarily focused on immune signatures with established robustness and reproducibility in bulk transcriptomic datasets, particularly T cell-related and cytotoxic immune axes.
4.10. Transcriptomic Signature Analysis of Tumor-Associated Biological Programs
To characterize tumor-intrinsic and microenvironment-associated biological programs, curated transcriptomic signatures were quantified using a marker-based scoring approach. All signature scores were calculated at the individual-sample level based on normalized gene expression values.
Epithelial–mesenchymal transition (EMT) activity was quantified using a marker-based scoring approach by integrating the expression of mesenchymal/extracellular matrix (ECM)-associated genes (VIM, FN1, COL1A1, COL3A1, and SPARC) and epithelial markers (CDH1 and EPCAM). Specifically, the EMT score for each sample was defined as the mean expression of mesenchymal/ECM-associated genes minus the mean expression of epithelial markers. This formulation provides a quantitative index of EMT activity by contrasting mesenchymal/ECM-associated transcriptional programs with epithelial identity.
Additional tumor behavior-related programs were evaluated using curated marker gene sets, with signature scores calculated as the average expression of the corresponding genes within each sample. These programs included angiogenesis (VEGFA, VEGFB, VEGFC, KDR, FLT1, and ANGPT2), cell migration/invasion (MMP2, MMP9, ITGA5, ITGB1, CXCR4, and S100A4), ECM remodeling (COL1A1, COL3A1, FN1, and SPARC), hypoxia (HIF1A, CA9, VEGFA, and LDHA), cell cycle regulation (MKI67, CCNB1, and TOP2A), DNA repair (BRCA1, RAD51, and CHEK1), drug resistance (ABCB1, ABCC1, and ABCG2), and oxidative stress (NFE2L2, SOD1, GPX1, and CAT).
All signature scores were compared between risk groups using the Wilcoxon rank-sum test. Where applicable, multiple testing correction was performed using the Benjamini–Hochberg method. These marker genes were selected based on established literature and commonly used transcriptomic definitions of each biological program.
4.11. Overall Study Design and Analytical Workflow
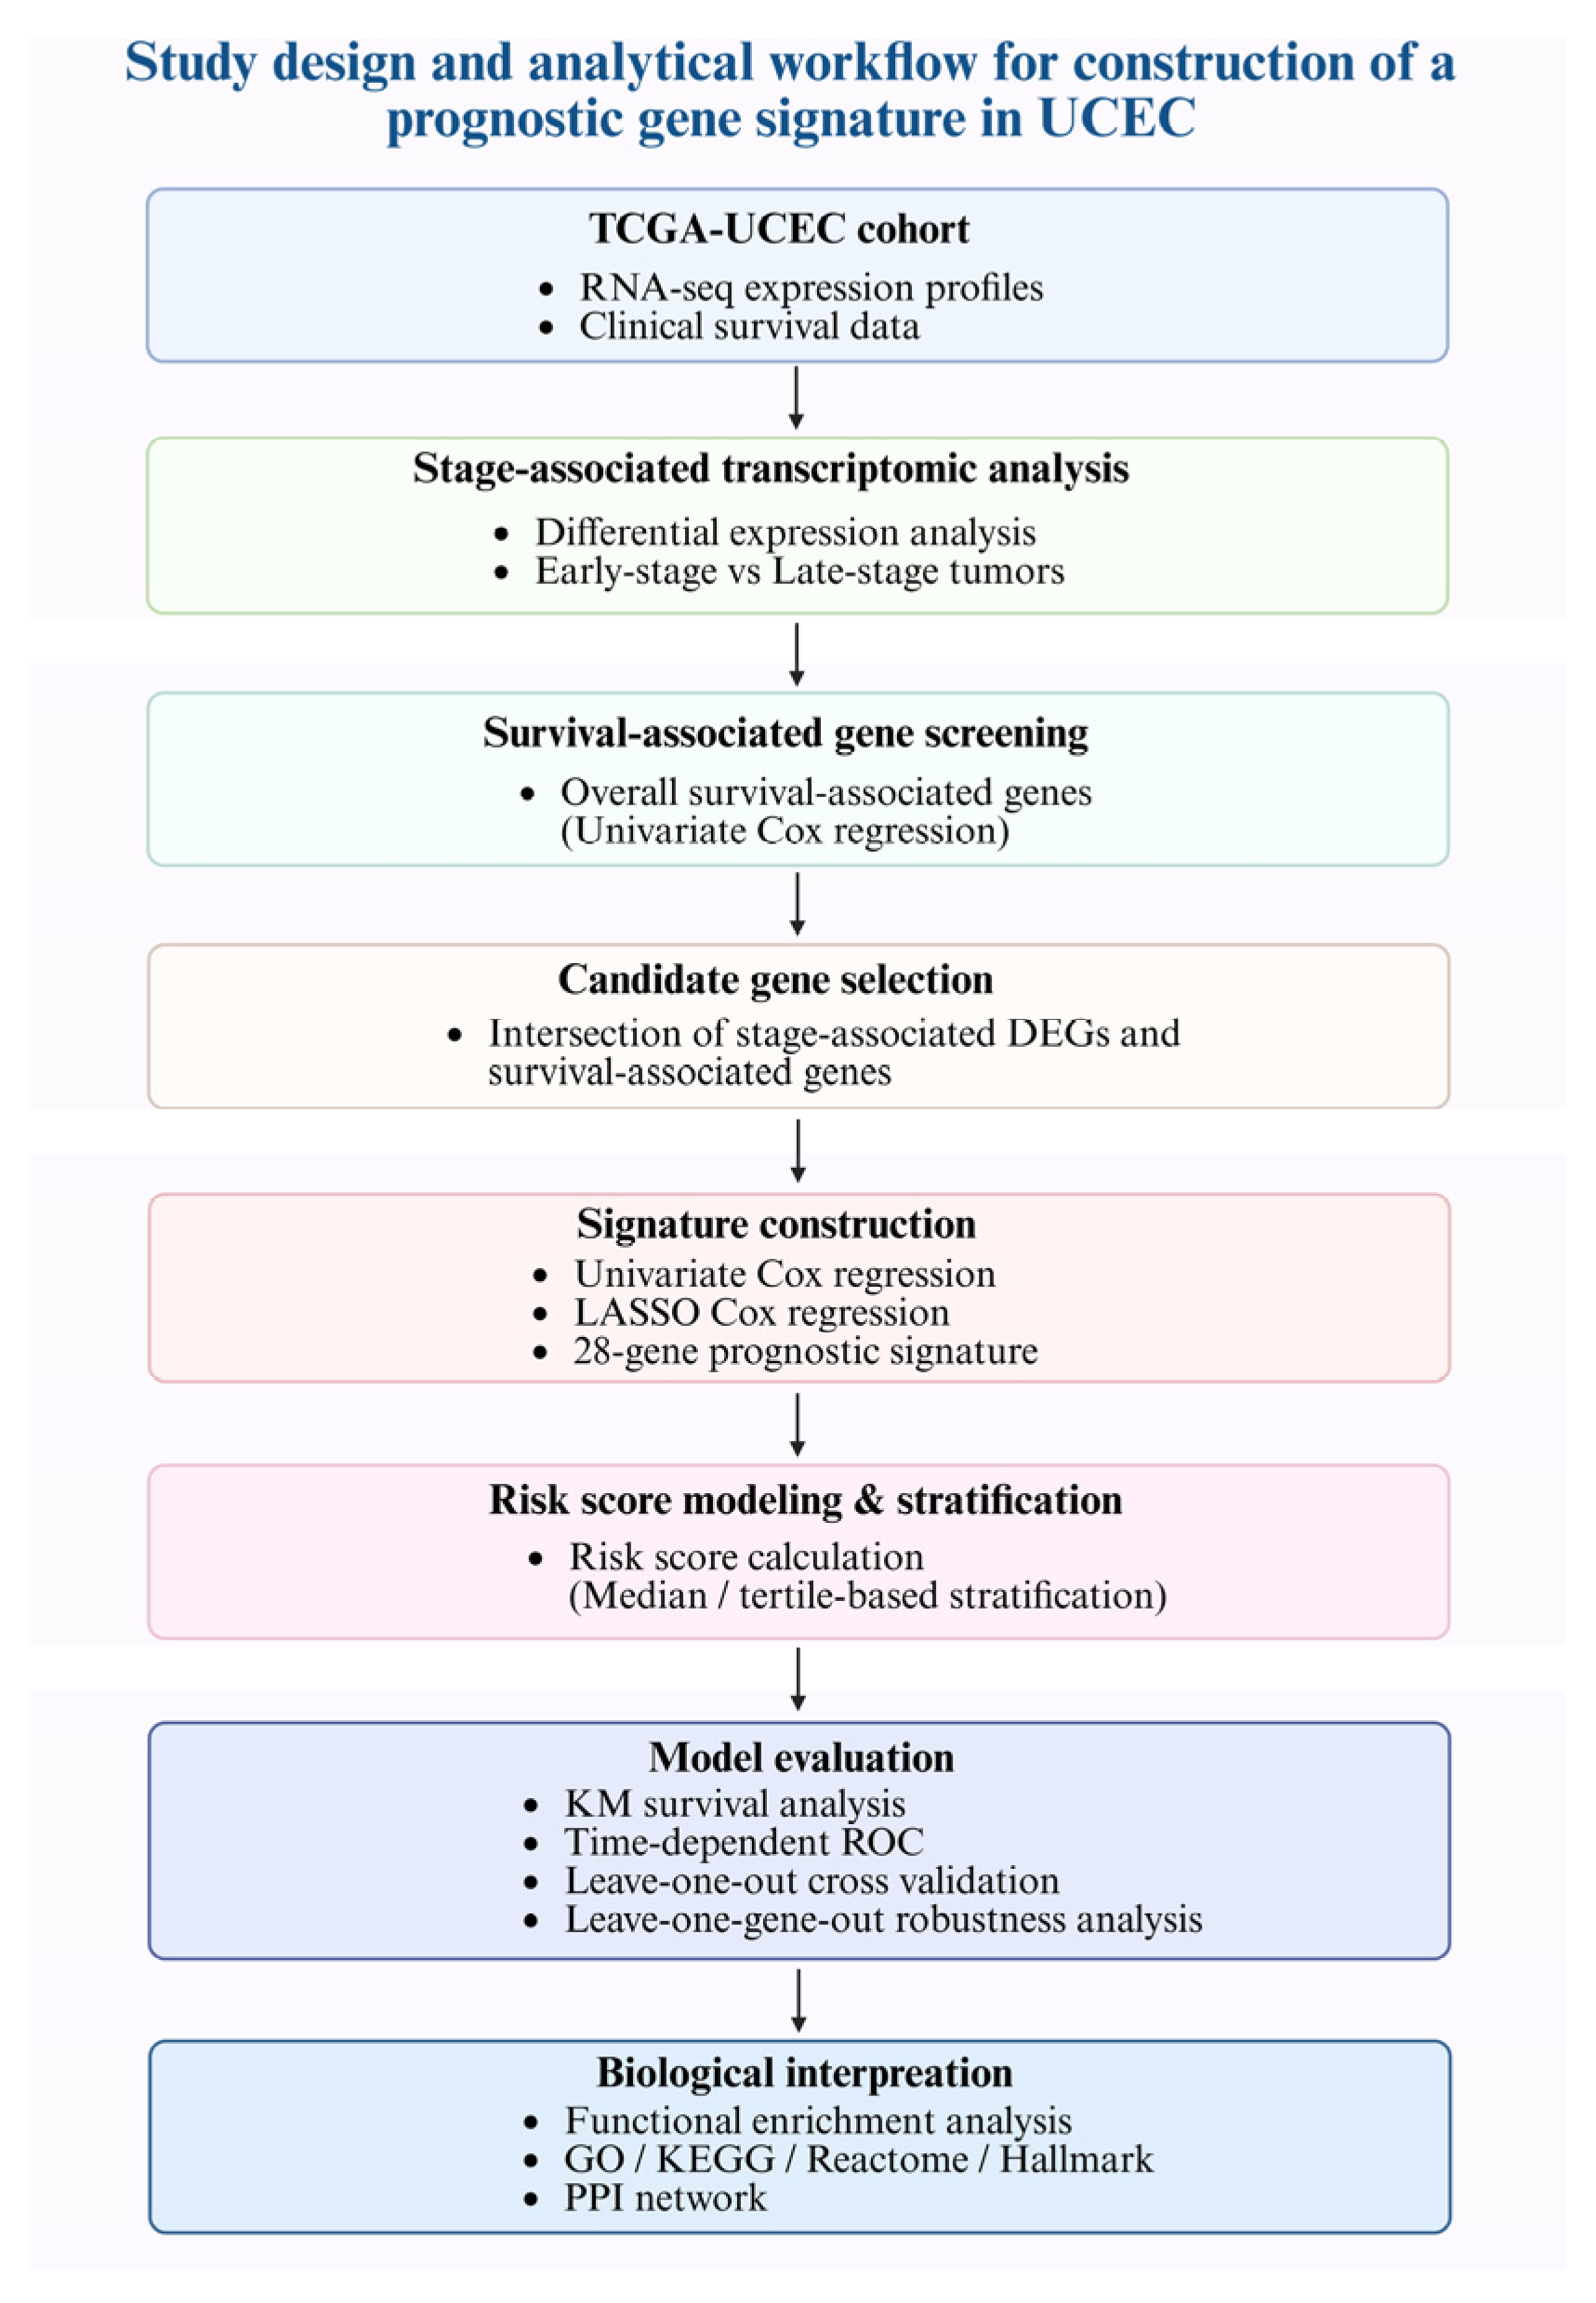
To systematically identify a prognostic gene signature for UCEC, we established an integrative analytical framework based on transcriptome-wide expression profiles from the TCGA-UCEC cohort (
Figure 1). Baseline clinicopathological characteristics of the analyzed patients are summarized in
Table S4. Normalized RNA-seq data were analyzed using a two-step screening strategy. First, stage-based differential expression analysis was performed to identify genes associated with disease progression by comparing early-stage and late-stage tumors. In parallel, survival-associated genes were identified using univariate Cox proportional hazards regression based on overall survival. Genes identified from both analyses were intersected to generate a set of candidate genes with combined biological relevance and prognostic potential. These candidates were further evaluated using univariate Cox regression, followed by LASSO Cox regression with 10-fold cross-validation to reduce overfitting. The optimal penalty parameter was selected based on cross-validation criteria, and the stability of gene coefficients across penalization paths was examined (
Figure S2). The resulting gene set was used to construct a multigene prognostic model, which was subsequently subjected to downstream validation, functional characterization, and robustness analyses as described below.
4.12. Statistical Analysis
All statistical analyses were conducted using R software (version 4.5.2). Two-sided p-values < 0.05 were considered statistically significant unless otherwise stated. Multiple testing corrections were applied where appropriate. Data visualization was performed using ggplot2 and related packages.
4.13. Use of AI-Assisted Tools
AI-assisted language models were used for language editing, clarity enhancement, and image optimization during manuscript preparation. Specifically, ChatGPT (OpenAI, GPT-5.5 version) was used to improve the grammar, coherence, and readability of the text. Additionally, AI-assisted image enhancement tools were employed to improve the visual clarity and resolution of the data plots to address formatting requirements. These tools did not contribute to the study design, raw data analysis, statistical modeling, or the interpretation of results. The authors confirm that the AI-assisted image optimization did not alter the underlying research data or the integrity of the original images.




 ,
,