Article

Construction of Simple Sequence Repeat-Based Genetic Linkage Map and Identification of QTLs for Accumulation of Floral Volatiles in Lavender (Lavandula angustifolia Mill.)

1
Department of Agrobiotechnology, AgroBioInstitute, Agricultural Academy, 8 Dragan Tsankov Blvd., 1164 Sofia, Bulgaria
2
Faculty of Biology, Sofia University, 8 Dragan Tsankov Blvd., 1164 Sofia, Bulgaria
3
Centre of Competence “Sustainable Utilization of Bio-Resources and Waste of Medicinal and Aromatic Plants for Innovative Bioactive Products” (BIORESOURCES BG), 1000 Sofia, Bulgaria
*
Author to whom correspondence should be addressed.
Int. J. Mol. Sci. 2025, 26(8), 3705; https://doi.org/10.3390/ijms26083705
Submission received: 5 March 2025 / Revised: 8 April 2025 / Accepted: 9 April 2025 / Published: 14 April 2025
(This article belongs to the Section Molecular Plant Sciences)

Abstract

In spite of the increasing industrial cultivation of lavender (Lavandula angustifolia Mill.), no genetic linkage map and mapping of QTLs (quantitative trait locus) has been reported for Lavandula species. We present the development of a set of SSR (simple sequence repeat) markers and the first genetic linkage map of lavender following the genotyping of a segregating population obtained by the self-pollination of the industrial lavender variety Hemus. The resulting genetic map comprises 25 linkage groups (LGs) corresponding to the chromosome number of the lavender reference genome. The map includes 375 loci covering a total of 2631.57 centimorgan (cM). The average marker distance in the established map is 7.01 cM. The comparison of the map and reference genome sequence shows that LG maps cover an average of 82.6% of the chromosome sequences. The PCR amplification tests suggest that the developed SSR marker set possesses high intra-species (>93%) and inter-species (>78%) transferability. The QTL analysis employing the constructed map and gas chromatography/mass spectrometry (GC/MS) dataset of flower extracted volatiles resulted in the mapping of a total of 43 QTLs for the accumulation of 25 different floral volatiles. The comparison of the genome location of the QTLs and known biosynthetic genes suggests candidate genes for some QTLs.

1. Introduction

Lavender (Lavandula angustifolia Mill.), lavandin (Lavandula × intermedia Emeric ex Loisel.), and to some extent, spike lavender (Lavandula latifolia Medik.) are widely industrially cultivated members of the genus Lavandula worldwide [1,2,3,4,5]. The industrially cultivated lavender and lavandin are mainly used for the production of essential oil and, to a lesser extent, of concrete and hydrolate [2,3,6]. Due to its unique fine fragrance, lavender oil is widely used in perfumery, cosmetics, aromatherapy, and medicinal applications [7,8,9,10]. Cultivated lavandin provides a higher yield of essential oil per acre than lavender, but its sensory profile is less sophisticated and attractive, which assigns the use of lavandin oil mainly in the industrial perfumery. Bulgaria, France, and China have been the largest lavender oil suppliers in the world during the last decade [3,11], whereas the production of lavandin oil has been dominated by France [2,4]. The requirement that the produced essential oil must meet the ISO standards for lavender and lavandin oil has resulted in the growing demand for production and the use of high-quality planting material from superior vegetatively propagated varieties [2,11]. The increased use and demands of lavender and lavandin oil further attracts farmers and companies from various countries to expand the industrial cultivation and processing of lavender and lavandin, including the start of cultivation in new areas [6,11,12,13,14]. The expansion of lavender and lavandin farming areas is often related to their cultivation in soil and/or climatic conditions that significantly differ from the optimal for the varieties initially developed for the environmental conditions specific for the traditional areas of cultivation [13,15]. Often, such cultivation at the sub-optimal conditions of the available varieties results in large variations in flower and essential oil yields and quality, as well as significant economic losses. In addition, the introduction of new technologies for the mechanization of lavender and lavandin cultivation, processing, and extraction often requires the use of varieties suited for the application of that particular technology [6,16,17,18]. This suggests the need for the development of genomic resources and related molecular marker tools for better characterization of the available lavender and lavandin genetic resources. Expanding lavender cultivation in new areas, together with the market demands to increase the production of high-quality lavender oil, requires the prompt development of practical molecular tools for the identification of QTLs for important agronomic traits and essential oil quality and the application of marker-assisted selection for the efficient breeding of new elite varieties to meet the new challenges of the industry [2,11,19,20].
The biosynthesis and accumulation of volatile organic compounds in lavender and lavandin flowers were the subject of a number of studies, which resulted in the identification of a set of genes involved in particular biosynthetic steps, for example [21,22,23,24,25,26], or the regulation of these processes [27,28]. These studies were further supported by transcriptome sequencing [29,30,31] and the genome-wide characterization of gene families related to the terpenoid biosynthesis pathways [32,33,34], as well as by the reported nuclear genome sequence assemblies of three L. angustifolia varieties, including var. Maillette [35], var. Jingxun 2 [36], and the reference genome sequence of var. Munstead [37], accessible through the GenBank database. Accordingly, lavender was proposed as a model of aromatic and medicinal plants to study the biosynthesis of volatiles and the related ecology and evolution [15,31,38,39,40]. So far, the characterization of the genetic diversity and resources of Lavandula species has been the subject of few studies employing expressed sequence tags derived from simple sequence repeat (EST-SSR) markers [41], sequence-related amplified polymorphism (SRAP) markers [42], and random amplified polymorphic DNA (RAPD) markers [43].
Over the last three decades, the construction of genetic linkage maps and QTL analysis has been widely applied as an effective tool for the identification of loci for important agronomic traits and the direct application of the obtained results in marker-assisted selection programs in various crops, including medicinal and aromatic plants [44,45]. Although the construction of genetic maps increasingly involves the application of SNP-based markers, the genetic linkage maps based on SSR markers offer the attractive opportunity to be used as core genetic maps and directly applied for different genotypes of the species of interest, due to the high transferability of SSR markers. In spite of the large number of molecular genetics and genomic studies and related data in lavender and lavandin, surprisingly, no construction of a genetic linkage map has been reported for them, as well the identification and mapping of QTLs related to important traits. Moreover, the only SSR markers reported so far for Lavandula species is a set of EST-SSR markers [41], which are not sufficient for genome mapping studies and QTL analysis.
In the present study, we report the development of an extended set of SSR markers for lavender, the construction of the first SSR-based genetic linkage map for this species, and the identification of QTLs for the accumulation of floral volatiles, following the characterization of an F2 segregating population obtained by the self-pollination of the industrial lavender variety, Hemus.

2. Results and Discussion

2.1. Development of an F2 Segregating Population by Self-Pollination of L. angustifolia var. Hemus

Variety Hemus of L. angustifolia was established in 1974 and, over the years, has become one of the most widely industrially cultivated lavender varieties in Bulgaria. It is suitable for mechanized harvesting, tolerates cultivation in different geographic regions in the country [46], and provides high-quality distilled lavender oil. For some period of time, var. Hemus was also used as a state standard for the evaluation of the performance of newly developed lavender varieties. Since its initial development, var. Hemus has been propagated vegetatively, both for maintenance in genetic resources collections and for the production of planting material. Considering all this, var. Hemus was selected for the development of a segregating population and genetic linkage map of lavender. Our early attempt to develop F2 segregating population through the spontaneous or mechanical self-pollination of a single var. Hemus plant was not successful. No seed formation was observed after covering the entire plant with a cage of fine mesh for the isolation of insects, which supports the recently reported lack of spontaneous self-pollination in lavender varieties cultivated in the country [47]. Therefore, to generate a larger seed set after self-pollination, a single var. Hemus plant was grown in an area where no other L. angustifolia plants were detected. As a result, over 1200 seeds were collected from a single var. Hemus plant during the 2020 flowering season due to the pollinator-mediated self-pollination. The germination and planting of these seeds resulted in the generation of a segregating population of a thousand plants. The SSR marker genotyping of 110 randomly chosen plants from this population confirms that they result from the self-pollination of the cultivated var. Hemus plant. Accordingly, 95 of these tested plants were selected as a mapping population. The results demonstrated that such an approach, or growing plants in insect-restrained rooms and the use of dedicated greenhouse insects as pollinators, could be applied for the generation of self-pollinated seeds from the plants of other species from the Lamiaceae family, already reported as difficult for self-pollination [48,49].

2.2. SSR Marker Development

Three groups of primer pairs were tested for the amplification of genomic regions containing SSR sequences and the development of a large set of SSR markers for genotyping the segregating population, including 471 next generation sequencing-based simple sequence repeat (NGS-SSR) primer pairs determined after the analysis of Illumina MiSeq-generated genomic sequences of var. Hemus, 170 genome-based simple sequence repeat (GEN-SSR) primer pairs designed after the analysis of the reference genome sequence of var. Munstead retrieved from GenBank, and 22 EST-SSR primer pairs reported by Adal et al. [41]. The testing included two rounds, first for the successful amplification of the target SSR region from var. Hemus and the production of a distinct profile of the amplified DNA fragments and the second round for generation of segregating alleles after the analysis of eight plants from the segregating population. The results of the tests are demonstrated in Table 1 and show that testing the NGS-SSR group was the most efficient for the development of polymorphic SSR markers. The testing of markers from the EST-SSR group resulted in the identification of a significantly lower portion of polymorphic markers, which supports the higher efficiency and informativeness of the genomic SSRs compared to EST-derived SSR markers also observed in other studies [50,51]. The testing of SRAP markers showed that this type of markers could be readily applied for the simultaneous genotyping of a large number of loci, due to the higher number of polymorphic alleles, which could be detected and analyzed by a single marker/primer pair. Thus, SRAP markers could be efficiently applied to increase the marker density of SSR-developed genetic maps.

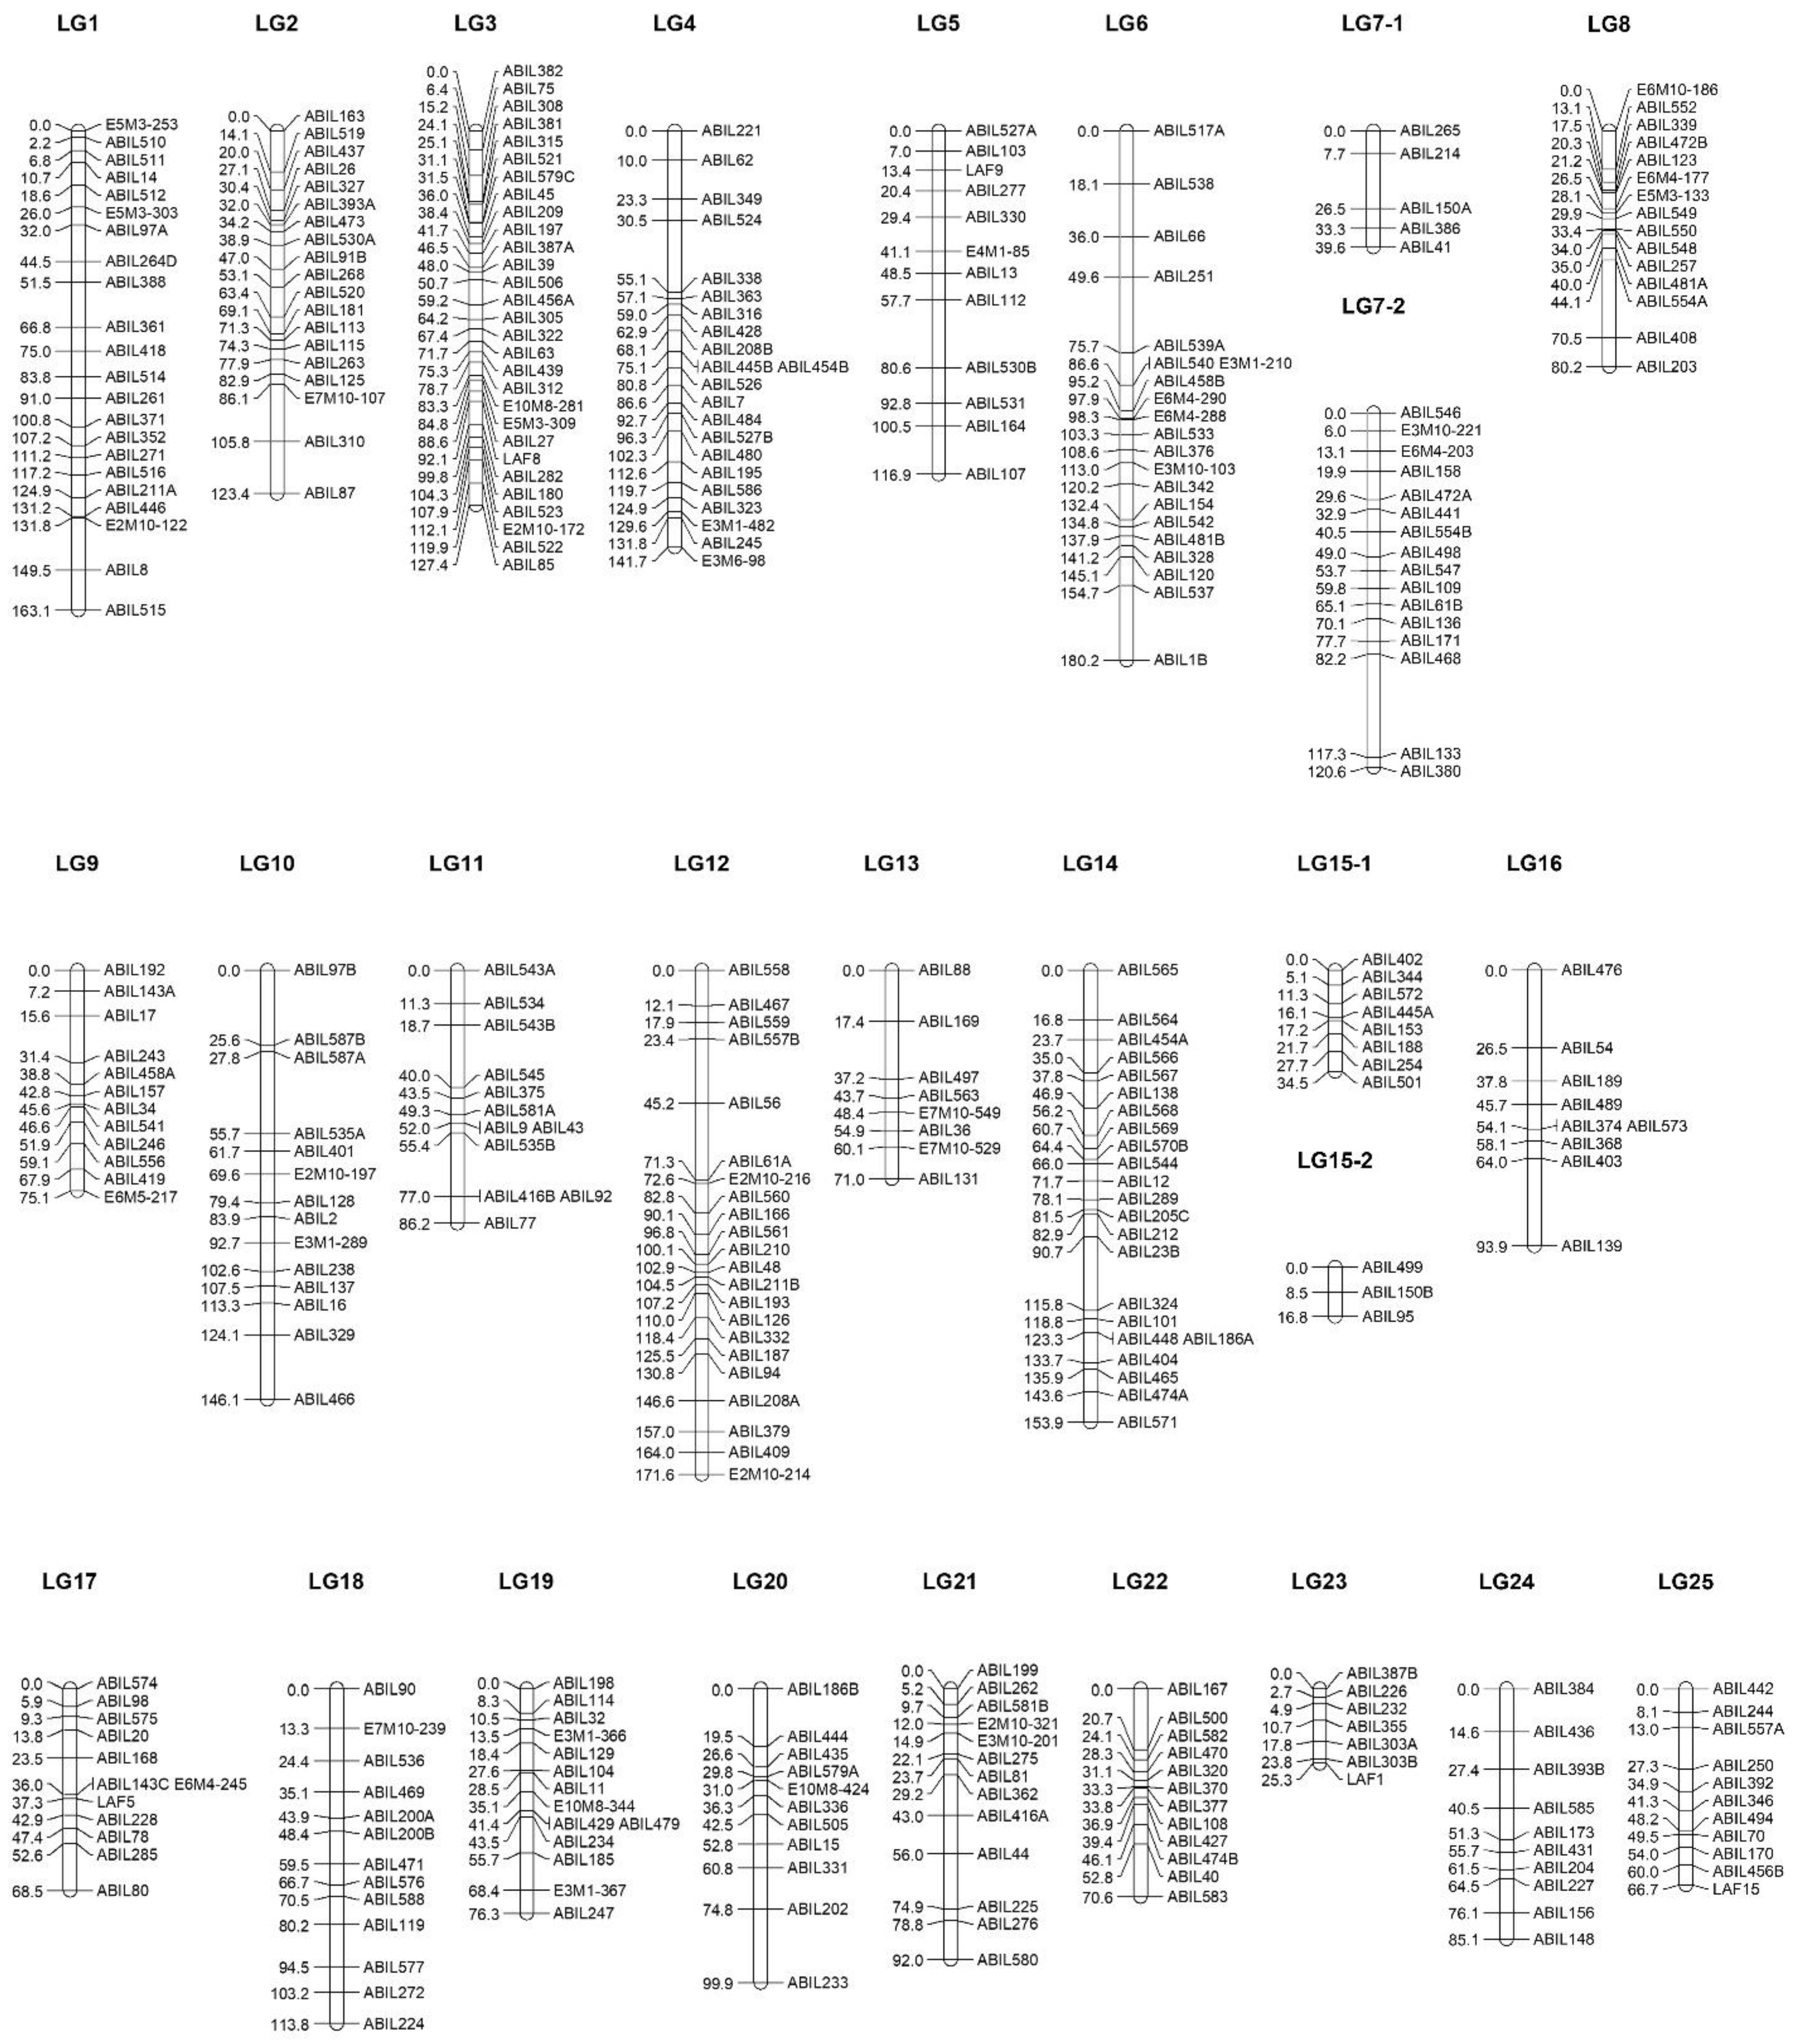
2.3. Linkage Map Construction

A total of 411 loci were analyzed for linkage mapping, including 377 loci obtained through genotyping with three groups of SSR markers and 34 loci identified through analysis with SRAP markers. The first round of map construction involved genotyping the segregating population with five previously reported EST-SSR markers [41] and 255 NGS-SSR markers, developed after the analysis and testing of SSR regions in genomic sequences of L. angustifolia var. Hemus. This first version of the map was developed shortly before the publication in GenBank of the reference genome sequence of L. angustifolia var. Munstead. Using the latter BLAST+ 2.16.0 search with the primer and SSR region sequences in the reference genome sequence was used to affiliate the constructed LG maps to the corresponding reference chromosome sequences and for determining the physical position of the mapped SSR loci. The obtained data were used to proceed in a second round of map expansion through the identification, selection, and testing of GEN-SSR primer pairs for the amplification of SSR regions located in the chromosome regions outside of the range of the corresponding linkage groups or located in the low marker density regions of the map. All this resulted in the mapping of additional 90 loci after analysis with 79 GEN-SSR markers. Finally, the segregating population was genotyped with 11 SRAP markers, which resulted in the mapping of 34 SRAP loci. The overall data analysis and quality check of the obtained genetic map resulted in the identification of a total of 25 linkage groups using an LOD score of 5.0, which corresponds to the number of assembled chromosome sequences in the reference genome, as well as to the chromosome number of var. Hemus used for the development of the segregating population. The further data analysis at a higher stringency showed the preservation of the formed LGs at an LOD score of 7.0, as only two linkage groups, LG7 and LG15, were resolved at two sub-groups each, Figure 1. The main parameters of the map are shown in Table 2, and details for the position of each locus are presented in Table S3, Supplementary Materials. The constructed genetic linkage map of L. angustifolia var. Hemus contains 375 loci, covering a total of 2631.57 cM. The average marker distance in the map is 7.01 cM. The number of markers on each LG ranged from 7 (LG 23) to 29 (LG 3), with an average number of 15, and the length per LG ranged from 25.23 cM (LG 25) to 180.24 cM (LG 6), with an average length of 105.26 cM. A total of 36 analyzed loci were not included in the map. Of them, 14 loci had no distinct affiliation to the established LGs, Table S3. The other 22 loci initially affiliated to different LGs were excluded from the final map, since they showed segregation distortion, and their inclusion resulted in significant changes in the marker order in the maps of the corresponding LG, Table S3. The appearance of loci with segregation distortion, which significantly changed the established map after their inclusion, was reported for different plant species, for example [52,53,54,55,56], and could be expected for continuously vegetatively propagated lavender varieties, like var. Hemus. The performed BLAST search revealed that the sequences of two NGS-SSR markers, ABIL245 (LG4) and ABIL247 (LG19), were allocated on two scaffold sequences of the reference genome, scaffold 293 (acc. JAPVEC010000093) and scaffold 515 (acc. JAPVEC010000026), which were not included into the chromosome sequence assemblies, Table S3. In reverse, the genotyping of the GEN-SSR marker ABIL587 targeting an SSR region on scaffold 246 (acc. JAPVEC010000206) was affiliated to a locus on LG18, whereas the GEN-SSR marker ABIL588 targeting an SSR region on scaffold 229 (acc. JAPVEC010000199) corresponded to loci on LG10 (ABIL588A and ABIL588B) and LG23 (ABIL587C and ABIL588D), Table S3. Accordingly, the established genetic map and additional genotyping of selected SSR markers could be further applied to clear some ambiguities in the current reference chromosome assembly and affiliate some of the scaffolds to particular chromosomes. The use of high-density genetic maps for improving reference genome assemblies has been reported in other plant species. [57,58,59].
The BLAST search determined the positions of SSR sequences in the reference genome, and a comparison with the respective SSR loci positions in the established genetic map shows that the order of SSR loci in the LGs well resembles those predicted from the corresponding chromosome sequence assemblies, Table S3. The affiliation of the sub-linkage groups LG7-1, LG7-2, LG15-1, and LG15-2 to the larger groups LG7 and LG15 was confirmed by their affiliation to the sequences of chromosome 7 and 15, Table S3. Closer observation of the marker order in the linkage groups and the location of the corresponding SSR sequences in the chromosomes show that the positions of less than 5% of the mapped SSR markers differ from the order predicted based on the reference genome. The reasons for these differences are not clear and could be a result of local differences in the genomic sequences or chromosome rearrangements in the genome of var. Hemus or/and var. Munstead, local map disorders due to insufficient marker saturation, or even in local genome sequence disorders due to local irregularities of the genome sequence assembly. Further saturation of the map, including the regions surrounding these markers, will provide valuable information to clear these issues. Such local saturation and improvement of the map could be carried out in a genome sequence guided manner, similar to the development of GEN-SSR markers in the present study. The overall comparison of the established LG maps and corresponding positions of the markers in the reference chromosome sequences makes it possible to estimate the current genome coverage of the map. The comparison shows that the genetic map covers between 37.2% and 99.4% of the reference chromosome sequences, with an average coverage of 82.6% +/− 16.7% per chromosome, Table 2.

2.4. SSR Marker Transferability

Intra- and inter-species transferability of the employed SSR markers is essential for the various applications of sub-sets of these SSR markers, as well as of the established genetic linkage map and the construction of an SSR marker-anchored reference genetic map of lavender and Lavandula sp. To evaluate the transferability of the SSR markers applied in the established map, the SSR primer pairs were tested for the PCR amplification of genomic DNAs isolated from L. angustifolia var. Hidcote Blue, two L. latifolia accessions, and the intersectional hybrid L. × heterophylla var. Big Boy James. A summary of the results is presented in Table 3 and described in detail in Table S4, Supplementary Materials. The obtained results show the high transferability of the majority of SSR markers used for the development of the genetic map, as above 93% of the tested SSR primer pairs show positive PCR amplification for the L. angustifolia garden variety Hidcote Blue, and above 78% of the SSR markers exhibit the positive PCR amplification of DNA from other Lavandula species. The observed high intra- and inter-species marker transferability suggests that the developed marker set could be efficiently employed for the evaluation of the genetic diversity of natural populations and genetic resources collections of Lavandula species, as well as being further applied for the development of an integrated genetic map of L. angustifolia and SSR marker-anchored genetic maps in the genus Lavandula. Such SSR marker-anchored genetic maps have been successfully and increasingly applied in the modern plant breeding of various cultivated plant species [60,61,62].

2.5. Variations of Volatile Contents in the Flowers of Plants from the Segregating Population

Correct comparative analysis of aroma traits is a challenging task, since the accumulation of volatiles is influenced by a variety of factors. Several studies have reported differential biosynthesis and the accumulation of various volatiles during the development of lavender flowers and inflorescences and during different daytime periods [26,33,63,64]. Accordingly, for the GC/MA analysis of the flower volatile composition in this study, we employed a simple procedure for sample preparation involving organic solvent extraction of a fixed number of florets at a stage of development corresponding to fully developed petals [65]. This sample preparation allowed for the collection of flower samples from the plants of the entire segregating population within two hours, thus avoiding variations due to flower developmental and environmental factors. The GC/MS analysis resulted in the identification and quantification of 34 compounds, Table 4. Further comparison of the obtained data showed large variations in the composition of the analyzed floral volatiles among the plants from the segregation population. This was well demonstrated by the determined minimal and maximal content of each analyzed volatile scored for the tested plants from the segregating population, as well as from the calculated ratios of the minimal and maximal content to the average content for the entire population, Table 4. Accordingly, for several of the analyzed volatiles, these calculated minimal and maximal ratios ranged from zero to over 300–500% of the average for the population, Table 4.

2.6. Mapping of QTLs Related to the Accumulation of Flower Volatiles in L. angustifolia var. Hemus

Mapping QTLs related to the accumulation of flower volatiles is an essential step for marker-assisted selection and the breeding of elite lavender lines and varieties for the production of high-quality essential oil. An early version of the constructed SSR map was already successfully applied for the identification of a QTL, controlling the ratio of linalool to linalyl acetate in the flowers of L. angustifolia var. Hemus [66]. Here, we performed QTL analysis for the accumulation of volatiles using the dataset from the GC/MS analysis of flower volatiles and the genetic linkage map developed in this study. The QTL analysis resulted in the identification and mapping of a total of 43 QTLs for 25 volatile compounds. No significant QTLs were identified for nine compounds after applying genome-wide significance threshold based on a 5% experimental error rate. The identified QTLs were distributed across 12 linkage groups, with an LOD score ranging from 4.03 to 17.35, Table 5. The number of QTLs per trait ranged from 1 to 4. The proportion of volatile content variance explained (PVE) by the identified QTLs ranged from 20.1% to 62.7%.
The closer observation of the markers surrounding the identified QTLs show full overlap of the genomic regions of some of the QTLs related to different compounds, suggesting their affiliation to common biosynthetic pathway and even common genetic background, Table 6. To examine the possible genetic and biosynthetic background of the identified QTLs, their genome locations were compared with the locations of the sequences homologous to earlier identified genes from the metabolic pathways related to the biosynthesis of corresponding volatile compounds. The results demonstrated that a large portion of the genomic regions of the identified QTLs also included the genomic sequences of genes involved in the biosynthesis of the corresponding compounds, which provide further support for the significance and genetic background of these QTLs, Table 6. For example, the 622 kbp genomic region of q13-8.1 of linalool overlap with q14-8.1 of linalyl acetate and also include the genomic sequence homologous to an AAT4 gene, which is a member of the BAHD acyltransferase family and was reported to convert lavandulol to lavandulyl acetate [67]. In addition, some of the regions related to overlapping QTLs include a cluster of genomic sequences homologous to known genes involved in the biosynthesis of the QTL compounds. For example, the 3,6 Mbp genomic region overlapping q23-5.1 (γ-Cadinene) and q25-5.1 (tau-Cadinol) include four sequences homologous to the LaCADS gene, which catalyzes the production of various by-products, including γ-cadinene and tau-Cadinol. The presence in the identified QTL region of a cluster of candidate genes raises the question about the function and impact of the individual members of the cluster to the biosynthesis and accumulation of the QTL volatiles. On the other hand, it offers the opportunity for the direct application of the SSR markers surrounding the QTL of interest in breeding programs just accounting on the overall impact of the QTL.

3. Discussion

Here, we reported the construction of the first genetic linkage map of lavender based on SSR markers. The comparison of genetic and sequence data shows that the map order of the SSR loci corresponds well to their location in the reference genome sequence. This provides an opportunity for efficient further increase in the density of the map, including directed local saturation through the target development of additional SSR markers in the region of interest based on genome sequence data. The demonstrated high intra- and inter-species transferability of the SSR markers facilitate further wider and efficient applications of the SSR markers and established maps in various genetic studies, including the characterization of lavender genetic resources and marker-assisted selection. The performed QTL analysis demonstrates that, in spite of the moderate density of the constructed genetic linkage map, it can be efficiently employed for the identification of QTLs related to the accumulation of volatile compounds and other important agronomic traits in lavender. Moreover, the codominant nature of the SSR markers, together with their high transferability, provide an attractive opportunity for the straightforward and low-cost testing of diverse lavender populations for the presence and impact of the already identified QTLs, as well as for testing the possible impact of the alleles of known genes. Such testing could be easily realized simply by SSR genotyping and the determination of the allele configurations of two SSR loci surrounding the region of interest and a comparison of the parameters of the studied trait for the groups of plants with the same allele configurations for the tested alleles. Generally, the first round of such testing does not necessarily require a high density of the map, and meaningful results could be obtained, even when the target genomic region is situated between two rather widely located SSR loci. Besides testing the impact of the already identified QTLs or genes of interest, such SSR analysis could also be used for the identification of plants with a recombination in the target region and the subsequent identification of candidate genes related to the studied QTL. The last could be carried out through marker walking within the region of interest via the selection and application of new SSR markers from the reference genome sequence, as described for GEN-SSR markers. Considering the increasing need from the application of marker-assisted selection in lavender breeding, we continue with the efforts to increase the density of the current genetic map of var. Hemus and the further construction of an integrated genetic map of the industrially cultivated lavender varieties.

4. Materials and Methods

4.1. Plant Material

L. angustifolia var. Hemus plant used for the development of the F2 segregating population was obtained from the Institute of Roses and Aromatic Plants/IRAP/, Kazanlak, Bulgaria. Variety Hemus was established by IRAP breeders in 1974, following the pick-up and clonal selection of individual plants from the seed population. Since then, var. Hemus has been vegetatively propagated for the production of planting material and genetic resource collection. For the development of the segregating population, a single plant of var. Hemus was cultivated in the area of the village of Zagore, Thracian lowland, Bulgaria, and seeds were collected after the 2020 flowering period. No other lavender plants were detected to grow in the same area during this period. The seeds were stratified for 12 weeks at 4 °C and germinated in a tray on planting soil. The obtained seedlings were transferred in pots, grown in the greenhouse for 10 weeks, and cultivated in the experimental field of the Agrobioinstitute (ABI), Kostinbrod, Bulgaria. Var. Hemus (mother plant), and 95 plants from segregating population were labelled and further sampled. The plants of L. angustifolia var. Hidcote Blue, L. latifolia, and the intersectional hybrid L. × heterophylla ’Big Boy James’ were purchased from Bastin Nursery (Kwekerij Bastin, Aalbeek, the Netherlands). The L. latifolia (Ll_abi2) plant was grown and selected from seeds purchased from WeberSeeds Botany Ethnobotany, the Netherlands. The plants were grown in pots in the greenhouse of ABI, Kostinbrod, Bulgaria.

4.2. Genomic DNA Isolation

About 20–25 young leaves from every plant were placed in 15 mL plastic containers, immediately frozen in liquid nitrogen and stored at −80 °C. The frozen leaf samples were ground to a fine powder by using the Qiagen TissueLyser II Mill (QIAGEN AG, Steinhausen, Switzerland) at 30 Hz for 2 min. Genomic DNA was purified according to the cetyltrimethylammonium bromide (CTAB) protocol [72]. Genomic DNA concentration was measured spectrophotometrically by using Nanodrop 2000 (Thermo Fisher Scientific, Waltham, MA, USA) and diluted to a final concentration of 25 ng/μL with Type I ultrapure water.

4.3. Next Generation Sequencing, SSR Identification, and Primer Design

Microsatellite sequences from L. angustifolia var. Hemus were identified as a service by Ecogenics GmbH, Switzerland following the NGS sequencing of a genomic DNA sample isolated from the var. Hemus plant used for the development of the segregating population. The Illumina TruSeq nano DNA library was sequenced by using MiSeq Reagent Nano Kit v2 and Illumina MiSeq sequencing platform (Illumina Inc., San Diego, CA, USA). The paired-end reads were passed through Illumina’s chastity filter and were further subject to de-multiplexing and trimming of Illumina adaptor residuals. The quality of the surviving reads was checked with FastQC v0.11.8 [73]. The paired-end reads were next quality filtered and merged with USEARCH v11.0.667 [74] to reform in silico the sequenced molecules. The merged reads were screened with the software Tandem Repeats Finder, v4.09 [75]. Merged reads containing SSR region with at least six repeat units of tri- or a tetra-nucleotide or at least ten repeat units a dinucleotide of were selected. Primer 3 [76,77] software was used for primer design. Raw NGS sequences can be accessed at the NCBI Sequence Read Archive under accession number PRJNA1207064.

4.4. SSR Identification After Search of Reference Genome Sequence and Primer Design

The reference genome sequence of L. angustifolia var. Munstead was downloaded from the NCBI website https://www.ncbi.nlm.nih.gov/datasets/genome/?taxon=39169, GenBank acc. No GCA_028984105.1 (accessed on 1 June 2024) [37,78]. The genome sequence includes 795,075,733 bp chromosome-scale assembly, representing 25 chromosomes with a N50 scaffold length of 31,371,815 bp [37]. The Krait Microsatellite Identification and Primer Design tool (v1.5.1) [79] was used for the search of the reference genome sequence for the presence of SSR motifs. The following minimal parameters for SSR identification were applied: 12 for mononucleotides, 7 for dinucleotides, 5 for trinucleotides, 4 for tetranucleotides, 4 for pentanucleotides, and 4 for hexanucleotides. The primer pairs flanking the selected SSRs were designed to amplify predicted PCR products ranging from 100 bp to 300 bp. In addition to the primers for SSR regions identified from NGS and genome sequence data, five more primer pairs for the PCR amplification of EST-SSR loci LAF1, LAF5, LAF8, LAF9, and LAF15, described by Adal et al. [41], were used within the study. All primers were synthesized by Macrogen Europe BV, the Netherlands. The primer sequences of primer pairs used for genotyping plants from the segregating population are presented in Table S1, Supplementary Materials. The theoretical positions of the applied SSR markers were determined after the BLAST search of the reference genome sequence of L. angustifolia var. Munstead by using the primer sequences and the sequence of the SSR genome region obtained from NGS data for var. Hemus.

4.5. PCR Amplification of SSR Regions

The PCR amplifications of SSR regions from plant genomic DNA, for testing the transferability of SSR markers or for analysis by the Agilent 5200 Fragment Analyzer System, were performed in a volume of 16 µL, including 1 µL of forward primer (10 pmol/µL), 1 µL of reverse primer (10 pmol/µL), 8 µL of 2× MyTaqTM Mix (Meridian Bioscience, Cincinnati, OH, USA), 4.7 µL ultra-pure water, and 1.3 µL genomic DNA (25 ng/µL). The following PCR conditions were used: 95 °C for 3 min followed by 33 cycles of 95 °C for 15 s, 57 °C for 30 s, 72 °C for 30 s, and a final elongation at 72 °C for 10 min. For testing the SSR marker transferability, the PCR products were resolved after electrophoresis in 1.8% agarose gels and observed under UV light. For fragment analysis and plant genotyping, the PCR products were subject to analysis by the Agilent 5200 Fragment Analyzer System (Agilent Technologies, Inc., Santa Clara, CA, USA) using the dsDNA 905 Reagent Kit (1–500 bp).

4.6. PCR Amplification of SSR Regions with Tailed Primers

The PCR amplifications of SSR regions from plant genomic DNA, subject of fragment analysis by a fluorescent capillary sequencer, were carried out using the designed reverse and 5′-tailed forward primers. Five different types of tails [80,81] were used, including M13 tail (5′-TAAAACGACGGCCAGT), A tail (5′-GCCTCCCTCGCGCCA), B tail (5′-GCCTTGCCAGCCCGC), C tail (5′-CAGGACCAGGCTACCGTG), and D tail (5′-CGGAGAGCCGAGAGGTG). The tails used for the 5′-tailing of the forward primer were M13 tail when the Tm of the reverse primer was ≤58 °C, C and D tails when the Tm of the reverse primer were 58 °C < Tm ≤ 62 °C, and A and B tails when the Tm of the reverse primer were >62 °C. The tails were synthesized and 5′-labeled with FAM, JOE, ROX, and TAMRA dyes, as a service by Macrogen Europe BV, the Netherlands. All tails and primer combinations for the used primer pairs are presented in Table S1, Supplementary Materials. Based on the specific tail used, the annealing temperatures (Ta) of the PCR reactions were 54 °C for M13 tail, 57 °C for C and D tails, and 59 °C for A and B tails. The PCR reactions were performed in a volume of 16 µL, containing 0.8 µL of 5′-tailed forward primer (3 pmol/µL), 1 µL of 5′-labeled tail primer (10 pmol/µL), 1 µL of reverse primer (10 pmol/µL), 8 µL 2× MyTaqTM Mix (Meridian Bioscience), 4 µL ultra-pure water, and 1.2 µL genomic DNA (25 ng/µL). The following PCR conditions were used: 95 °C for 3 min followed by 33 cycles of 95 °C for 15 s, Ta for 30 s (Ta is according to the type of tail used, described above), 72 °C for 30 s, and a final elongation at 72 °C for 10 min. The PCR-amplified DNAs were further subjected to fragment analysis using ABI 3130 Genetic Analyzer (Thermo Fisher Scientific, Waltham, MA, USA).

4.7. PCR Amplification of SRAP Fragments

In addition to the SSR marker genotyping, eleven SRAP primer pairs were used for the amplification of SRAP fragments from the genomic DNA of L. angustifolia var. Hemus and the plants of the analyzed segregating population. The ME and EM type of SRAP primers were designed according to Li and Quiros [82] and are shown in Table S2, Supplementary Materials. The PCR reactions were carried out in a volume of 20 µL, containing 1.5 µL of DNA template (25 ng/µL), 1 µL of 5′-labeled forward EM primer (10 pmol/µL), 1 µL of reverse ME primer (10 pmol/µL), 10 µL 2× MyTaq HS Mix (Meridian Bioscience), and 6.5 µL ultra-pure water. Samples were PCR-amplified using the following thermal profile: 5 min at 94 °C; 3 cycles of 1 min at 94 °C, 1 min at 35 °C, and 1 min at 72 °C; 35 cycles of 1 min at 94 °C, 1 min at 50 °C, and 1 min at 72 °C; and a final elongation step of 3 min at 72 °C. The forward ME primers were 5′-end labelled with FAM. The PCR-amplified DNAs were further subjected to fragment analysis using ABI 3130 Genetic Analyzer (Thermo Fisher Scientific, Waltham, MA, USA).

4.8. SSR and SRAP Fragment Analysis

ABI 3130 Genetic Analyzer with 36 cm long capillaries, Pop-7 polymer, and GeneScanTM 500 LIZTM size standard (all from Thermo Fisher Scientific, Waltham, MA, USA) were used for fragment analysis of the amplified SSR an SRAP fragments, as described earlier [42,50]. The fragment sizing was carried out by using GeneMapper 4.0 (Thermo Fisher Scientific, Waltham, MA, USA). The allele combination for each SSR locus and analyzed plants was determined following a comparison with the alleles of the mother L. angustifolia var. Hemus plant. The SRAP fragment analysis was carried out for fragments in the range of 60–600 bp. All SRAP fragments showing a distinct presence or absence in the SRAP patterns of the analyzed plants from the segregating population were scored. Each of these SRAP fragments was considered a dominant allele of a separate locus, and the obtained data were used in the linkage analysis.

4.9. Linkage Analysis and Genetic Map Construction

JoinMap 5 [83] was used for linkage analysis. The grouping was carried out by using the maximum likelihood (ML) mapping algorithm with the Haldane mapping function. The markers were grouped into linkage groups using an LOD score of 5.0 or higher. The values of nearest neighbor (NN) fit and NN stress from the Fit & Stress tabsheet and −log10P values from the Genotype Probabilities: Locus Means tabsheet were used to inspect the quality of the established map. Markers related to poor map quality criteria were excluded and after that re-introduced one by one, and the mapping analysis was performed again. If the re-introduction of a marker confirmed its poor fit, the marker was removed from further analysis until a good quality map was established. The obtained order of SSR markers in each linkage group was compared with their theoretical position in the reference genome sequence. When the order of SSR markers in the linkage groups differed from the order of their theoretical position in the corresponding chromosome of the reference genome sequence, the possible change in their order was tested through the evaluation of the map quality after using the fixed-order input in JoinMap 5 and observation of the map quality criteria (high NN fit, NN stress, or –log10P values). When the fixed order did not result in the deterioration of the map quality, it was considered to be a genetic map of the corresponding linkage group. The genetic maps were drawn with Map-Chart v2.32 [84].

4.10. Sample Preparation and GC/MS Analysis of Floral Volatiles

The preparation of extracts for the GC/MS analysis of floral volatiles was performed as described in Zagorcheva et al. [65], after collecting florets from two-year-old plants of the segregating population. Thirty florets with fully open petals, corresponding to stage 3 described by Guitton et al. [26], were collected in a 10 mL headspace glass vial. After the addition of 3 mL of hexane (Sigma-Aldrich, St. Louis, MO, USA) and 200 mg of anhydrous sodium sulfate (Sigma-Aldrich, St. Louis, MO, USA), the glass vials were crimp-capped and kept at 4 °C until analysis. Prior to analysis, the glass vials were vortexed at 1000 rpm on a VWR Multitube Vortex Mixer (VWR, Radnor, PA, USA) for 30 min. For each plant, one sample was analyzed in one replicate. A total of 1 mL of the extract was transferred to a 2 mL GC vial and subjected to GC/MS analysis on an Agilent 8890/5977B GC/MS system, as described earlier [65]. Briefly, the compounds were separated on a polar HP-INNOWax column (Agilent Santa Clara, CA, USA), 30 m × 0.25 mm, film thickness 0.25 μm, containing PEG as a stationary phase. Carrier gas was helium (purity 99.999%) at a flow rate of 0.8 mL/min. The injector temperature was 250 °C, using the splitless injection of 1 μL per sample. The oven program was as follows: 65 °C to 170 °C at 2 °C/min, then 60 °C/min to 240 °C, hold for 15 min. The mass selective detector was operated at a transfer line temperature of 250 °C and electron impact ionization voltage of 70 eV. The C10-C40 alkane mixture (Sigma-Aldrich, St. Louis, MO, USA) was used for calculating the Kovats retention index of each chromatographic peak using the AMDIS 2.73 software (National Institute of Standards and Technology (NIST), Gaithersburg, MD, USA). Individual compounds were identified based on their MS spectrum using the NIST 2007 mass spectral library (National Institute of Standards and Technology (NIST), Gaithersburg, MD, USA) as well as based on their Kovats retention index and literature data. The relative content of the analyzed compounds was determined as percentage of the total area of the chromatogram using Agilent Productivity Chemstation ver. F.01.03.2365 (Agilent, Santa Clara, CA, USA). Analysis of variance (ANOVA) for significance between means was performed using SPSS v. 26 (SPSS Inc, Chicago, IL, USA).

4.11. QTL Mapping

QTL analysis was performed using the interval mapping method implemented in MapQTL ver. 6.0 (Kyazma, Wageningen, The Netherlands). The significant QTLs were identified using a genome-wide LOD threshold based on a 5% experimental error rate, which was determined through 1000 permutations. The identified QTLs were named by combining the name of the trait and the chromosome number.

5. Conclusions

In this study, an extended set of SSR markers were developed and applied for the construction of the first genetic linkage map of lavender, using a segregating population obtained by the self-pollination of the industrial lavender variety Hemus. The SSR markers showed high intra- and inter-species transferability, allowing for their efficient application in studies including the characterization of the genetic resources and mapping studies in Lavandula sp. The constructed map was successfully employed for the identification and mapping of QTLs related to the accumulation of volatile terpenoids in the flowers of plants from the segregating population. The search of the lavender reference genome shows that the genomic regions of part of the identified QTL also include sequences homologous to genes involved in the biosynthesis of the QTL compounds, which pointed out candidate genes for further allele testing. The developed set of SSR markers and the constructed genetic map lay the groundwork for subsequent marker-assisted breeding in lavender. However, the further routine application of the markers employed in the map requires an additional increase in the density of the map and the construction of an integrated genetic map of the main industrially cultivated lavender varieties. The further dissection of the QTL regions of interest through marker walking and development and the application of markers tightly linked to the candidate genes will both increase the efficiency of marker-assisted selection and gain new knowledge on the functionality of the corresponding genes and their alleles.

Supplementary Materials

The following supporting information can be downloaded at: https://www.mdpi.com/article/10.3390/ijms26083705/s1.

Author Contributions

Conceptualization, I.A.; methodology, I.A. and K.R.; software K.R. and I.A.; investigation, P.G., M.R., M.K., K.R. and I.A.; data curation, K.R. and I.A.; writing—original draft preparation, I.A. and K.R.; project administration, I.A.; funding acquisition, I.A. All authors have read and agreed to the published version of the manuscript.

Funding

This research was funded by the Bulgarian National Science Fund, grant KP-06-N56/2, as well as by the Centre of Competence “Sustainable Utilization of Bio-resources and Waste of Medicinal and Aromatic Plants for Innovative Bioactive Products” (BIORESOURCES BG) project BG16RFPR002-1.014-0001, funded by the Program “Research, Innovation and Digitization for Smart Transformation” 2021-2027, co-funded by the EU.

Institutional Review Board Statement

Not applicable.

Informed Consent Statement

Not applicable.

Data Availability Statement

Raw NGS sequences can be accessed at the NCBI Sequence Read Archive under project number PRJNA1207064.

Acknowledgments

The authors would like to thank Rumyana Velcheva and Liliya Georgieva (AgroBioInstitute, Sofia, Bulgaria) for the excellent technical assistance.

Conflicts of Interest

The authors declare no conflict of interest. The funders had no role in the design of the study; in the collection, analyses, or interpretation of data; in the writing of the manuscript; or in the decision to publish the results.

Abbreviations

The following abbreviations are used in this manuscript:
SSRsimple sequence repeat
SRAPsequence-related amplified polymorphism
QTLquantitative trait locus
GC/MSgas chromatography/mass spectrometry

References

  1. Cáceres-Cevallos, G.J.; Quílez, M.; Ortiz de Elguea-Culebras, G.; Melero-Bravo, E.; Sánchez-Vioque, R.; Jordán, M.J. Agronomic Evaluation and Chemical Characterization of Lavandula latifolia Medik. under the Semiarid Conditions of the Spanish Southeast. Plants 2023, 12, 1986. [Google Scholar] [CrossRef] [PubMed]
  2. Gallotte, P.; Fremondière, G.; Gallois, P.; Bernier, J.-P.B.; Buchwalder, A.; Walton, A.; Piasentin, J.; Fopa-Fomeju, B. Lavandula angustifolia Mill. and Lavandula × Intermedia Emeric Ex Loisel: Lavender and Lavandin. In Medicinal, Aromatic and Stimulant Plants; Springer: Berlin/Heidelberg, Germany, 2020; pp. 303–311. [Google Scholar]
  3. Giray, F.H. An analysis of world lavender oil markets and lessons for Turkey. J. Essent. Oil Bear. Plants 2018, 21, 1612–1623. [Google Scholar] [CrossRef]
  4. Lis-Balchin, M. Lavender: The Genus Lavandula; CRC Press: London, UK, 2002. [Google Scholar]
  5. Pokajewicz, K.; Czarniecka-Wiera, M.; Krajewska, A.; Maciejczyk, E.; Wieczorek, P.P. Lavandula × intermedia—A Bastard lavender or a plant of many values? Part I. Biology and chemical composition of lavandin. Molecules 2023, 28, 2943. [Google Scholar] [CrossRef]
  6. Crișan, I.; Ona, A.; Vârban, D.; Muntean, L.; Vârban, R.; Stoie, A.; Mihăiescu, T.; Morea, A. Current trends for lavender (Lavandula angustifolia Mill.) crops and products with emphasis on essential oil quality. Plants 2023, 12, 357. [Google Scholar] [CrossRef]
  7. Aprotosoaie, A.C.; Gille, E.; Trifan, A.; Luca, V.S.; Miron, A. Essential oils of Lavandula genus: A systematic review of their chemistry. Phytochem. Rev. 2017, 16, 761–799. [Google Scholar] [CrossRef]
  8. Diass, K.; Merzouki, M.; Elfazazi, K.; Azzouzi, H.; Challioui, A.; Azzaoui, K.; Hammouti, B.; Touzani, R.; Depeint, F.; Ayerdi Gotor, A. Essential Oil of Lavandula officinalis: Chemical Composition and Antibacterial Activities. Plants 2023, 12, 1571. [Google Scholar] [CrossRef]
  9. Malloggi, E.; Menicucci, D.; Cesari, V.; Frumento, S.; Gemignani, A.; Bertoli, A. Lavender aromatherapy: A systematic review from essential oil quality and administration methods to cognitive enhancing effects. Appl. Psychol. Health Well-Being 2022, 14, 663–690. [Google Scholar] [CrossRef]
  10. Wells, R.; Truong, F.; Adal, A.M.; Sarker, L.S.; Mahmoud, S.S. Lavandula essential oils: A current review of applications in medicinal, food, and cosmetic industries of lavender. Nat. Prod. Commun. 2018, 13, 1934578X1801301038. [Google Scholar] [CrossRef]
  11. Stanev, S.; Zagorcheva, T.; Atanassov, I. Lavender cultivation in Bulgaria-21 st century developments, breeding challenges and opportunities. Bulg. J. Agric. Sci. 2016, 22, 584–590. [Google Scholar]
  12. Détár, E.; Németh, É.Z.; Gosztola, B.; Demján, I.; Pluhár, Z. Effects of variety and growth year on the essential oil properties of lavender (Lavandula angustifolia Mill.) and lavandin (Lavandula × intermedia Emeric ex Loisel.). Biochem. Syst. Ecol. 2020, 90, 104020. [Google Scholar] [CrossRef]
  13. Kiprovski, B.; Zeremski, T.; Varga, A.; Čabarkapa, I.; Filipović, J.; Lončar, B.; Aćimović, M. Essential oil quality of lavender grown outside its native distribution range: A study from Serbia. Horticulturae 2023, 9, 816. [Google Scholar] [CrossRef]
  14. Vijulie, I.; Lequeux-Dincă, A.-I.; Preda, M.; Mareci, A.; Matei, E. Could Lavender Farming Go from a Niche Crop to a Suitable Solution for Romanian Small Farms? Land 2022, 11, 662. [Google Scholar] [CrossRef]
  15. Despinasse, Y.; Moja, S.; Soler, C.; Jullien, F.; Pasquier, B.; Bessière, J.-M.; Baudino, S.; Nicolè, F. Structure of the chemical and genetic diversity of the true lavender over its natural range. Plants 2020, 9, 1640. [Google Scholar] [CrossRef] [PubMed]
  16. Dobreva, A.; Petkova, N.; Todorova, M.; Gerdzhikova, M.; Zherkova, Z.; Grozeva, N. Organic vs. Conventional Farming of Lavender: Effect on Yield, Phytochemicals and Essential Oil Composition. Agronomy 2023, 14, 32. [Google Scholar] [CrossRef]
  17. Jug-Dujaković, M.; Ninčević Runjić, T.; Grdiša, M.; Liber, Z.; Šatović, Z. Intra-and Inter-Cultivar Variability of Lavandin (Lavandula × intermedia Emeric ex Loisel.) Landraces from the Island of Hvar, Croatia. Agronomy 2022, 12, 1864. [Google Scholar] [CrossRef]
  18. Perović, A.B.; Karabegović, I.T.; Krstić, M.S.; Veličković, A.V.; Avramović, J.M.; Danilović, B.R.; Veljković, V.B. Novel hydrodistillation and steam distillation methods of essential oil recovery from lavender: A comprehensive review. Ind. Crops Prod. 2024, 211, 118244. [Google Scholar] [CrossRef]
  19. Ashraf, A.; Sultan, P.; Qazi, P.; Rasool, S. Approaches for the genetic improvement of Lavender: A short review. J. Pharmacogn. Phytochem. 2019, 8, 736–740. [Google Scholar]
  20. Sharan, H.; Pandey, P.; Singh, S. Genetic Resources and Breeding Strategies for Lavender (Lavandula angustifolia Mill.). In Ethnopharmacology and OMICS Advances in Medicinal Plants Volume 2: Revealing the Secrets of Medicinal Plants; Nandave, M., Joshi, R., Upadhyay, J., Eds.; Springer Nature: Singapore, 2024; pp. 33–54. [Google Scholar]
  21. Adal, A.M.; Mahmoud, S.S. Short-chain isoprenyl diphosphate synthases of lavender (Lavandula). Plant Mol. Biol. 2020, 102, 517–535. [Google Scholar] [CrossRef]
  22. Adal, A.M.; Najafianashrafi, E.; Sarker, L.S.; Mahmoud, S.S. Cloning, functional characterization and evaluating potential in metabolic engineering for lavender (+)-bornyl diphosphate synthase. Plant Mol. Biol. 2023, 111, 117–130. [Google Scholar] [CrossRef]
  23. Adal, A.M.; Sarker, L.S.; Malli, R.P.; Liang, P.; Mahmoud, S.S. RNA-Seq in the discovery of a sparsely expressed scent-determining monoterpene synthase in lavender (Lavandula). Planta 2019, 249, 271–290. [Google Scholar] [CrossRef]
  24. Demissie, Z.A.; Sarker, L.S.; Mahmoud, S.S. Cloning and functional characterization of β-phellandrene synthase from Lavandula angustifolia. Planta 2011, 233, 685–696. [Google Scholar] [CrossRef] [PubMed]
  25. Despinasse, Y.; Fiorucci, S.; Antonczak, S.; Moja, S.; Bony, A.; Nicolè, F.; Baudino, S.; Magnard, J.-L.; Jullien, F. Bornyl-diphosphate synthase from Lavandula angustifolia: A major monoterpene synthase involved in essential oil quality. Phytochemistry 2017, 137, 24–33. [Google Scholar] [CrossRef] [PubMed]
  26. Guitton, Y.; Nicolè, F.; Moja, S.; Valot, N.; Legrand, S.; Jullien, F.; Legendre, L. Differential accumulation of volatile terpene and terpene synthase mRNAs during lavender (Lavandula angustifolia and L. × intermedia) inflorescence development. Physiol. Plant. 2010, 138, 150–163. [Google Scholar] [CrossRef] [PubMed]
  27. Dong, Y.; Zhang, W.; Li, J.; Wang, D.; Bai, H.; Li, H.; Shi, L. The transcription factor LaMYC4 from lavender regulates volatile Terpenoid biosynthesis. BMC Plant Biol. 2022, 22, 289. [Google Scholar] [CrossRef]
  28. Sarker, L.S.; Adal, A.M.; Mahmoud, S.S. Diverse transcription factors control monoterpene synthase expression in lavender (Lavandula). Planta 2020, 251, 1–5. [Google Scholar] [CrossRef]
  29. Cheng, S.; Zhang, X.; Mu, H.; Wang, J.; Jiang, Y.; Li, X.; Wen, Y.; Ma, Q.; Guo, S. Transcriptome analysis unravels differential genes involved in essential oil content in callus and tissue culture seedlings of Lavandula angustifolia. Biotechnol. Biotechnol. Equip. 2024, 38, 2367097. [Google Scholar] [CrossRef]
  30. Guo, D.; Kang, K.; Wang, P.; Li, M.; Huang, X. Transcriptome profiling of spike provides expression features of genes related to terpene biosynthesis in lavender. Sci. Rep. 2020, 10, 6933. [Google Scholar] [CrossRef]
  31. Lane, A.; Boecklemann, A.; Woronuk, G.N.; Sarker, L.; Mahmoud, S.S. A genomics resource for investigating regulation of essential oil production in Lavandula angustifolia. Planta 2010, 231, 835–845. [Google Scholar] [CrossRef]
  32. Kelimujiang, K.; Zhang, W.; Zhang, X.; Waili, A.; Tang, X.; Chen, Y.; Chen, L. Genome-wide investigation of WRKY gene family in Lavandula angustifolia and potential role of LaWRKY57 and LaWRKY75 in the regulation of terpenoid biosynthesis. Front. Plant Sci. 2024, 15, 1449299. [Google Scholar] [CrossRef]
  33. Li, H.; Li, J.; Dong, Y.; Hao, H.; Ling, Z.; Bai, H.; Wang, H.; Cui, H.; Shi, L. Time-series transcriptome provides insights into the gene regulation network involved in the volatile terpenoid metabolism during the flower development of lavender. BMC Plant Biol. 2019, 19, 313. [Google Scholar] [CrossRef]
  34. Zhang, W.; Li, J.; Dong, Y.; Huang, Y.; Qi, Y.; Bai, H.; Li, H.; Shi, L. Genome-wide identification and expression of BAHD acyltransferase gene family shed novel insights into the regulation of linalyl acetate and lavandulyl acetate in lavender. J. Plant Physiol. 2024, 292, 154143. [Google Scholar] [CrossRef] [PubMed]
  35. Malli, R.P.; Adal, A.M.; Sarker, L.S.; Liang, P.; Mahmoud, S.S. De novo sequencing of the Lavandula angustifolia genome reveals highly duplicated and optimized features for essential oil production. Planta 2019, 249, 251–256. [Google Scholar] [CrossRef]
  36. Li, J.; Wang, Y.; Dong, Y.; Zhang, W.; Wang, D.; Bai, H.; Li, K.; Li, H.; Shi, L. The chromosome-based lavender genome provides new insights into Lamiaceae evolution and terpenoid biosynthesis. Hortic. Res. 2021, 8, 90. [Google Scholar] [CrossRef]
  37. Hamilton, J.P.; Vaillancourt, B.; Wood, J.C.; Wang, H.; Jiang, J.; Soltis, D.E.; Buell, C.R.; Soltis, P.S. Chromosome-scale genome assembly of the ‘Munstead’ cultivar of Lavandula angustifolia. BMC Genom. Data 2023, 24, 75. [Google Scholar] [CrossRef]
  38. Fontez, M.; Bony, A.; Nicole, F.; Moja, S.; Jullien, F. Lavandula angustifolia Mill. a model of aromatic and medicinal plant to study volatile organic compounds synthesis, evolution and ecological functions. Bot. Lett. 2023, 170, 65–76. [Google Scholar] [CrossRef]
  39. Guitton, Y.; Nicolè, F.; Moja, S.; Benabdelkader, T.; Valot, N.; Legrand, S.; Jullien, F.; Legendre, L. Lavender inflorescence: A model to study regulation of terpenes synthesis. Plant Signal. Behav. 2010, 5, 749–751. [Google Scholar] [CrossRef]
  40. Habán, M.; Korczyk-Szabó, J.; Čerteková, S.; Ražná, K. Lavandula Species, Their Bioactive Phytochemicals, and Their Biosynthetic Regulation. Int. J. Mol. Sci. 2023, 24, 8831. [Google Scholar] [CrossRef]
  41. Adal, A.M.; Demissie, Z.A.; Mahmoud, S.S. Identification, validation and cross-species transferability of novel Lavandula EST-SSRs. Planta 2015, 241, 987–1004. [Google Scholar] [CrossRef]
  42. Zagorcheva, T.; Stanev, S.; Rusanov, K.; Atanassov, I. SRAP markers for genetic diversity assessment of lavender (Lavandula angustifolia mill.) varieties and breeding lines. Biotechnol. Biotechnol. Equip. 2020, 34, 303–308. [Google Scholar] [CrossRef]
  43. Ražná, K.; Čerteková, S.; Štefúnová, V.; Habán, M.; Korczyk-Szabó, J.; Ernstová, M. Lavandula spp. diversity assessment by molecular markers as a tool for growers. Agrobiodivers. Improv.Nutr. Health Life Qual. 2023, 7, 27–39. [Google Scholar] [CrossRef]
  44. Chahota, R.K.; Katoch, M.; Sharma, P.K.; Thakur, S.R. QTLs and Gene Tagging in Crop Plants. In Agricultural Biotechnology: Latest Research and Trends; Kumar Srivastava, D., Kumar Thakur, A., Kumar, P., Eds.; Springer Nature: Singapore, 2021; pp. 537–552. [Google Scholar]
  45. Chaturvedi, T.; Gupta, A.K.; Lal, R.K.; Tiwari, G. March of molecular breeding techniques in the genetic enhancement of herbal medicinal plants: Present and future prospects. Nucleus 2022, 65, 413–436. [Google Scholar] [CrossRef]
  46. Stanev, S. Evaluation of the stability and adaptability of the Bulgarian lavender (Lavandula angustifolia Mill.) sorts yield. Agric. Sci. Technol. 2010, 2, 121–123. [Google Scholar]
  47. Valchev, H.; Kolev, Z.; Stoykova, B.; Kozuharova, E. Pollinators of Lavandula angustifolia Mill. an important factor for optimal production of lavender essential oil. BioRisk 2022, 17, 297–307. [Google Scholar] [CrossRef]
  48. Alekseeva, M.E.; Rusanova, M.G.; Georgieva, L.N.; Rusanov, K.E.; Atanassov, I.I. High cross-pollination rate of Greek oregano (O. vulgare ssp. hirtum) with Common oregano (O. vulgare ssp. vulgare) under open field conditions as revealed by microsatellite marker analysis. Biotechnol. Biotechnol. Equip. 2023, 37, 2279636. [Google Scholar] [CrossRef]
  49. Valchev, H.; Kozuharova, E. In situ and ex situ investigations on breeding systems and pollination of Sideritis scardica Griseb.(Lamiaceae) in Bulgaria. Proc. Bulg. Acad. Sci. 2022, 75, 527–535. [Google Scholar] [CrossRef]
  50. Alekseeva, M.; Rusanova, M.; Rusanov, K.; Atanassov, I. A set of highly polymorphic microsatellite markers for genetic diversity studies in the genus Origanum. Plants 2023, 12, 824. [Google Scholar] [CrossRef]
  51. Manco, R.; Chiaiese, P.; Basile, B.; Corrado, G. Comparative analysis of genomic-and EST-SSRs in European plum (Prunus domestica L.): Implications for the diversity analysis of polyploids. 3 Biotech 2020, 10, 543. [Google Scholar] [CrossRef]
  52. Garavello, M.; Cuenca, J.; Dreissig, S.; Fuchs, J.; Navarro, L.; Houben, A.; Aleza, P. Analysis of crossover events and allele segregation distortion in interspecific citrus hybrids by single pollen genotyping. Front. Plant Sci. 2020, 11, 615. [Google Scholar] [CrossRef]
  53. Ma, Z.; Gao, W.; Liu, L.; Liu, M.; Zhao, N.; Han, M.; Wang, Z.; Jiao, W.; Gao, Z.; Hu, Y. Identification of QTL for resistance to root rot in sweetpotato (Ipomoea batatas (L.) Lam) with SSR linkage maps. BMC Genom. 2020, 21, 366. [Google Scholar] [CrossRef]
  54. Martin, G.; Baurens, F.C.; Hervouet, C.; Salmon, F.; Delos, J.M.; Labadie, K.; Perdereau, A.; Mournet, P.; Blois, L.; Dupouy, M. Chromosome reciprocal translocations have accompanied subspecies evolution in bananas. Plant J. 2020, 104, 1698–1711. [Google Scholar] [CrossRef]
  55. Mittelsten Scheid, O. Mendelian and non-Mendelian genetics in model plants. Plant Cell 2022, 34, 2455–2461. [Google Scholar] [CrossRef] [PubMed]
  56. Yoosefzadeh Najafabadi, M.; Hesami, M.; Rajcan, I. Unveiling the mysteries of non-mendelian heredity in plant breeding. Plants 2023, 12, 1956. [Google Scholar] [CrossRef] [PubMed]
  57. Canaguier, A.; Grimplet, J.; Di Gaspero, G.; Scalabrin, S.; Duchêne, E.; Choisne, N.; Mohellibi, N.; Guichard, C.; Rombauts, S.; Le Clainche, I. A new version of the grapevine reference genome assembly (12X. v2) and of its annotation (VCost. v3). Genom. Data 2017, 14, 56. [Google Scholar] [CrossRef] [PubMed]
  58. Howe, K.; Chow, W.; Collins, J.; Pelan, S.; Pointon, D.-L.; Sims, Y.; Torrance, J.; Tracey, A.; Wood, J. Significantly improving the quality of genome assemblies through curation. GigaScience 2021, 10, giaa153. [Google Scholar] [CrossRef]
  59. Li, S.; Yang, G.; Yang, S.; Just, J.; Yan, H.; Zhou, N.; Jian, H.; Wang, Q.; Chen, M.; Qiu, X.; et al. The development of a high-density genetic map significantly improves the quality of reference genome assemblies for rose. Sci. Rep. 2019, 9, 5985. [Google Scholar] [CrossRef]
  60. Anilkumar, C.; Sunitha, N.; Harikrishna; Devate, N.B.; Ramesh, S. Advances in integrated genomic selection for rapid genetic gain in crop improvement: A review. Planta 2022, 256, 87. [Google Scholar] [CrossRef]
  61. Liu, Z.; Bernard, A.; Wang, Y.; Dirlewanger, E.; Wang, X. Genomes and integrative genomic insights into the genetic architecture of main agronomic traits in the edible cherries. Hortic. Res. 2025, 12, uhae269. [Google Scholar] [CrossRef]
  62. Vervalle, J.A.; Costantini, L.; Lorenzi, S.; Pindo, M.; Mora, R.; Bolognesi, G.; Marini, M.; Lashbrooke, J.G.; Tobutt, K.R.; Vivier, M.A. A high-density integrated map for grapevine based on three mapping populations genotyped by the Vitis 18K SNP chip. Theor. Appl. Genet. 2022, 135, 4371–4390. [Google Scholar] [CrossRef]
  63. Seira, E.; Poulaki, S.; Hassiotis, C.; Poulios, S.; Vlachonasios, K.E. Gene Expression of Monoterpene Synthases Is Affected Rhythmically during the Day in Lavandula angustifolia Flowers. Physiologia 2023, 3, 433–441. [Google Scholar] [CrossRef]
  64. Yildirim, M.U.; Sarihan, E.O.; Kul, H.; Khawar, K.M. Diurnal and nocturnal variability of essential oil content and components of Lavandula angustifolia Mill.(Lavender). Mustafa Kemal Univ. J. Agric. Sci./Mustafa Kemal Üniversitesi Tarım Bilim. Derg. 2019, 24, 268–278. [Google Scholar]
  65. Zagorcheva, T.; Rusanov, K.; Stanev, S.; Atanassov, I. A simple procedure for comparative GC-MS analysis of lavender (Lavandula angustifolia Mill.) flower volatile composition. IOSR J. Pharm. Biol. Sci. 2016, 11, 9–14. [Google Scholar] [CrossRef]
  66. Rusanov, K.; Vassileva, P.; Rusanova, M.; Atanassov, I. Identification of QTL controlling the ratio of linalool to linalyl acetate in the flowers of Lavandula angustifolia Mill var. Hemus. Biotechnol. Biotechnol. Equip. 2023, 37, 2288929. [Google Scholar] [CrossRef]
  67. Li, J.; Li, H.; Wang, Y.; Zhang, W.; Wang, D.; Dong, Y.; Ling, Z.; Bai, H.; Jin, X.; Hu, X. Decoupling subgenomes within hybrid lavandin provide new insights into speciation and monoterpenoid diversification of Lavandula. Plant Biotechnol. J. 2023, 21, 2084. [Google Scholar] [CrossRef] [PubMed]
  68. Landmann, C.; Fink, B.; Festner, M.; Dregus, M.; Engel, K.-H.; Schwab, W. Cloning and functional characterization of three terpene synthases from lavender (Lavandula angustifolia). Arch. Biochem. Biophys. 2007, 465, 417–429. [Google Scholar] [CrossRef]
  69. Jullien, F.; Moja, S.; Bony, A.; Legrand, S.; Petit, C.; Benabdelkader, T.; Poirot, K.; Fiorucci, S.; Guitton, Y.; Nicolè, F. Isolation and functional characterization of a τ-cadinol synthase, a new sesquiterpene synthase from Lavandula angustifolia. Plant Mol. Biol. 2014, 84, 227–241. [Google Scholar] [CrossRef]
  70. Sarker, L.S.; Mahmoud, S.S. Cloning and functional characterization of two monoterpene acetyltransferases from glandular trichomes of L. × intermedia. Planta 2015, 242, 709–719. [Google Scholar] [CrossRef]
  71. Adal, A.M.; Sarker, L.S.; Lemke, A.D.; Mahmoud, S.S. Isolation and functional characterization of a methyl jasmonate-responsive 3-carene synthase from Lavandula x intermedia. Plant Mol. Biol. 2017, 93, 641–657. [Google Scholar] [CrossRef]
  72. Murray, M.; Thompson, W. Rapid isolation of high molecular weight plant DNA. Nucleic Acids Res. 1980, 8, 4321–4326. [Google Scholar] [CrossRef]
  73. Andrews, S. FastQC: A Quality Control Tool for High Throughput Sequence Data. Available online: https://www.bioinformatics.babraham.ac.uk/projects/fastqc/ (accessed on 23 August 2023).
  74. Edgar, R.C. Search and clustering orders of magnitude faster than BLAST. Bioinformatics 2010, 26, 2460–2461. [Google Scholar] [CrossRef]
  75. Benson, G. Tandem repeats finder: A program to analyze DNA sequences. Nucleic Acids Res. 1999, 27, 573–580. [Google Scholar] [CrossRef]
  76. Koressaar, T.; Remm, M. Enhancements and modifications of primer design program Primer3. Bioinformatics 2007, 23, 1289–1291. [Google Scholar] [CrossRef] [PubMed]
  77. Untergasser, A.; Cutcutache, I.; Koressaar, T.; Ye, J.; Faircloth, B.C.; Remm, M.; Rozen, S.G. Primer3—New capabilities and interfaces. Nucleic Acids Res. 2012, 40, e115. [Google Scholar] [CrossRef] [PubMed]
  78. O’Leary, N.A.; Cox, E.; Holmes, J.B.; Anderson, W.R.; Falk, R.; Hem, V.; Tsuchiya, M.T.; Schuler, G.D.; Zhang, X.; Torcivia, J. Exploring and retrieving sequence and metadata for species across the tree of life with NCBI Datasets. Sci. Data 2024, 11, 732. [Google Scholar] [CrossRef] [PubMed]
  79. Du, L.; Zhang, C.; Liu, Q.; Zhang, X.; Yue, B. Krait: An ultrafast tool for genome-wide survey of microsatellites and primer design. Bioinformatics 2018, 34, 681–683. [Google Scholar] [CrossRef]
  80. Blacket, M.; Robin, C.; Good, R.; Lee, S.; Miller, A. Universal primers for fluorescent labelling of PCR fragments—An efficient and cost-effective approach to genotyping by fluorescence. Mol. Ecol. Resour. 2012, 12, 456–463. [Google Scholar] [CrossRef]
  81. Schuelke, M. An economic method for the fluorescent labeling of PCR fragments. Nat. Biotechnol. 2000, 18, 233–234. [Google Scholar] [CrossRef]
  82. Li, G.; Quiros, C.F. Sequence-related amplified polymorphism (SRAP), a new marker system based on a simple PCR reaction: Its application to mapping and gene tagging in Brassica. Theor. Appl. Genet. 2001, 103, 455–461. [Google Scholar] [CrossRef]
  83. Ooijen, V. JoinMap® 5, Software for the Calculation of Genetic Linkage Maps in Experimental Populations of Diploid Species; Kyazma BV: Wageningen, The Netherlands, 2018. [Google Scholar]
  84. Voorrips, R.E. MapChart: Software for the Graphical Presentation of Linkage Maps and QTLs. J. Hered. 2002, 93, 77–78. [Google Scholar] [CrossRef]
Figure 1. Genetic linkage map of L. angustifolia var. Hemus.
Ijms 26 03705 g001
Table 1. Development and selection of polymorphic SSR and SRAP markers.
Type of the Tested MarkersTotal Number of Tested MarkersMarkers Showing Positive Amplification and Distinct Pattern
(% from the Total Number of Tested Markers)
Number of Polymorphic Markers
(% from the Total Number of Tested Markers)
[% from the Markers with
Positive Amplification]
Total Number of Loci Identified
(Average Number of Detected Loci per Marker)
NGS-SSR471442 (93.8%)255 (54.1%) [57.7%]282 (1.11)
GEN-SSR170154 (90.6%)79 (46.5%) [51.3%]90 (1.14)
EST-SSR2217 (77.3%)5 (22.7%) [29.4%]5 (1.0)
SRAP1111 (100%)11 (100%) [100%]33 (3.0)
Total for the SSR markers663613339377
Table 2. Summary of the L. angustifolia var. Hemus genetic linkage map and location of the loci on the reference genome sequence.
Linkage GroupNumber of Loci **Map Length (cM)Map
Density (Loci/cM)
Largest
Gap (cM)
Chromosome
Sequence (Mbp)
Foremost Position of the Loci (Mbp)Rearmost Position of the Loci (Mbp)Coverage of the Chromosome
(%)
LG122154.237.0117.6943.131.6440.3889.8%
LG219123.386.4919.6840.251.0839.5195.5%
LG329127.304.398.9339.131.5439.0996.0%
LG422141.746.4424.5037.480.3034.6591.6%
LG512116.899.7422.9235.701.8634.6891.9%
LG621180.248.5826.0635.320.0835.1899.4%
LG7 *21160.207.6318.8334.570.0534.2198.8%
LG81580.215.3526.3833.581.3133.4795.8%
LG91275.126.2615.8333.0310.0630.8763.0%
LG1014146.1210.4427.9132.610.1432.2198.3%
LG111286.217.1821.5931.760.7831.0095.2%
LG1222171.627.8026.1031.370.0226.3884.0%
LG13871.038.8819.8130.097.4226.9364.8%
LG1423153.856.6911.2629.440.2528.7596.8%
LG15 *1151.394.678.4628.691.1627.9893.5%
LG16993.8810.4329.8928.471.0415.0649.2%
LG171268.545.7115.7027.942.5422.5271.5%
LG1813113.778.7514.2627.542.6127.5190.4%
LG191476.305.4512.7527.400.1119.5971.1%
LG201199.869.0825.0527.084.1326.8784.0%
LG211392.037.0818.8627.055.2026.5478.9%
LG221270.645.8920.4526.810.5925.1591.6%
LG23725.233.607.0726.6314.1824.0937.2%
LG241085.098.5114.6423.281.4517.9871.0%
LG251166.706.0614.2522.941.3716.5566.2%
Minimal value for LG725.233.60 37.2%
Maximal value for LG29180.2410.44 99.4%
Average value per LG15
+/−5.67
105.26
+/−40.73
82.6%
+/−16.7%
Total value for the map3752631.577.01
* LG7 and LG15 present a summary of the data for the corresponding sub-linkage groups (LG7-1; LG7-2; LG15-1; LG15-2). ** not including 36 analyzed loci, among them 14 loci for which no affiliation to a particular LG was found and 22 loci showing segregation distortion and affiliated to different LGs, of which inclusion resulted in significant changes in the LG map.
Table 3. SSR marker transferability.
PCR Amplification (*)Results of SSR Amplification from DNA of the Tested Plants **
L. angustifolia
var. Hidcote Blue
L. latifolia
Ll_abi2
L. latifolia
Bastin Nursery
L. × heterophylla var. Big Boy James
(+)291243172251
93.9%78.4%78.5%81.0%
(w)1015710
3.2%4.8%3.2%3.2%
(−)9524049
2.9%16.8%18.3%15.8%
Total number of tested SSRs310310219310
* (+) distinct PCR amplification similar to that of L. angustifolia var. Hemus, used as positive control; (w) weak PCR amplification; (−) no PCR amplification observed. ** percentage from the total number of tested plants.
Table 4. Results from GC/MS analysis of the composition of volatiles in the flowers of plants from the segregating population.
NoCompoundRT(s)RIAverage * +/− Stdev
(%)
Minimal *
Content (%)
Maximal *
Content
(%)
Min/
Average **
(%)
Max/
Average **
(%)
1Toluene527.81039.00.329 +/− 0.1170.0070.7782.0236.8
2Camphene563.21055.20.131 +/− 0.0790.0270.41620.8317.2
3β-Pinene657.81098.80.045 +/− 0.0310.0070.18616.0411.5
4Sabinene688.31112.90.068 +/− 0.0250.0250.13437.5198.4
53-Carene756.11144.20.082 +/− 0.0720.0100.37111.9453.1
6β-Myrcene795.31162.30.188 +/− 0.0860.0790.61442.2326.4
7D-Limonene893.61204.90.453 +/− 0.1780.1811.05040.0231.9
8Eucalyptol916.41211.80.403 +/− 0.4460.0001.4420.0357.8
9β-Phellandrene921.71213.40.627 +/− 0.8890.0003.6780.0586.7
10trans-β-Ocimene1003.91238.22.040 +/− 1.0820.4775.56123.4272.6
11β-Ocimene1057.71254.41.572 +/− 1.4640.0486.1023.1388.2
123-Octanone1065.71256.91.108 +/− 0.7230.0002.8780.0259.7
13Hexyl acetate1124.21274.50.285 +/− 0.1170.0930.56632.5198.7
143-Octanol, acetate1337.21338.80.070 +/− 0.0750.0000.3950.0566.4
151-Octen-3-yl-acetate1489.71384.80.828 +/− 0.4680.0692.0168.3243.4
161-Octen-3-ol1742.71457.00.190 +/− 0.1320.0350.61818.4324.8
17Camphor1965.31519.60.088 +/− 0.0390.0370.23242.4263.3
18Linalool2096.01556.424.788 +/− 8.3647.45745.28630.1182.7
19Linalyl acetate2130.81566.244.435 +/− 9.45519.24761.66243.3138.8
20α-Santalene2168.21576.70.387 +/− 0.3450.0001.5110.0390.1
21Borneol acetate2198.91585.40.176 +/− 0.1190.0000.5340.0302.7
22α-Bergamotene2209.61588.40.080 +/− 0.0730.0000.3120.0388.2
23β-Caryophyllene2248.01599.24.739 +/− 2.8191.45716.88830.7356.3
24Lavandulyl acetate2299.11614.42.739 +/− 2.1580.17011.2496.2410.7
25α-Humulene2496.71673.30.991 +/− 1.5810.0006.2660.0632.6
26Crypton2503.61675.40.433 +/− 0.3840.0001.1290.0260.6
27Lavandulol2540.61686.40.148 +/− 0.1530.0000.9870.0668.9
28Borneol2614.71708.50.512 +/− 0.2660.0161.4433.2281.6
29γ-Cadinene2793.51761.90.226 +/− 0.1880.0040.8011.9355.1
30p-Isopropylbenzaldehyde2880.71787.90.200 +/− 0.0510.0990.31349.6156.0
31Caryophyllene oxide3293.11994.50.408 +/− 0.2050.1271.27431.2312.6
32p-Cymen-7-ol3406.22123.20.299 +/− 0.1340.0541.23218.2412.4
33tau.-Cadinol3465.82194.70.953 +/− 0.6340.1532.91016.0305.2
34Coumarin3791.12510.70.590 +/− 0.2190.1861.30831.6221.8
* Average amount for the entire population and minimal and maximal amounts of the volatile compound in the flower extracts from the plants of the segregating population. ** Calculated ratios of the minimal and maximal amount scored for the compound to the average amount of the compound for the entire population.
Table 5. Overview of detected QTLs associated with volatile terpene contents.
NoTraitQTL NameLOD *LGPeak (cM)Left MarkerRight MarkerPVE (%) **Additive
(%) ***
1Tolueneq01-5.15.2752.00ABIL527AABIL10325.9−0.083
2 q01-5.25.26595.82ABIL531ABIL16425.6−0.075
3Camphene q02-11.14.801181.94ABIL416BABIL7723.9−0.064
4 q02-20.14.582048.52ABIL505ABIL1522.6−0.025
5β-Pineneq03-11.15.351186.12ABIL416BABIL7726.2−0.024
6Sabinene q04-3.14.04354.74ABIL506ABIL456A20.1−0.019
7 q04-3.24.79361.19ABIL322ABIL6323.8−0.022
8 q04-19.14.171938.07E10M8-344ABIL42921.10.015
93-Careneq05-5.115.61538.45ABIL330E4M1-8558.80.083
10D-Limoneneq06-19.15.431932.53ABIL11E10M8-34426.60.121
11β-Phellandreneq07-2.14.67238.20ABIL473ABIL530A23.3−0.563
12 q07-19.14.811931.53ABIL11E10M8-34423.90.605
13trans-β-Ocimeneq08-2.14.45214.08ABIL163ABIL51922.3−0.644
14 q08-2.24.03249.02ABIL91BABIL26820.5−0.660
15 q08-6.16.96613.00ABIL517AABIL53832.70.811
16 q08-24.14.092433.42ABIL393BABIL58520.7−1.042
173-Octanone q09-1.112.2016.96ABIL510ABIL1450.00.681
18 q09-1.26.24152.47ABIL388ABIL36129.80.565
19 q09-1.34.491106.83ABIL371ABIL35222.80.471
203-Octanol acetateq10-1.16.20117.72ABIL14ABIL51229.70.057
211-Octen-3-yl-acetateq11-4.14.104128.91ABIL323ABIL24520.80.317
22 q11-8.16.03833.40ABIL550ABIL54829.00.206
231-Octen-3-ol q12-8.14.39859.13ABIL554AABIL40822.10.105
24Linalool q13-6.14.33621.09ABIL538ABIL6621.8−5.217
25 q13-8.112.17834.01ABIL550ABIL54850.29.134
26Linalyl acetateq14-8.111.95833.40ABIL550ABIL54849.3−10.576
27α-Santaleneq15-12.14.0412165.01ABIL409E2M10-21420.50.384
28Borneol acetateq16-11.14.861182.96ABIL416BABIL7724.2−0.092
29α-Bergamoteneq17-12.14.4412165.01ABIL409E2M10-21422.80.048
30β-Caryophylleneq18-6.15.46661.64ABIL251ABIL539A27.42.180
31 q18-12.16.3912101.13ABIL210ABIL4830.51.878
32 q18-12.25.4112168.01ABIL409E2M10-21426.51.859
33Lavandulyl acetateq19-3.117.35384.29ABIL312ABIL2762.7−2.187
34α-Humuleneq20-6.15.30619.09ABIL538ABIL6626.01.053
35 q20-12.17.261282.97ABIL61AABIL56033.8−1.262
36 q20-12.28.1512125.52ABIL332ABIL18737.1−1.252
37Lavandulolq21-3.18.47384.29ABIL312ABIL2738.2−0.135
38 q21-8.16.16816.05ABIL552ABIL33929.50.122
39Borneolq22-11.13.50 *1182.96ABIL416BABIL7718.1−0.179
40 q22-20.14.502044.52ABIL505ABIL1522.6−0.034
41γ-Cadineneq23-5.111.58558.69ABIL112ABIL503B48.2−0.175
42p-Isopropylbenzaldehydeq24-6.14.65625.09ABIL538ABIL6621.30.035
43tau.-Cadinol q25-5.111.67558.69ABIL112ABIL503B48.5−0.594
* QTLs with an LOD score higher than the LOD threshold calculated for the linkage group 11 but lower than the genome-wide LOD threshold calculated for this compound. ** the percentage of the variance explained by the QTL. *** the estimated additive effect for the QTL.
Table 6. Chromosome locations of QTLs and candidate genes.
ChromosomeTrait (QTL Name)QTL Markers and
Candidate Gene(s)
Chromosome Locations, kBpComment
References
CH11Camphene (q02-11.1)
β-Pinene (q03-11.1)
Borneol acetate (q16-11.1)
Borneol (q22-11.1)
Left QTL marker
ABIL416B
30,426LaBPPS (L. angustifolia bornyl diphosphate synthase)
LaBPPS catalyzes the production of various by-products, including borneol, camphene, and β-pinene [25].
BLAST search with sequence acc. number KM015221.
LaBPPS-like30,794
30,802
30,819
30,831
30,834
30,841
30,855
30,872
30,880
30,922
Right QTL marker
ABIL77
31,003
CH12α-Santalene (q15-12.1)
α-Bergamotene (q17-12.1)
β-Caryophyllene (q18-12.2)
Left QTL marker
ABIL409
26,385LaBERS (L. angustifolia trans-alpha-bergamotene synthase)
LaBERS catalyzes the production of various by-products including α-santalene, α-bergamotene, and β-caryophyllene [68].
BLAST search with sequence acc. number DQ263742
LaBERS-like28,836
28,848
30,868
30,899
Right QTL marker
E2M10-214
SRAP marker
CH5γ-Cadinene (q23-5.1)
tau.-Cadinol (q25-5.1)
Left QTL marker
ABIL112
29,285LaCADS (L. angustifolia tau-cadinol synthase)
LaCADS catalyzes the production of various by-products, including γ-cadinene and tau.-cadinol [69].
BLAST search with sequence acc. number JX401282
LaCADS-like30,139
30,143
30,154
30,158
Right QTL marker
ABIL503B
32,864
CH8Linalool (q13-8.1)
Linalyl acetate (q14-8.1)
Left QTL marker
ABIL550
20,261LiATT4 (Lavandula × intermedia alcohol acetyltransferase) [70].
LiATT4 catalyzes the production of linalyl acetate from linalool as substrate [67].
BLAST search with sequence acc. number KM275344.
LiAAT420,389
Right QTL marker
ABIL548
20,883
CH6Linalool (q13-6.1)Left QTL marker
ABIL538
27LaLINS (L. angustifolia linalool synthase)
LaLINS catalyzes the production of linalool from geranyl diphosphate [68].
BLAST search with sequence acc. number DQ263741
LaLINS362
Right QTL marker
ABIL66
548
CH53-Carene (q05-5.1)Left QTL marker
ABIL330
15,474Li3CARS (L. × intermedia 3-carene synthase)
Li3CARS catalyzes the production of 3-carene [71].
BLAST search with sequence acc. number KX024762
Li3CARS26,547
26,570
26,605
Right QTL marker
E4M1-85/ABIL13
28,143
Disclaimer/Publisher’s Note: The statements, opinions and data contained in all publications are solely those of the individual author(s) and contributor(s) and not of MDPI and/or the editor(s). MDPI and/or the editor(s) disclaim responsibility for any injury to people or property resulting from any ideas, methods, instructions or products referred to in the content.

