
Electrochromic Efficiency in AxB(1−x)Oy-Type Mixed Metal Oxide Alloys


Abstract
1. Introduction
- -
- The coloration efficiency measures the amount of optical change per unit of charge injected into the material. A higher coloration efficiency indicates a more efficient use of energy and can lead to lower power consumption in devices.
- -
- Optical modulation refers to the change in optical properties (transmittance, reflectance, and absorbance) when a material undergoes a redox reaction. High optical modulation is crucial for achieving significant color changes and achieving desired functionalities, such as dimming windows or creating displays.
- -
- Response time is the speed at which a material changes color in response to an applied voltage. Faster response times are generally desirable for applications such as dynamic displays or rapidly adjusting window tints.
- -
- Cycling stability refers to the ability of a material to maintain its electrochromic properties over repeated cycles of coloration and bleaching. Long-term stability is essential for practical applications to ensure durability and longevity.
- -
- Durability encompasses various factors, including resistance to degradation from environmental factors such as moisture, temperature, and UV radiation. Durable materials are necessary for long-lasting performance in real-world applications.
- -
- The color range is the range of colors that a material can achieve and is important for aesthetic and functional considerations. Materials that can achieve a wide range of colors offer greater versatility in applications.
- -
- Transparency in the bleached state is crucial for applications such as smart windows. High transparency is needed in the bleached state to allow maximum light transmission when not in use.
- -
- The operating voltage is the voltage required to induce color changes. It should be low to minimize power consumption and ensure compatibility with various power sources.
2. Overview
2.1. “Simple” Metal Oxides
2.2. Mixed Oxides
2.2.1. TiO2–WO3
2.2.2. SnO2–WO3
2.2.3. WO3–NiO
2.2.4. WO3–Ag
2.2.5. V2O5–WO3
2.2.6. V0.50Ti0.50Ox
2.2.7. WO3–MoO3
2.2.8. TiO2–MoO3
2.2.9. TiO2–SnO2
2.2.10. WO3–MoO3–V2O5
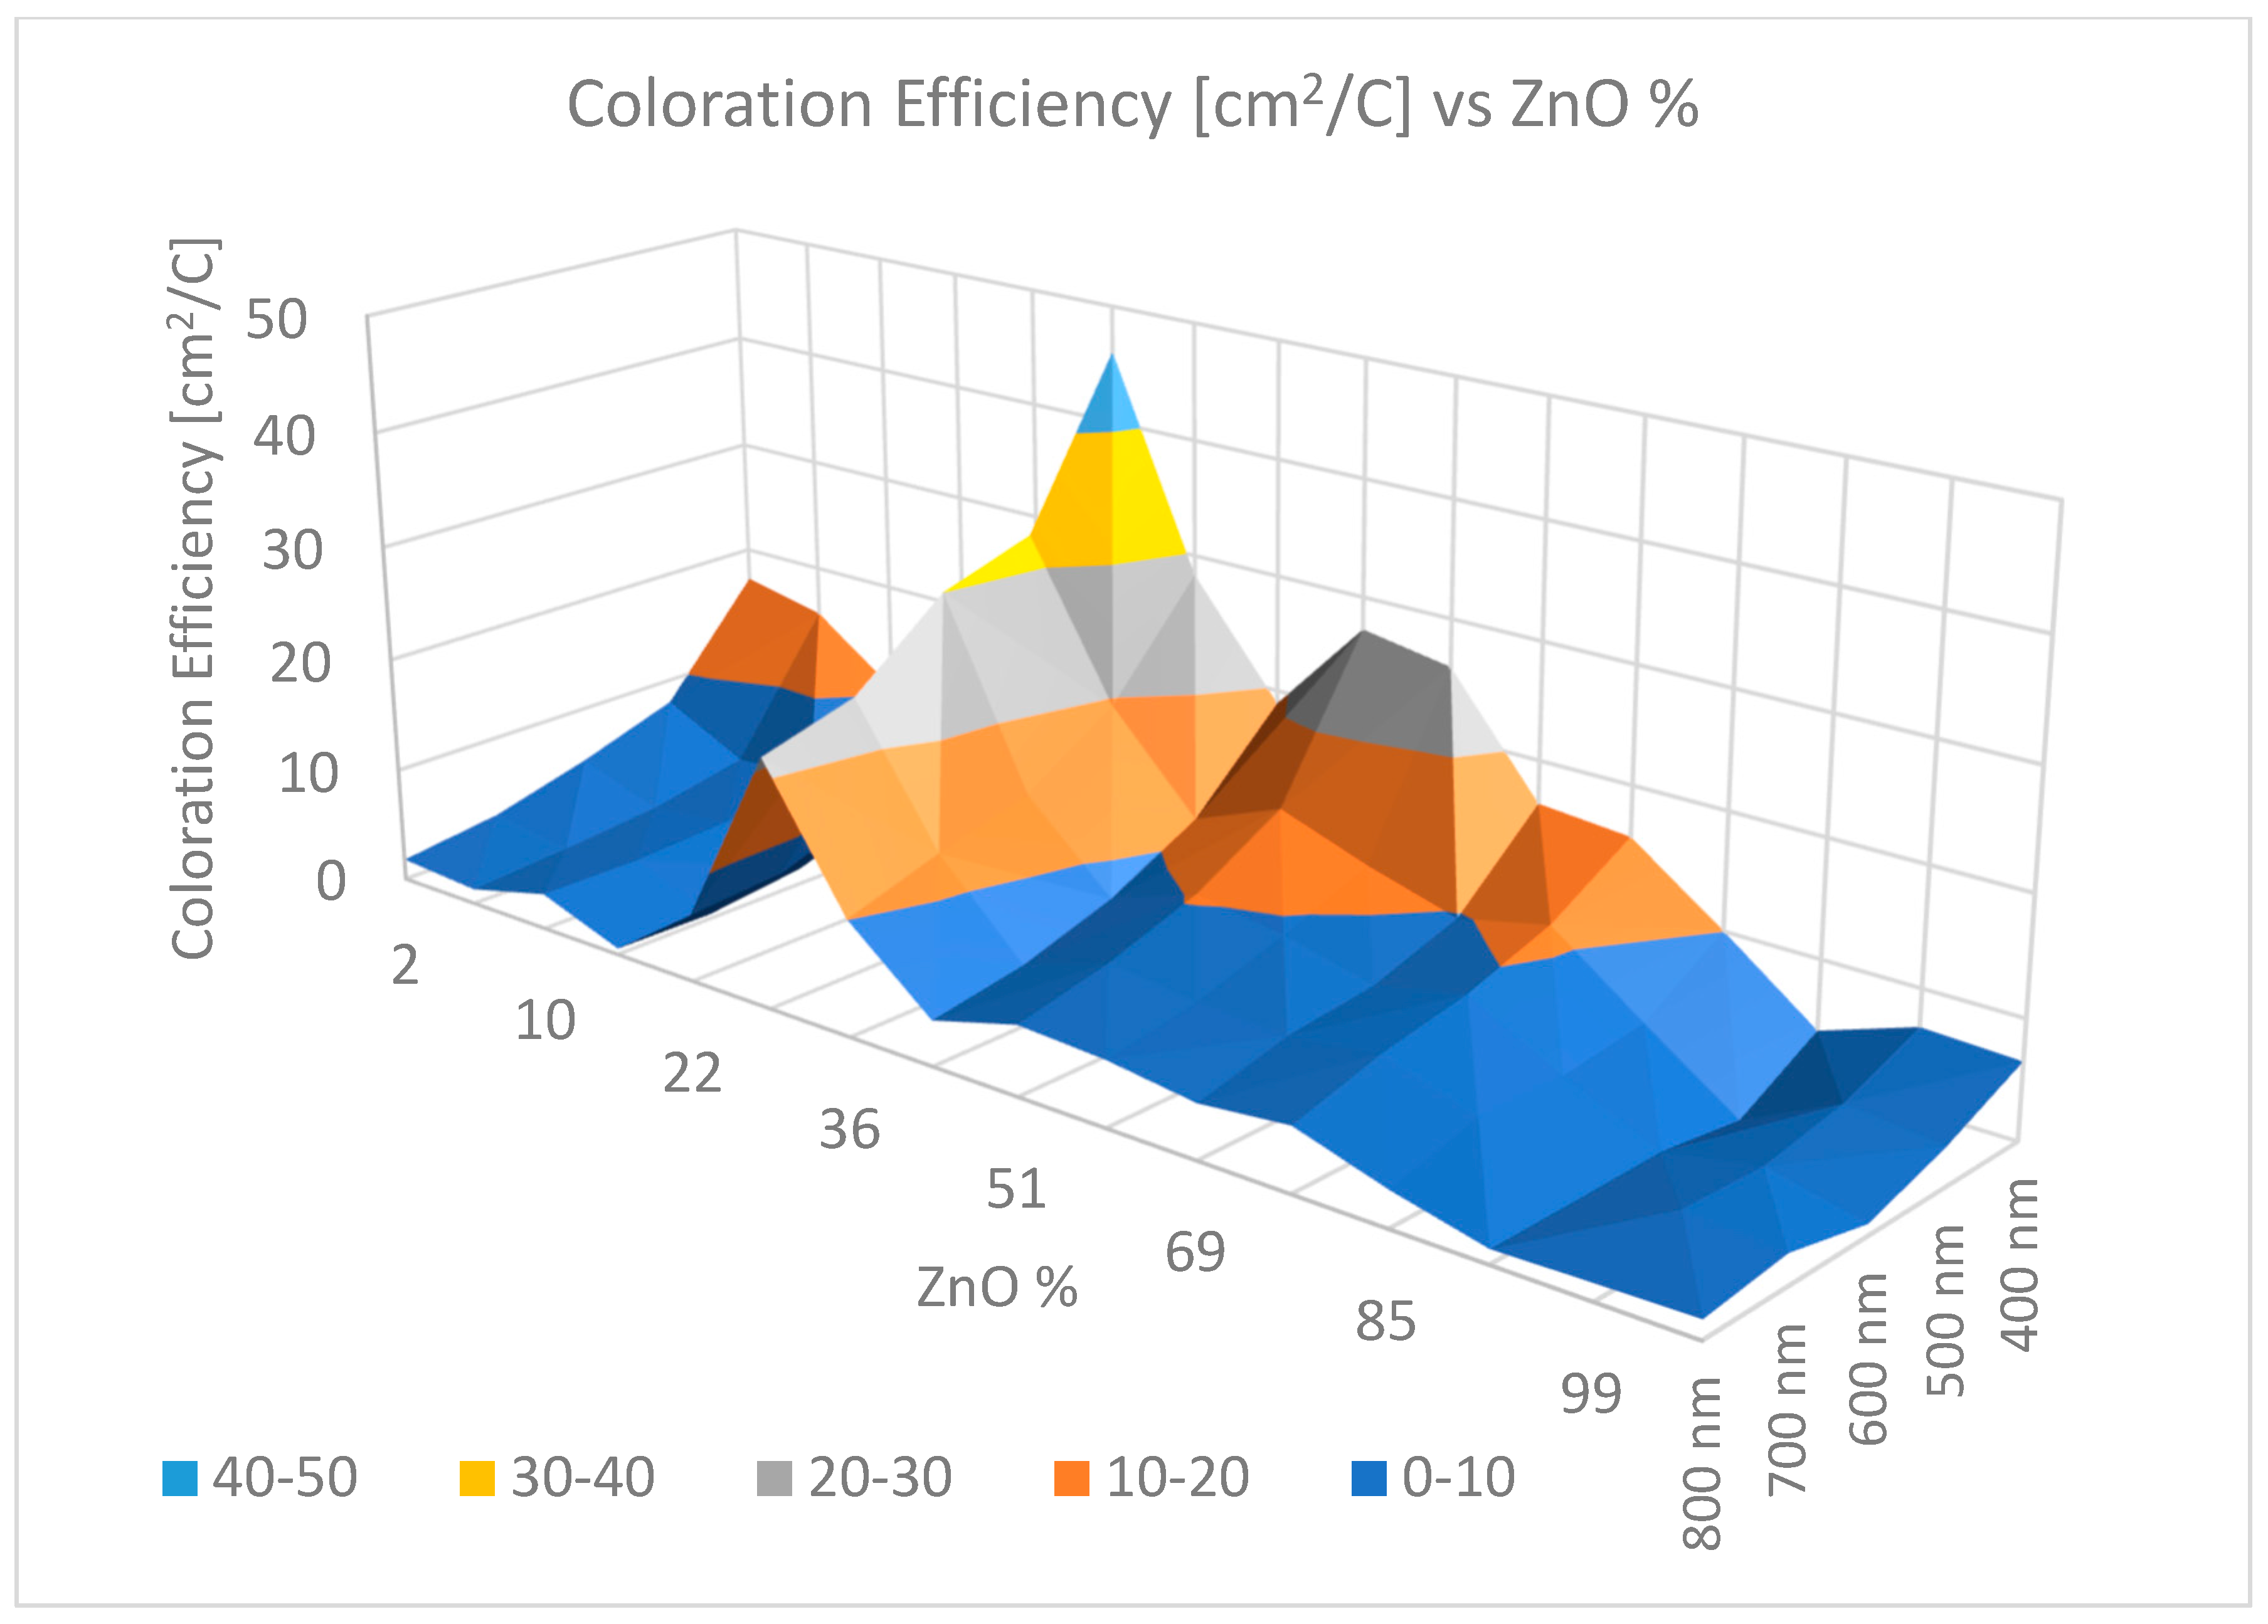
2.2.11. SnO2–ZnO
2.2.12. Ir–Ta Oxide
2.3. Newest Materials of Interest in EC Applications
3. Conclusions
- -
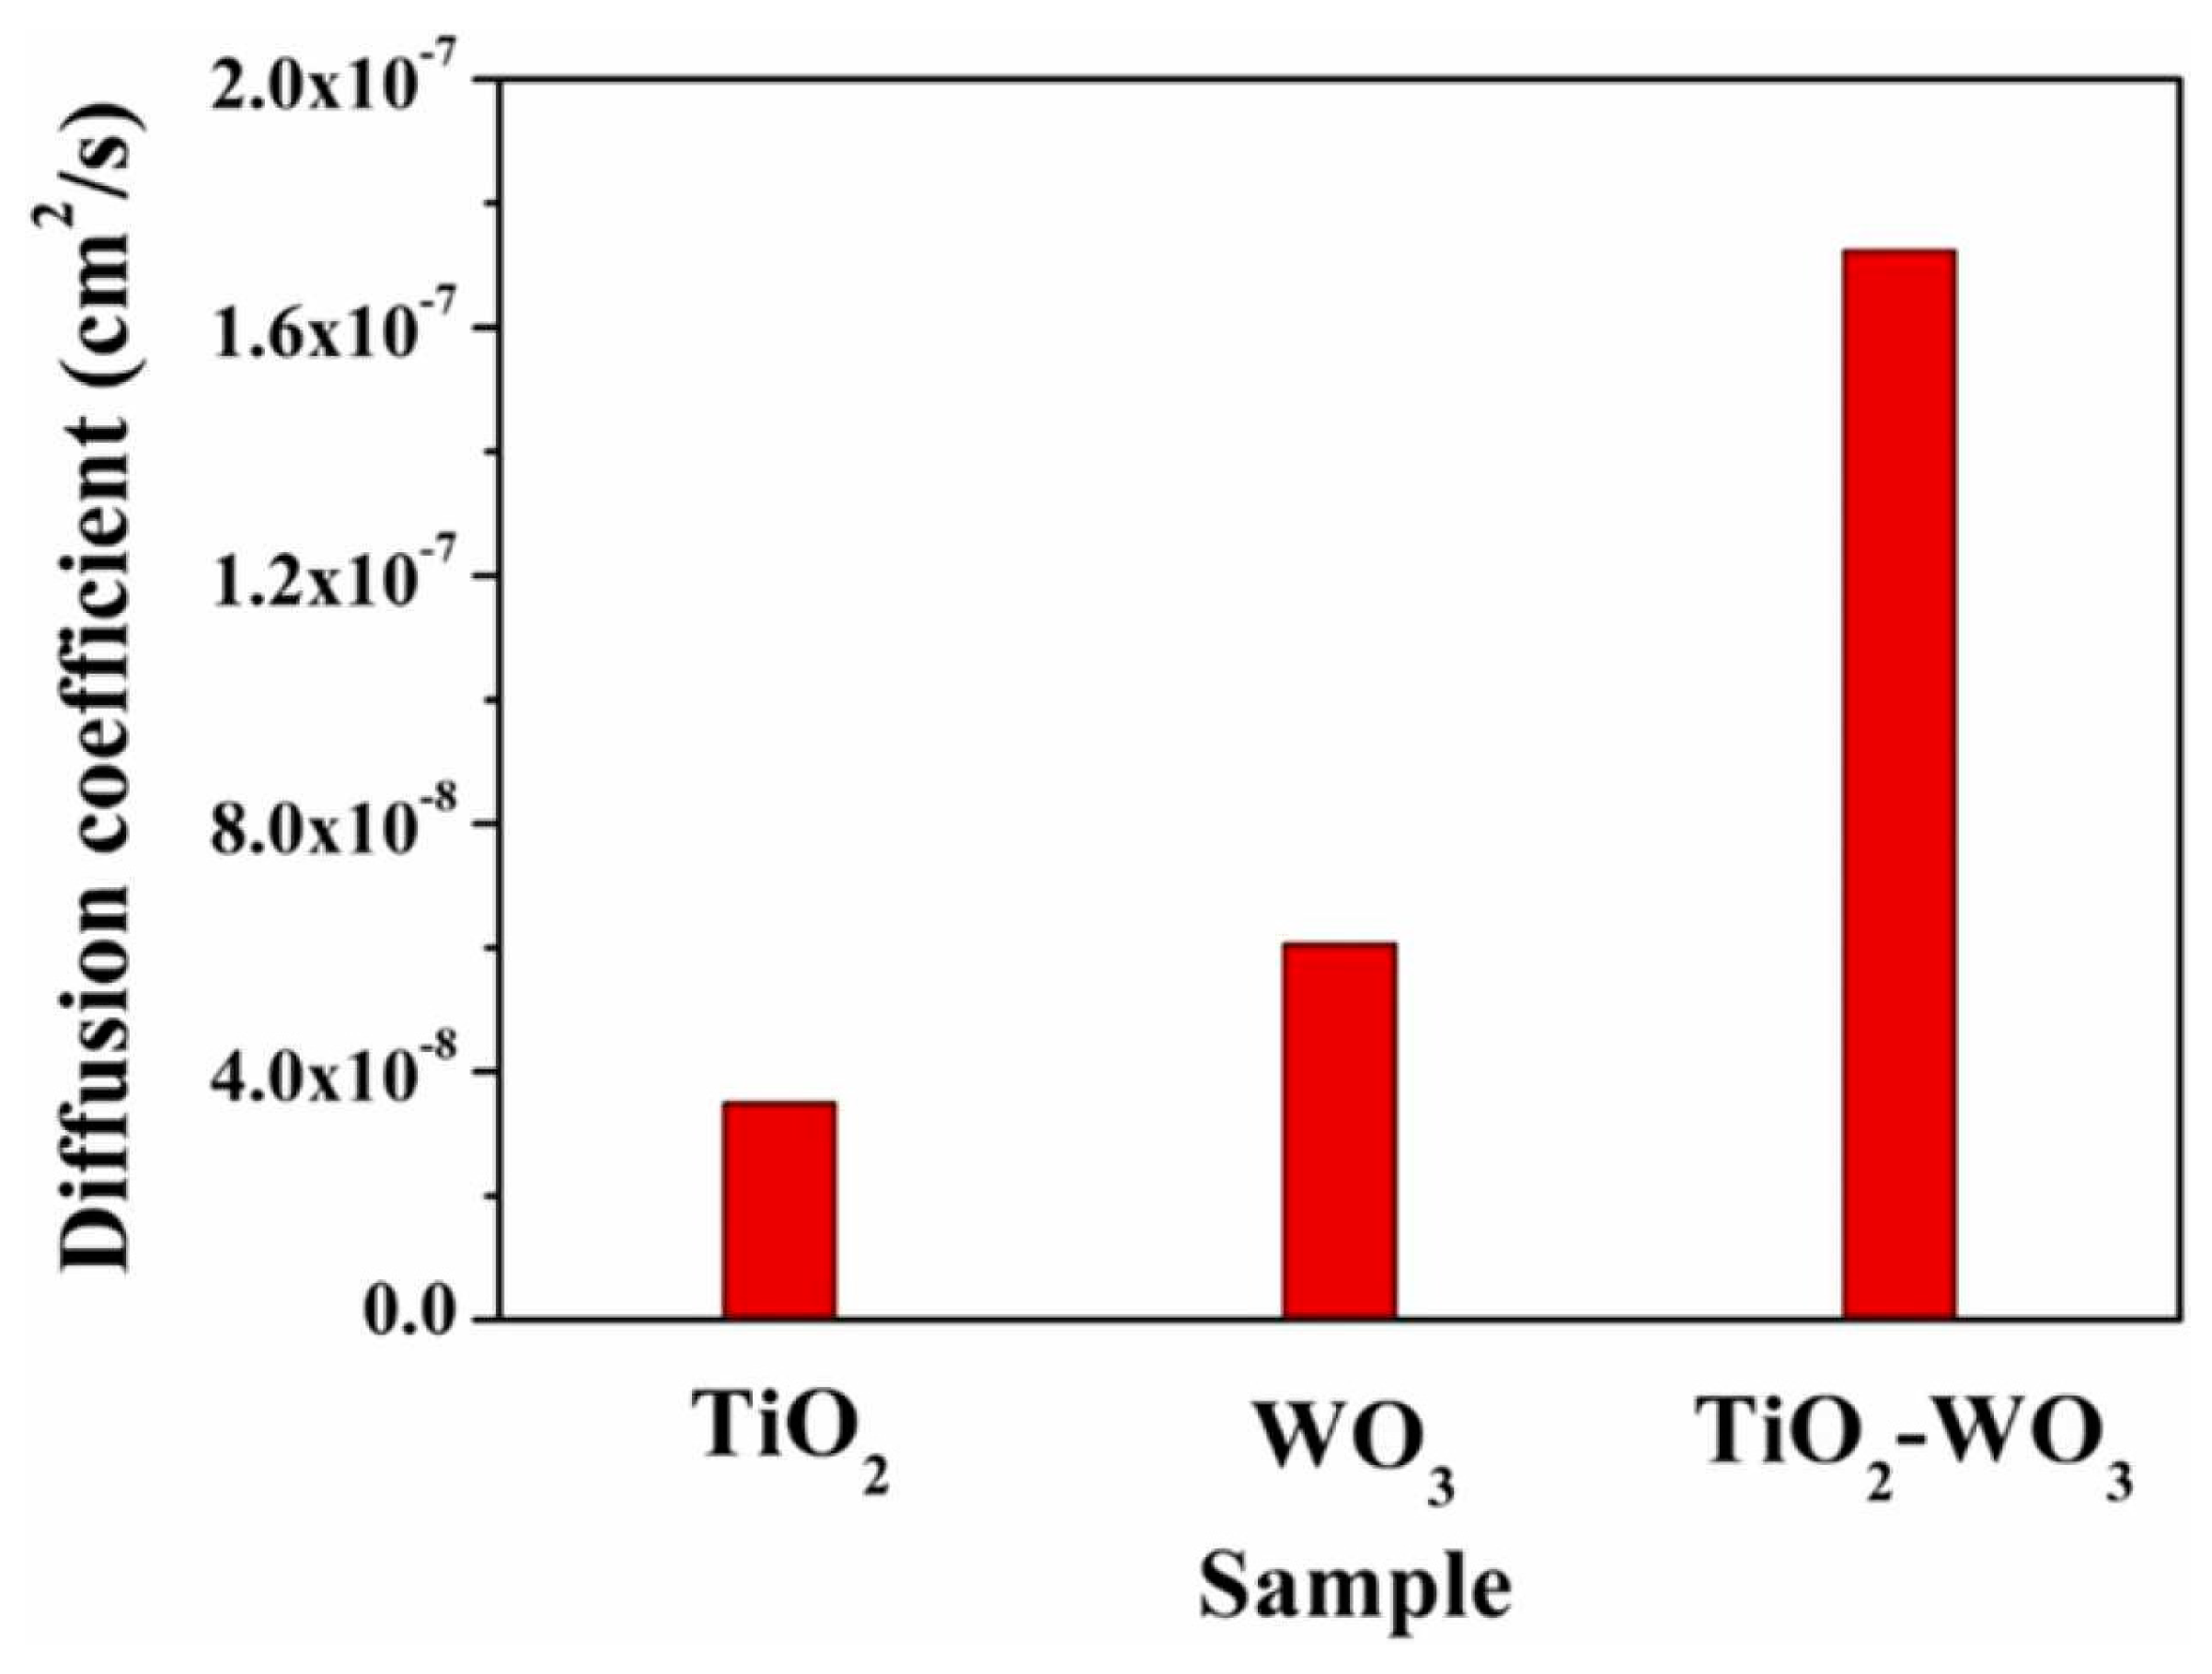
- TiO2 nanorods/hybrid WO3 films exhibited impressive electrochemical characteristics; the diffusion coefficient of 1.8 × 10⁻⁷ cm2/s surpassed those of pure (WO3 and TiO2) nanorods.
- -
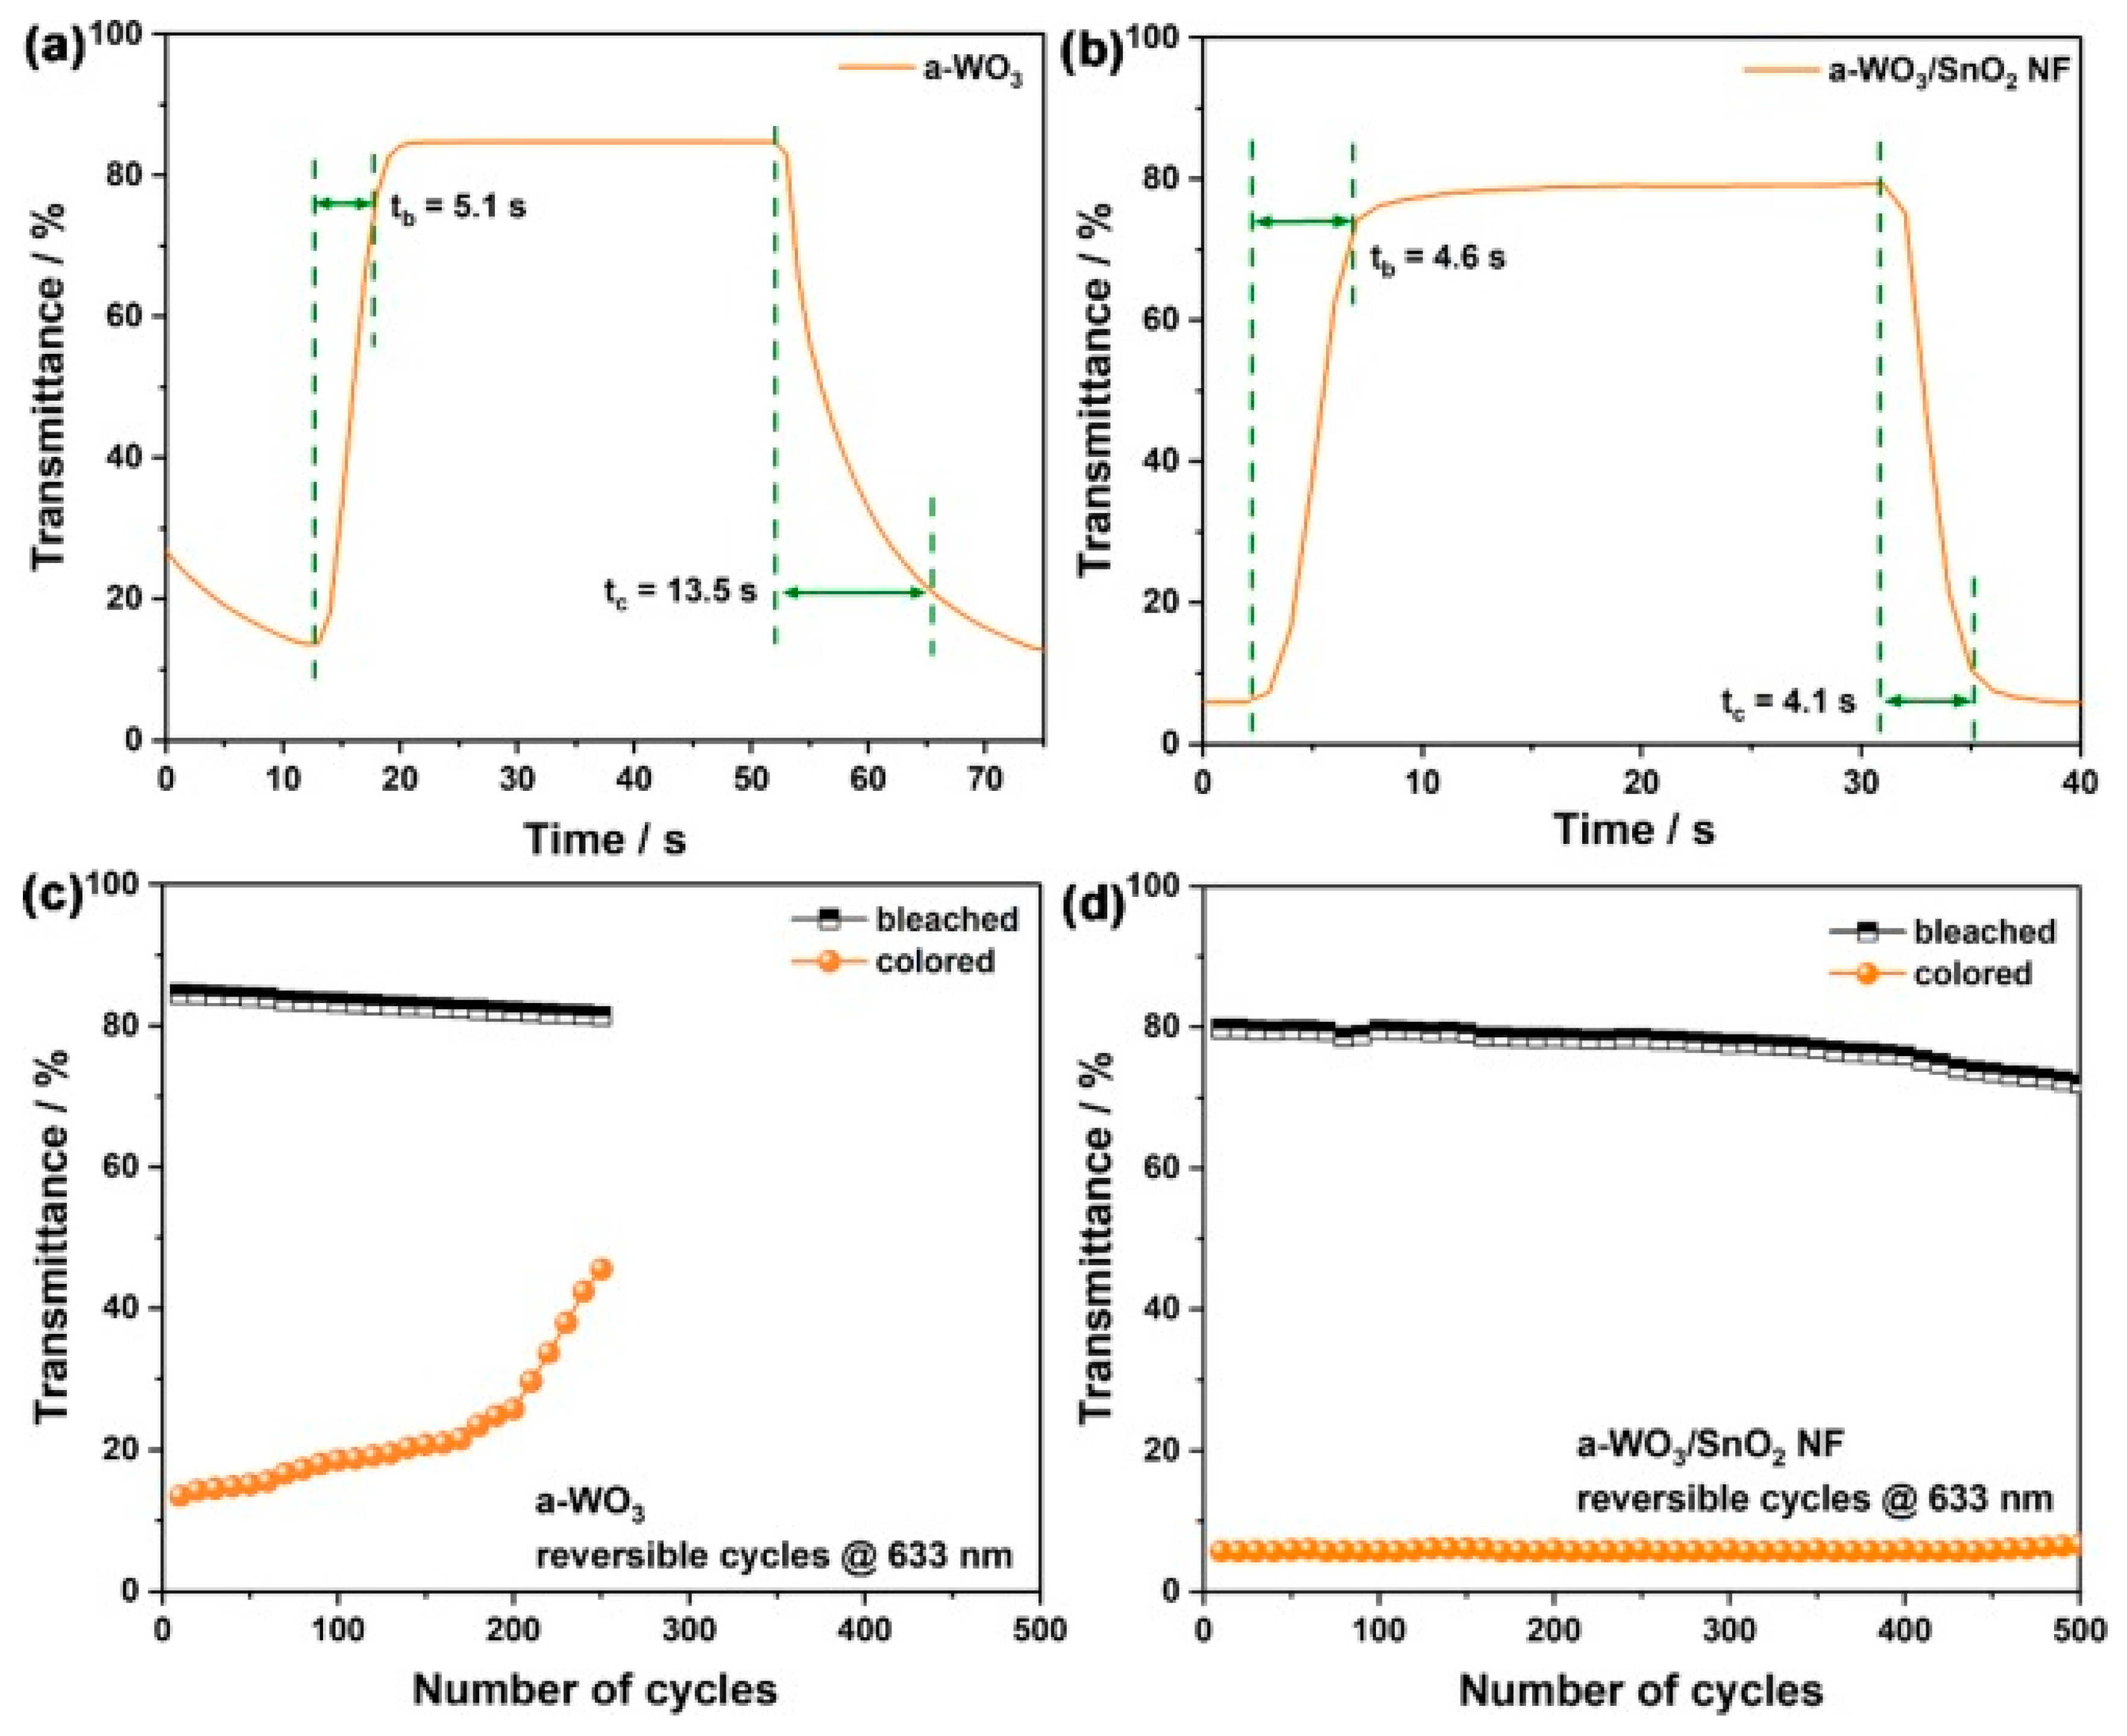
- Nd–Mo-co-doped SnO2/α-WO3 ECs revealed up to 90% visible-light transparency at λ = 600 nm in comparison with conventional SnO2/α-WO3 ECs after up to 1000 trials of volatile cycles. There was a 59% drop in electrochromic functionality with respect to the undoped device after up to 1000 reversible cycle tests. Moreover, these doped samples displayed a shorter switching time (31% of the undoped value) and high coloration efficiency (~200 cm2/C).
- -
- The EC performance of 1.2 wt% antimony-doped tin oxide nanoparticles in the WO3 EC film was better in terms of the CE value (48 cm2/C) and the switching time (2.4 s for the bleaching time and 5.4 s for the coloration time).
- -
- The addition of 40% Ni to W oxide enhanced the coloration efficiency to 80 cm2/C.
- -
- Higher surface roughness, clear optical modulation (41%), and high coloration efficiency (90 cm2/C for red) were detected in WO3–Ag thin films. In another experiment, the W0.91Ag0.09O3−δ thin layer had a faster switching time with a higher coloration efficiency of 67 cm2/C than the WO3−δ thin layer, which had an efficiency of 59 cm2/C. However, the transmittance modulation in the W0.91Ag0.09O3−δ thin film was worse than in the other films.
- -
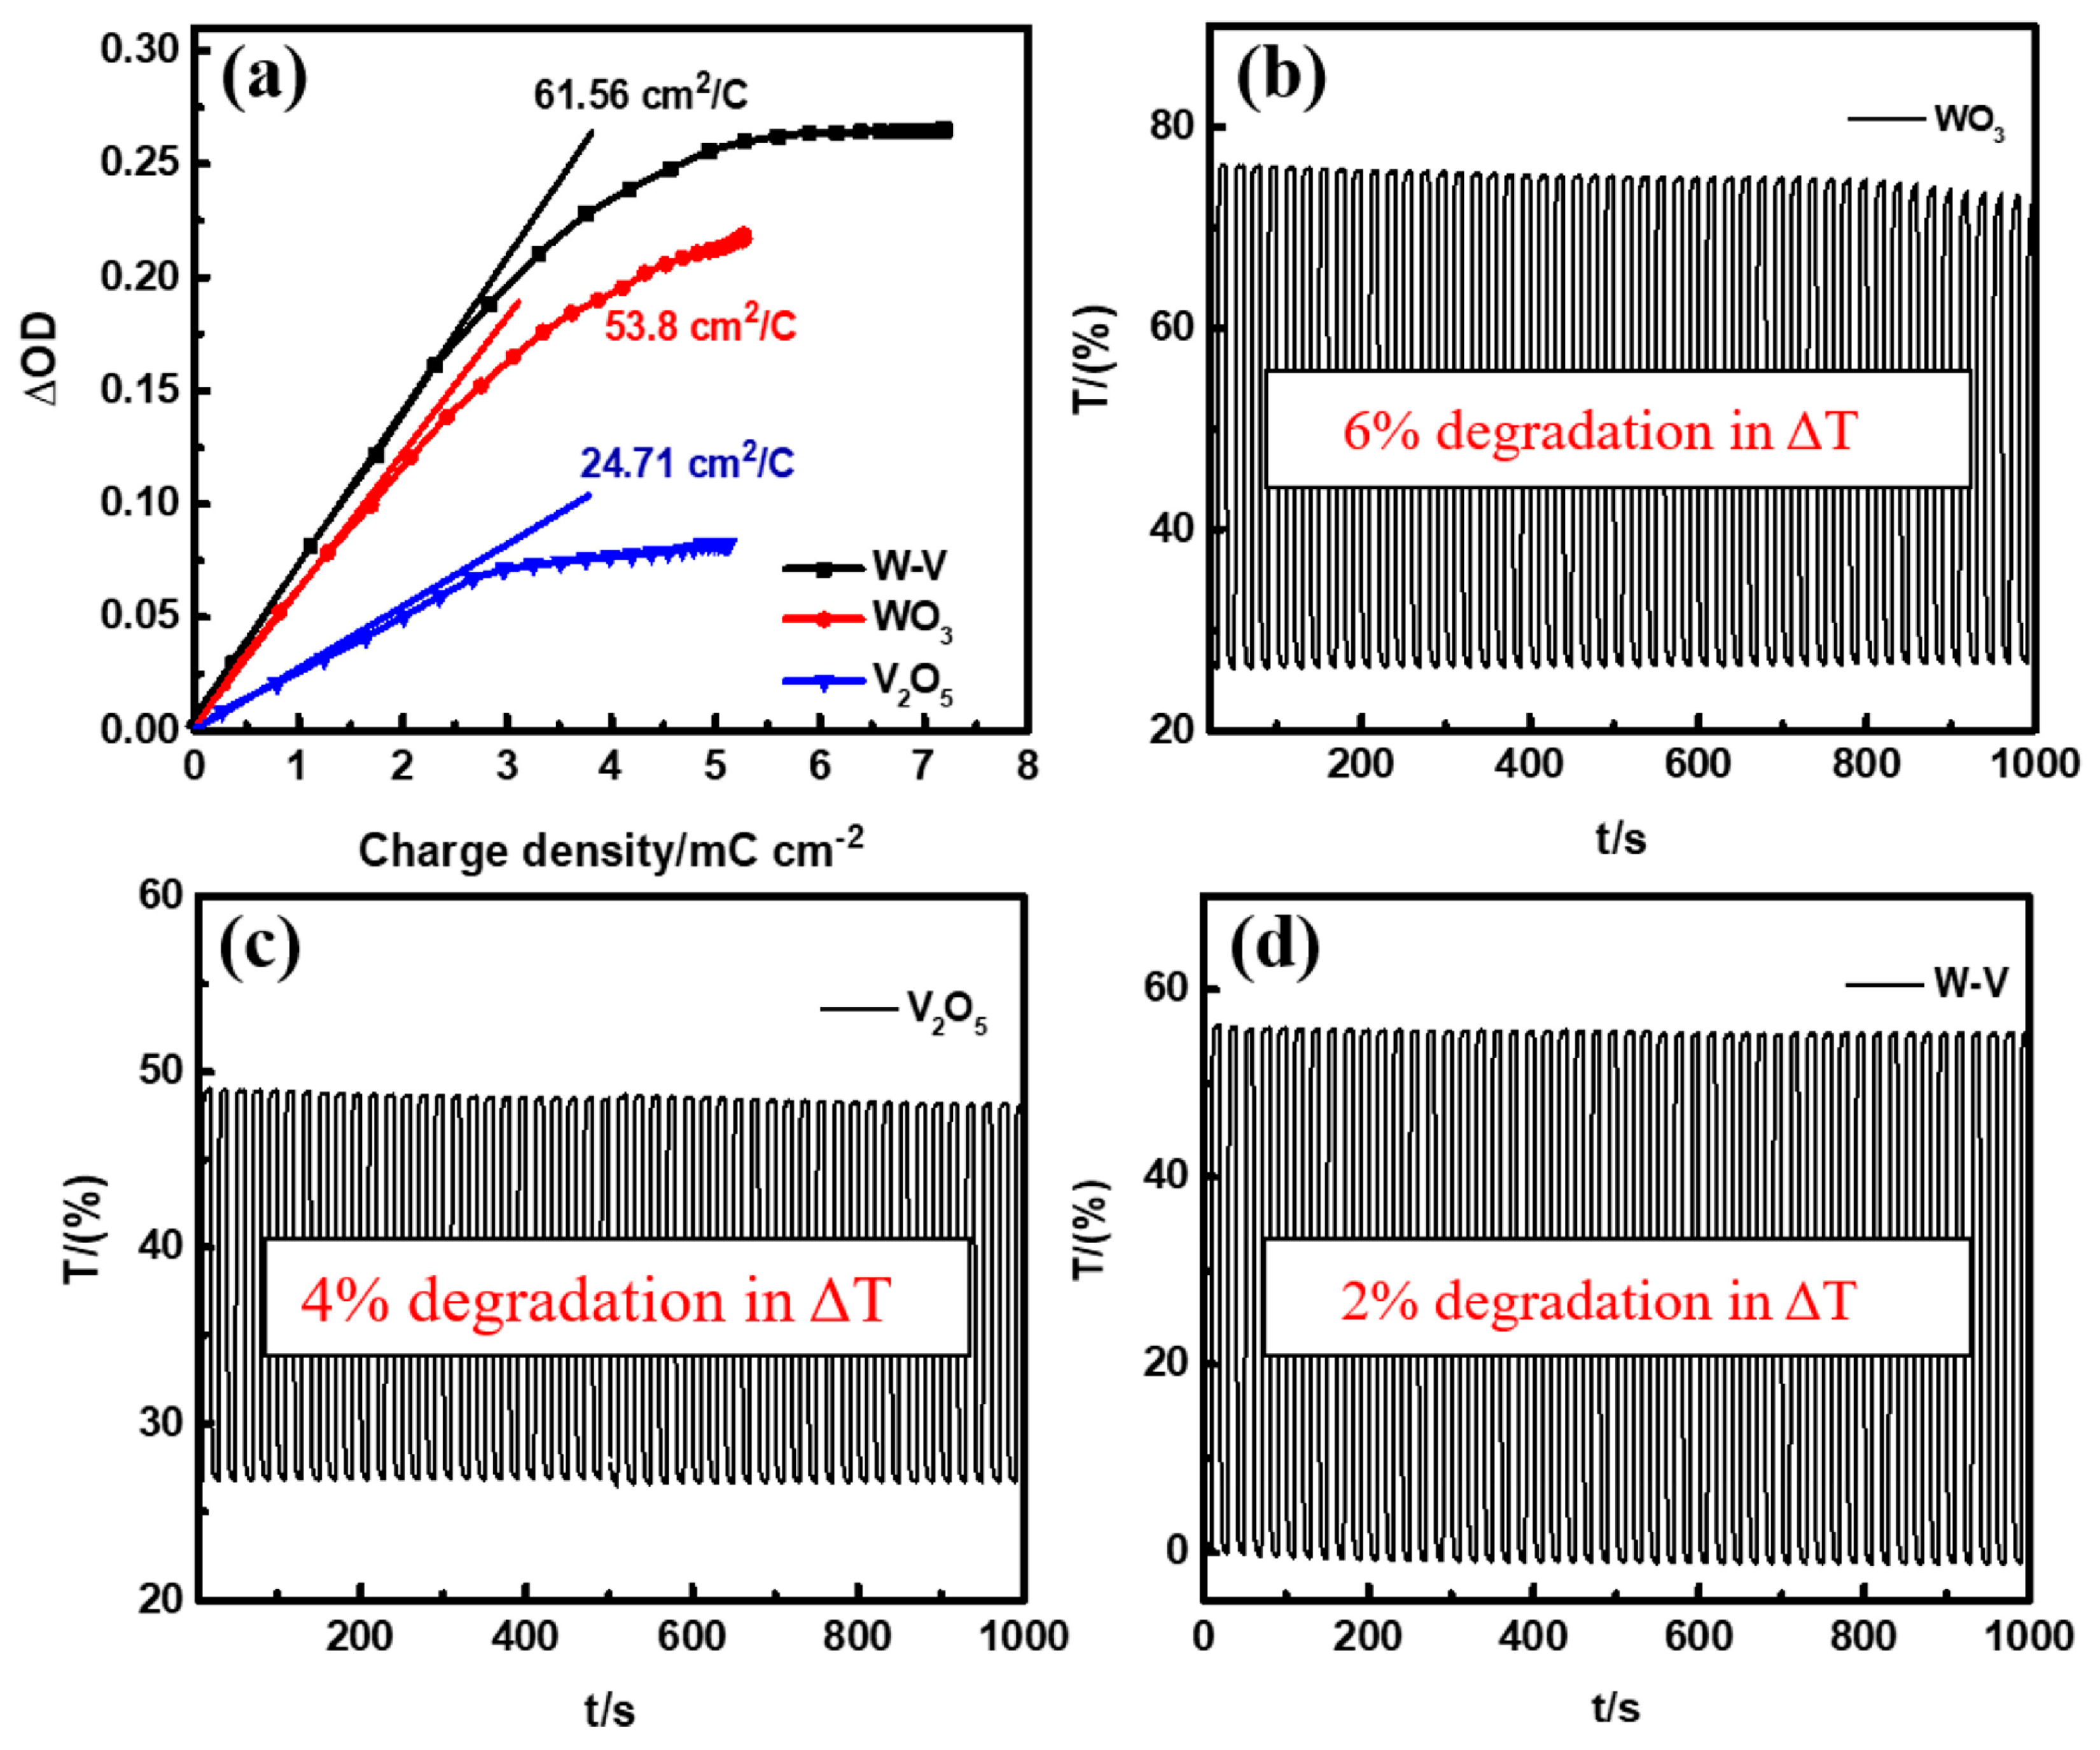
- In the V2O5(85%)–WO3(15%) film, the electrochemical durability of the samples was found to be stable for up to 1000 cycles with 49 cm2/C. In W–V films mixed at a ratio of 1:1, the electrochromic properties were measured; the findings included a fast coloration response of 4.9 s, an optimal optical contrast of 60%, and the highest coloration efficiency of 62 cm2/C. Furthermore, for an electrochemical energy storage application, a maximum unit surface capacitance of 39 mF/cm2 at an applied current of 0.5 mA/cm2 was reached, and the material displayed a capacitive retention of 78.5%, even after 5000 charge/discharge cycles.
- -
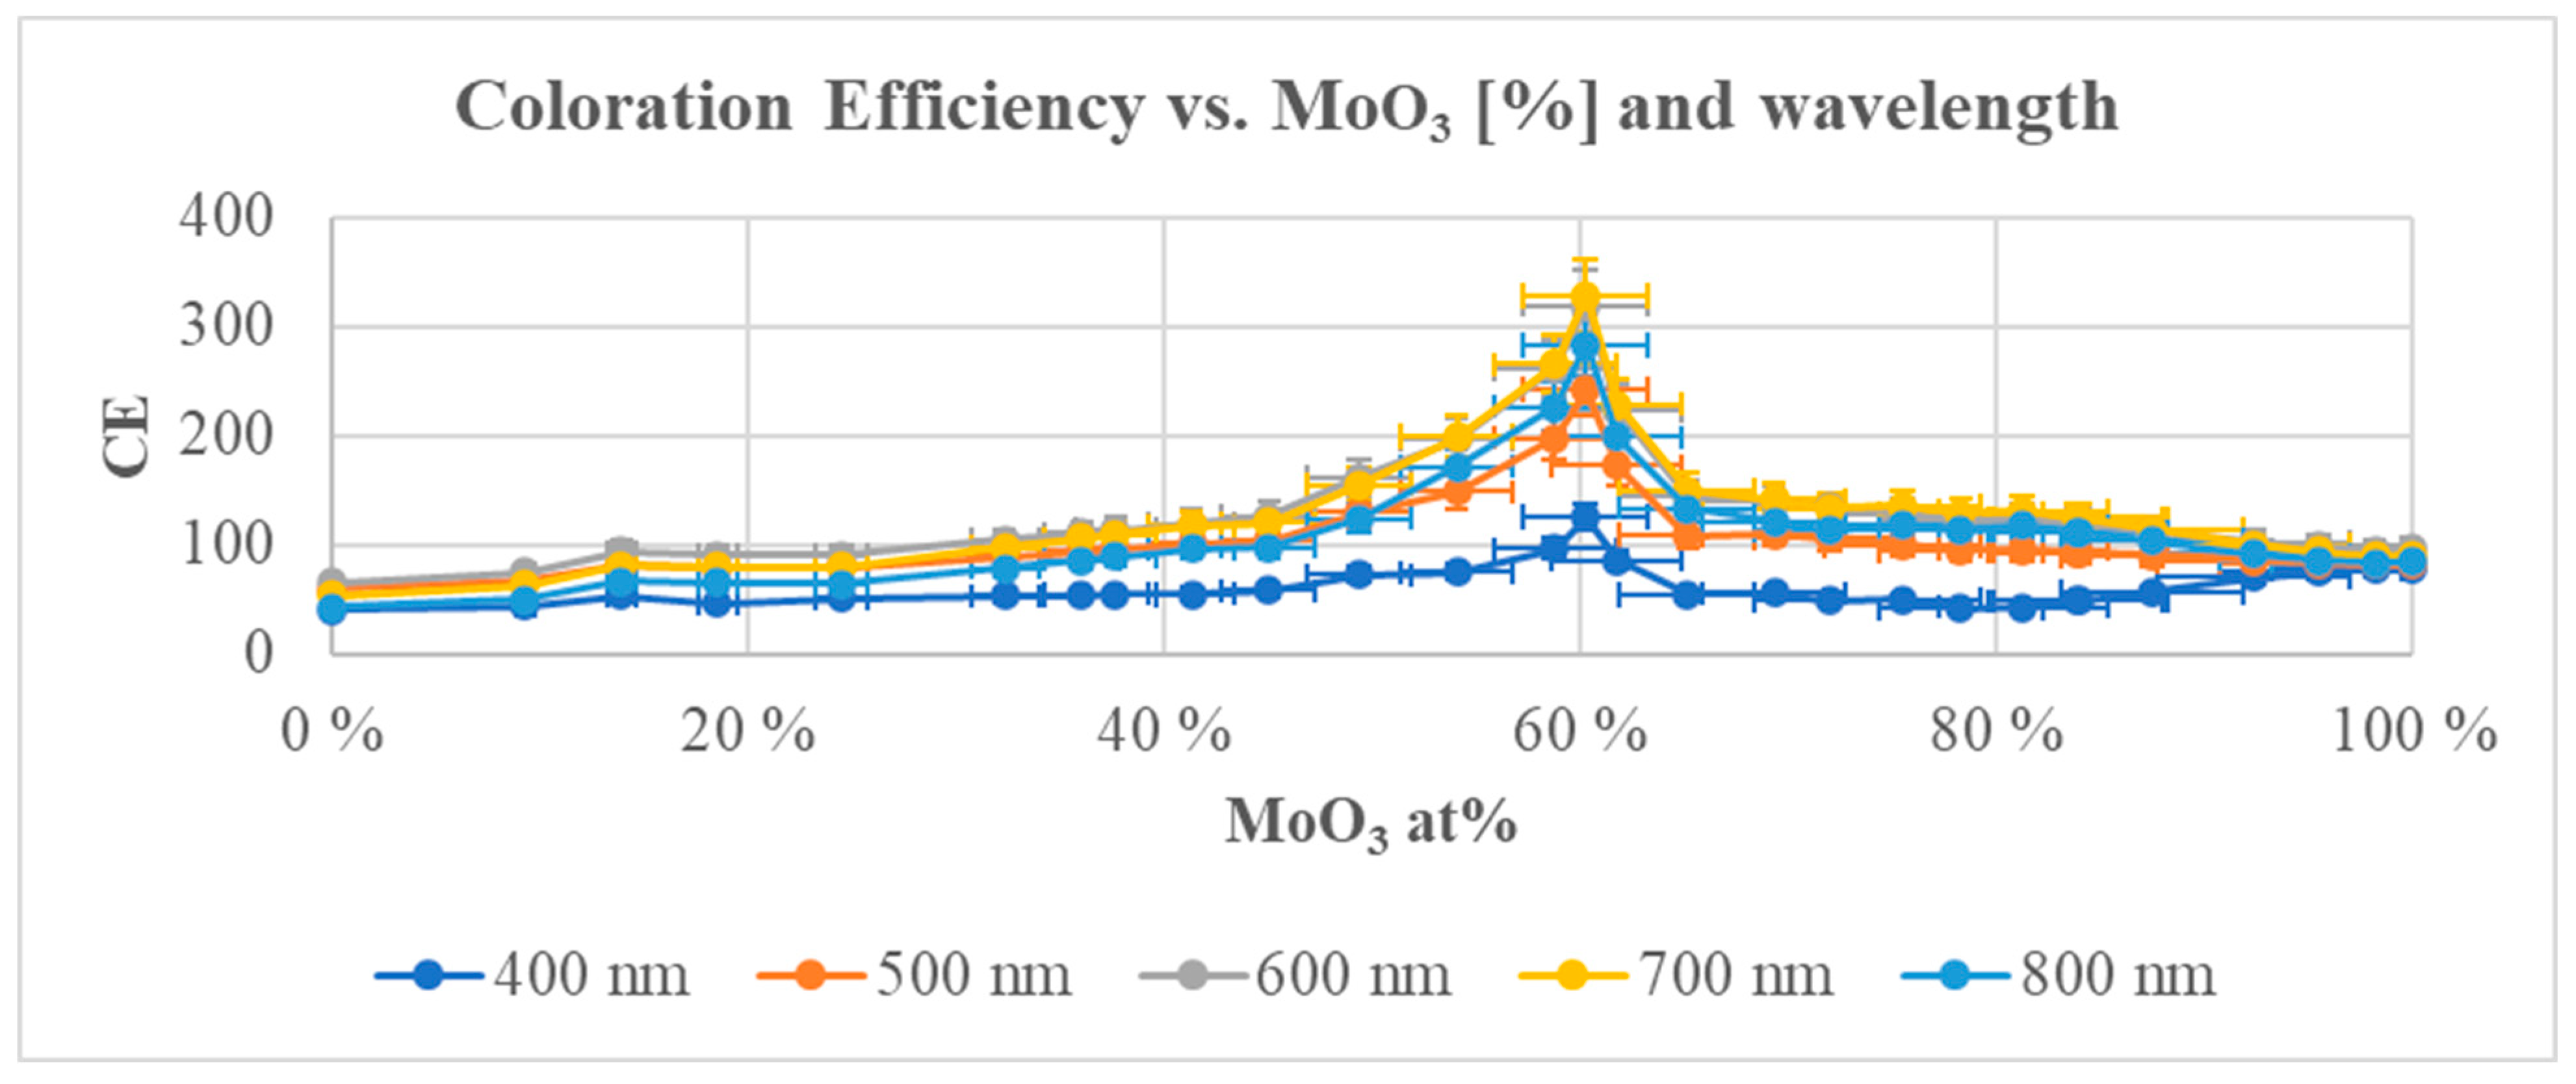
- The CE data showed a significant maximum for the magnetron-sputtered WO3(40%)–MoO3(60%) composition with values of 200–300 cm2/C in the visible range.
- -
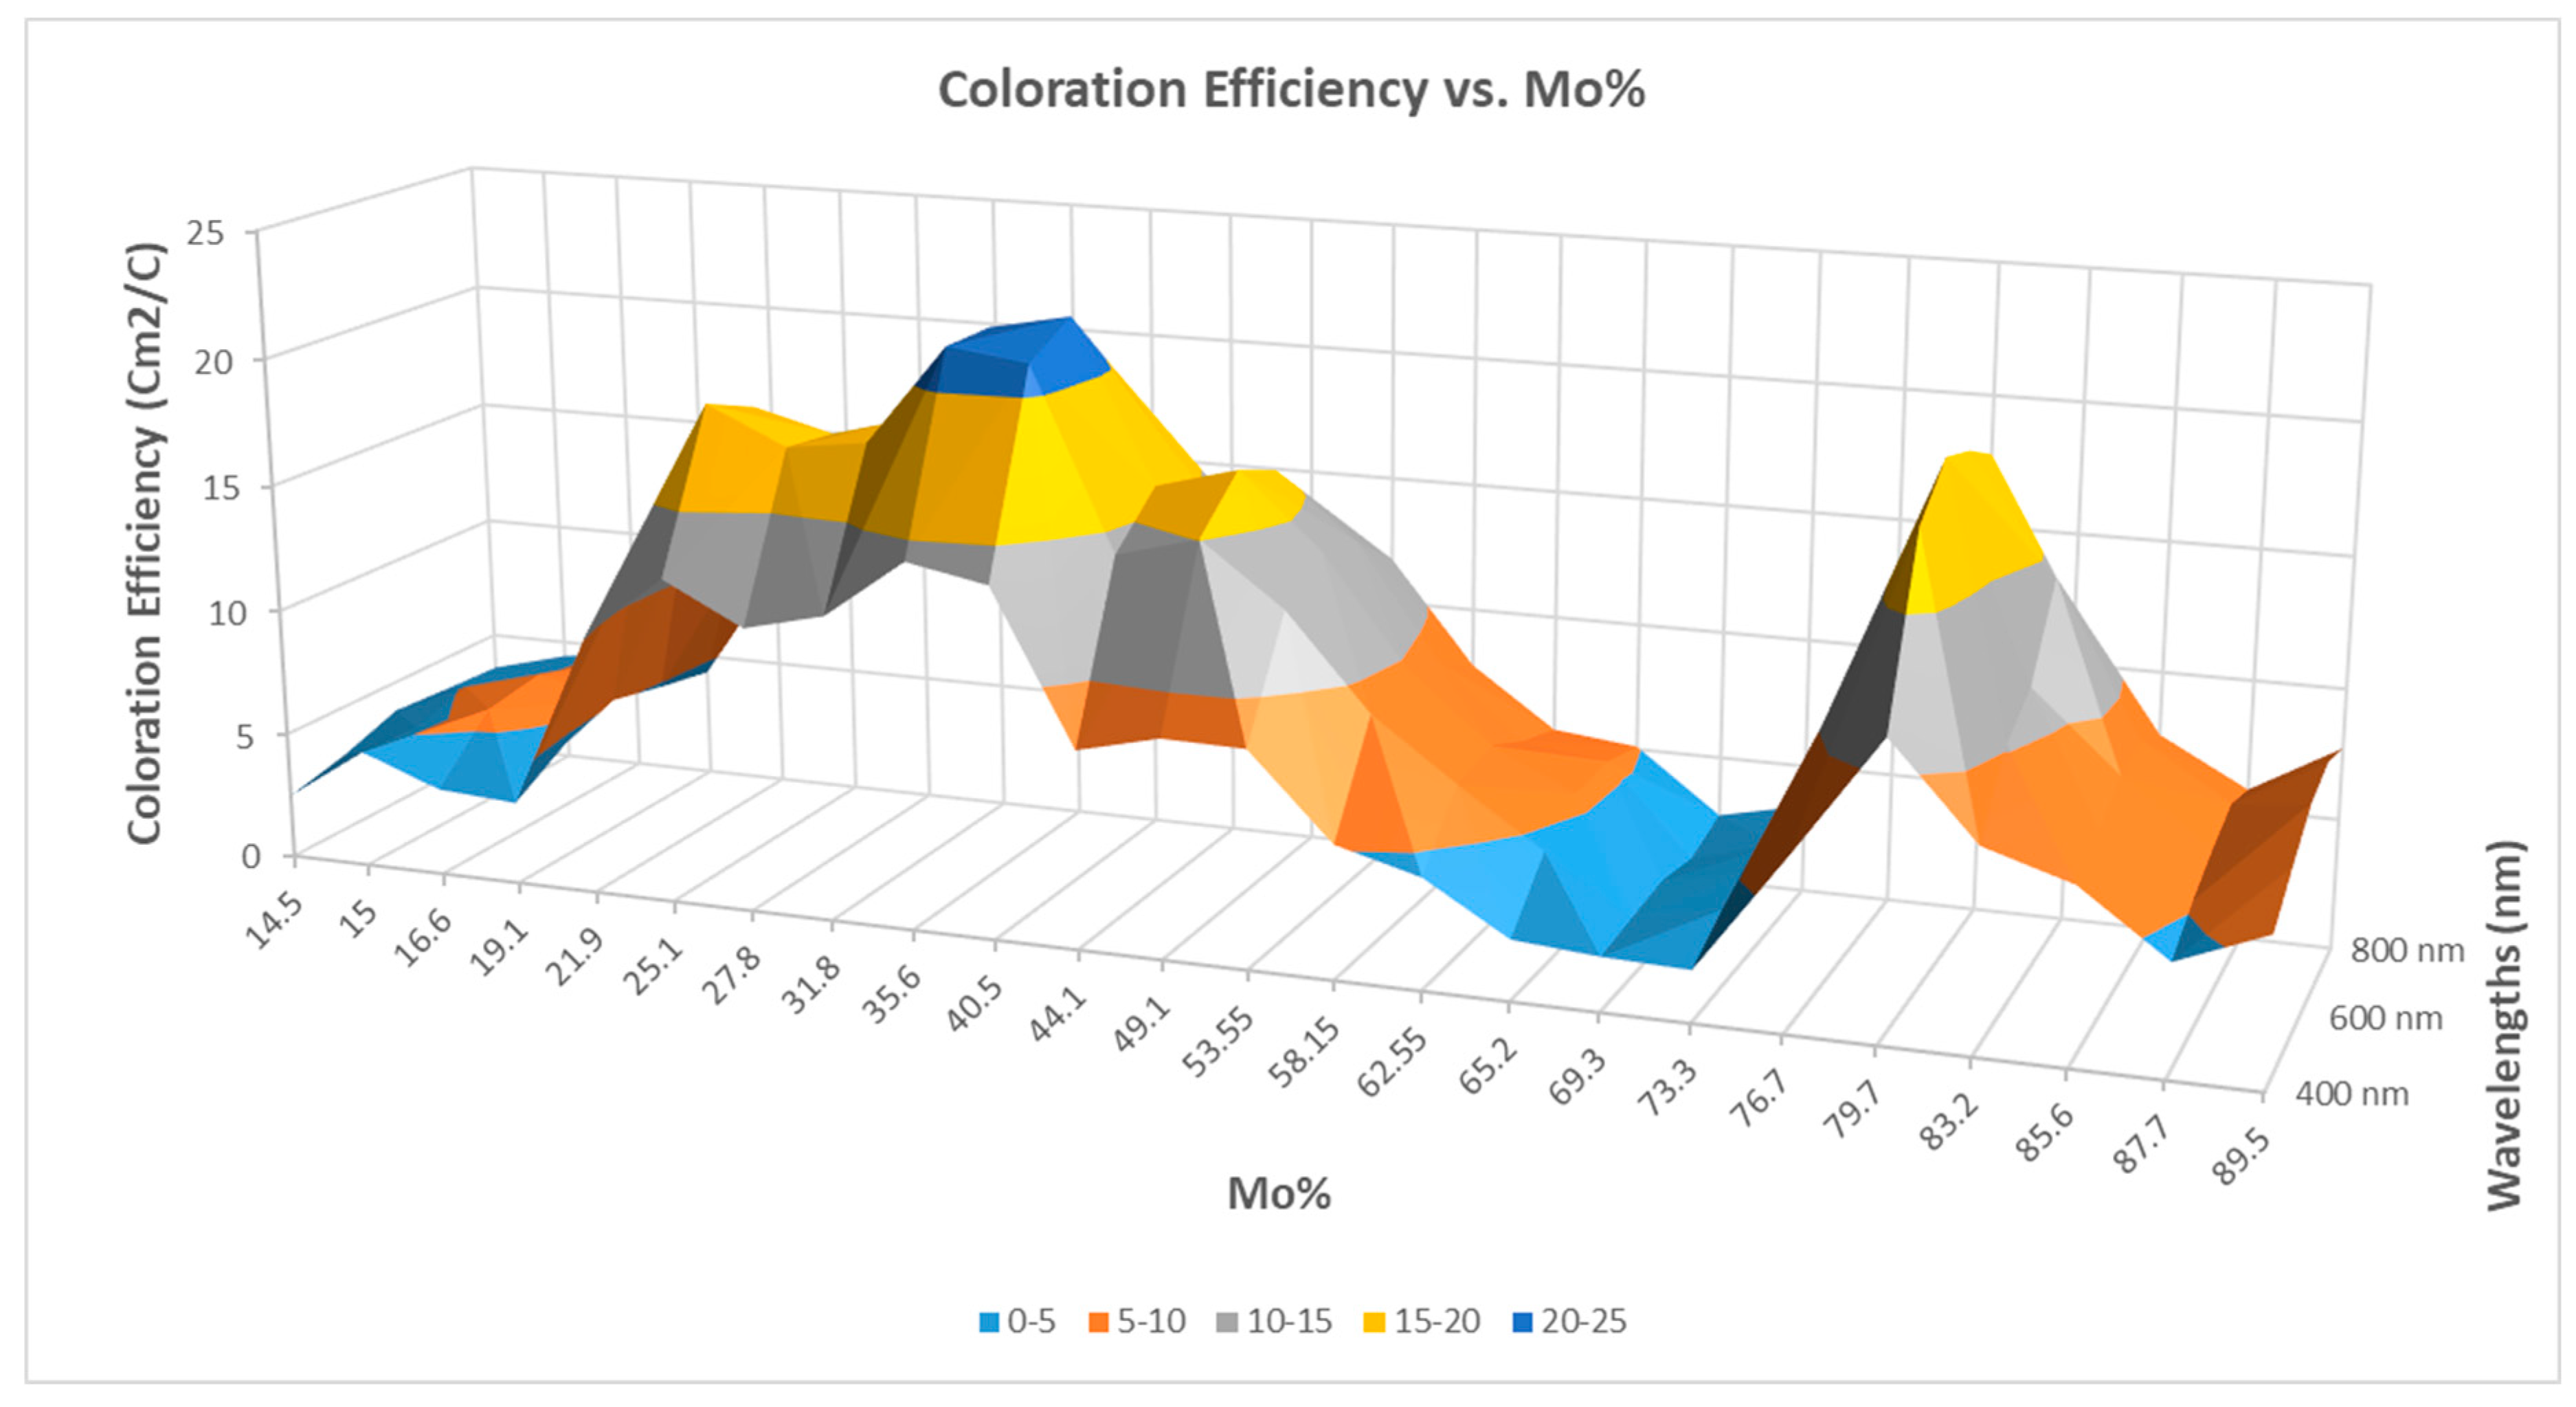
- Magnetron-sputtered SnO2(71%)–ZnO(29%) revealed CE values of 30–40 cm2/C as a maximum in the case of SnO2–ZnO mixtures.
Author Contributions
Funding
Data Availability Statement
Acknowledgments
Conflicts of Interest
References
- Granqvist, C.G. Oxide electrochromics: An introduction to devices and materials. Sol. Energy Mater. Sol. Cells 2012, 99, 1–13. [Google Scholar] [CrossRef]
- Lee, J.W.; Jung, H.J.; Park, J.Y.; Lee, J.B.; Yoon, Y. Optimization of building window system in Asian regions by analyzing solar heat gain and daylighting elements. Renew. Energy 2013, 50, 522–531. [Google Scholar] [CrossRef]
- Granqvist, C.G. Electrochromic materials: Out of a niche. Nat. Mater 2006, 5, 89–90. [Google Scholar] [CrossRef] [PubMed]
- Llordés, A.; Garcia, G.; Gazquez, J.; Milliron, D.J. Tunable near-infrared and visible-light transmittance in nanocrystal-in glass composites. Nature 2013, 500, 323–326. [Google Scholar] [CrossRef]
- Barile, C.J.; Slotcavage, D.J.; Hou, J.; Strand, M.T.; Hernandez, T.S.; McGehee, M.D. Dynamic windows with neutral color, high contrast, and excellent durability using reversible metal electrodeposition. Joule 2017, 1, 133–145. [Google Scholar] [CrossRef]
- DeForest, N.; Shehabi, A.; O’Donnell, J.; Garcia, G.; Greenblatt, J.; Lee, E.S.; Selkowitz, S.; Milliron, D.J. United States energy and CO2 savings potential from deployment of near-infrared electrochromic window glazings. Build. Environ. 2015, 89, 107–117. [Google Scholar] [CrossRef]
- Cheng, W.; He, J.; Dettelbach, K.E.; Johnson, N.J.; Sherbo, R.S.; Berlinguette, C.P. Photodeposited Amorphous Oxide Films for Electrochromic Windows. Chem 2018, 4, 821–832. [Google Scholar] [CrossRef]
- Gillaspie, D.T.; Tenent, R.C.; Dillon, A.C. Metal-oxide films for electrochromic applications: Present technology and future directions. J. Mater. Chem. 2010, 20, 9585–9592. [Google Scholar] [CrossRef]
- Runnerstrom, E.L.; Llordés, A.; Lounis, S.D.; Milliron, D.J. Nanostructured electrochromic smart windows: Traditional materials and NIR-selective plasmonic nanocrystals. Chem. Commun. 2014, 50, 10555–10572. [Google Scholar] [CrossRef]
- Granqvist, C.G. Electrochromics for smart windows: Oxide-based thin films and devices. Thin Solid Film. 2014, 564, 1–38. [Google Scholar] [CrossRef]
- Cannavale, A.; Cossari, P.; Eperon, G.E.; Colella, S.; Fiorito, F.; Gigli, G.; Snaith, H.J.; Listorti, A. Forthcoming perspectives of photoelectrochromic devices: A critical review. Energy Environ. Sci. 2016, 9, 2682–2719. [Google Scholar] [CrossRef]
- Granqvist, C.G. Handbook of Inorganic Electrochromic Materials; Elsevier: Amsterdam, The Netherlands, 1995; ISBN 9780080532905. [Google Scholar]
- González-Borrero, P.P.; Sato, F.; Medina, A.N.; Baesso, M.L.; Bento, A.C.; Baldissera, G.; Persson, C.; Niklasson, G.A.; Granqvist, C.G.; da Silva, A.F. Optical band-gap determination of nanostructured WO3 film. Appl. Phys. Lett. 2010, 96, 061909. [Google Scholar] [CrossRef]
- Novinrooz, A.; Sharbatdaran, M.; Noorkojouri, H. Structural and optical properties of WO3 electrochromic layers prepared by the sol-gel method. Centr. Eur. J. Phys. 2005, 3, 456–466. [Google Scholar] [CrossRef]
- Hsu, C.S.; Chan, C.C.; Huang, H.T.; Peng, C.H.; Hsu, W.C. Electrochromic properties of nanocrystalline MoO3 thin films. Thin Solid Films. 2008, 516, 4839–4844. [Google Scholar] [CrossRef]
- Chaichana, S.; Sikong, L.; Kooptarnond, K.; Chetpattananondh, K. The electrochromic property of MoO3/WO3 nanocomposite films. IOP Conf. Ser. Mater. Sci. Eng. 2018, 378, 012002. [Google Scholar] [CrossRef]
- Colton, R.J.; Guzman, A.M.; Rabalais, J.W. Photochromism and electrochromism in amorphous transition metal oxide films. Acc. Chem. Res. 1978, 11, 170–176. [Google Scholar] [CrossRef]
- Wen, R.T.; Granqvist, C.G.; Niklasson, G.A. Eliminating degradation and uncovering ion-trapping dynamics in electrochromic WO3 thin films. Nat. Mater. 2015, 14, 996–1001. [Google Scholar] [CrossRef]
- Llordes, A.; Wang, Y.; Fernandez-Martinez, A.; Xiao, P.; Lee, T.; Poulain, A.; Zandi, O.; Cabezas, C.A.S.; Henkelman, G.; Milliron, D.J. Linear topology in amorphous metal oxide electrochromic networks obtained via low-temperature solution processing. Nat. Mater. 2016, 15, 1267–1273. [Google Scholar] [CrossRef]
- Liao, C.C.; Chen, F.R.; Kai, J.J. Annealing effect on electrochromic properties of tungsten oxide nanowires. Sol. Energy Mater. Sol. Cells 2007, 91, 1258. [Google Scholar] [CrossRef]
- Barbosa, P.; Rodrigues, L.; Silva, M.M.; Smith, M.; Pawlicka, A. Optical Devices Performance with Poly (trim ethylene carbonate) based Electrolytes. Thin Solid Film. 2009, 516, 1486. [Google Scholar] [CrossRef]
- Beydaghyan, G.; Renaud, J.-L.M.; Bader, G.; Ashrit, P. Enhanced electrochromic properties of heat-treated nanostructured tungsten trioxide thin films. J. Mater. Res. 2008, 23, 274–280. [Google Scholar] [CrossRef]
- Joraid, A.A. Comparison of electrochromic amorphous and crystalline electron beam deposited WO3 thin films. Curr. Appl. Phys. 2009, 9, 73–79. [Google Scholar] [CrossRef]
- Krishna, K.H.; Hussain, O.M.; Julien, C.M. Electrochromic properties of nanocrystalline WO3 thin films grown on flexible substrates by plasma-assisted evaporation technique. Appl. Phys. A 2010, 99, 921–929. [Google Scholar] [CrossRef]
- Sauvet, K.; Sauques, L.; Rougier, A. IR electrochromic WO3 thin films: From optimization to devices. Sol. Energy Mater. Sol. Cells 2009, 93, 2045–2049. [Google Scholar] [CrossRef]
- Sato, R.; Kawamura, N.; Tokumaru, H. Relaxation mechanism of electrochromism of tungsten-oxide film for ultra-multilayer optical recording depending on sputtering conditions. Jpn. J. Appl. Phys. 2007, 46, 3958. [Google Scholar] [CrossRef]
- Sauvet, K.; Rougier, A.; Sauques, L. Electrochromic WO3 thin films active in the IR region. Sol. Energy Mater. Sol. Cells 2008, 92, 209–215. [Google Scholar] [CrossRef]
- Rougier, A.; Sauvet, K.; Sauques, L. Electrochromic materials from the visible to the infrared region: An example WO3. Ionics 2008, 14, 99–105. [Google Scholar] [CrossRef]
- Deshpande, R.; Lee, S.-H.; Mahan, A.; Parilla, P.; Jones, K.; Norman, A.; To, B.; Blackburn, J.; Mitra, S.; Dillon, A. Optimization of crystalline tungsten oxide nanoparticles for improved electrochromic applications. Solid State Ion. 2007, 178, 895–900. [Google Scholar] [CrossRef]
- Gubbala, S.; Thangala, J.; Sunkara, M. Nanowire-based electrochromic devices. Sol. Energy Mater. Sol. Cells 2007, 91, 813–820. [Google Scholar] [CrossRef]
- White, C.M.; Gillaspie, D.T.; Whitney, E.; Lee, S.-H.; Dillon, A.C. Flexible electrochromic devices based on crystalline WO3 nanostructures produced with hot-wire chemical vapor deposition. Thin Solid Film. 2009, 517, 3596–3599. [Google Scholar] [CrossRef]
- Bathe, S.R.; Patil, P. Electrochromic characteristics of fibrous reticulated WO3 thin films prepared by pulsed spray pyrolysis technique. Sol. Energy Mater. Sol. Cells 2007, 91, 1097–1101. [Google Scholar] [CrossRef]
- Bathe, S.R.; Patil, P. Titanium doping effects in electrochromic pulsed spray pyrolysed WO3 thin films. Solid State Ion. 2008, 179, 314–323. [Google Scholar] [CrossRef]
- Kadam, P.M.; Tarwal, N.L.; Shinde, P.S.; Patil, R.S.; Deshmukh, H.P.; Patil, P.S. From beads-to-wires-to-fibers of tungsten oxide: Electrochromic response. Appl. Phys. A 2009, 97, 323–330. [Google Scholar] [CrossRef]
- Kim, C.Y.; Choa, S.G. Tungsten oxide film synthesis by spray pyrolysis of peroxotungstic acid and its electrochromic characterization. J. Ceram. Proc. Res. 2009, 10, 851. [Google Scholar]
- Bertus, L.M.; Enesca, A.; Duta, A. Duta. Influence of spray pyrolysis deposition parameters on the optoelectronic properties of WO3 thin films. Thin Solid Film. 2012, 520, 4282–4290. [Google Scholar] [CrossRef]
- Vuk, A.Š.; Jovanovski, V.; Pollet-Villard, A.; Jerman, I.; Orel, B. Imidazolium-based ionic liquid derivatives for application in electrochromic devices. Sol. Energy Mater. Sol. Cells 2008, 92, 126–135. [Google Scholar] [CrossRef]
- Balaji, S.; Djaoued, Y.; Albert, A.-S.; Ferguson, R.Z.; Brüning, R. Hexagonal Tungsten Oxide Based Electrochromic Devices: Spectroscopic Evidence for the Li Ion Occupancy of Four-Coordinated Square Windows. Chem. Mater. 2009, 21, 1381. [Google Scholar] [CrossRef]
- Balaji, S.; Djaoued, Y.; Albert, A.-S.; Ferguson, R.Z.; Brüning, R.; Su, B.-L. Construction and characterization of tunable meso-/macroporous tungsten oxide-based transmissive electrochromic devices. J. Mater. Sci. 2009, 44, 6608–6616. [Google Scholar] [CrossRef]
- Kondrachova, L.V.; May, R.A.; Cone, C.W.; Bout, D.A.V.; Stevenson, K.J. Evaluation of Lithium-Ion Insertion Reactivity via Electrochromic Diffraction-Based Imaging. Langmuir 2009, 25, 2508–2518. [Google Scholar] [CrossRef]
- Kang, J.-H.; Paek, S.-M.; Hwang, S.-J.; Choy, J.-H. Optical iris application of electrochromic thin films. Electrochem. Commun. 2008, 10, 1785–1787. [Google Scholar] [CrossRef]
- Nah, Y.-C.; Ghicov, A.; Kim, D.; Schmuki, P. Enhanced electrochromic properties of self-organized nanoporous WO3. Electrochem. Commun. 2008, 10, 1777. [Google Scholar] [CrossRef]
- Zhang, J.; Wang, X.L.; Xia, X.H.; Gu, C.D.; Zhao, Z.J.; Tu, J.P. Enhanced electrochromic performance of macroporous WO3 films formed by anodic oxidation of DC-sputtered tungsten layers. Electrochim. Acta 2010, 55, 6953–6958. [Google Scholar] [CrossRef]
- Ou, J.Z.; Balendhran, S.; Field, M.R.; McCulloch, D.G.; Zoolfakar, A.S.; Rani, R.A.; Zhuiykov, S.; O’Mullane, A.P.; Kalantar-Zadeh, K. The anodized crystalline WO3 nanoporous network with enhanced electrochromic properties. Nanoscale 2012, 4, 5980–5988. [Google Scholar] [CrossRef] [PubMed]
- Khoo, E.; Lee, P.S.; Ma, J. Electrophoretic deposition (EPD) of WO3 nanorods for electrochromic application. J. Eur. Ceram. Soc. 2010, 30, 1139–1144. [Google Scholar] [CrossRef]
- Sivakumar, R.; Gopinath, C.S.; Jayachandran, M.; Sanjeeviraja, C. An electrochromic device (ECD) cell characterization on electron beam evaporated MoO3 films by intercalating/deintercalating the H+ ions. Curr. Appl. Phys. 2007, 7, 76–86. [Google Scholar] [CrossRef]
- Patil, R.S.; Uplane, M.D.; Patil, P.S. Electrosynthesis of Electrochromic Molybdenum Oxide Thin Films with Rod-Like Features. Int. J. Electrochem. Soc. 2008, 3, 259–265. [Google Scholar] [CrossRef]
- Gesheva, K.A.; Cziraki, A.; Ivanova, T.; Szekeres, A. Crystallization of chemically vapor deposited molybdenum and mixed tungsten/molybdenum oxide films for electrochromic application. Thin Solid Film. 2007, 515, 4609–4613. [Google Scholar] [CrossRef]
- Dhanasankar, M.; Purushothaman, K.K.; Muralidharan, G. Effect of tungsten on the electrochromic behavior of sol–gel dip coated molybdenum oxide thin films. Mater. Res. Bull. 2010, 45, 542–545. [Google Scholar] [CrossRef]
- Laurinavichute, V.K.; Vassiliev, S.Y.; Plyasova, L.M.; Molina, I.Y.; Khokhlov, A.A.; Pugolovkin, L.V.; Borzenko, M.I.; Tsirlina, G.A. Cathodic electrocrystallization and electrochromic properties of doped rechargeable oxotungstates. Electrochim. Acta 2009, 54, 5439–5448. [Google Scholar] [CrossRef]
- Sorar, I.; Pehlivan, E.; Niklasson, G.A.; Granqvist, C.G. Electrochromism of DC magnetron sputtered TiO2 thin films: Role of deposition parameters. Sol. Energy Mater. Sol. Cells 2013, 115, 172–180. [Google Scholar] [CrossRef]
- Khalifa, Z.; Lin, H.; Shah, S.I. Structural and electrochromic properties of TiO2 thin films prepared by metallorganic chemical vapor deposition. Thin Solid Film. 2010, 518, 5457–5462. [Google Scholar] [CrossRef]
- Shinde, P.S.; Deshmukh, H.P.; Mujawar, S.H.; Inamdar, A.I.; Patil, P.S. Spray deposited titanium oxide thin films as passive counter electrodes. Electrochim. Acta 2007, 52, 3114–3120. [Google Scholar] [CrossRef]
- Zelazowska, E.; Rysiakiewicz-Pasek, E. Thin TiO2 films for an electrochromic system. Opt. Mater. 2009, 31, 1802. [Google Scholar] [CrossRef]
- Lin, S.Y.; Chen, Y.C.; Wang, C.M.; Liu, C.C. Effect of heat treatment on electrochromic properties of TiO2 thin films. Solid State Electrochem. 2008, 12, 1481. [Google Scholar] [CrossRef]
- Wang, C.-M.; Lin, S.-Y.; Chen, Y.-C. Electrochromic properties of TiO2 thin films prepared by chemical solution deposition method. J. Phys. Chem. Solids 2008, 69, 451–455. [Google Scholar] [CrossRef]
- Ivanova, T.; Harizanova, A.; Koutzarova, T.; Krins, N.; Vertruyen, B. Electrochromic TiO2, ZrO2 and TiO2–ZrO2 thin films by dip-coating method. Mater. Sci. Eng. B 2009, 165, 212–216. [Google Scholar] [CrossRef]
- Hahn, R.; Ghicov, A.; Tsuchiya, H.; Macak, J.M.; Muñoz, A.G.; Schmuki, P. Lithium-ion insertion in anodic TiO2 nanotubes resulting in high electrochromic contrast. Phys. Stat. Sol. A 2007, 204, 1281–1285. [Google Scholar] [CrossRef]
- Paramasivam, I.; Macak, J.M.; Ghicov, A.; Schmuki, P. Enhanced photochromism of Ag loaded self-organized TiO2 nanotube layers. Chem. Phys. Lett. 2007, 445, 233. [Google Scholar] [CrossRef]
- Berger, S.; Ghicov, A.; Nah, Y.-C.; Schmuki, P. Transparent TiO2 Nanotube Electrodes via Thin Layer Anodization: Fabrication and Use in Electrochromic Devices. Langmuir 2009, 25, 4841–4844. [Google Scholar] [CrossRef]
- Bueno, P.R.; Gabrielli, C.; Perrot, H. Coloring ionic trapping states in WO3 and Nb2O5 electrochromic materials. Electrochim. Acta 2008, 53, 5533–5539. [Google Scholar] [CrossRef]
- Agarwal, G.; Reddy, G.B. Study of Mg2 + -Intercalated Nb2O5 Thin Films for Electrochromic Applications. J. Electrochem. Soc. 2007, 154, A417. [Google Scholar] [CrossRef]
- Mujawar, S.; Inamdar, A.; Betty, C.; Ganesan, V.; Patil, P. Effect of post annealing treatment on electrochromic properties of spray deposited niobium oxide thin films. Electrochim. Acta 2007, 52, 4899–4906. [Google Scholar] [CrossRef]
- Romero, R.; Dalchiele, E.A.; Martín, F.; Leinen, D.; Ramos-Barrado, J.R. Electrochromic behavior of Nb2O5 thin films with different morphologies obtained by spray pyrolysis. Sol. Energy Mater. Sol. Cells 2009, 93, 222–229. [Google Scholar] [CrossRef]
- Devan, R.S.; Gao, S.-Y.; Ho, W.-D.; Lin, J.-H.; Ma, Y.-R.; Patil, P.S.; Liou, Y. Electrochromic properties of large-area and high-density arrays of transparent one-dimensional β-Ta2O5 nanorods on indium-tin-oxide thin-films. Appl. Phys. Lett. 2011, 98, 133117. [Google Scholar] [CrossRef]
- Canta, M.P.; Cisneros, J.I.; Torresi, R.M. Electrochromic behavior of sputtered titanium oxide thin films. Thin Solid Film. 1995, 259, 70–74. [Google Scholar] [CrossRef]
- Şilik, E.; Pat, S.; Özen, S.; Mohammadigharehbagh, R.; Yudar, H.H.; Musaoğlu, C.; Korkmaz, Ş. Electrochromic properties of TiO2 thin films grown by thermionic vacuum arc method. Thin Solid Film. 2017, 640, 27–32. [Google Scholar] [CrossRef]
- Cai, G.F.; Zhou, D.; Xiong, Q.Q.; Zhang, J.H.; Wang, X.L.; Gu, C.D.; Tu, J.P. Efficient electrochromic materials based on TiO2- WO3 core/shell nanorod arrays. Sol. Energy Mater. Sol. Cells 2013, 117, 231–238. [Google Scholar] [CrossRef]
- Patil, P.S.; Mujawar, S.H.; Inamdar, A.I.; Sadale, S.B. Electrochromic properties of spray deposited TiO2-doped WO3 thin films. Appl. Surf. Sci. 2005, 250, 117–123. [Google Scholar] [CrossRef]
- Dhandayuthapani, T.; Sivakumar, R.; Zheng, D.; Xu, H.; Ilangovan, R.; Sanjeeviraja, C.; Lin, J. WO3/TiO2 hierarchical nanostructures for electrochromic applications. Mater. Sci. Semicond. Process. 2021, 123, 105515. [Google Scholar] [CrossRef]
- GV, A.R.; Shaik, H.; Kumar, K.N.; Madhavi, V.; Shetty, H.D.; Sattar, S.A.; Dhananjaya, M.; Prasad, B.D.; Kumar, G.R.; Doreswamy, B.H. Structural and electrochemical studies of WO3 coated TiO2 nanorod hybrid thin films for electrochromic applications. Optik 2023, 277, 170694. [Google Scholar] [CrossRef]
- Nah, Y.-C.; Ghicov, A.; Kim, D.; Berger, S.; Schmuki, P. TiO2−WO3 Composite Nanotubes by Alloy Anodization: Growth and Enhanced Electrochromic Properties. J. Am. Chem. Soc. 2008, 130, 16154–16155. [Google Scholar] [CrossRef] [PubMed]
- Goei, R.; Ong, A.J.; Hao, T.J.; Yi, L.J.; Kuang, L.S.; Mandler, D.; Magdassi, S.; Tok, A.I.Y. Novel Nd–Mo co-doped SnO2/α-WO3 electrochromic materials (ECs) for enhanced smart window performance. Ceram. Int. 2021, 47, 18433–18442. [Google Scholar] [CrossRef]
- Kim, K.-H.; Koo, B.-R.; Ahn, H.-J. Effects of Sb-doped SnO2-WO3 nanocomposite on electrochromic performance. Ceram. Int. 2019, 45, 15990–15995. [Google Scholar] [CrossRef]
- Wei, W.; Li, Z.; Guo, Z.; Li, Y.; Hou, F.; Guo, W.; Wei, A. An electrochromic window based on hierarchical amorphous WO3/SnO2 nanoflake arrays with boosted NIR modulation. Appl. Surf. Sci. 2022, 571, 151277. [Google Scholar] [CrossRef]
- Green, S. Electrochromic Nickel–Tungsten Oxides: Optical, Electrochemical and Structural Characterization of Sputter-deposited Thin Films in the Whole Composition Range, Digital Comprehensive Summaries of Uppsala Dissertations from the Faculty of Science and Technology, Acta Universitatis Upsaliensis. 2012, p. 963. Available online: https://www.diva-portal.org/smash/record.jsf?pid=diva2%3A546180&dswid=-4502 (accessed on 30 December 2024).
- Green, S.V.; Pehlivan, E.; Granqvist, C.G.; Niklasson, G.A. Electrochromism in sputter deposited nickel-containing tungsten oxide films. Sol. Energy Mater. Sol. Cells 2012, 99, 339–344. [Google Scholar] [CrossRef]
- Rakibuddin, M.; Shinde, M.A.; Kim, H. Sol-gel fabrication of NiO and NiO/WO3 based electrochromic device on ITO and flexible substrate. Ceram. Int. 2020, 46, 8631–8639. [Google Scholar] [CrossRef]
- Najafi-Ashtiani, H.; Bahari, A.; Gholipour, S. Investigation of coloration efficiency for tungsten oxide–silver nanocomposite thin films with different surface morphologies. J. Mater. Sci. Mater. Electron. 2018, 29, 5820–5829. [Google Scholar] [CrossRef]
- Park, Y.J.; Lee, D.; Kang, K.-M.; Choi, S.; Shin, M.; Han, S.H.; Heo, I.; Jang, H.S.; Nah, Y.-C.; Kim, D.H. Enhanced electrochromic properties of Ag-incorporated WO3 nanocomposite thin films. Ceram. Int. 2023, 49, 17969–17976. [Google Scholar] [CrossRef]
- Patil, C.E.; Tarwal, N.L.; Jadhav, P.R.; Shinde, P.S.; Deshmukh, H.P.; Karanjkar, M.M.; Moholkar, A.V.; Gang, M.G.; Kim, J.H.; Patil, P.S. Electrochromic performance of the mixed V2O5–WO3 thin films synthesized by pulsed spray pyrolysis technique. Curr. Appl. Phys. 2014, 14, 389–395. [Google Scholar] [CrossRef]
- Prasad, A.K.; Park, J.-Y.; Kang, S.-H.; Ahn, K.-S. Electrochemically co-deposited WO3-V2O5 composites for electrochromic energy storage applications. Electrochim. Acta 2022, 422, 140340. [Google Scholar] [CrossRef]
- Burdis, M.S.; Siddle, J.R.; Batchelor, R.A.; Gallego, J.M. V0.50Ti0.50Ox thin films as counter electrodes for electrochromic devices. Sol. Energy Mater. Sol. Cells 1998, 54, 93–98. [Google Scholar] [CrossRef]
- Marcel, C.; Vincent, A.; Brigouleix, C.; Nouhaud, G.; Hamon, Y.; Sabary, F.; Campet, G. Electrochromic properties of lithium flexible devices based on tungsten and vanadium-titanium oxide thin films. In Electrochromic Materials and Applications; Rougier, A., Nazri, G.A., Eds.; The Electrochemical Society: Pennington, NJ, USA, 2003; p. 218. [Google Scholar]
- Prameela, C.; Srinivasarao, K. Characterization of (MoO3)x-(Wo3)1−x composites. Int. J. Appl. Eng. Res. 2015, 10, 9865–9875. [Google Scholar]
- Faughnan, B.W.; Crandall, R.S. Optical properties of mixed-oxide WO3/MoO3 electrochromic films. Appl. Phys. Lett. 1977, 31, 834–836. [Google Scholar] [CrossRef]
- Faughnan, B.W.; Crandall, R.S.; Heyman, P.M. Electrochromism in WO3 Amorphous Films. Rca Rev. 1975, 36, 177–197. [Google Scholar]
- Hamelmann, F.; Gesheva, K.; Ivanova, T.; Szekeres, A.; Abroshev, M.; Heinzmann, U. Optical and electrochromic characterization of multilayered mixed metal oxide thin films. J. Optoelectron. Adv. Mater. 2005, 7, 393–396. [Google Scholar]
- Arvizu, M.A.; Granqvist, C.G.; Niklasson, G.A. Electrochromism in sputter deposited W1-y MoyO3 thin films. J. Phys. Conf. Ser. 2016, 682, 012005. [Google Scholar] [CrossRef]
- Lábadi, Z.; Takács, D.; Zolnai, Z.; Petrik, P.; Fried, M. Compositional optimization of sputtered WO3/MoO3 films for high coloration efficiency. Materials 2024, 17, 1000. [Google Scholar] [CrossRef]
- Shrestha, N.K.; Nah, Y.C.; Tsuchiya, H.; Schmuki, P. Self-organized nano-tubes of TiO2–MoO3 with enhanced electrochromic properties. Chem. Commun. 2009, 15, 2008–2010. [Google Scholar] [CrossRef]
- Ezhilmaran, B.; Bhat, S.V. Enhanced charge transfer in TiO2 nanoparticles/MoO3 nanostructures bilayer heterojunction electrode for efficient electrochromism. Mater. Today Commun. 2022, 31, 103497. [Google Scholar] [CrossRef]
- Lábadi, Z.; Ismaeel, N.T.; Petrik, P.; Fried, M. Electrochromic Efficiency in TixMe(1−x)Oy Type Mixed Metal-Oxide Alloys (Chapter). In Titanium Dioxide—Uses, Applications, and Advances; Montalvo, C., Aguilar, C.A., Moctezuma, E., Eds.; IntechOpen: London, UK, 2025. [Google Scholar] [CrossRef]
- Habashyani, S.; Mobtakeri, S.; Budak, H.F.; Kasapoğlu, A.E.; Çoban, Ö.; Gür, E. Electrochromic properties of undoped and Ti-doped MoO3 converted from nano-wall MoS2 thin films. Electrochim. Acta 2024, 498, 144638. [Google Scholar] [CrossRef]
- Ismaeel, N.T.; Lábadi, Z.; Petrik, P.; Fried, M. Investigation of Electrochromic, Combinatorial TiO2-SnO2 Mixed Layers by Spec troscopic Ellipsometry Using Different Optical Models. Materials 2023, 16, 4204. [Google Scholar] [CrossRef] [PubMed]
- Sato, S.; Seino, Y. Electrochromism in evaporated WO3-MoO3-V2O5 films. Electron. Commun. Jpn. 1982, 65, 104–111. [Google Scholar] [CrossRef]
- Lábadi, Z.; Ismaeel, N.T.; Petrik, P.; Fried, M. Compositional Optimization of Sputtered SnO2/ZnO Films for High Coloration Efficiency. Int. J. Mol. Sci. 2024, 25, 10801. [Google Scholar] [CrossRef] [PubMed]
- Yun, S.U.; Yoo, S.J.; Lim, J.W.; Park, S.H.; Cha, I.Y.; Sung, Y.-E. Enhanced Electrochromic Properties of Ir–Ta Oxide Grown Using a Co sputtering System. J. Electrochem. Soc. 2010, 157, 256. [Google Scholar] [CrossRef]
- Cho, H.M.; Hwang, Y.J.; Oh, H.S.; Hwang, H.S.; Kim, K.; Kim, S.; Na, J. Recent Advances in Electrochromic Devices: From Multicolor to Flexible Applications. Adv. Photonics Res. 2024, 6, 2400103. [Google Scholar] [CrossRef]
- Chen, D.; Chua, M.H.; He, Q.; Zhu, Q.; Wang, X.; Meng, H.; Xu, J.; Huang, W. Multifunctional electrochromic materials and devices recent advances and future potential. Chem. Eng. J. 2025, 503, 157820. [Google Scholar] [CrossRef]


| Sample | DC Voltage Steps (V) | Tc (%) | Tb (%) | ΔT (%) | CE (cm2C−1) | τC (s) | τB(s) | Γ(λ) (cm2C−1s−1) |
|---|---|---|---|---|---|---|---|---|
| WAg-0 | +1.0 to −1.0 | 45.15 | 82.18 | 37.03 | 71.9 | 4.2 | 11 | 9.46 |
| WAg-75 | +1.0 to −1.0 | 43.09 | 83.68 | 40.59 | 90.2 | 3.9 | 8.9 | 14.09 |
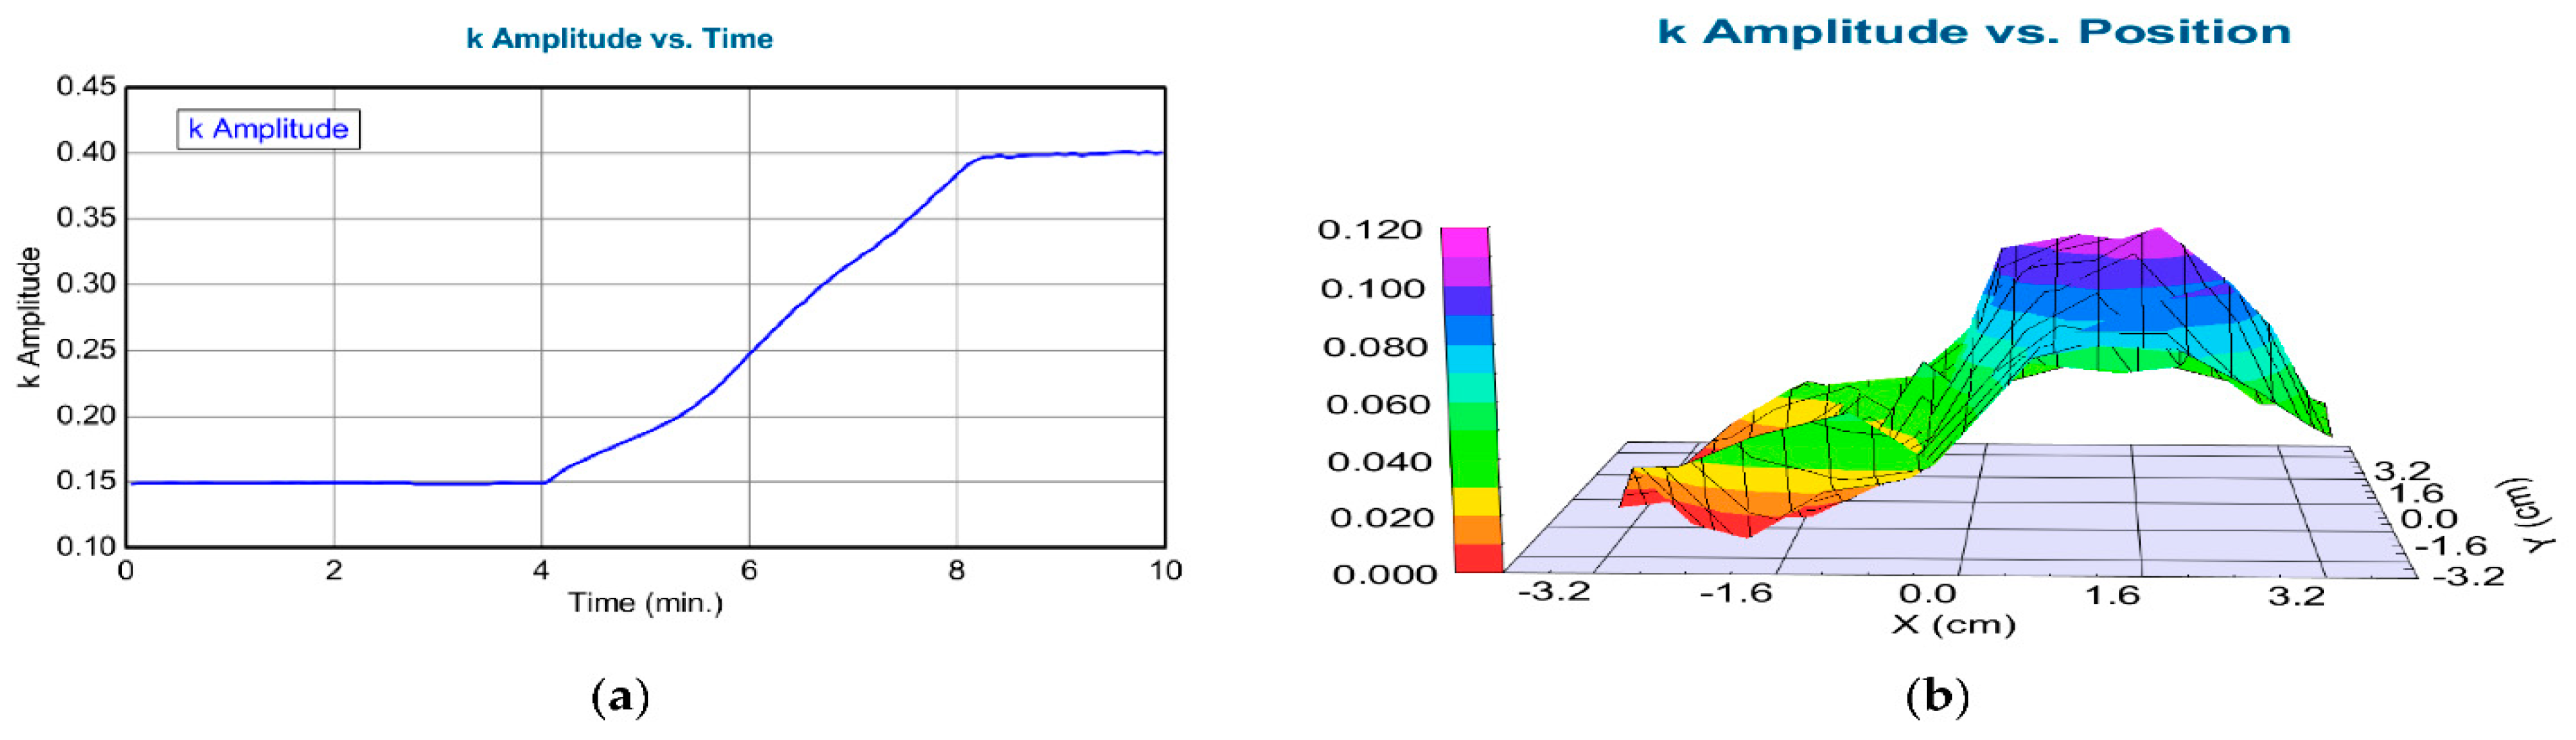
| X (cm) | k Amplitude (Error ± 0.005) |
|---|---|
| −3.5 | 0.0002 |
| −3 | 0.0025 |
| −2.5 | 0.044 |
| −2 | 0.004 |
| −1.5 | 0.015 |
| −1 | 0.025 |
| −0.5 | 0.056 |
| 0 | 0.041 |
| 0.5 | 0.092 |
| 1 | 0.105 |
| 1.5 | 0.075 |
Disclaimer/Publisher’s Note: The statements, opinions and data contained in all publications are solely those of the individual author(s) and contributor(s) and not of MDPI and/or the editor(s). MDPI and/or the editor(s) disclaim responsibility for any injury to people or property resulting from any ideas, methods, instructions or products referred to in the content. |
© 2025 by the authors. Licensee MDPI, Basel, Switzerland. This article is an open access article distributed under the terms and conditions of the Creative Commons Attribution (CC BY) license (https://creativecommons.org/licenses/by/4.0/).
Share and Cite
Lábadi, Z.; Ismaeel, N.T.; Petrik, P.; Fried, M. Electrochromic Efficiency in AxB(1−x)Oy-Type Mixed Metal Oxide Alloys. Int. J. Mol. Sci. 2025, 26, 3547. https://doi.org/10.3390/ijms26083547
Lábadi Z, Ismaeel NT, Petrik P, Fried M. Electrochromic Efficiency in AxB(1−x)Oy-Type Mixed Metal Oxide Alloys. International Journal of Molecular Sciences. 2025; 26(8):3547. https://doi.org/10.3390/ijms26083547
Chicago/Turabian StyleLábadi, Zoltán, Noor Taha Ismaeel, Péter Petrik, and Miklós Fried. 2025. "Electrochromic Efficiency in AxB(1−x)Oy-Type Mixed Metal Oxide Alloys" International Journal of Molecular Sciences 26, no. 8: 3547. https://doi.org/10.3390/ijms26083547
APA StyleLábadi, Z., Ismaeel, N. T., Petrik, P., & Fried, M. (2025). Electrochromic Efficiency in AxB(1−x)Oy-Type Mixed Metal Oxide Alloys. International Journal of Molecular Sciences, 26(8), 3547. https://doi.org/10.3390/ijms26083547