Article

Genome-Wide Identification and Expression Analysis of Thionin Family in Rice (Oryza sativa) and Functional Characterization of OsTHION15 in Drought Stress and ABA Stress

1
College of Agriculture, Guangxi University, Nanning 530004, China
2
Key Laboratory of Genetics, Breeding and Multiple Utilization of Crops, Ministry of Education, Fujian Provincial Key Laboratory of Haixia Applied Plant Systems Biology, College of Life Sciences, Fujian Agriculture and Forestry University, Fuzhou 350002, China
3
Jiangsu Provincial Key Laboratory of Coastal Wetland Bioresources and Environmental Protection, Jiangsu Collaborative Innovation Center for Coastal Biology and Agriculture, School of Wetlands, Yancheng Teachers University, Yancheng 224002, China
*
Authors to whom correspondence should be addressed.
Int. J. Mol. Sci. 2025, 26(7), 3447; https://doi.org/10.3390/ijms26073447
Submission received: 16 February 2025 / Revised: 3 April 2025 / Accepted: 5 April 2025 / Published: 7 April 2025
(This article belongs to the Special Issue Plant Response to Drought, Heat, and Light Stress)

Abstract

The OsTHION family represents a class of cysteine-rich signal peptides widely recognized for their significant roles in plant disease resistance and immunity. While members of this family are known to be induced under various biotic and abiotic stresses, their responses to environmental stressors beyond disease resistance remain underexplored. This study investigates the evolution, expression patterns, and functional roles of the OsTHION gene family in rice (Oryza sativa) under diverse stress conditions. Using sequence data from the Phytozome database, we identified 44 OsTHION family members and classified them into four groups based on phylogenetic analysis. Cis-acting element analysis revealed that the promoter regions of OsTHION genes are enriched with regulatory elements associated with light response, hormone signaling, plant growth, and stress responses. The OsTHION genes exhibit complex organ-specific expression patterns, with OsTHION30 and OsTHION36 showing ubiquitous expression, while other members are highly expressed in specific tissues or developmental stages. Under drought, salt, and low-temperature stress, OsTHION genes undergo significant expression changes, underscoring their critical role in plant adaptation to environmental challenges. Notably, OsTHION15 was markedly upregulated under drought stress, and the Osthion15 mutant displayed heightened sensitivity to drought and ABA stress, confirming its pivotal role in stress resistance. RNA sequencing analysis identified many differentially expressed genes (DEGs), primarily enriched in pathways related to ribosomal function and plant hormone signaling, suggesting that OsTHION15 may regulate stress responses through multiple mechanisms. In summary, this study advances our understanding of the OsTHION gene family and highlights its intricate involvement in regulating rice growth, development, and environmental stress responses. These findings offer valuable insights and technical support for crop improvement, with potential applications in enhancing environmental adaptability and yield stability in crops.

1. Introduction

In the natural environment, plants are constantly exposed to a variety of environmental stresses. Over evolutionary time, they have developed sophisticated and efficient defense mechanisms to ensure growth and survival. These mechanisms include physical and chemical defenses [1,2], as well as the innate immune system. When activated, the innate immune system triggers defense-related signaling pathways and promotes the accumulation of antimicrobial proteins, such as pathogenesis-related (PR) proteins, to counteract pathogen invasion [3]. PR proteins are typically small molecules with molecular weights ranging from 5 to 75 kDa [4]. Among them, plant thionins represent a crucial class of antimicrobial peptides and are key members of the PR protein family, playing a vital role in plant defense mechanisms [4]. These peptides are widely distributed across the plant kingdom and are known for their potent bactericidal effects, achieved by disrupting bacterial, fungal, and other cellular membranes. As a result, thionins are integral to the innate immune response of plants [5]. Thionins are alkaline, sulfur-rich peptides due to their high cysteine content, with a molecular mass typically between 5 and 10 kDa and a sequence length of approximately 45 to 90 amino acids. Structurally, they consist of three main regions: an N-terminal signal peptide, a central thionin domain, and a C-terminal acidic region. Upon maturation, they form disulfide bridges from 6 to 14 cysteine residues, which confer structural stability and functional activity [6,7,8].
Current research indicates that plant thionins primarily interact with negatively charged phospholipids in bacterial cell membranes. This interaction disrupts membrane integrity, leading to an imbalance of intracellular ions such as Ca2⁺ and K⁺. Consequently, essential cellular components, including proteins and nucleotides, leak out, exerting toxic effects on bacteria and protecting plants from bacterial invasion [9,10,11,12]. For example, the defense factor CpTHION II, purified from rainbow beans, effectively inhibits Fusarium oxysporum activity at 100 μg/mL concentration by altering fungal hyphal membrane permeability, thereby protecting wheat grains from fungal damage [13]. In chili pepper (Capsicum annuum), the thionin protein CaTHION enhances resistance to bacterial pathogens by inducing the endogenous production of hydrogen peroxide (H₂O₂) within Fusarium oxysporum f. sp. papryticum [14]. Overexpression of thionin genes has been shown to significantly enhance plant resistance to various pathogens. In rice, overexpression of OsTHION1 increases resistance to necrotrophic bacteria [15]. Similarly, in citrus, overexpression of CsTHIONF, which encodes a sulfur-rich protein, reduces citrus canker symptoms and inhibits bacterial proliferation in transgenic plants [16]. In Arabidopsis, the expression of AtTHION2.1 is upregulated in response to fungal infection, and its overexpression significantly reduces chlorophyll degradation and fungal proliferation in Arabidopsis cotyledons [17,18]. The transfer of the THION gene from mistletoe into Arabidopsis enhances its defense against pathogenic attacks [19]. In chili peppers (Capsicum annuum), anthracnose infection triggers the rapid induction of the PeTHION gene within the fruit, protecting against fungal invasion and safeguarding plant tissues and organs [20]. Beyond bacterial and fungal resistance, thionins also exhibit insect-resistant properties. For instance, in barley, the expression of the THION genes is significantly upregulated under aphid stress, and its overexpression in tobacco reduces susceptibility to peach aphids [21,22]. In rice, the thionin gene OsTHION15 inhibits Aspergillus oryzae activity and Fusarium oxysporum hyphal growth, and its transfer into tobacco enhances antibacterial properties [23]. Additionally, overexpression of OsTHION7 in rice significantly reduces root sensitivity to pathogens [24]. These findings collectively underscore the critical role of thionins in enhancing plant innate immunity and highlight their potential for developing disease-resistant crops through genetic engineering.
Studies have demonstrated that pathogenesis-related proteins (PRs) confer disease resistance and are induced by abiotic stress factors such as cold damage, drought, heavy metals, and mechanical injury [4]. For example, the PR-10 protein is induced by salt and heavy metal stress, enhancing salt and drought tolerance in rice and potatoes [25,26,27]. In Arabidopsis, salt and drought stress significantly increase the expression of PR genes [28,29]. In pepper plants, the mRNA levels of PR1, a marker gene for systemic acquired resistance, rise in response to abiotic stress [30]. Classic antifungal PR proteins, such as PR2 and PR3, protect against cell damage caused by cold stress and exhibit antifreeze activity [31]. Additionally, cold stress significantly induces the expression of antimicrobial peptides (AMPs), specifically PR12 and PR13 (THION), in oxytropis and wheat plants [32,33]. However, research on Cys-rich THION peptides has primarily focused on their role in disease resistance, with limited exploration of their responses to abiotic stress and hormone signaling. Previous studies have shown that OsTHION genes in rice are induced by various biotic and abiotic stresses [34], suggesting their potential importance in abiotic stress responses.
In this study, we comprehensively analyzed OsTHION proteins in rice, including phylogenetic tree construction, prediction of cis-acting regulatory elements, and profiling of tissue-specific and stress-responsive expression patterns. We performed a detailed functional analysis of OsTHION15 to elucidate its role and response mechanisms under ABA treatment. Using RNA-seq transcriptomic analysis, we characterized the altered gene expression profiles in the Osthion15 mutant under ABA and drought stress. Our findings provide significant insights into the molecular mechanisms by which OsTHION15 regulates plant responses to ABA and drought stress. These results contribute to a broader understanding of rice stress tolerance and offer potential genetic improvement targets to enhance crop resilience under adverse environmental conditions.

2. Results

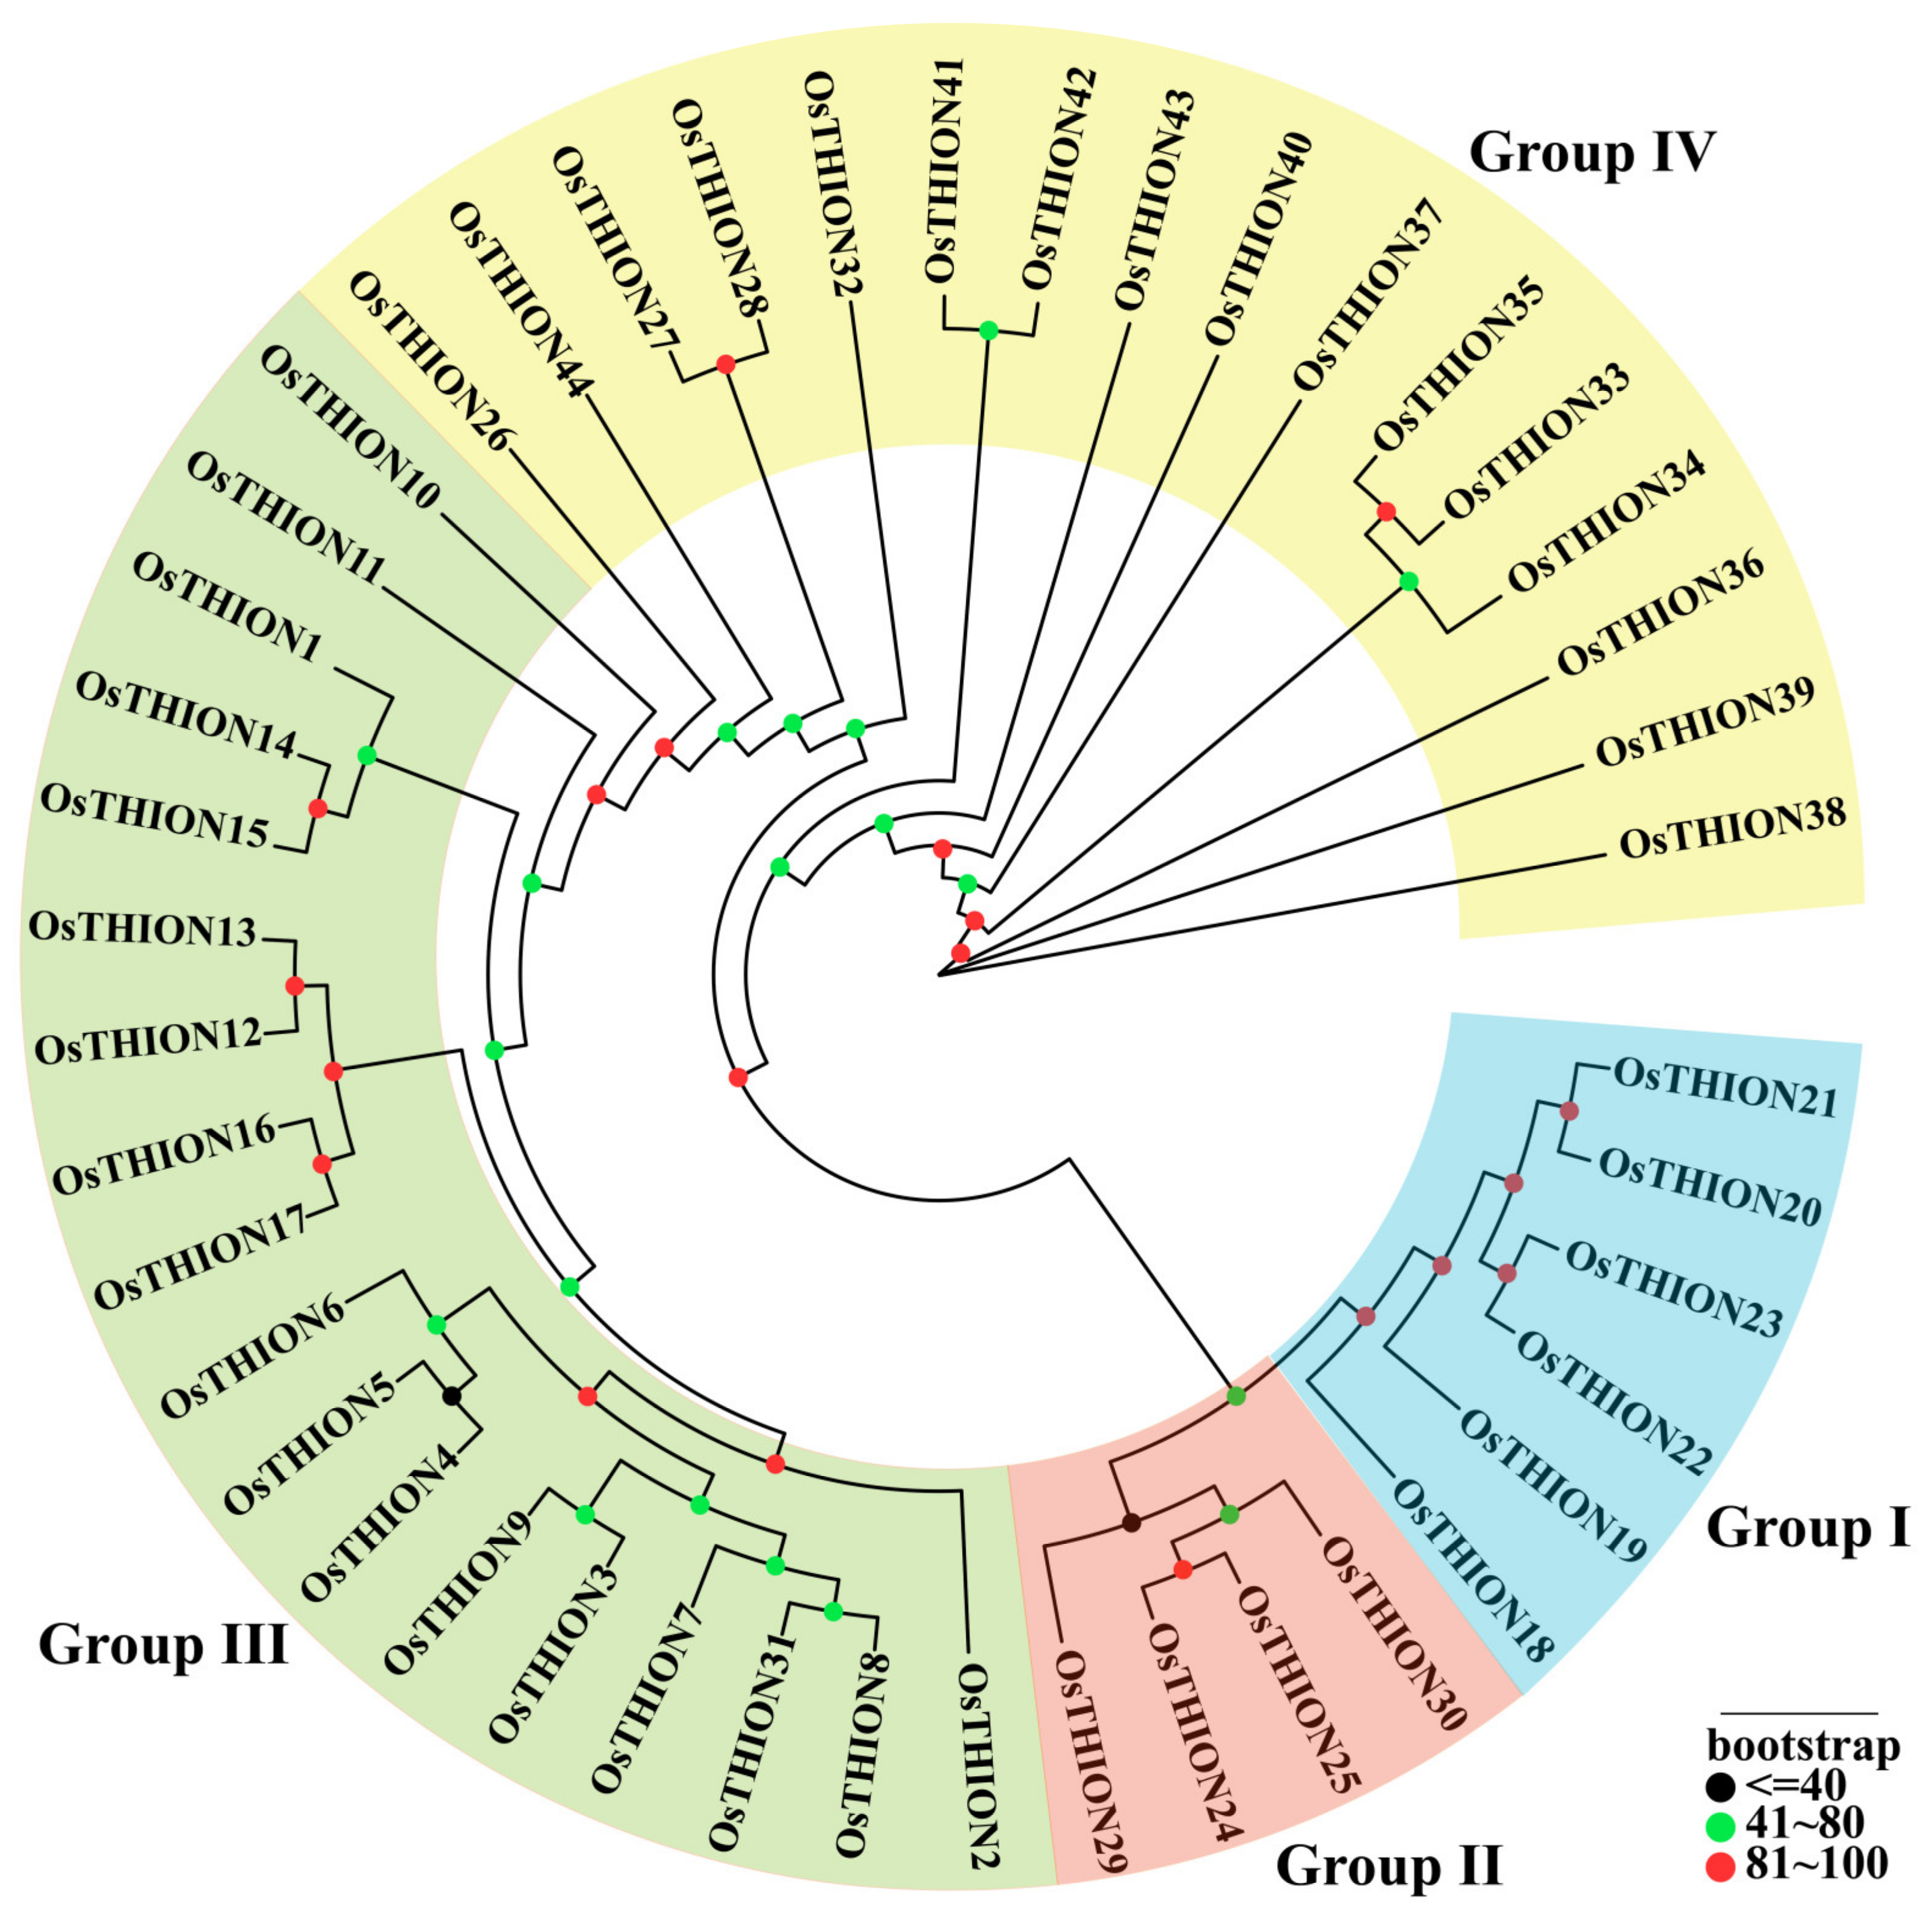
2.1. Evolutionary Analysis of OsTHION Genes

The sequence information for 44 OsTHION family genes, including amino acid and promoter sequences, was obtained from the Phytozome database (https://phytozome-next.jgi.doe.gov/) (accessed on 12 August 2024) (Table S1). To investigate the phylogenetic relationships among OsTHION family members, a maximum likelihood phylogenetic tree was constructed using MEGA software (Figure 1). Based on the tree’s topological structure, the OsTHION proteins were classified into four groups (I–IV). Group III contained the highest number of members (n = 18), followed by Group IV (n = 16) and Group I (n = 9), while Group II was the smallest, with only four members. To further explore the evolutionary relationships of OsTHIONs, 62 AtTHION family members were identified through BLAST (version2.16.0) analysis using the 44 OsTHION protein sequences (Table S2).
A phylogenetic tree incorporating both the OsTHION and AtTHION proteins revealed that the four OsTHION subgroups clustered separately, indicating a distant evolutionary relationship with AtTHION proteins. Notably, OsTHION31 is the only member that showed a close relationship with AT1G53282 and AT1G53285 (Figure S1). Collinearity analysis further confirmed the lack of synteny between OsTHIONs and AtTHIONs (Figure S2), suggesting that the OsTHION family has undergone significant functional divergence between monocotyledonous and dicotyledonous plants.

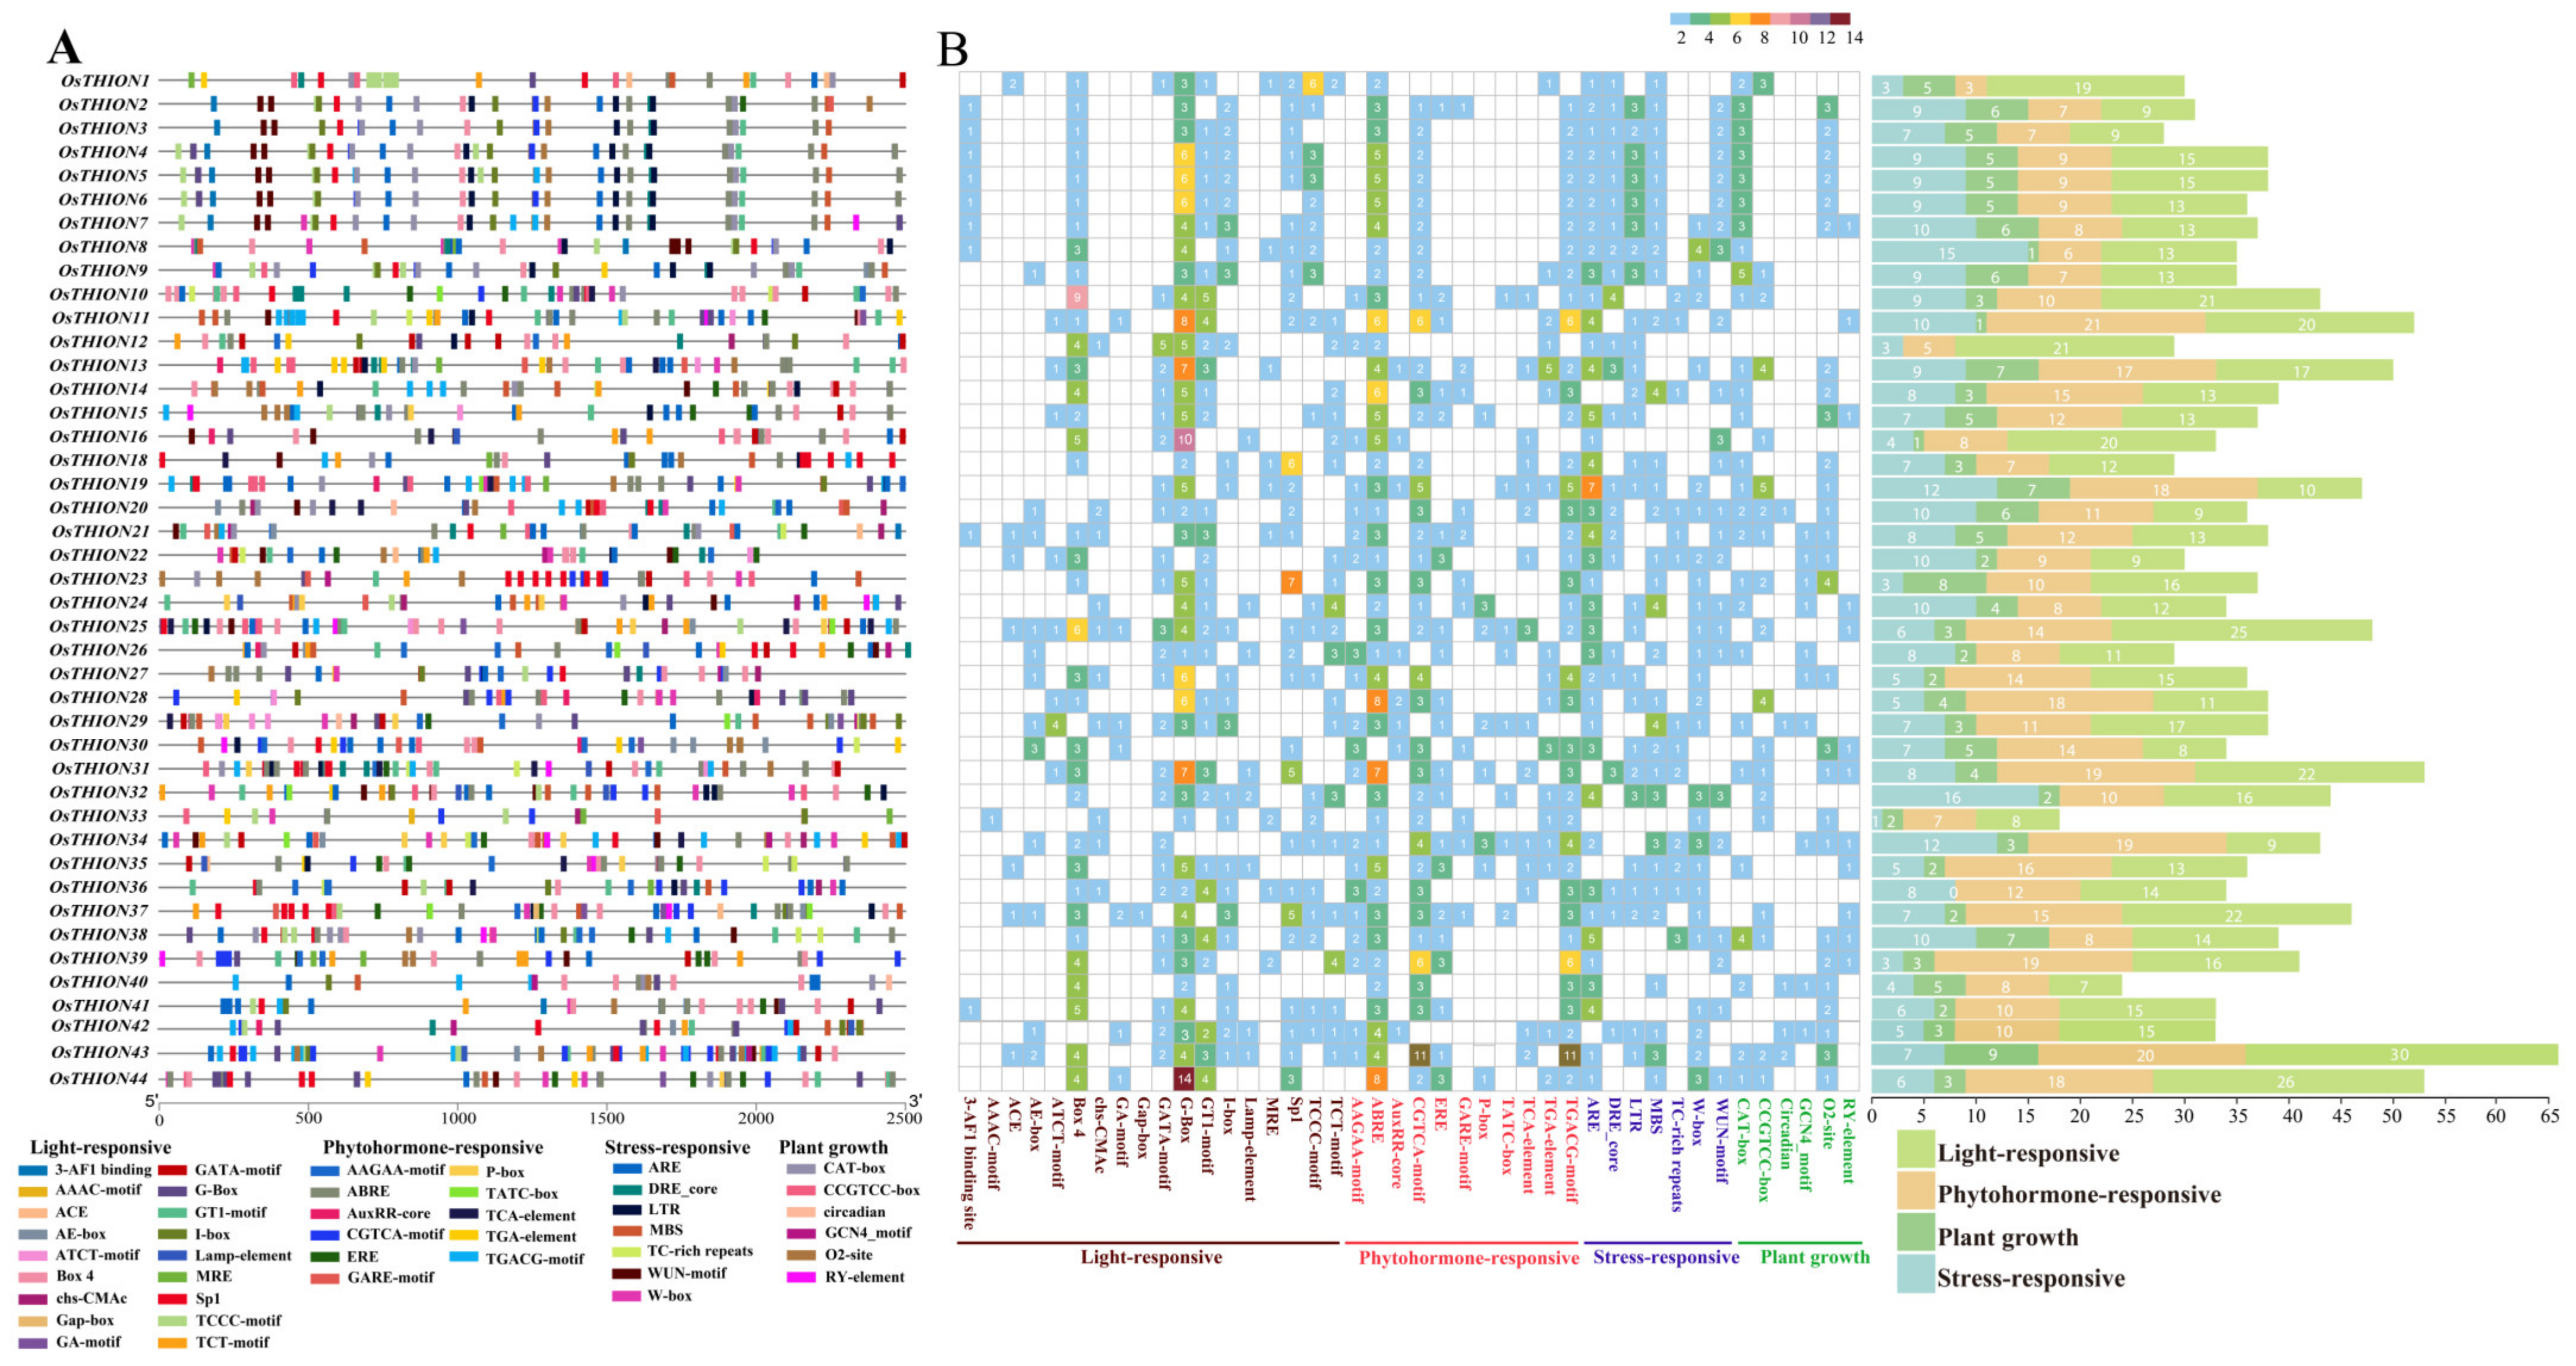
2.2. Cis-Acting Element Analysis of OsTHION Genes

To identify potential regulatory mechanisms, 2500 bp upstream promoter sequences of the 44 OsTHION genes were analyzed for cis-acting elements. A total of 42 different types of cis-acting elements were identified, including 18 light-responsive elements, 11 hormone-related elements, 7 stress-responsive elements, and 10 elements related to plant growth and development, with respective counts of 639, 498, 326, and 160 across the promoters of the 44 OsTHION genes (Figure 2A). Among these elements, those involved in light responses were the most abundant. Notably, G-box elements, which play an important role in regulating plant light-induced gene expression and mediating the signal transduction of photosensitive pigments [23,35], were particularly prevalent in the promoters of the OsTHION family genes. For instance, OsTHION16 and OsTHION44 promoters contained 10 and 14 G-box elements, respectively (Figure 2B), suggesting their potential roles in light-induced gene expression. Additionally, abscisic acid-responsive elements (ABRE) and jasmonic acid-responsive elements (CGTCA) were also highly represented, with ABRE elements identified in 43 OsTHION promoters and CGTCA elements in 38 (Figure 2B). These results indicate that OsTHION genes are likely involved in the ABA and JA signaling pathways, which are critical for stress responses.

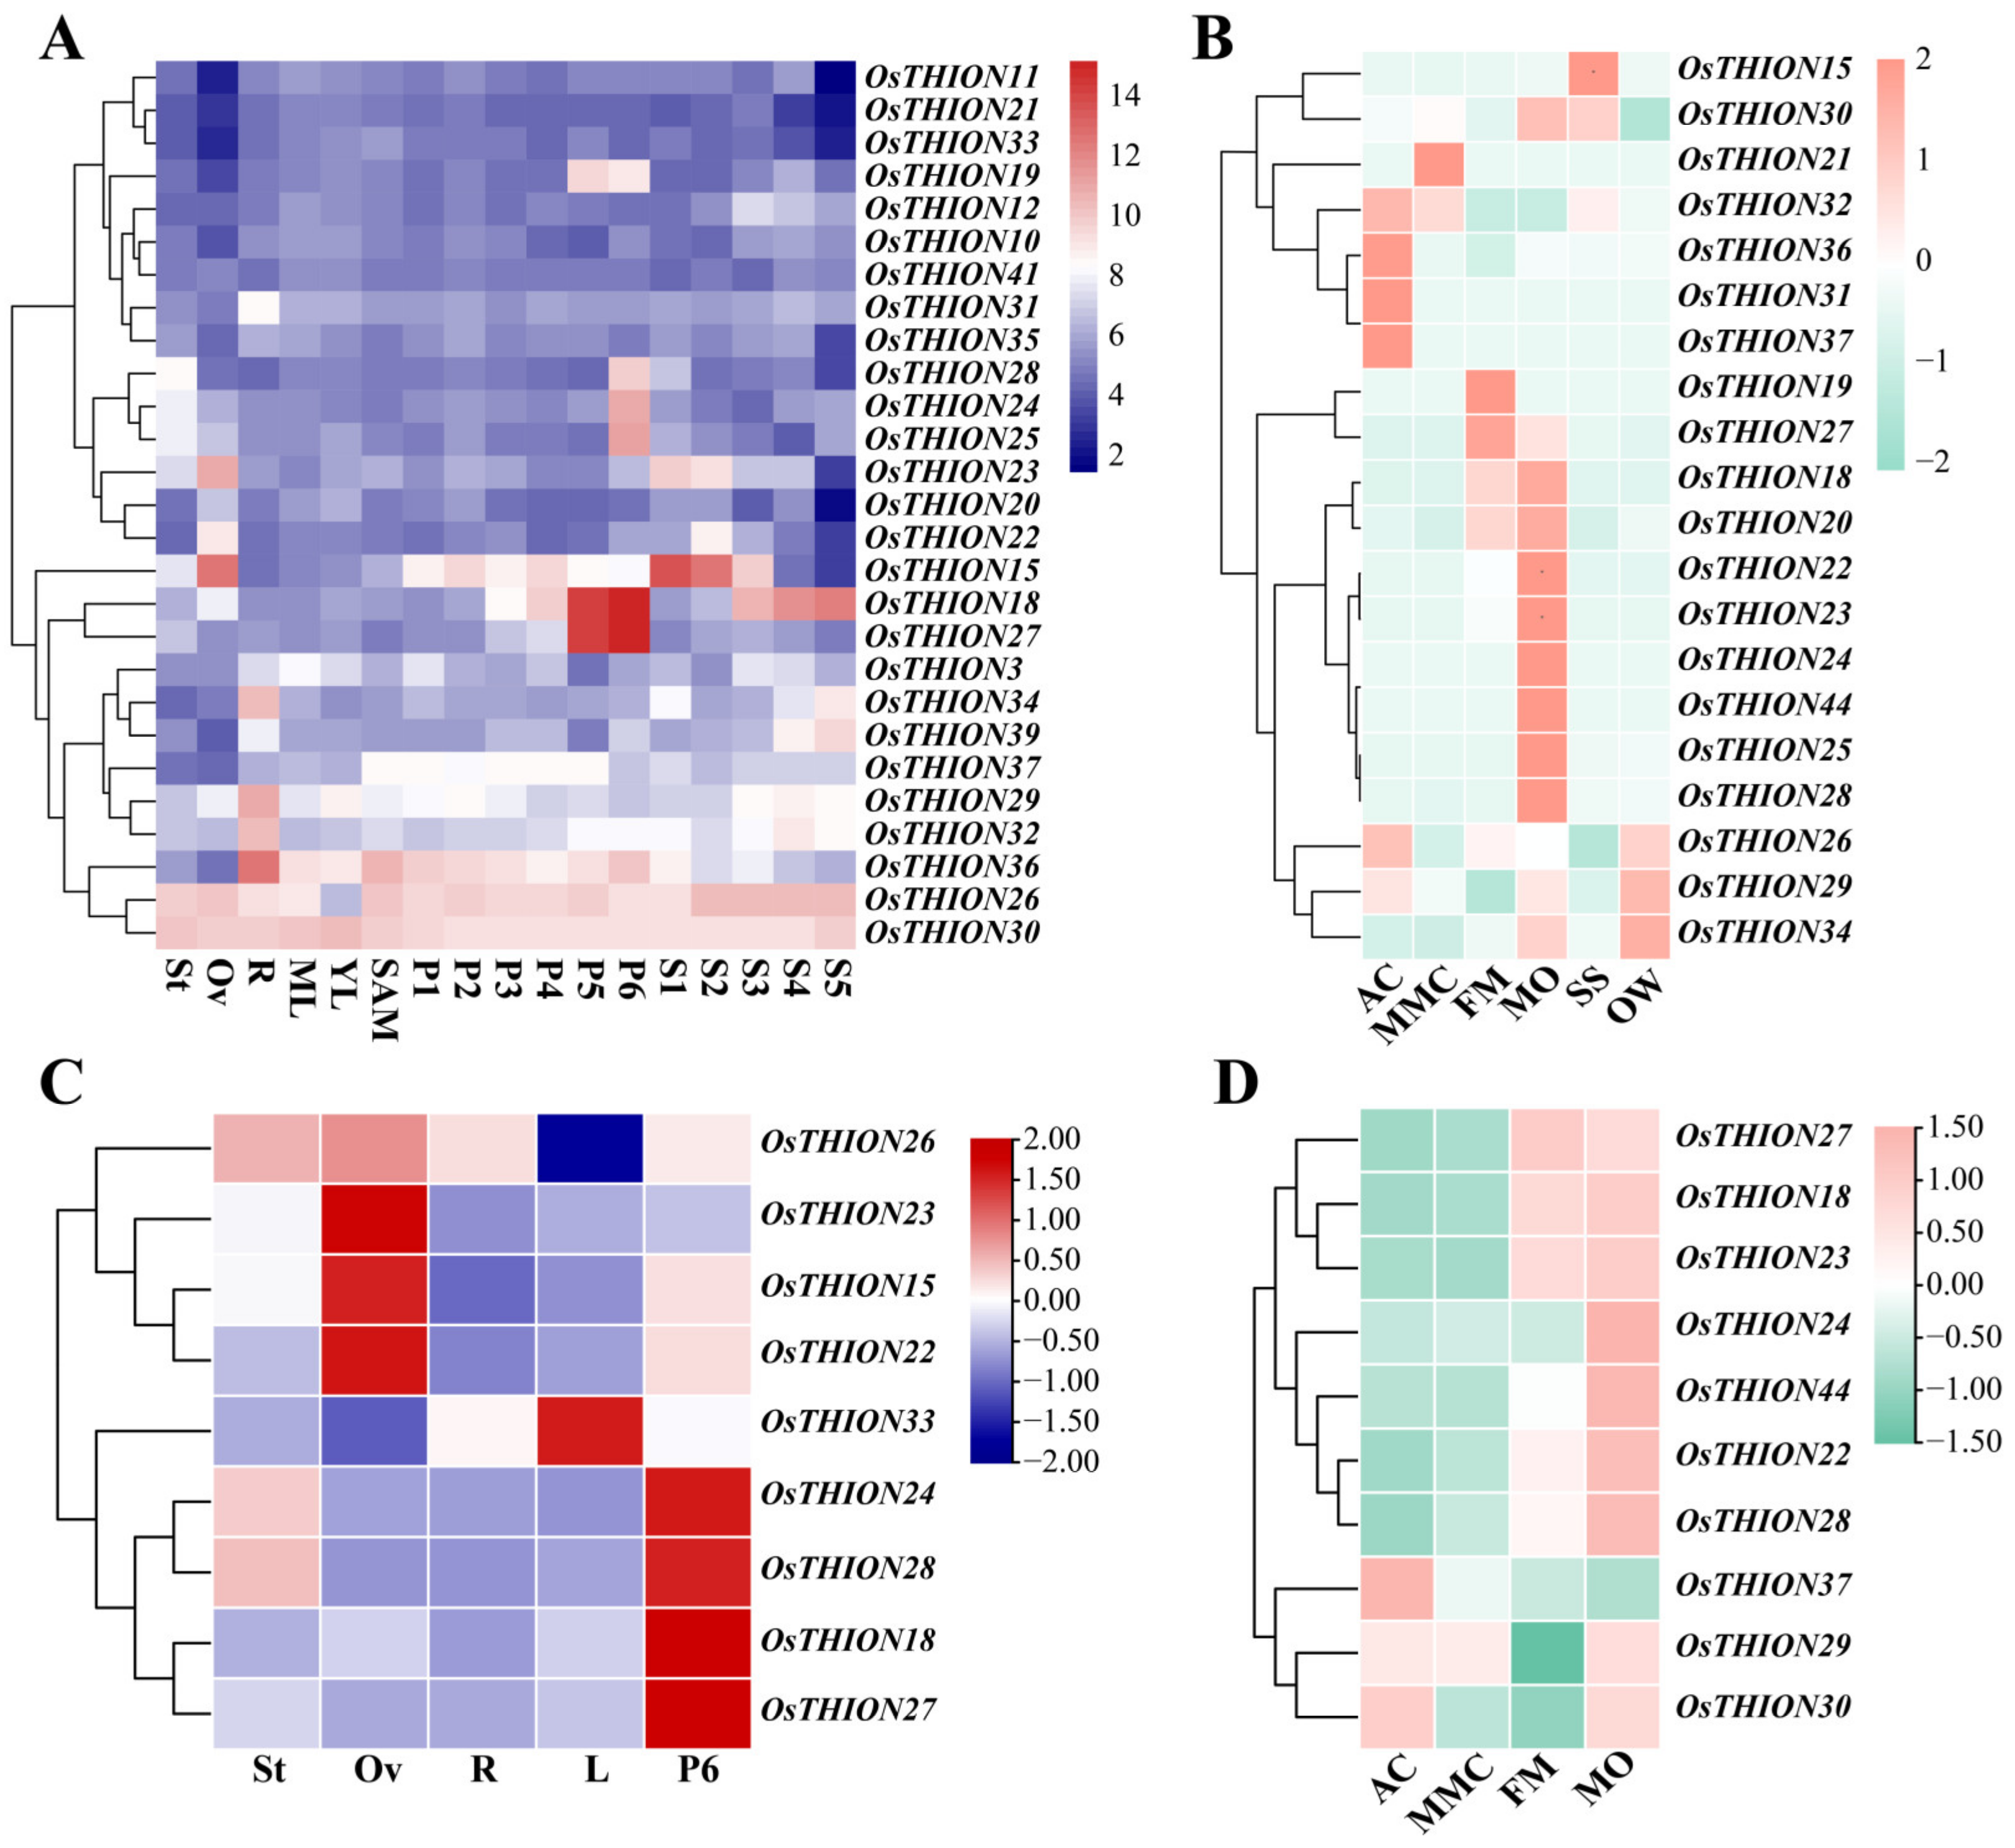
2.3. The Expression Pattern of OsTHION Family Genes in Rice Tissues

To investigate the potential functions of OsTHIONs, the expression levels (FPKM) of 27 OsTHION genes across different tissues were analyzed using the Rice eFP Browser [36] (Table S3). A heatmap was constructed to visualize the expression patterns of these 27 genes in the stigma and ovary of mature inflorescences, as well as in the roots and leaves of the 2-week-old seedlings and the panicles and seeds at different developmental stages (Figure 3A). The heatmap revealed that most OsTHION genes exhibit organ-specific expression patterns, except for OsTHION30 and OsTHION36, which were ubiquitously expressed across all tissues (Figure 3A). Specifically, OsTHION30 and OsTHION36 showed high expression levels in all vegetative tissues and at multiple floral development stages, suggesting their broad roles in rice growth and development. In contrast, OsTHION18, OsTHION24, OsTHION25, OsTHION27, and OsTHION28 were specifically expressed in the late-stage panicles, indicating their potential involvement in the later stages of flower development (Figure 3A). Similarly, OsTHION29, OsTHION31, OsTHION32, and OsTHION34 were predominantly expressed in the seedling roots (Figure 3A), implying their functional importance in root development. Additionally, OsTHION22 and OsTHION23 were explicitly expressed in the mature ovaries (Figure 3A), highlighting their potential roles in the late stages of ovary development. To validate these expression patterns, qRT-PCR analysis was performed on nine OsTHION genes in the roots and leaves of the seedlings, as well as in the stigmas and ovaries of the mature panicles. The qRT-PCR results were consistent with the FPKM heatmap data, confirming the tissue-specific expression patterns of these genes (Figure 3C).
In addition, an expression heatmap of 20 OsTHION genes was constructed based on FPKM expression data from female reproductive tissues of rice, including ovules at four developmental stages (AC, archesporial cell; MMC, megaspore mother cell; FM, functional megaspore; and MO, mature ovule), as well as the ovary wall (OW) and the style and stigma (SS) from FM-stage spikelets [37]. The heatmap revealed that OsTHION genes exhibit stage-specific expression patterns during ovule development. For instance, OsTHION31, OsTHION36, and OsTHION37 were predominantly expressed during the AC stage, while OsTHION21 showed specific expression during the MMC stage (Figure 3B), suggesting their critical roles in early ovule development, including female germ cell fate determinations and megaspore mother cell formations. Furthermore, OsTHION19 and OsTHION27 were highly expressed during the FM stage, while six OsTHION genes (OsTHION22, OsTHION23, OsTHION24, OsTHION25, OsTHION28, and OsTHION44) were specifically expressed at the mature ovule (MO) stage (Figure 3B). These stage-specific expression patterns indicate their involvement in late ovule development or fertilization regulation in rice. To further validate these findings, qRT-PCR analysis of 10 OsTHION genes was conducted to validate their expression patterns across the four ovule developmental stages. The qRT-PCR results confirmed the stage-specific expression patterns observed in the heatmap, further supporting the functional importance of OsTHION genes during ovule development (Figure 3D).

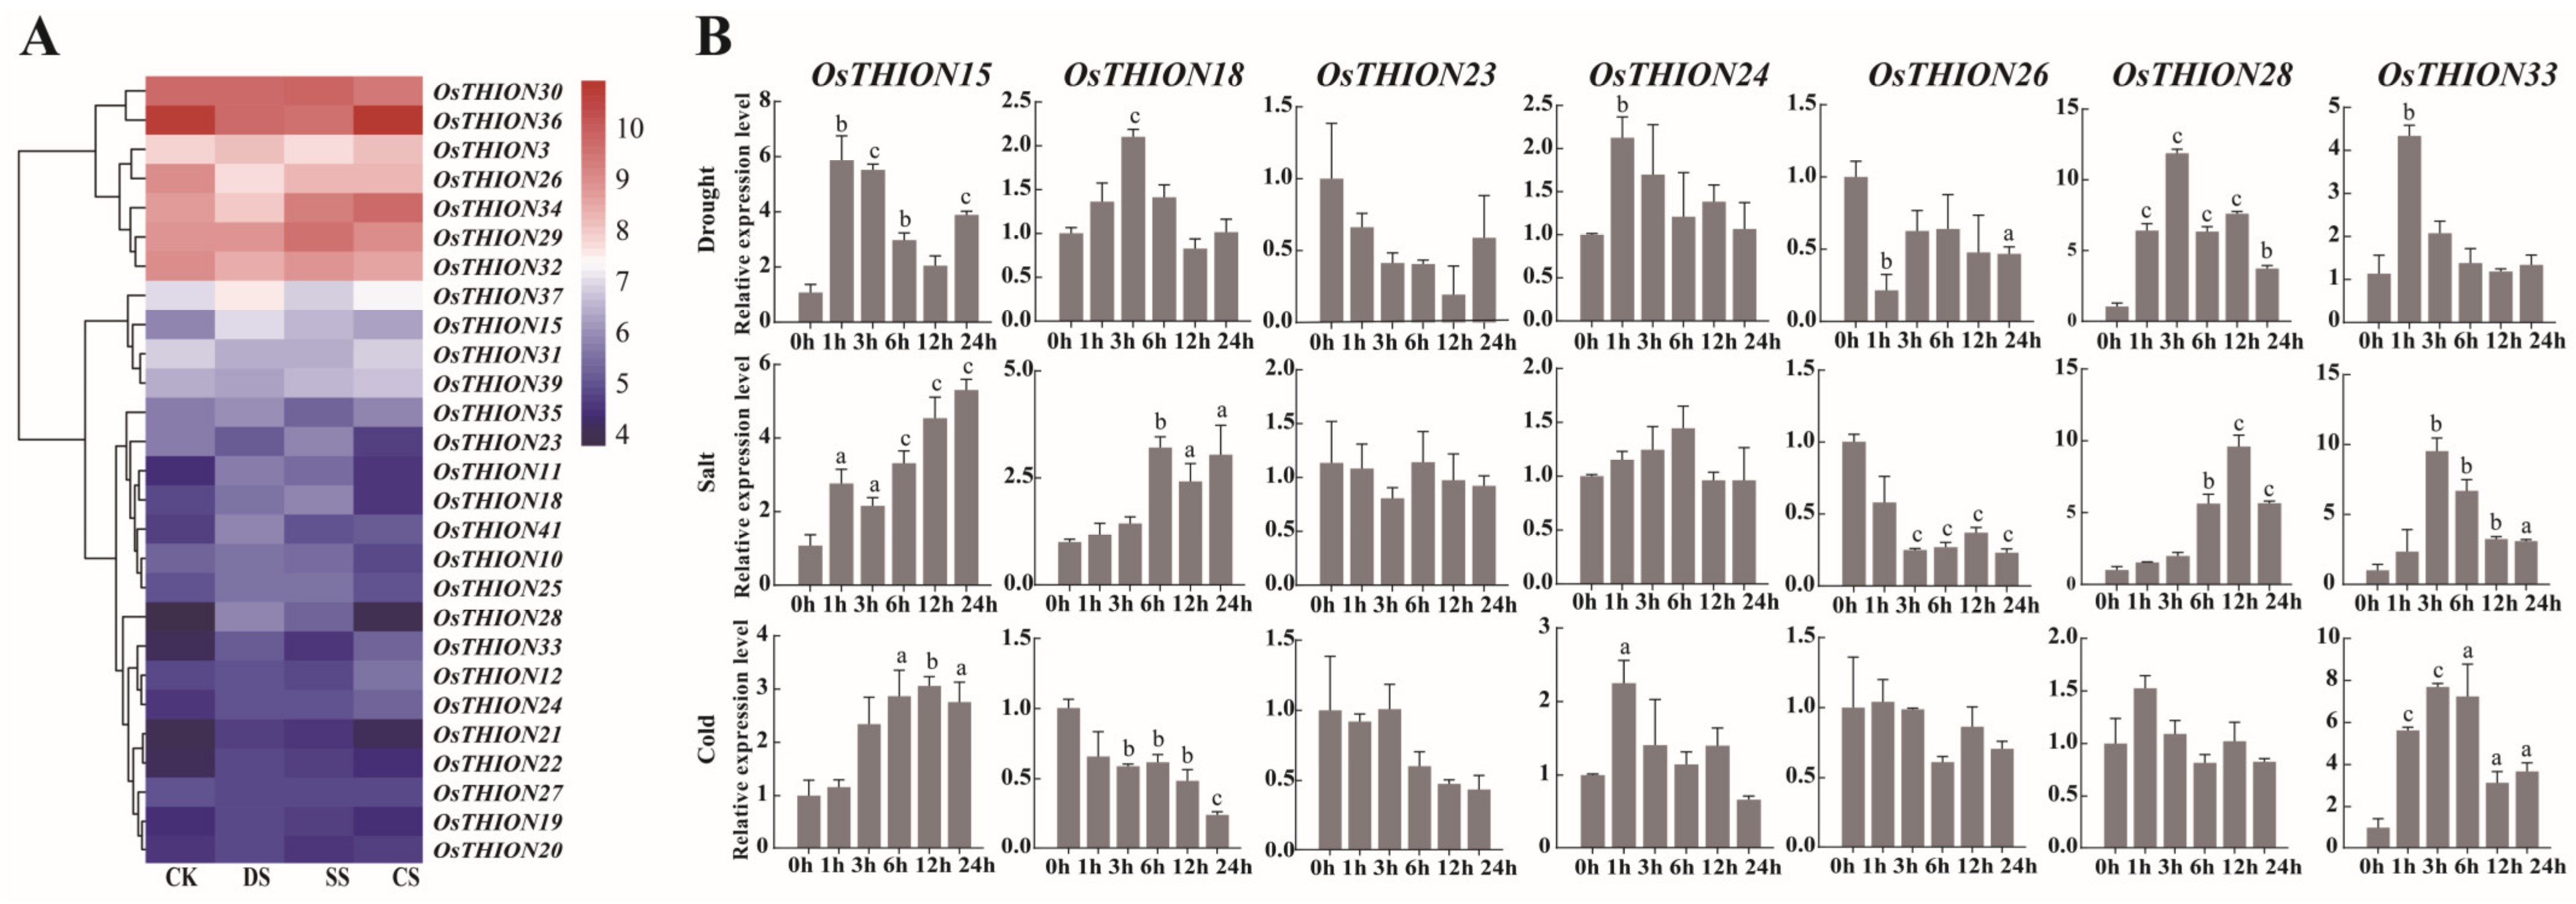
2.4. Expression Analysis of OsTHIONs Under Stress Conditions

Analysis of cis-acting elements within the promoter regions of OsTHION genes revealed an abundance of stress-responsive elements, suggesting a significant role for OsTHIONs in rice stress responses. To further elucidate their functions under stress conditions, expression heatmaps were generated using FPKM values from 27 OsTHION genes subjected to drought, salt, and cold stress (Table S4). The results demonstrated substantial variation in OsTHION expression levels across these treatments (Figure 4A). Under drought stress, the expression levels of 12 OsTHION genes were significantly upregulated, with OsTHION28, OsTHION15, OsTHION11, and OsTHION44 showing the most pronounced increases. Similarly, 11 OsTHION genes exhibited elevated expression under salt stress, with OsTHION28 displaying the highest upregulation. In response to cold stress, nine OsTHION genes were upregulated, with OsTHION33 and OsTHION34 showing the most significant induction. These findings indicate that OsTHION genes actively respond to drought, salt, and cold stress. Notably, OsTHION15, OsTHION24, and OsTHION33 were significantly upregulated under all three stress conditions (Figure 4A), suggesting their broad roles in plant stress adaptation. Furthermore, the OsTHION genes exhibited stress-specific expression patterns. For example, OsTHION19 and OsTHION41 were exclusively induced under drought stress, while OsTHION34 and OsTHION29 were uniquely upregulated under salt stress. In contrast, OsTHION46 was specifically induced only by cold stress (Figure 4A). These distinct expression profiles highlight the functional diversity of OsTHION genes in mediating stress-specific responses. To validate these findings, qRT-PCR experiments were conducted on selected OsTHION genes under drought, salt, and cold conditions (Table S5). The qRT-PCR results were consistent with the heatmap data. Specifically, OsTHION15 and OsTHION33 showed significant upregulation under all three stress conditions, while OsTHION18 and OsTHION28 were significantly upregulated under both drought and salt stress (Figure 4B). Notably, OsTHION26 was consistently downregulated across all stress treatments, as observed in both the heatmap and qRT-PCR analyses (Figure 4B). These results suggest that OsTHION26 may act as a negative regulator of stress responses, further underscoring the complexity of the OsTHION regulatory network in rice stress adaptation.

2.5. The Expression Pattern and Subcellular Localization

The expression level of OsTHION15 was significantly elevated in response to drought, salt, and cold stress (Figure 4A,B), suggesting its crucial role in the stress response mechanisms of rice. To validate this hypothesis, OsTHION15 was selected for further functional analysis. GUS staining of pOsTHION15::GUS transgenic plants revealed weak GUS signals in the roots, stems, and leaves of the seedlings (Figure 5A–C). Additionally, OsTHION15 was expressed in the florets at various developmental stages (Figure 5E), with specific localization in the stigma and style (SS) of the pistil at the FM stage (Figure 5D). These findings suggest a potential role for OsTHION15 in rice reproductive development, including flower organ formation and stamen–pistil interactions. To assess the response of OsTHION15 to drought stress, pOsTHION15::GUS transgenic seedlings were subjected to 150 mM mannitol treatment as a drought mimic. GUS staining of the root samples at different time points indicated a significant increase in GUS signals after 3 h of mannitol exposure (Figure 5F), consistent with the expression heatmap and qRT-PCR data (Figure 4A,B). This confirms that drought stress induces the upregulation of OsTHION15. Subcellular localization using p35S::OsTHION15::GFP in Nicotiana benthamiana and rice protoplasts showed colocalization with the plasma membrane marker FM4-64 (Figure 5G,H), indicating that OsTHION15 is localized to the plasma membrane. These findings suggest that OsTHION15 functions in stress signaling and reproductive development, potentially through membrane-associated mechanisms (Figure 5G,H).

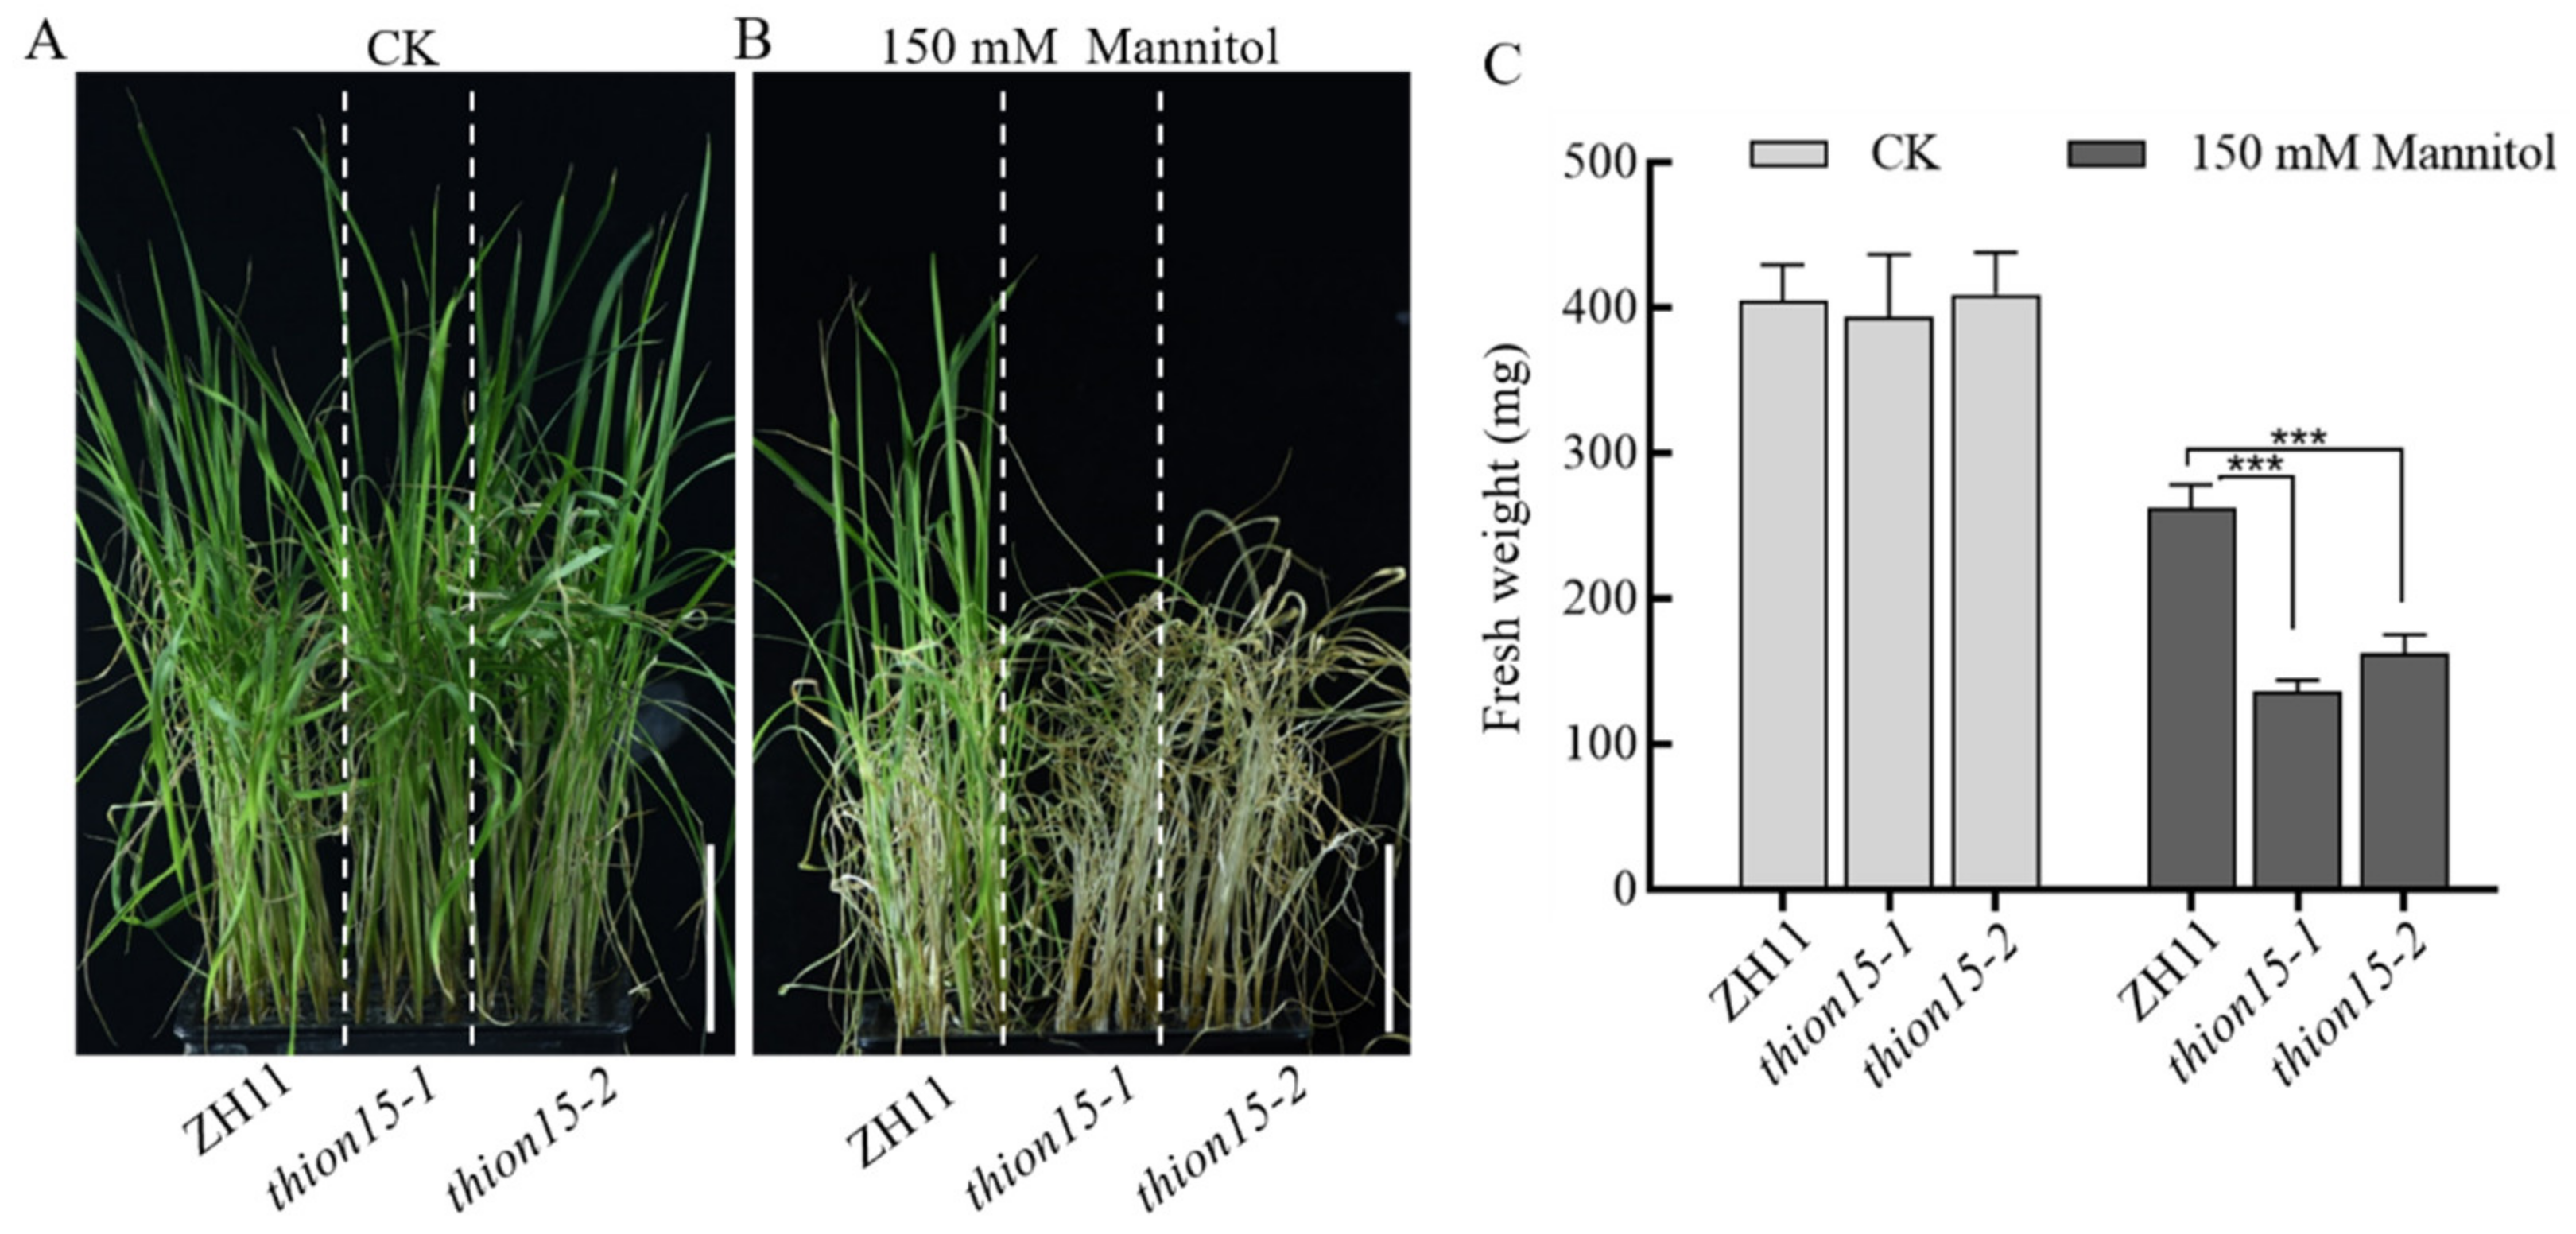
2.6. The Osthion15 Mutant Exhibits Increased Sensitivity to Drought Stress

To elucidate the role of OsTHION15 in drought stress response, we generated two homozygous Osthion15 mutant lines, i.e., Osthion15-1 and Osthion15-2, using gene editing technology. Osthion15-1 carries a two-base (TT) deletion, while Osthion15-2 has a single T-base deletion, both resulting in premature termination of protein translation (Figure S3). Two-week-old seedlings of the wild-type ZH11 and Osthion15 mutants, grown in complete rice nutrient solution, were subjected to 150 mM mannitol treatment to simulate drought stress. Under normal conditions, the Osthion15 mutants exhibited comparable seedling height and leaf color to ZH11 (Figure 6A). However, after 10 days of mannitol treatment, the Osthion15 mutants displayed more severe wilting and higher mortality than ZH11 (Figure 6B). Fresh weight measurements further confirmed their increased drought sensitivity, with Osthion15-1 and Osthion15-2 showing significantly lower fresh weights (132 g and 162 g, respectively) compared to ZH11 (262 g) (Figure 6C). These results demonstrate that Osthion15 mutants are more sensitive to drought stress, indicating that OsTHION15 is critical in enhancing drought tolerance in rice.

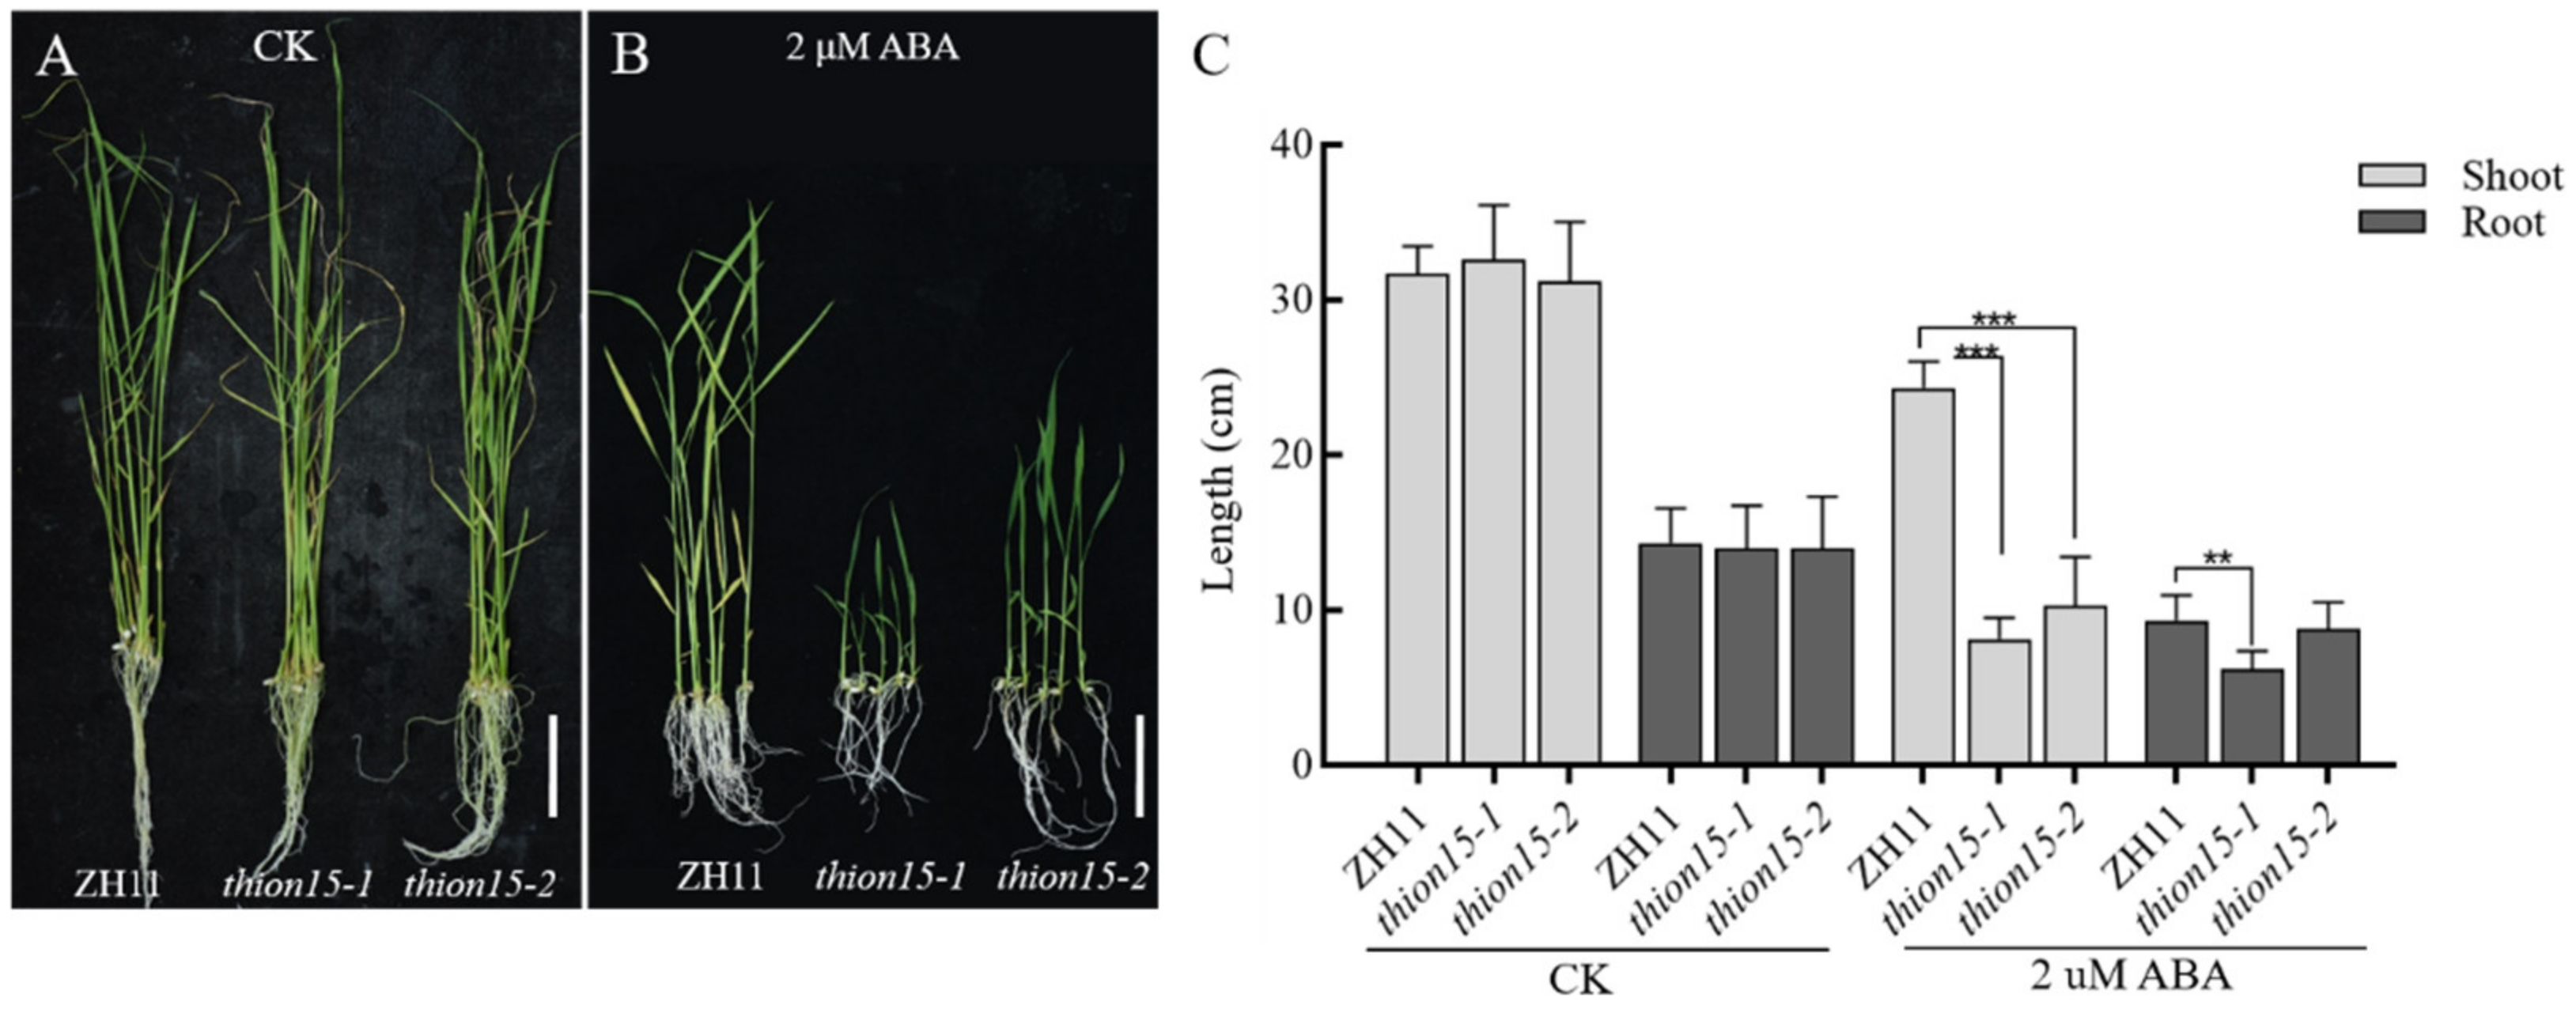
2.7. The Osthion15 Mutant Exhibits Increased Sensitivity to ABA Stress

The drought stress response in plants is closely associated with the abscisic acid (ABA) signaling pathway [38]. Notably, the OsTHION15 promoter contains ABA-responsive cis-acting elements, such as ABREs, suggesting a potential role in ABA signaling. To explore this further, we examined the response of the Osthion15 mutants to ABA stress. Seeds of ZH11 and the Osthion15 mutants were germinated on standard 1/2 MS medium and 1/2 MS medium supplemented with 2 μM ABA. After 20 days, phenotypic observations and statistical analyses were conducted. Under normal conditions, the Osthion15 mutants exhibited growth comparable to ZH11 (Figure 7A). However, under ABA stress, the Osthion15 mutants exhibited significantly stunted growth compared to ZH11 (Figure 7B). Statistical analysis confirmed that the Osthion15 mutants displayed pronounced growth defects under ABA stress, with Osthion15-1 showing a more severe phenotype, likely due to premature protein truncation (Figure S3; Figure 7C). These findings indicate that the loss of OsTHION15 function enhances ABA sensitivity, highlighting the involvement of OsTHION15 in the ABA-mediated stress response pathway.

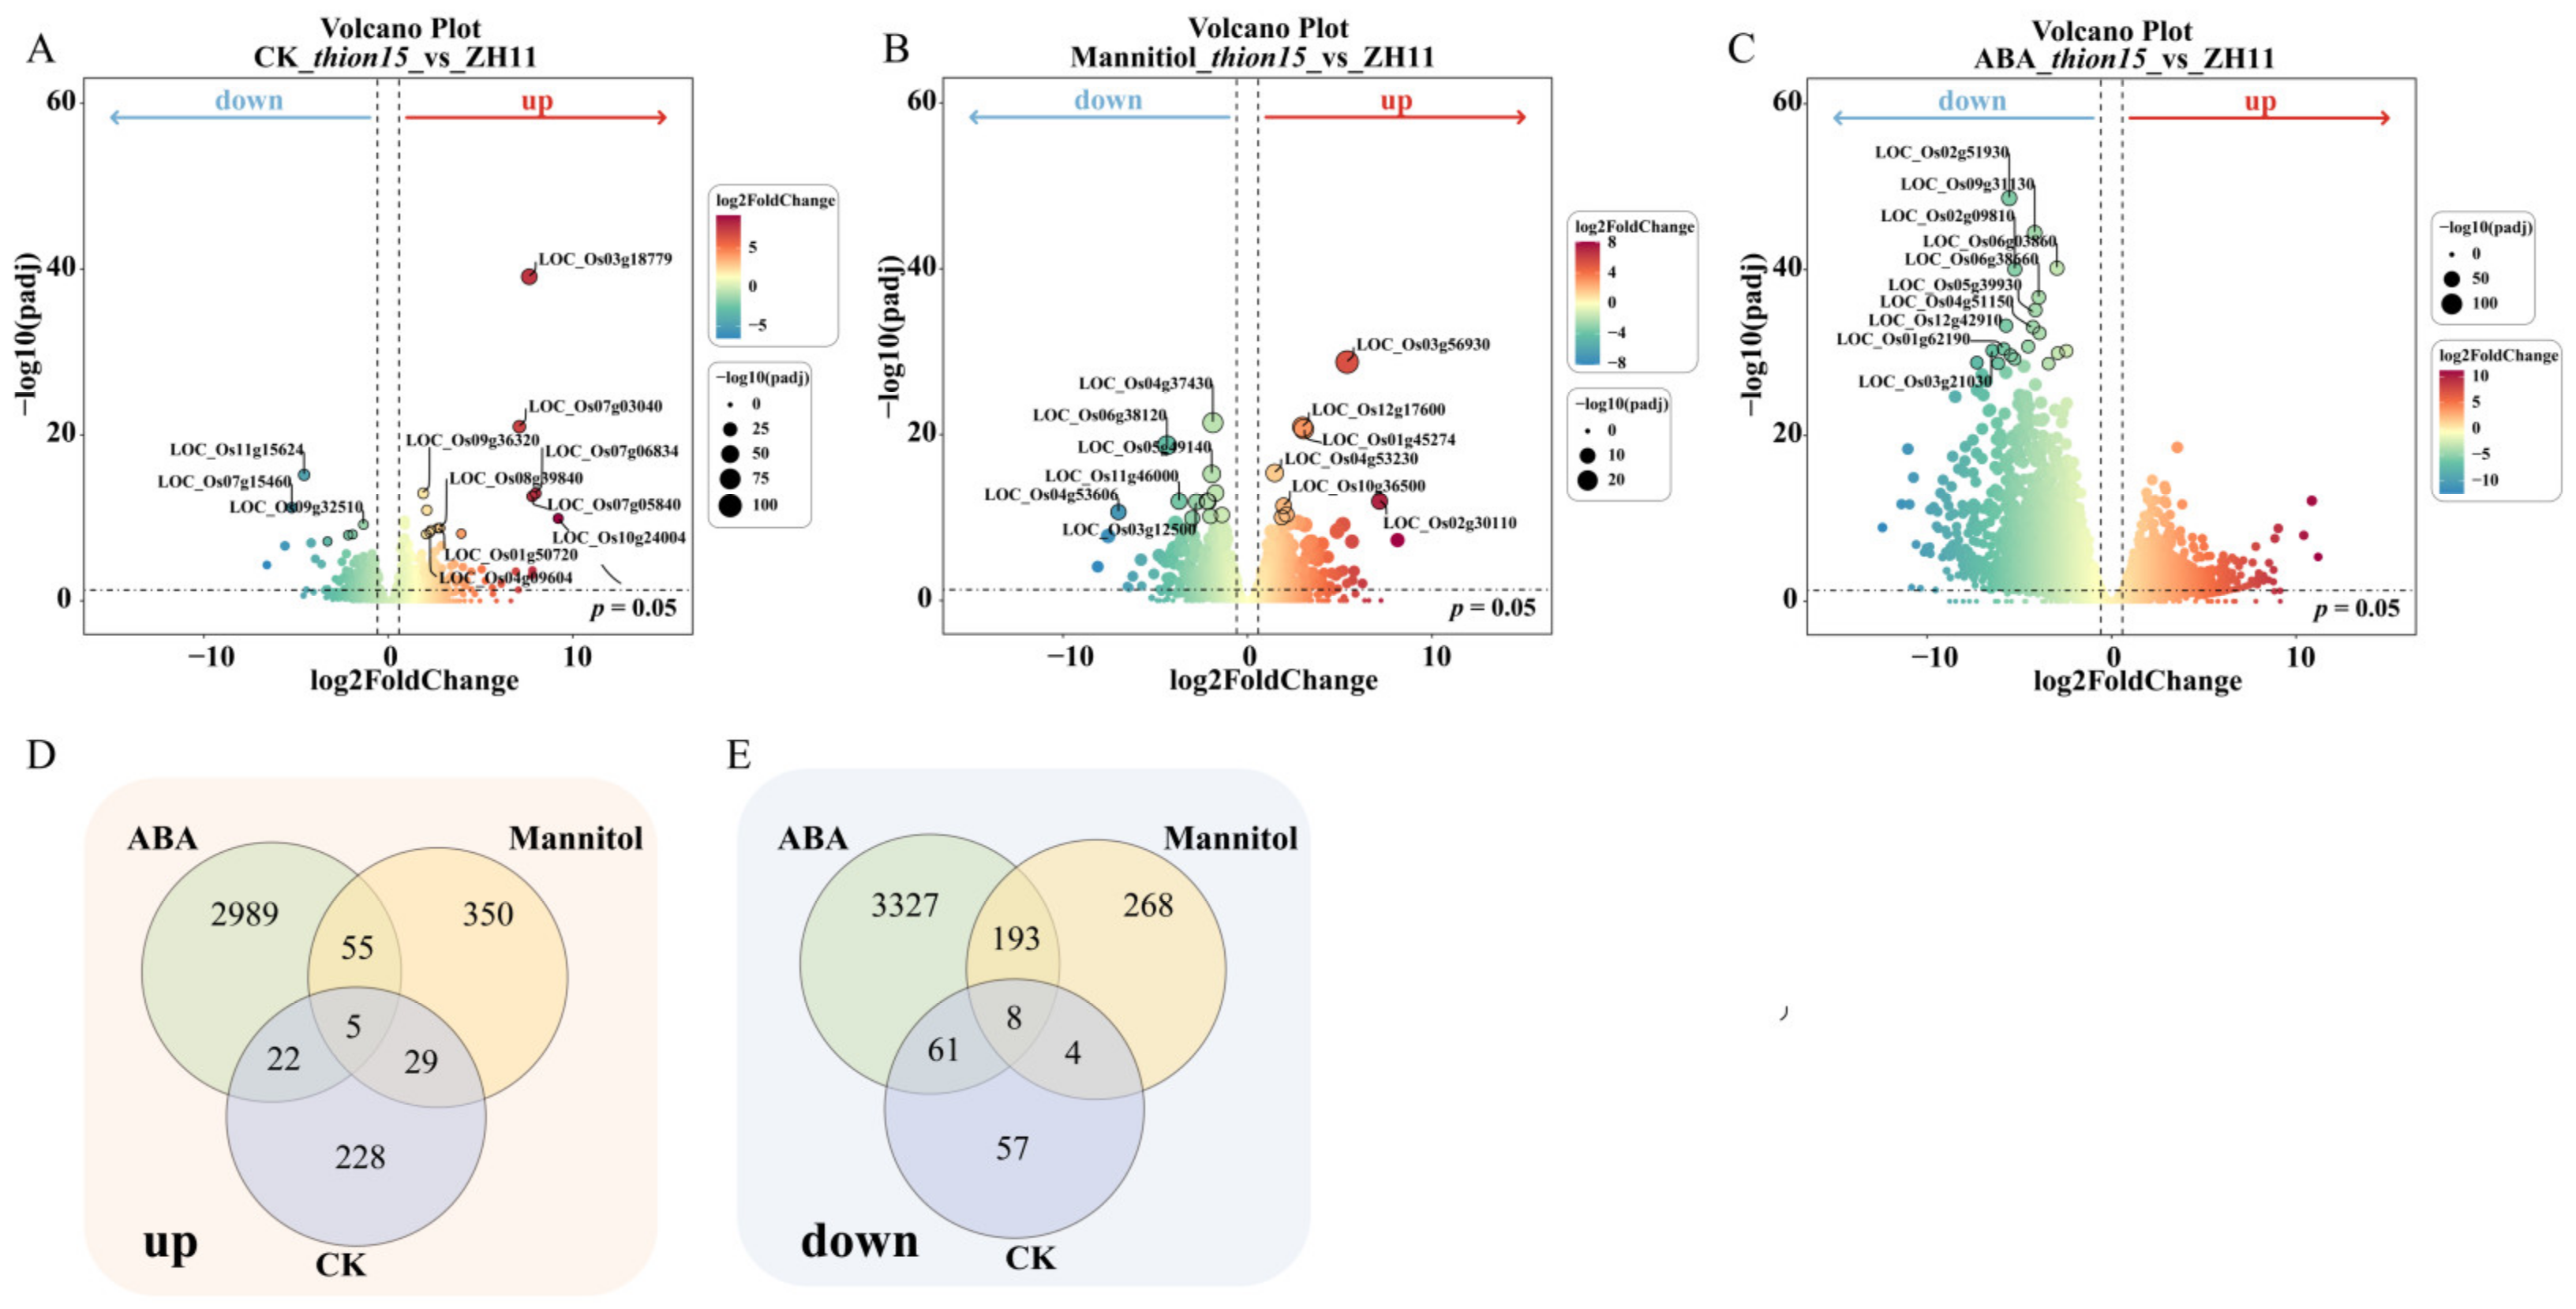
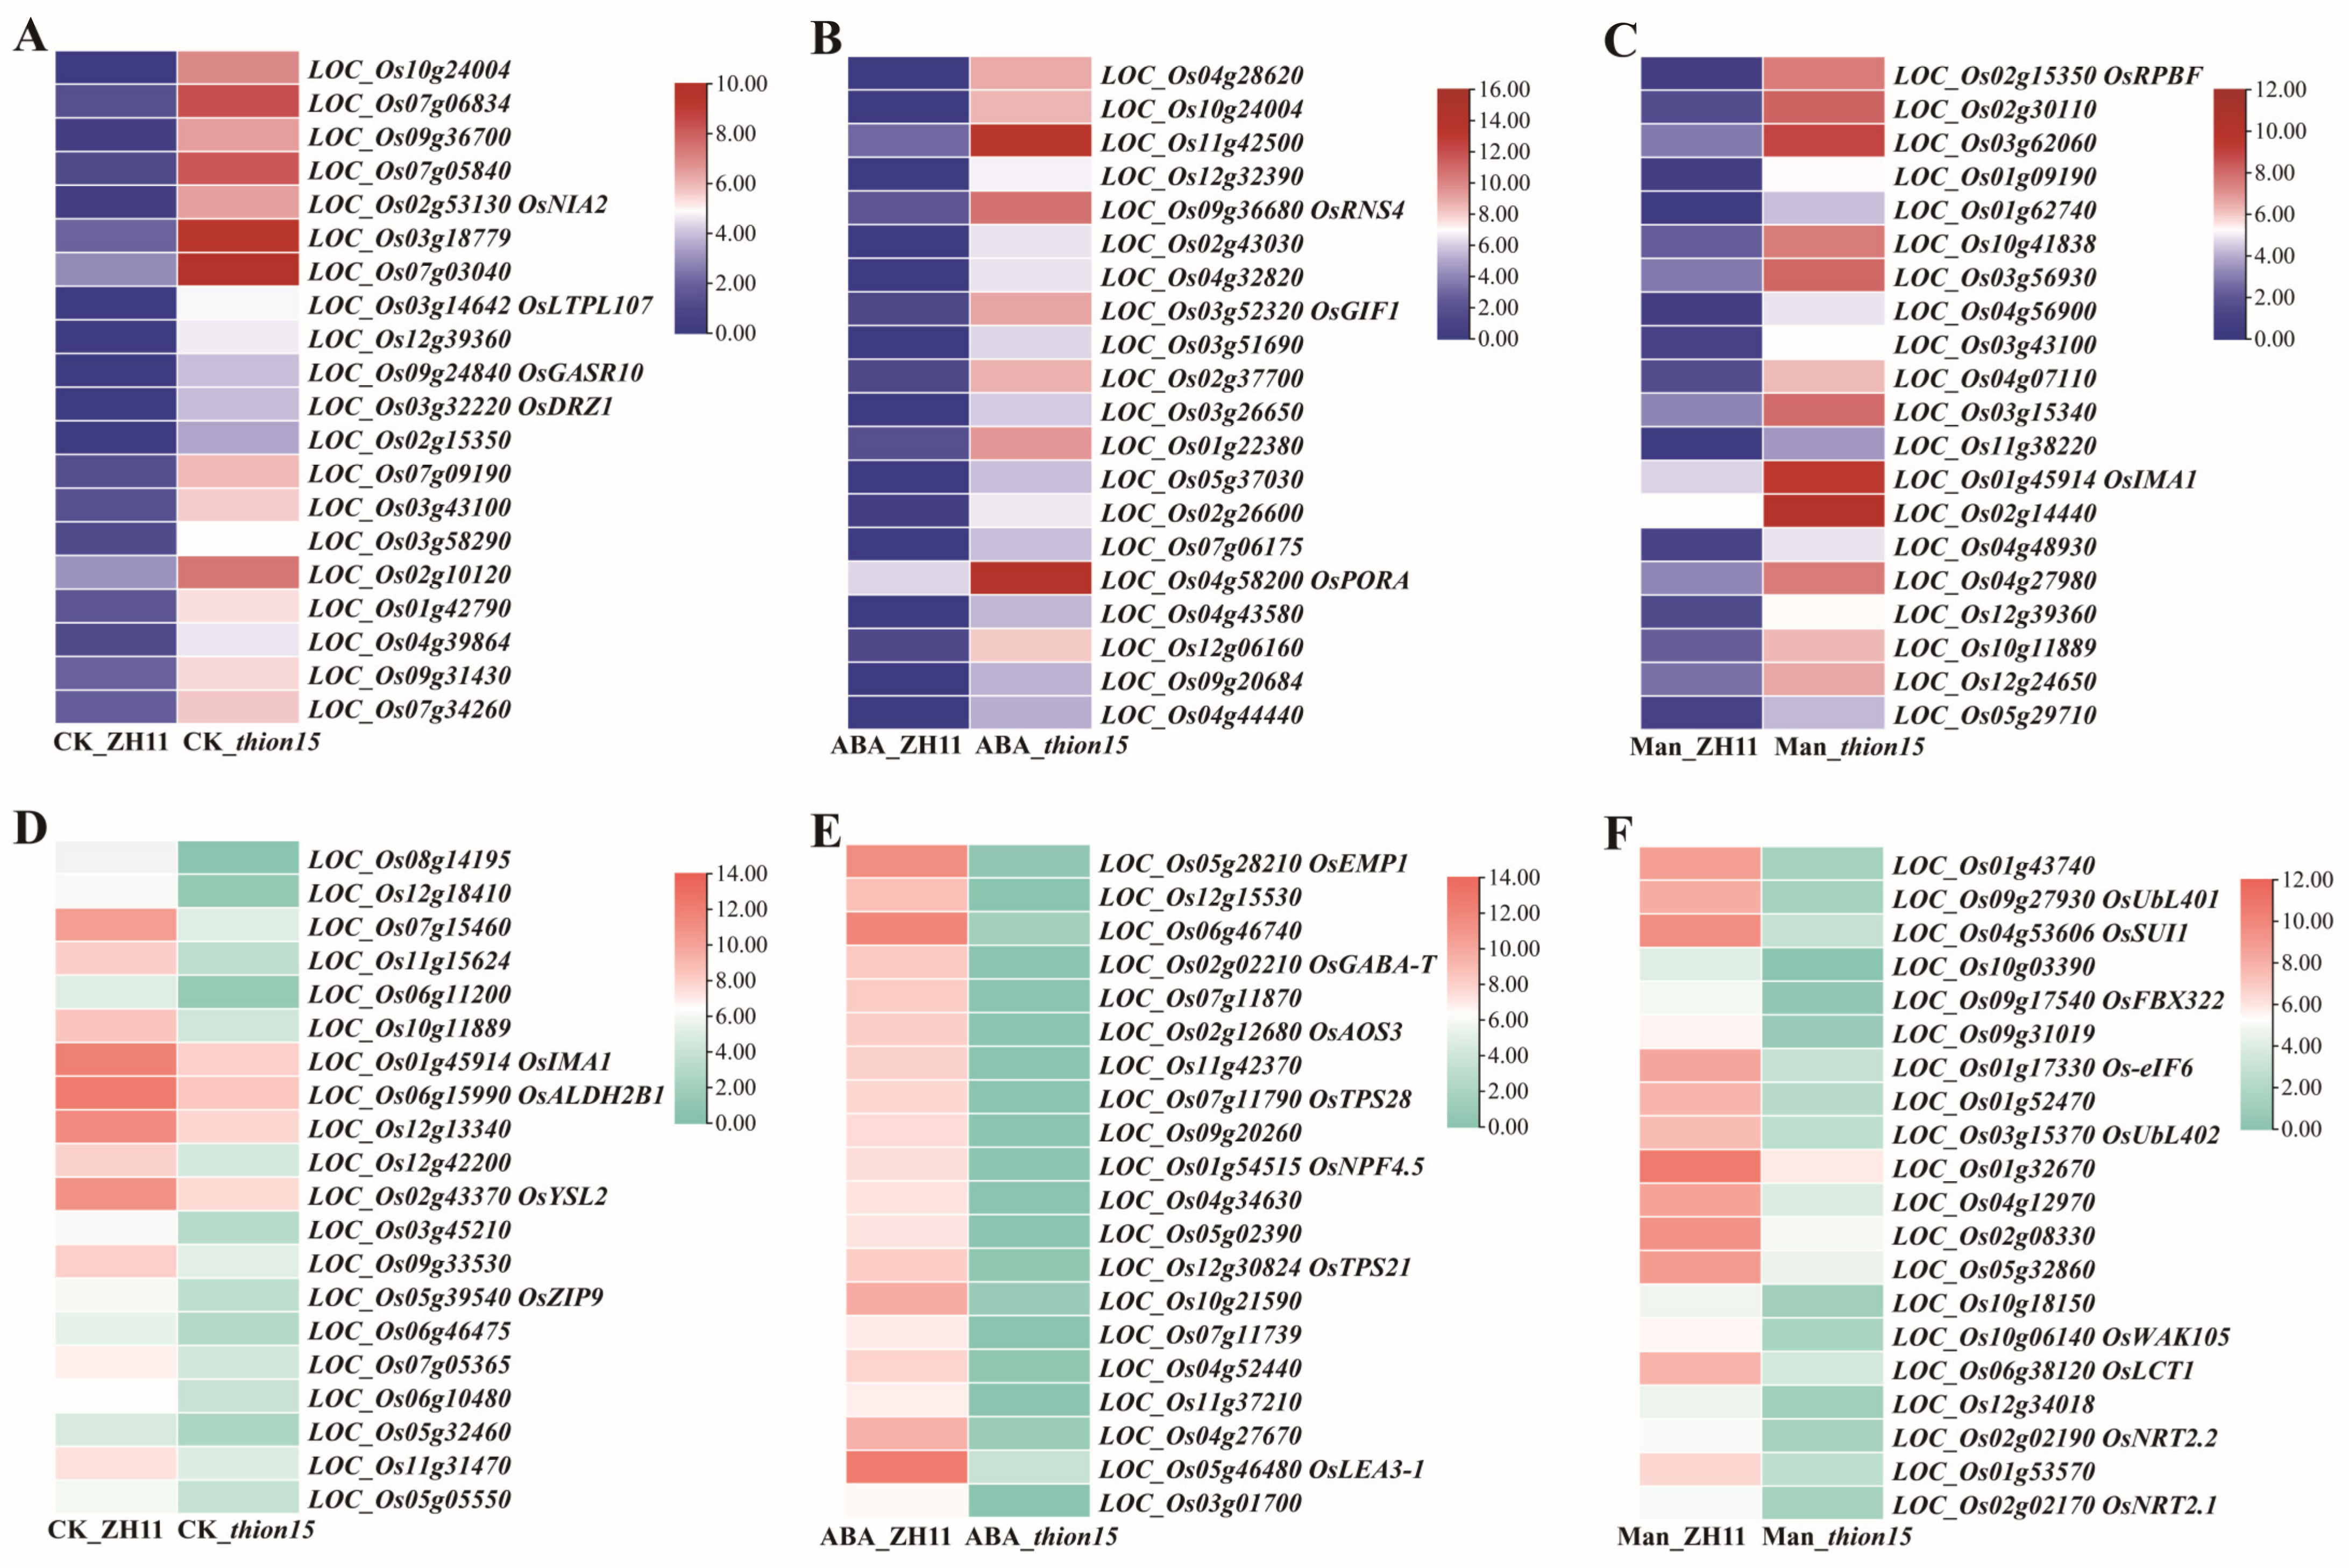
2.8. Differential Gene Expression Analysis of Osthion15 and ZH11 Under Drought and ABA Stress

To investigate the molecular mechanisms underlying OsTHION15 in drought and ABA stress responses, RNA sequencing was performed on ZH11 and Osthion15 seedlings under three conditions: normal growth (CK), mannitol-induced drought stress, and ABA treatment. Differentially expressed genes (DEGs) were identified using a fold change threshold of >2. Under CK conditions, Osthion15 exhibited 414 DEGs compared to ZH11, with 284 upregulated and 130 downregulated genes (Figure 8A, Table S6). Under mannitol treatment, Osthion15 showed 912 DEGs relative to ZH11, including 439 upregulated and 473 downregulated genes (Figure 8B, Table S6). ABA treatment induced the most significant transcriptional changes, with 6660 DEGs in Osthion15 compared to ZH11, comprising 3071 upregulated and 3589 downregulated genes (Figure 8C, Table S6). Notably, Osthion15 shared 60 upregulated and 201 downregulated genes under drought and ABA stress compared to ZH11 (Figure 8D,E, Table S6). Additionally, five upregulated and eight downregulated genes were consistently differentially expressed across the CK, drought, and ABA stress conditions (Figure 8D,E). These findings suggest that OsTHION15 plays a central role in integrating drought and ABA stress responses at the transcriptional level.
To further explore the functional implications of these DEGs, Gene Ontology (GO) and Kyoto Encyclopedia of Genes and Genomes (KEGG) pathway analyses were conducted. Under CK conditions, no significant KEGG pathway enrichment was observed between Osthion15 and ZH11. However, following ABA treatment, the DEGs were significantly enriched in pathways related to ribosomes, PPAR signaling, porphyrin metabolism, plant hormone signal transduction, MAPK signaling, and fatty acid degradation (Figure S4). Under drought stress, the DEGs were predominantly associated with biological processes, such as response to toxic substances, monovalent and inorganic ion transmembrane transport, and cellular-modified amino acid metabolism. The key enriched pathways included photosynthesis, nitrogen metabolism, and glyoxylate and dicarboxylate metabolism (Figure S4). These results highlight the distinct molecular pathways influenced by OsTHION15 in response to drought and ABA stress, further supporting its regulatory role in stress adaptation.

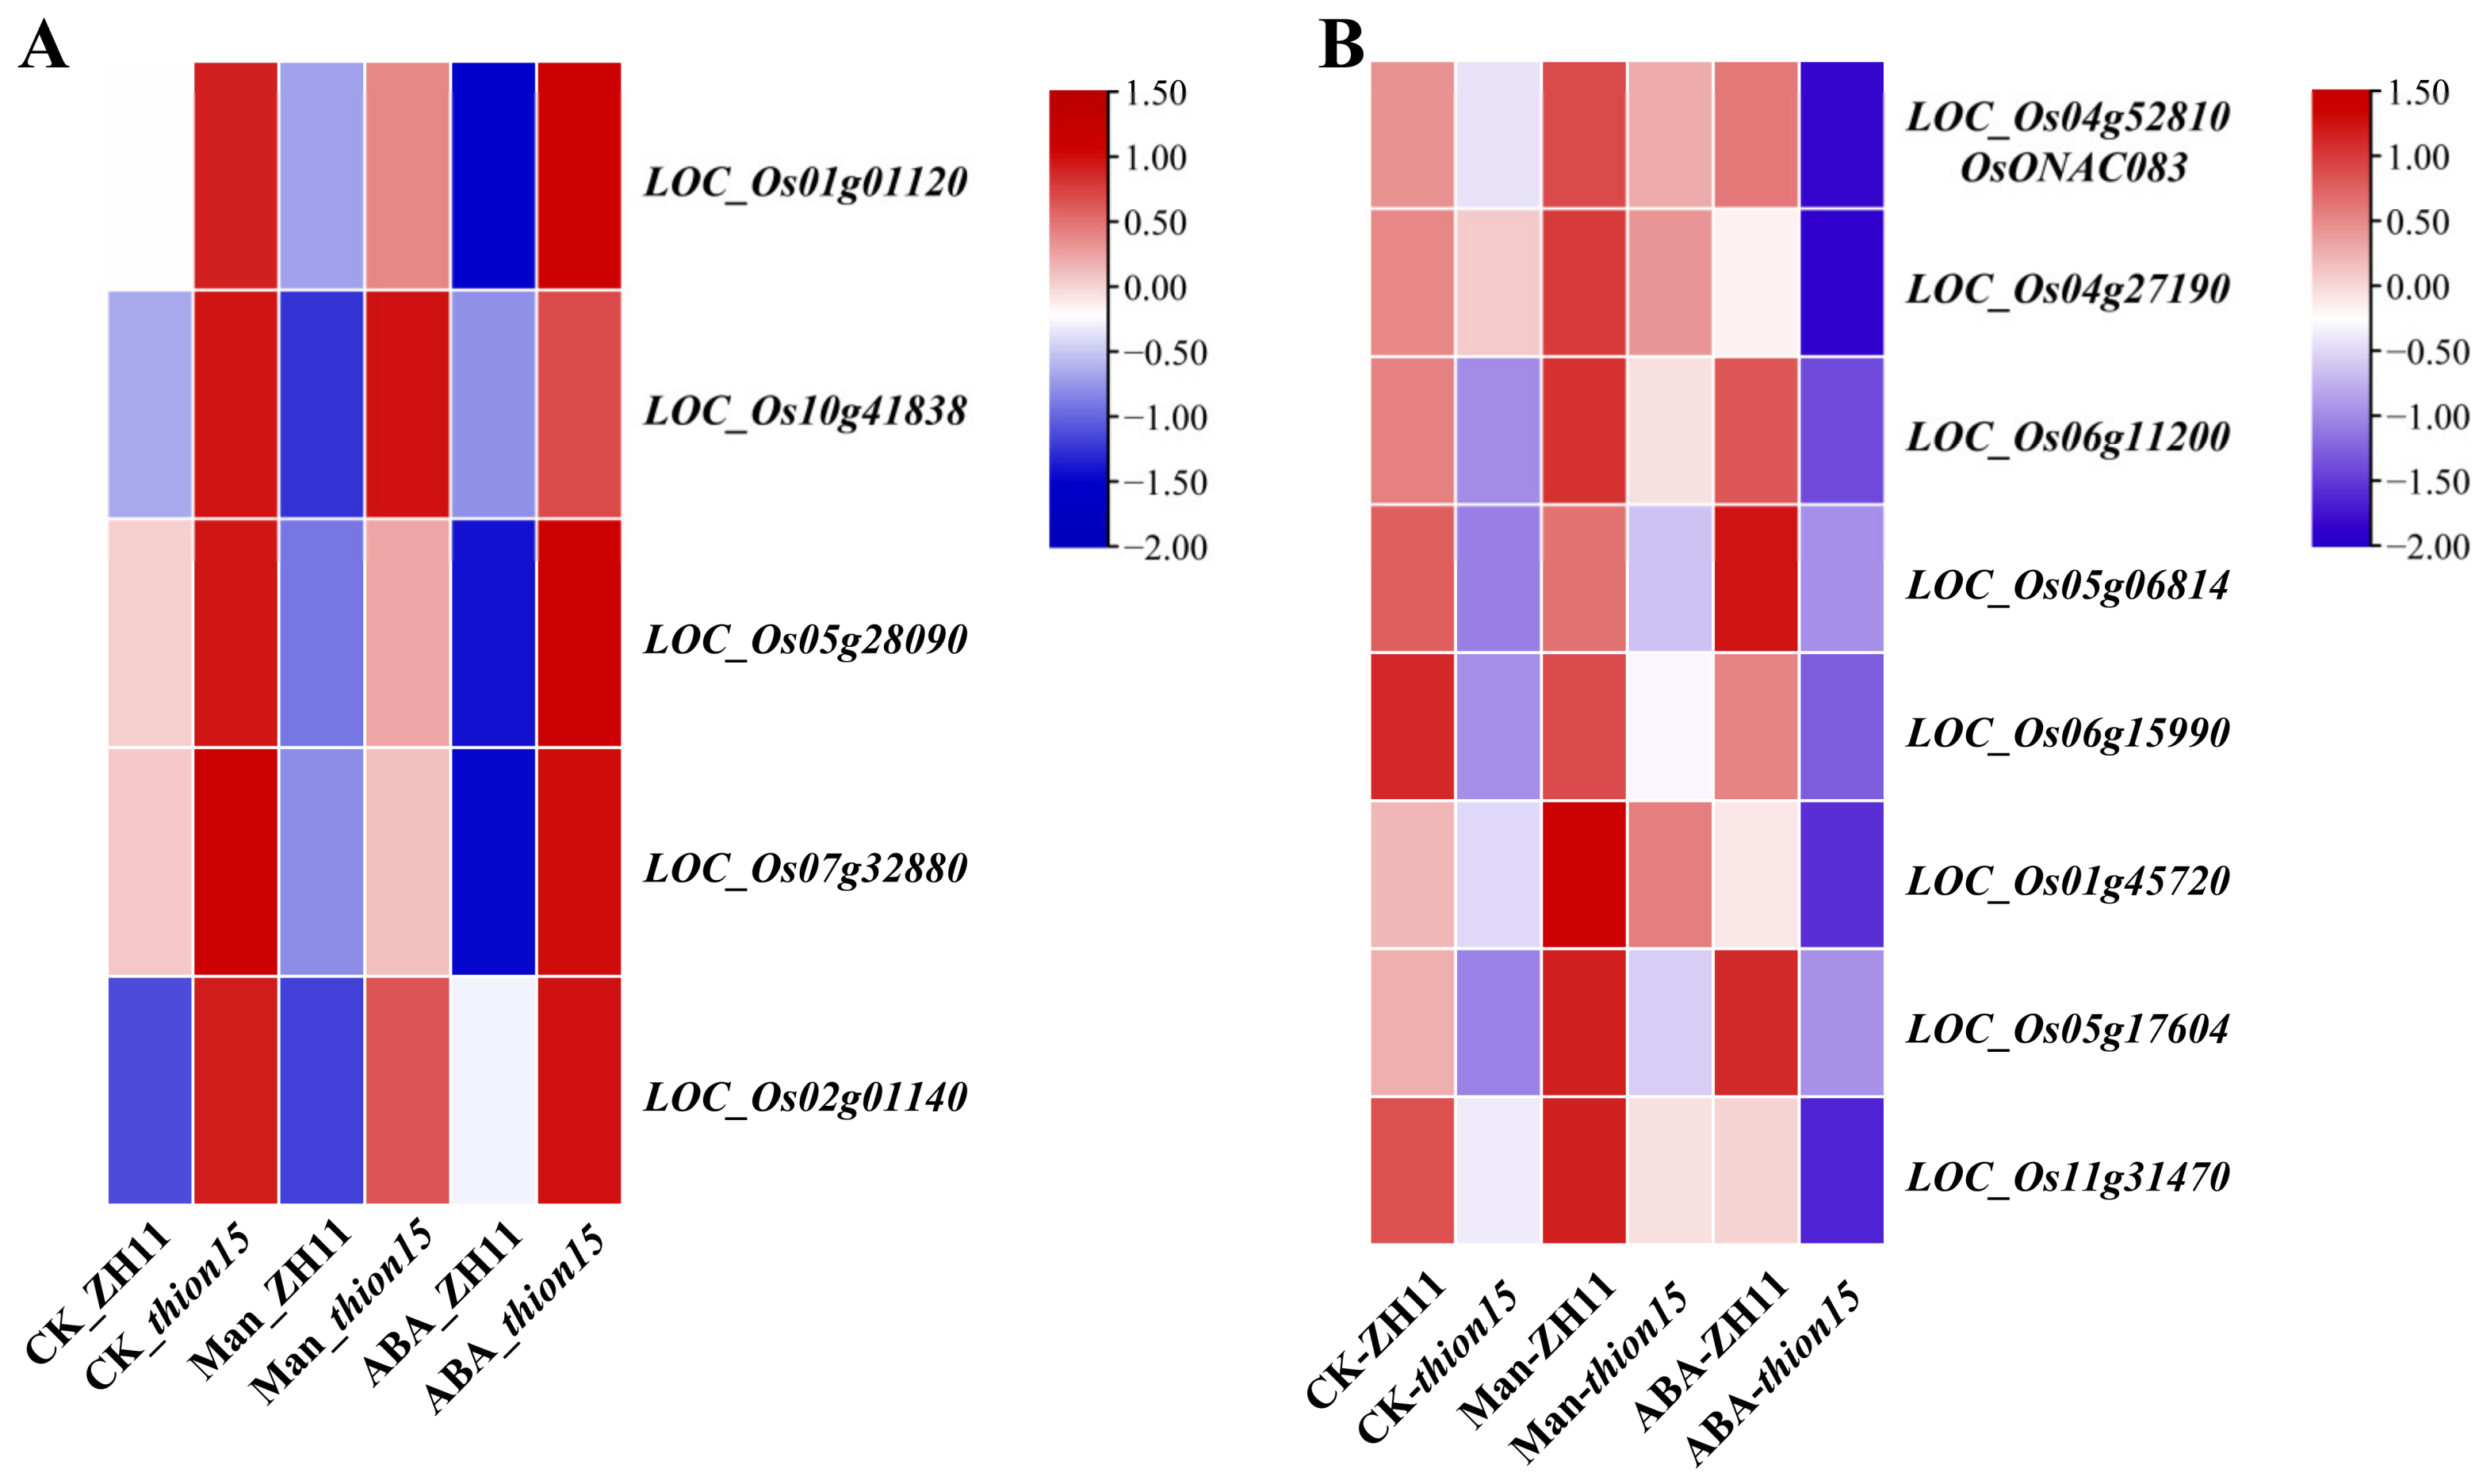
2.9. Expression Profiles of Differentially Expressed Genes

To explore the role of OsTHION15 in rice drought and ABA responses, we analyzed and annotated differentially expressed genes (DEGs) in the Osthion15 mutant compared to ZH11 under control (CK), drought, and ABA stress conditions. An expression heatmap based on FPKM values revealed distinct transcriptional changes. Five genes, LOC_Os01g01120 (OsEP1), LOC_Os10g41838 (OsFIP), LOC_Os05g28090, LOC_Os07g32880, and LOC_Os02g01140 (OsGDSL), were consistently upregulated in the Osthion15 mutant (Figure 9A, Table S7). Conversely, eight genes, LOC_Os04g52810 (OsONAC083), LOC_Os04g27190 (OsTPS19), LOC_Os06g11200, LOC_Os05g06814, LOC_Os06g15990 (OsALDH2B1), LOC_Os01g45720, LOC_Os05g17604 (SHR5-RLK), and LOC_Os11g31470, were consistently downregulated (Figure 9B, Table S7).
Further analysis focused on the 20 most significantly upregulated and downregulated genes in Osthion15 under the three conditions. Among the upregulated genes, several were associated with ABA and drought responses. Under normal conditions, LOC_Os02g53130 (OsNLA2) and LOC_Os03g32220 (OsDRZ1) were identified as ABA- and drought-related genes. Under ABA stress, gibberellin-related genes LOC_Os09g24840 (OsGASR10) and LOC_Os03g14642 (OsLTPL107), as well as ABA-responsive genes, such as LOC_Os09g36680 (OsRNS4), and LOC_Os03g52320 (OsGIF1), were upregulated. Additionally, the chlorophyll synthesis-related gene LOC_Os04g58200 (OsPORA) exhibited increased expression. Under drought stress, transcription-activating factor LOC_Os02g15350 (OsRPBF) and iron transport-related peptide LOC_Os01g45914 (OsIMA1) were among the significantly upregulated genes (Figure 10A–C, Table S8).
Among the downregulated genes, those under normal conditions included metal transport-related genes (LOC_Os12g18410, LOC_Os01g45914 (OsIMA1), LOC_Os02g43370 (OsYSL2), and LOC_Os05g39540 (OsZIP9)) and plant immune-related genes (LOC_Os07g15460 (OsNRAMP1) and LOC_Os06g15990 (OsALDH2B1)). Under ABA stress, the downregulated genes were primarily involved in ABA and drought responses, such as LOC_Os05g28210 (OsEMP1), LOC_Os02g02210 (OsGABA-T), and LOC_Os05g46480 (OsLEA3-1), as well as pest-related genes LOC_Os07g11790 (OsTPS28) and LOC_Os12g30824 (OsTPS21). Under drought stress, ubiquitination-related genes (LOC_Os09g27930 (OsUbL402), LOC_Os09g31019 (ubiquitin fusion protein), and LOC_Os03g15370 (OsUbL402)), as well as drought-responsive gene LOC_Os04g53606 (OsSUI1), cell wall-associated receptor kinase LOC_Os10g06140 (OsWAK105), and nitrate transporters LOC_Os02g02170 (OsNRT2.1) and LOC_Os02g02190 (OsNRT2.2), were significantly downregulated (Figure 10D–F, Table S8). These findings highlight the complexity and multifaceted nature of the molecular mechanisms underlying the sensitivity of Osthion15 to drought and ABA stress. The differential expression of genes involved in diverse physiological processes indicates that OsTHION15, a small peptide, likely regulates rice stress responses through multiple pathways.

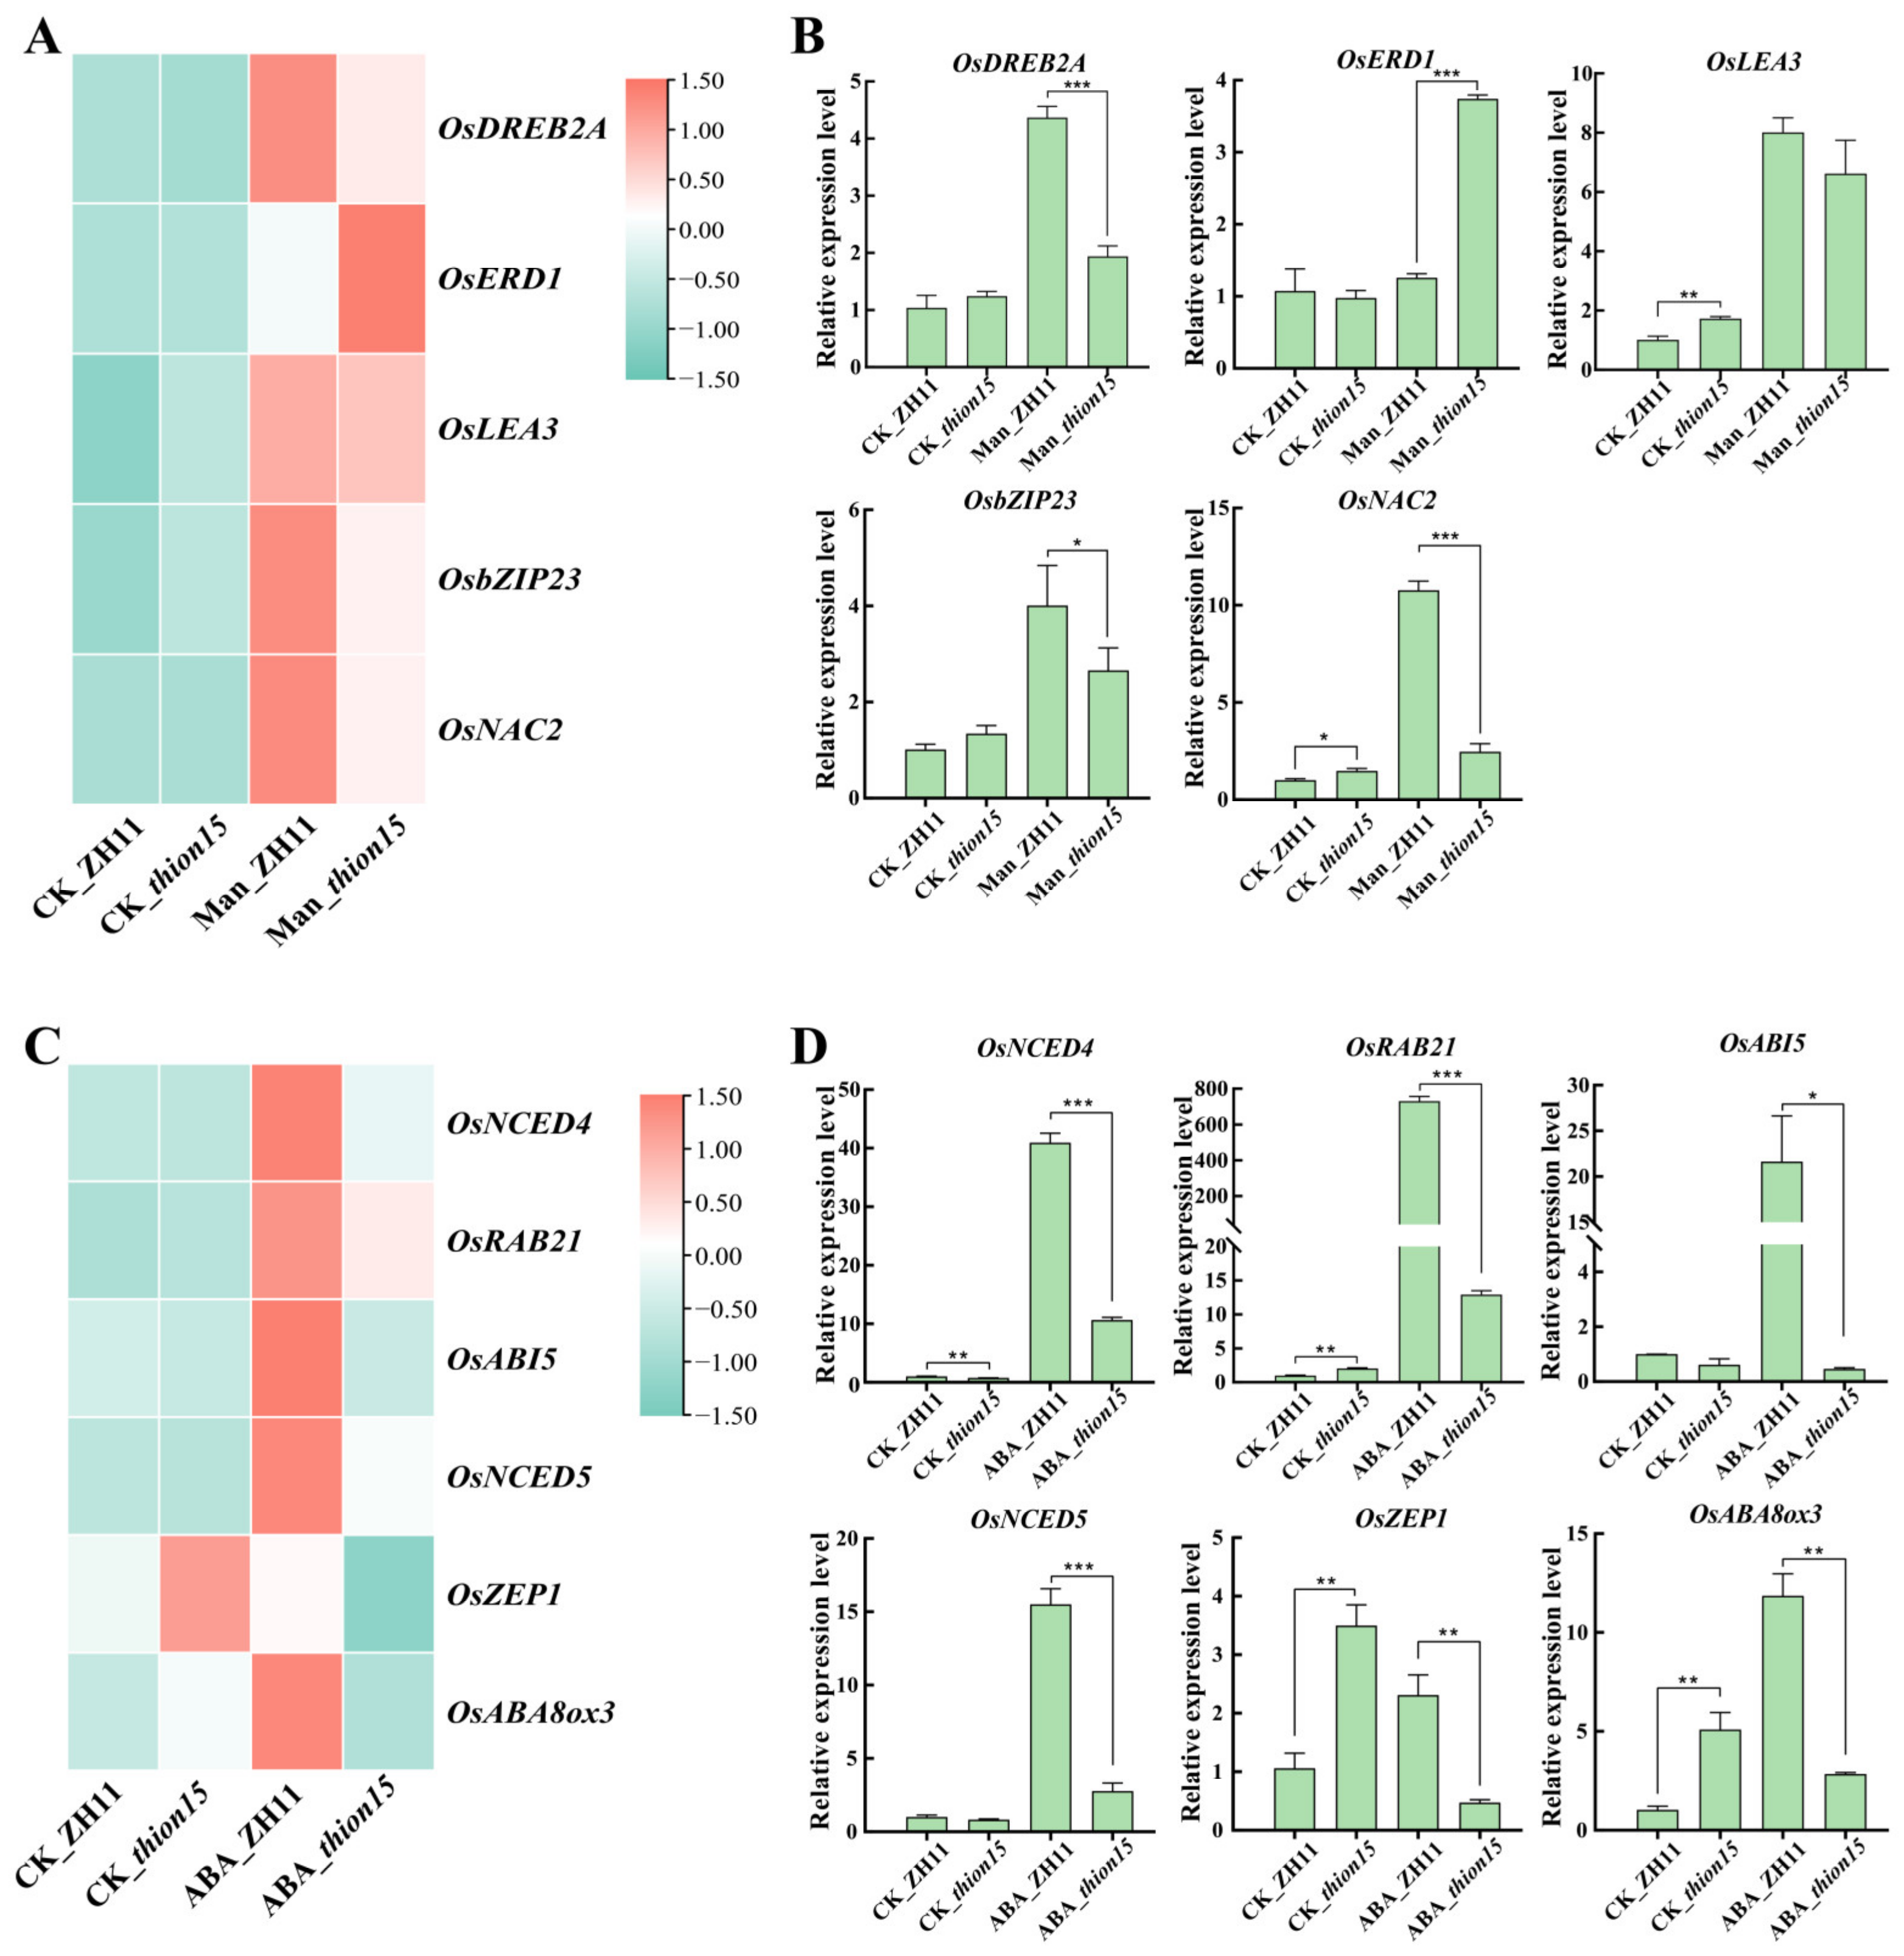
2.10. Expression Profiles of Stress-Responsive Genes

To further investigate the mechanisms underlying the heightened sensitivity of the Osthion15 mutant to drought and ABA stress, we analyzed the expression profiles of stress-responsive genes. Under drought stress, five drought-responsive genes were significantly upregulated in the wild-type ZH11, whereas the Osthion15 mutant exhibited distinct expression patterns. Notably, three key transcription factors, i.e., OsDREB2A, OsBZIP23, and OsNAC2, showed significantly lower expression in the Osthion15 mutant compared to ZH11 (Figure 11A). qRT-PCR validation confirmed these findings, demonstrating that the Osthion15 mutant exhibited reduced upregulation of OsDREB2A, OsBZIP23, and OsNAC2 under drought stress (Figure 11B). These results suggest that the diminished activation of these transcription factors in the Osthion15 mutant contributes to its increased sensitivity to drought conditions. Under ABA stress, six ABA-responsive genes were significantly upregulated in ZH11 (Figure 11C). However, in the Osthion15 mutant, OsNCED4, OsRAB21, and OsNCED5 were expressed at significantly higher levels than in ZH11, whereas OsABI, OsZEP1, and OsABA8ox3 were downregulated (Figure 11C). qRT-PCR analysis further confirmed these differential responses, revealing significant variations in the expression of these six genes between the Osthion15 mutant and ZH11 under ABA stress (Figure 11D). These findings indicate that while the Osthion15 mutant exhibits an enhanced response to ABA stress for OsNCED4, OsRAB21, and OsNCED5, it shows a diminished or impaired lost response for OsABI, OsZEP1, and OsABA8ox3. Overall, these results demonstrate that OsTHION15, as a small peptide, plays a critical role in modulating gene expression under stress conditions. Its absence in the Osthion15 mutant disrupts the regulation of key stress-responsive genes, leading to altered responses to drought and ABA stress. These results highlight the multifaceted role of OsTHION15 in coordinating plant stress adaptation.

3. Discussion

The OsTHION gene family, characterized by cysteine-rich signal peptides, plays a pivotal role in plant stress responses, particularly in disease resistance and immunity. This study provides a comprehensive analysis of the OsTHION family in rice, focusing on its evolutionary relationships, expression patterns, and functional roles under various stress conditions. Our findings reveal that OsTHION genes are induced not only by abiotic stress adaptation, such as drought, salt, and cold stress, but also by biotic stress responses. The importance of OsTHIONs in enhancing plant resilience to environmental challenges aligns with previous studies that highlight the multifunctional roles of cysteine-rich peptides in stress adaptation [39].
Consistent with previous results, our phylogenetic analysis classified 44 OsTHION family members into 4 distinct groups (Figure 1) [40]. Subgroups III and IV contained more members, and a greater number of their genes were induced by stress (Figure 4A), suggesting their significant involvement in plant adaptability. The evolutionary divergence between OsTHIONs and their Arabidopsis counterparts (AtTHIONs) suggests that the THION family has undergone significant functional differentiation between monocot and dicot (Figure S1). This divergence likely reflects the adaptation of OsTHIONs to specific environmental and developmental challenges faced by rice, a staple crop often exposed to fluctuating stress conditions. The lack of collinearity between OsTHIONs and AtTHIONs further supports the hypothesis that these genes have evolved distinct regulatory and functional roles in different plant lineages (Figure S2), consistent with findings in other plant gene families [41]. The promoter regions of OsTHION genes are enriched with cis-acting elements associated with light response, hormone signaling, and stress responses (Figure 2). Notably, the abundance of ABRE (abscisic-acid-responsive elements) and CGTCA (jasmonic-acid-responsive elements) highlights the involvement of OsTHIONs in hormone-mediated stress signaling pathways. This aligns with the observed upregulation of several OsTHION genes under ABA and drought stress, suggesting that these genes play integral roles in the ABA-dependent stress response mechanism in rice [42]. The presence of G-box elements, which regulate light-induced gene expression, further indicates that OsTHIONs integrate environmental signals to fine-tune stress responses, a mechanism also observed in other stress-responsive gene families [43].
The comprehensive analysis of OsTHION gene expression patterns across various tissues and stress conditions provides valuable insights into their functional roles in rice growth, development, and stress adaptation. Tissue-specific and stage-specific expression profiles of OsTHION genes, as revealed through the heatmap and qRT-PCR analyses (Figure 3A–D), suggest that these genes participate in diverse biological processes. The significant upregulation of OsTHION15 under drought, salt, and cold stress (Figure 4A,B) and its plasma membrane localization (Figure 5G,H) suggest that it may function in stress signal perception or transduction. Additionally, the enhanced GUS signals in the pOsTHION15::GUS transgenic plants under drought stress (Figure 5F) further confirm its responsiveness to stress conditions. Its expression in reproductive tissues, particularly in the stigma and style at the FM stage (Figure 5D,E), suggests its involvement in reproductive processes, potentially regulating stamen–pistil interactions and fertilization.
The functional characterization of OsTHION15 through Osthion15 mutant analysis provides compelling evidence for its critical role in drought stress tolerance and ABA signaling in rice. The Osthion15 mutants exhibited heightened sensitivity to drought stress, as evidenced by increased wilting, mortality, and reduced fresh weight under mannitol treatment (Figure 6B,C). These findings align with previous studies demonstrating that cysteine-rich peptides play essential roles in plant stress responses by modulating cellular signaling and stress adaptation mechanisms [44,45]. The severe drought sensitivity of the Osthion15 mutants underscores the importance of OsTHION15 in maintaining cellular homeostasis and stress resilience under water-deficient conditions. The involvement of OsTHION15 in the ABA signaling pathway further highlights its multifaceted role in stress adaptation. The presence of ABA-responsive cis-acting elements, such as ABREs, in the promoter region of OsTHION15 (Figure S3) suggests that its expression is regulated by ABA, a key hormone mediating plant responses to drought and other abiotic stresses [46,47]. The pronounced growth defects observed in the Osthion15 mutants under ABA stress indicate that OsTHION15 is integral to ABA-mediated stress responses (Figure 7B,C).
The DEG analysis of Osthion15 and ZH11 under drought and ABA stress provides critical insights into the molecular mechanisms regulated by OsTHION15 in rice. The significant upregulation of OsTHION15 under drought, salt, and cold stress (Figure 4) highlights its central role in abiotic stress adaptation. The RNA sequencing data reveal distinct transcriptional responses in the Osthion15 mutants compared to ZH11, with 414 DEGs under normal conditions, 912 DEGs under drought stress, and 6660 DEGs under ABA stress (Figure 8A–C, Table S6). These findings emphasize the extensive regulatory influence of OsTHION15, particularly under stress conditions. The GO and KEGG pathway analyses further elucidated the functional implications of these DEGs. Under ABA stress, pathways such as ribosome biogenesis, PPAR signaling, and plant hormone signal transduction were significantly enriched (Figure S4). Similarly, under drought stress, pathways related to photosynthesis, nitrogen metabolism, and glyoxylate and dicarboxylate metabolism were enriched (Figure S4). These results suggest that OsTHION15 regulates stress responses by modulating key metabolic and signaling pathways.
The expression profiles of specific DEGs provide further evidence for the role of OsTHION15 in stress adaptation. NAC transcription factors, known for their role in stress responses, were notably affected in the Osthion15 mutants. For instance, overexpression of the NAC gene OsNAC6/SNAC2 in rice has significantly enhanced tolerance to multiple abiotic stresses, including drought, high salinity, and cold, particularly during the seedling developmental stage [48,49]. ONAC083 (LOC_Os04g52810) was downregulated under the control, drought, and ABA conditions in the Osthion15 mutants compared to ZH11 (Figure 9B, Table S7). These findings suggest that OsTHION15 may modulate the stress response through NAC transcription factors.
Compared to the wild-type ZH11, the Osthion15 mutants exhibited significantly lower expression levels of key drought stress response genes (OsDREB2A, OsBZIP23, and OsNAC2) after drought stress (Figure 11A,B). Previous studies have shown that overexpression of these genes enhances drought tolerance in rice [50,51,52], suggesting that the reduced expression of these genes in Osthion15 mutants contributes to impaired drought resistance. Under ABA treatment ABA-stress-responsive genes (OsNCED4, OsNCED5, OsRAB21, and OsABI5) were significantly upregulated in ZH11, but exhibited lower expression levels in the Osthion15 mutants. As NCED genes encode key enzymes in ABA biosynthesis, their dysregulation in the Osthion15 mutants suggests a disruption in ABA homeostasis, ultimately affecting plant stress responses [53]. This suggests that OsTHION15 may influence ABA levels by regulating the expression of OsNCED4 and OsNCED5, thereby participating in the plant stress response. OsABI5, a key transcription factor in the ABA signaling pathway [54], was downregulated in the Osthion15 mutants, likely contributing to their increased sensitivity to ABA stress. Surprisingly, ABA-induced genes (OsZEP1 and OsABA8ox3) were also significantly downregulated in the Osthion15 mutants under ABA stress, further indicating that OsTHION15 is essential for proper ABA-mediated stress adaptation. These results suggest that OsTHION15 may regulate gene expression through multiple complex pathways, thereby playing a critical role in modulating plant stress responses (Figure 12). In conclusion, this study demonstrates that OsTHION15 is a critical regulator of the drought response and ABA signaling in rice. Its loss of function increases sensitivity to drought and ABA stress, highlighting its importance in stress adaptation. These findings provide valuable insights into the molecular mechanisms underlying stress responses in rice and suggest that OsTHION15 could be a potential target for genetic engineering to improve stress resilience in crops. The comprehensive analysis of OsTHION gene expression patterns across various tissues and stress conditions provides valuable insights into their functional roles in rice growth, development, and stress adaptation. While our study focused on cultivated rice (Zhonghua 11), wild rice species (O. rufipogon, O. nivara, etc.) represent a promising avenue for future research. Wild rice exhibits enhanced stress tolerance due to its broader genetic diversity and adaptive evolution under natural selection pressures [55]. The newly constructed Oryza super-pangenome (comprising 13 wild and cultivated species) revealed that only ~10% of gene families are conserved across the genus, while the remaining 90% represent untapped genetic diversity, including numerous stress-related gene clusters absent in domesticated rice [56]. Future studies could leverage wild rice genomic resources to identify superior OsTHION alleles for breeding applications.

4. Materials and Methods

4.1. Phylogenetic Analysis of OsTHION Gene Families

A total of 44 OsTHION protein sequences were retrieved from the Phytozome V13 database through the genome version of Oryza sativa (MSN v7.0, Phytozome genome ID: 323 and NCBI taxonomy ID: 39947) [57,58] (https://phytozome-next.jgi.doe.gov/) (accessed on 12 August 2024) (Table S1). Multiple sequence alignment of these OsTHIONs was performed using MUSCLE (https://www.ebi.ac.uk/Tools/msa/muscle/) (accessed on 12 August 2024). Phylogenetic reconstruction and molecular evolutionary analyses were conducted using MEGA 12 software (https://www.megasoftware.net) (accessed on 12 August 2024), employing the maximum likelihood method with 1000 bootstrap replicates [59]. Additionally, 62 members of the AtTHION family were identified through BLAST analysis of the 44 OsTHION protein sequences (Table S2). The same approach was used to construct the fusion evolutionary tree (Figure S1).

4.2. Analysis of Cis-Acting Regulatory Elements in OsTHION Gene Promoters

The 2.5 kb upstream sequence of the 44 OsTHION genes was extracted from Phytozome 13 (Table S1). Cis-acting regulatory elements associated with light responsiveness, phytohormone responsiveness, plant growth regulation, and stress responsiveness were predicted using the Plant Cis-Acting Regulatory Element (PlantCARE, http://bioinformatics.psb.ugent.be/webtools/plantcare/html/) (accessed on 16 August 2024) [60]. The distribution patterns of these regulatory elements were visualized using the R programming language (version 4.1.2).

4.3. Expression Profiling of OsTHIONs in Different Tissues and Under Stress Conditions

The FPKM (Fragments Per Kilobase of transcript per Million mapped reads) values of the OsTHION genes were obtained from the rice eFP browser [36]. Expression levels were normalized and transformed to log2 values, with pixel intensities corresponding to the relative expression levels. The tissue-specific expression heatmap was generated using TBtools software (Version 1.098) [61]. Plant tissue samples were collected from ZhongHua 11, including roots and leaves of 14-day seedlings, mature flower organs (inflorescence, stigma, and ovary), and four developmental stages ovules (AC, MMC, FM, and MO). Total RNA was extracted using an E.Z.N.A. Total RNA Kit II (Omega, Norcross, GA, USA), followed by cDNA synthesis with reverse transcriptase for subsequent qRT-PCR analysis. To validate OsTHION expression patterns under abiotic stresses, we performed qRT-PCR analysis using ZH11 seedlings. Fourteen-day-old seedlings grown in complete rice nutrient solution were subjected to three stress treatments (salt stress: 150 mM NaCl, drought stress: 200 mM mannitol, and cold stress: 4 °C) starting at 8 am. Complete seedling tissue samples were collected at 0, 1, 3, 6, 12, and 24 h post-treatment for total RNA extraction and subsequent qRT-PCR analysis. To validate the efficacy of the drought, salt, and cold stress treatments, we analyzed the expression of stress-responsive marker genes (drought stress genes: OsDREB2A and OsNAC2, salt stress genes: OsHAK9 [62] and OsHAK21 [63], cold stress genes: OsCBF1 [64] and OsTPP1 [65]). The results demonstrated that OsDREB2A and OsNAC2 were significantly upregulated under drought stress, OsHAK9 and OsHAK21 were strongly induced under salt stress, and OsCBF1 and OsTPP1 exhibited marked increases in expression under cold stress (Figure S6).

4.4. Histochemical GUS Assay

The pOsTHION15::GUS construct was generated by amplifying a 2.5 kb OsTHION15 promoter fragment from ZH11 genomic DNA using gene-specific primers (Table S9). The amplified fragment was subsequently cloned into the pGWB533 vector through BP and LR recombination reactions. Transgenic rice plants were generated via Agrobacterium tumefaciens-mediated transformation of rice calli [66]. Histochemical GUS staining was performed by incubating fresh rice tissues overnight in a GUS staining buffer at 37 °C. The samples were subsequently decolorized in acetone and visualized using a Leica M205 FA stereomicroscope.

4.5. Subcellular Localization of OsTHION15

For subcellular localization analysis, the 35S::OsTHION15::GFP fusion construct was generated. The coding sequence of OsTHION15 was amplified from ZH11 cDNA using specific primers (Table S9) and cloned into the pGWB505 vector through BP and LR reactions. Both the p35S::OsTHION15::GFP and p35S::GFP (control) constructs were transiently expressed in Nicotiana benthamiana leaves via Agrobacterium-mediated transformation. The transfected leaves were maintained at 22 °C for 48 h, and GFP fluorescence was detected using a Leica SP8 confocal laser scanning microscope.

4.6. Osthion15 Mutant Obtained by CRISPR/Cas 9

Using CRISPR/Cas9 gene editing technology, the target sequence “CCGTTTTGCGCATGGCACAAGGG” of the OsTHION15 gene was mutated precisely. Following rice genetic transformation, we obtained T1 generation Osthion15 mutants. These transgenic plants were subsequently grown, segregated, and screened to eliminate those containing the CRISPR vector. Through PCR identification using OsTHION15-ID-F/R primers and subsequent Sanger sequencing analysis, we successfully isolated two homozygous mutant lines: Osthion15-1 and Osthion15-2. Both mutants were confirmed to carry frameshift mutations that disrupt the normal coding sequence of the OsTHION15 protein.

4.7. Stress Treatment Assays

For osmotic stress treatment, the ZH11 wild-type and Osthion15 mutants (Osthion15-1 and Osthion15-2) were cultivated in 800× Yoshida rice nutrient solution (Coolaber, Beijing, China) for 15 days. They were then transferred to a nutrient solution supplemented with 150 mM mannitol. The control plants were maintained in standard Yoshida nutrient solution without mannitol supplementation. After 10 days of treatment, the fresh weight of both the treated and control plants was measured to assess the physiological response to osmotic stress.
For ABA response analysis, seedlings were grown in sterilized containers with 1/2 Murashige and Skoog (MS) medium with 2 µM ABA. The control plants were maintained on an ABA-free medium. All plants were grown under 16 h light/8 h dark photoperiod at 30 °C. Shoot and root lengths were measured after 20 days of growth.

4.8. RNA-Seq Data Analysis

RNA sequencing was performed on two-week-old ZH11 wild-type and Osthion15-1 mutant plant seedlings treated with either 150 mM mannitol or 2 µM ABA for three days. Three biological replicates were analyzed for each condition. Library preparation and sequencing were constructed by Novogene using the Illumina platform. Differential expression analysis was performed, and the results were visualized using volcano plots and Venn diagrams. Raw RNA-seq data were first subjected to quality control using fastp to remove adapter sequences, low-quality bases, and short reads [67,68]. Clean reads were aligned to the reference rice genome using HISAT2. Differential gene expression analysis was performed using DESeq2 [68,69], and the results were visualized through volcano plots and Venn diagrams. Gene Ontology (GO) and Kyoto Encyclopedia of Genes and Genomes (KEGG) enrichment analyses of the differentially expressed genes were conducted using the clusterProfilerr R package [70].

4.9. RNA Extraction and Quantitative Real-Time PCR

Total RNA was isolated from the drought-treated, ABA-treated, and control seedlings using an RNA extraction kit (OMEGA, Georgia and USA). cDNA synthesis was performed using a PrimerScript™ RTase Kit (TAKARA, Tokyo and Japan). Quantitative PCR was carried out in a 20 μL reaction volume containing 10 μL of 2× TransStar Top Green qPCR SuperMix (TransGen, Peking and China), 1 μL of cDNA template, and 0.4 μL of gene-specific primers (Table S9). The thermal cycling conditions were 95 °C for 30 s, followed by 40 cycles of 94 °C for 5 s and 60 °C for 15 s. Relative gene expression levels were calculated using the 2–ΔΔCt method.

Supplementary Materials

The following supporting information can be downloaded at: https://www.mdpi.com/article/10.3390/ijms26073447/s1.

Author Contributions

Writing—original draft, M.Y. and M.C.; software, C.A. and F.Y.; validation, X.J. and X.F.; data curation, T.L. and Y.J.; writing—review and editing, B.T., Y.Q. and H.C. All authors have read and agreed to the published version of the manuscript.

Funding

This research was funded by the Biological Breeding National Science and Technology Major Project (2023ZD04072), the National Natural Science Foundation of China (32270366 to Y.Q.), the Science and Technology Program of Fujian Province (2024N5004 to Y.Q.), Fujian ‘Young Eagle Program’ Youth Top Talent Program to H.C., the Excellent Youth Foundation of Fujian Province (2022J06014 to H.C.), and the Excellent Youth Foundation of Fujian Agriculture and Forestry University (xjq202108 to H.C.).

Institutional Review Board Statement

Not applicable.

Informed Consent Statement

Not applicable.

Data Availability Statement

The original contributions presented in this study are included in this article/the Supplementary Materials. Further inquiries can be directed to the corresponding author(s).

Conflicts of Interest

The authors declare no conflicts of interest.

References

  1. Singh, A.; Dilkes, B.; Sela, H.; Tzin, V. The Effectiveness of Physical and Chemical Defense Responses of Wild Emmer Wheat Against Aphids Depends on Leaf Position and Genotype. Front. Plant Sci. 2021, 12, 667820. [Google Scholar] [CrossRef]
  2. Gyan, N.M.; Yaakov, B.; Weinblum, N.; Singh, A.; Cna’ani, A.; Ben-Zeev, S.; Saranga, Y.; Tzin, V. Variation Between Three Eragrostis tef Accessions in Defense Responses to Rhopalosiphum padi Aphid Infestation. Front. Plant Sci. 2020, 11, 598483. [Google Scholar] [CrossRef]
  3. Durrant, W.E.; Dong, X. Systemic acquired resistance. Annu. Rev. Phytopathol. 2004, 42, 185–209. [Google Scholar] [CrossRef]
  4. Ali, S.; Ganai, B.A.; Kamili, A.N.; Bhat, A.A.; Mir, Z.A.; Bhat, J.A.; Tyagi, A.; Islam, S.T.; Mushtaq, M.; Yadav, P.; et al. Pathogenesis-related proteins and peptides as promising tools for engineering plants with multiple stress tolerance. Microbiol. Res. 2018, 212–213, 29–37. [Google Scholar] [CrossRef]
  5. Stec, B. Plant thionins--the structural perspective. Cell. Mol. Life Sci. 2006, 63, 1370–1385. [Google Scholar] [CrossRef]
  6. Schrader-Fischer, G.; Apel, K. cDNA-derived identification of novel thionin precursors in Viscum album that contain highly divergent thionin domains but conserved signal and acidic polypeptide domains. Plant Mol. Biol. 1993, 23, 1233–1242. [Google Scholar] [CrossRef]
  7. Samuelsson, G.; Pettersson, B. Toxic proteins from the mistletoe Dendrophtora clavata. II. The amino acid sequence of denclatoxin B. Acta Pharm. Suec. 1977, 14, 245–254. [Google Scholar]
  8. Pelegrini, P.B.; Franco, O.L. Plant gamma-thionins: Novel insights on the mechanism of action of a multi-functional class of defense proteins. Int. J. Biochem. Cell Biol. 2005, 37, 2239–2253. [Google Scholar] [CrossRef]
  9. Thevissen, K.; Terras, F.R.; Broekaert, W.F. Permeabilization of fungal membranes by plant defensins inhibits fungal growth. Appl. Environ. Microbiol. 1999, 65, 5451–5458. [Google Scholar] [CrossRef]
  10. Opata, M.M.; Izevbigie, E.B. Aqueous Vernomia amygdalina extracts alter MCF-7 cell membrane permeability and efflux. Int. J. Environ. Res. Public Health 2006, 3, 174–179. [Google Scholar] [CrossRef]
  11. Oard, S.V. Deciphering a mechanism of membrane permeabilization by α-hordothionin peptide. Biochim. Biophys. Acta 2011, 1808, 1737–1745. [Google Scholar] [CrossRef] [PubMed]
  12. Berrocal-Lobo, M.; Molina, A.; Rodriguez-Palenzuela, P.; Garcia-Olmedo, F.; Rivas, L. Leishmania donovani: Thionins, plant antimicrobial peptides with leishmanicidal activity. Exp. Parasitol. 2009, 122, 247–249. [Google Scholar] [CrossRef] [PubMed]
  13. Schmidt, M.; Arendt, E.K.; Thery, T.L.C. Isolation and characterisation of the antifungal activity of the cowpea defensin Cp-thionin II. Food Microbiol. 2019, 82, 504–514. [Google Scholar] [CrossRef] [PubMed]
  14. Taveira, G.B.; Mello, E.O.; Carvalho, A.O.; Regente, M.; Pinedo, M.; de La Canal, L.; Rodrigues, R.; Gomes, V.M. Antimicrobial activity and mechanism of action of a thionin-like peptide from Capsicum annuum fruits and combinatorial treatment with fluconazole against Fusarium solani. Biopolymers 2017, 108, e23008. [Google Scholar] [CrossRef]
  15. Iwai, T.; Kaku, H.; Honkura, R.; Nakamura, S.; Ochiai, H.; Sasaki, T.; Ohashi, Y. Enhanced resistance to seed-transmitted bacterial diseases in transgenic rice plants overproducing an oat cell-wall-bound thionin. Mol. Plant Microbe Interact. 2002, 15, 515–521. [Google Scholar] [CrossRef]
  16. Hao, G.; Stover, E.; Gupta, G. Overexpression of a Modified Plant Thionin Enhances Disease Resistance to Citrus Canker and Huanglongbing (HLB). Front. Plant Sci. 2016, 7, 1078. [Google Scholar] [CrossRef]
  17. Loeza-Angeles, H.; Sagrero-Cisneros, E.; Lara-Zárate, L.; Villagómez-Gómez, E.; López-Meza, J.E.; Ochoa-Zarzosa, A. Thionin Thi2.1 from Arabidopsis thaliana expressed in endothelial cells shows antibacterial, antifungal and cytotoxic activity. Biotechnol. Lett. 2008, 30, 1713–1719. [Google Scholar] [CrossRef]
  18. Epple, P.; Apel, K.; Bohlmann, H. Overexpression of an endogenous thionin enhances resistance of Arabidopsis against Fusarium oxysporum. Plant Cell 1997, 9, 509–520. [Google Scholar] [CrossRef]
  19. Holtorf, S.; Ludwig-Muller, J.; Apel, K.; Bohlmann, H. High-level expression of a viscotoxin in Arabidopsis thaliana gives enhanced resistance against Plasmodiophora brassicae. Plant Mol. Biol. 1998, 36, 673–680. [Google Scholar] [CrossRef]
  20. Oh, B.J.; Ko, M.K.; Kostenyuk, I.; Shin, B.; Kim, K.S. Coexpression of a defensin gene and a thionin-like via different signal transduction pathways in pepper and Colletotrichum gloeosporioides interactions. Plant Mol. Biol. 1999, 41, 313–319. [Google Scholar] [CrossRef]
  21. Escudero-Martinez, C.M.; Morris, J.A.; Hedley, P.E.; Bos, J.I.B. Barley transcriptome analyses upon interaction with different aphid species identify thionins contributing to resistance. Plant Cell Environ. 2017, 40, 2628–2643. [Google Scholar] [CrossRef]
  22. Leybourne, D.J.; Valentine, T.A.; Robertson, J.A.H.; Pérez-Fernández, E.; Main, A.M.; Karley, A.J.; Bos, J.I.B. Defence gene expression and phloem quality contribute to mesophyll and phloem resistance to aphids in wild barley. J. Exp. Bot. 2019, 70, 4011–4026. [Google Scholar] [CrossRef]
  23. Castillon, A.; Shen, H.; Huq, E. Phytochrome Interacting Factors: Central players in phytochrome-mediated light signaling networks. Trends Plant Sci. 2007, 12, 514–521. [Google Scholar] [CrossRef]
  24. Ji, H.; Gheysen, G.; Ullah, C.; Verbeek, R.; Shang, C.; De Vleesschauwer, D.; Höfte, M.; Kyndt, T. The role of thionins in rice defence against root pathogens. Mol. Plant Pathol. 2015, 16, 870–881. [Google Scholar] [CrossRef]
  25. Utriainen, M.; Kokko, H.; Auriola, S.; Sarrazin, O.; Kärenlampi, S. PR-10 protein is induced by copper stress in roots and leaves of a Cu/Zn tolerant clone of birch, Betula pendula. Plant Cell Environ. 2010, 21, 821–828. [Google Scholar]
  26. Wu, J.; Kim, S.G.; Kang, K.Y.; Kim, J.G.; Park, S.R.; Gupta, R.; Kim, Y.H.; Wang, Y.; Kim, S.T. Overexpression of a Pathogenesis-Related Protein 10 Enhances Biotic and Abiotic Stress Tolerance in Rice. Plant Pathol. J. 2016, 32, 552–562. [Google Scholar] [CrossRef]
  27. Desouky, A.F.; Ahmed, A.H.H.; Stutzel, H.; Jacobsen, H.J.; Pao, Y.C.; Hanafy, M.S. Enhanced Abiotic Stress Tolerance of Vicia faba L. Plants Heterologously Expressing the PR10a Gene from Potato. Plants 2021, 10, 173. [Google Scholar] [CrossRef]
  28. Seo, P.J.; Lee, A.K.; Xiang, F.; Park, C.M. Molecular and functional profiling of Arabidopsis pathogenesis-related genes: Insights into their roles in salt response of seed germination. Plant Cell Physiol. 2008, 49, 334–344. [Google Scholar] [CrossRef]
  29. Singh, N.K.; Kumar, K.R.; Kumar, D.; Shukla, P.; Kirti, P.B. Characterization of a pathogen induced thaumatin-like protein gene AdTLP from Arachis diogoi, a wild peanut. PLoS ONE 2013, 8, e83963. [Google Scholar] [CrossRef]
  30. Hong, J.K.; Hwang, B.K.J.P.P. Induction of enhanced disease resistance and oxidative stress tolerance by overexpression of pepper basic PR-1 gene in Arabidopsis. Physiol. Plant. 2005, 124, 1399–3054. [Google Scholar]
  31. Janska, A.A.; Marsík, P.; Zelenková, S.; Biology, J.O.J.P. Cold stress and acclimation—What is important for metabolic adjustment? Plant Biol. 2010, 12, 395–405. [Google Scholar] [PubMed]
  32. Archambault, A.; Strömvik, M.V. PR-10, defensin and cold dehydrin genes are among those over expressed in Oxytropis (Fabaceae) species adapted to the arctic. Funct. Integr. Genom. 2011, 11, 497–505. [Google Scholar] [CrossRef]
  33. Neyshabouri, F.A.; Ghotbi-Ravandi, A.A.; Shariatmadari, Z.; Tohidfar, M. Cadmium toxicity promotes hormonal imbalance and induces the expression of genes involved in systemic resistances in barley. Biometals 2024, 37, 1147–1160. [Google Scholar] [CrossRef] [PubMed]
  34. Boonpa, K.; Tantong, S.; Weerawanich, K.; Panpetch, P.; Pringsulaka, O.; Roytrakul, S.; Sirikantaramas, S. In Silico Analyses of Rice Thionin Genes and the Antimicrobial Activity of OsTHION15 Against Phytopathogens. Phytopathology 2019, 109, 27–35. [Google Scholar] [CrossRef]
  35. Toledo-Ortiz, G.; Johansson, H.; Lee, K.P.; Bou-Torrent, J.; Stewart, K.; Steel, G.; Rodríguez-Concepción, M.; Halliday, K.J. The HY5-PIF regulatory module coordinates light and temperature control of photosynthetic gene transcription. PLoS Genet. 2014, 10, e1004416. [Google Scholar] [CrossRef]
  36. Jain, M.; Nijhawan, A.; Arora, R.; Agarwal, P.; Ray, S.; Sharma, P.; Kapoor, S.; Tyagi, A.K.; Khurana, J.P. F-box proteins in rice. Genome-wide analysis, classification, temporal and spatial gene expression during panicle and seed development, and regulation by light and abiotic stress. Plant Physiol. 2007, 143, 1467–1483. [Google Scholar] [CrossRef]
  37. Zhao, H.; Guo, M.; Yan, M.; Cheng, H.; Liu, Y.; She, Z.; Lai, L.; Shi, C.; Zhang, M.; Li, Y.; et al. Comparative Expression Profiling Reveals Genes Involved in Megasporogenesis. Plant Physiol. 2020, 182, 2006–2024. [Google Scholar] [CrossRef]
  38. Gupta, A.; Rico-Medina, A.; Caño-Delgado, A.I. The physiology of plant responses to drought. Science 2020, 368, 266–269. [Google Scholar] [CrossRef]
  39. Silverstein, K.A.; Moskal, W.A., Jr.; Wu, H.C.; Underwood, B.A.; Graham, M.A.; Town, C.D.; VandenBosch, K.A. Small cysteine-rich peptides resembling antimicrobial peptides have been under-predicted in plants. Plant J. 2007, 51, 262–280. [Google Scholar] [CrossRef]
  40. Liu, X.; Gong, X.; Zhou, D.; Jiang, Q.; Liang, Y.; Ye, R.; Zhang, S.; Wang, Y.; Tang, X.; Li, F.; et al. Plant Defensin-Dissimilar Thionin OsThi9 Alleviates Cadmium Toxicity in Rice Plants and Reduces Cadmium Accumulation in Rice Grains. J. Agric. Food Chem. 2023, 71, 8367–8380. [Google Scholar] [CrossRef]
  41. Shiu, S.H.; Bleecker, A.B. Expansion of the receptor-like kinase/Pelle gene family and receptor-like proteins in Arabidopsis. Plant Physiol. 2003, 132, 530–543. [Google Scholar] [CrossRef] [PubMed]
  42. Yamaguchi-Shinozaki, K.; Shinozaki, K. Transcriptional regulatory networks in cellular responses and tolerance to dehydration and cold stresses. Annu. Rev. Plant Biol. 2006, 57, 781–803. [Google Scholar] [CrossRef] [PubMed]
  43. Jiao, Y.; Ma, L.; Strickland, E.; Deng, X.W. Conservation and divergence of light-regulated genome expression patterns during seedling development in rice and Arabidopsis. Plant Cell 2005, 17, 3239–3256. [Google Scholar] [CrossRef] [PubMed]
  44. Li, X.; Han, H.; Chen, M.; Yang, W.; Liu, L.; Li, N.; Ding, X.; Chu, Z. Overexpression of OsDT11, which encodes a novel cysteine-rich peptide, enhances drought tolerance and increases ABA concentration in rice. Plant Mol. Biol. 2017, 93, 21–34. [Google Scholar] [CrossRef]
  45. Meiyalaghan, S.; Thomson, S.J.; Fiers, M.W.; Barrell, P.J.; Latimer, J.M.; Mohan, S.; Jones, E.E.; Conner, A.J.; Jacobs, J.M. Structure and expression of GSL1 and GSL2 genes encoding gibberellin stimulated-like proteins in diploid and highly heterozygous tetraploid potato reveals their highly conserved and essential status. BMC Genom. 2014, 15, 2. [Google Scholar] [CrossRef]
  46. Sah, S.K.; Reddy, K.R.; Li, J. Abscisic Acid and Abiotic Stress Tolerance in Crop Plants. Front. Plant Sci. 2016, 7, 571. [Google Scholar] [CrossRef]
  47. Zhang, Q.; Liu, Y.; Jiang, Y.; Li, A.; Cheng, B.; Wu, J. OsASR6 Enhances Salt Stress Tolerance in Rice. Int. J. Mol. Sci. 2022, 23, 9340. [Google Scholar] [CrossRef]
  48. Hu, H.; You, J.; Fang, Y.; Zhu, X.; Qi, Z.; Xiong, L. Characterization of transcription factor gene SNAC2 conferring cold and salt tolerance in rice. Plant Mol. Biol. 2008, 67, 169–181. [Google Scholar] [CrossRef]
  49. Nakashima, K.; Tran, L.S.; Van Nguyen, D.; Fujita, M.; Maruyama, K.; Todaka, D.; Ito, Y.; Hayashi, N.; Shinozaki, K.; Yamaguchi-Shinozaki, K. Functional analysis of a NAC-type transcription factor OsNAC6 involved in abiotic and biotic stress-responsive gene expression in rice. Plant J. 2007, 51, 617–630. [Google Scholar] [CrossRef]
  50. Li, Y.; Han, S.; Sun, X.; Khan, N.U.; Zhong, Q.; Zhang, Z.; Zhang, H.; Ming, F.; Li, Z.; Li, J. Variations in OsSPL10 confer drought tolerance by directly regulating OsNAC2 expression and ROS production in rice. J. Integr. Plant Biol. 2023, 65, 918–933. [Google Scholar] [CrossRef]
  51. Chang, Y.; Liu, J.; Guo, M.; Ouyang, W.; Yan, J.; Xiong, L.; Li, X. Drought-responsive dynamics of H3K9ac-marked 3D chromatin interactions are integrated by OsbZIP23-associated super-enhancer-like promoter regions in rice. Genome Biol. 2024, 25, 262. [Google Scholar] [CrossRef] [PubMed]
  52. Zhang, X.X.; Tang, Y.J.; Ma, Q.B.; Yang, C.Y.; Mu, Y.H.; Suo, H.C.; Luo, L.H.; Nian, H. OsDREB2A, a rice transcription factor, significantly affects salt tolerance in transgenic soybean. PLoS ONE 2013, 8, e83011. [Google Scholar] [CrossRef] [PubMed]
  53. Hwang, S.G.; Lee, C.Y.; Tseng, C.S. Heterologous expression of rice 9-cis-epoxycarotenoid dioxygenase 4 (OsNCED4) in Arabidopsis confers sugar oversensitivity and drought tolerance. Bot. Stud. 2018, 59, 2. [Google Scholar] [CrossRef]
  54. Liu, Y.H.; Jiang, M.; Li, R.Q.; Huang, J.Z.; Shu, Q.Y. OsKEAP1 Interacts with OsABI5 and Its Downregulation Increases the Transcription of OsABI5 and the ABA Response Genes in Germinating Rice Seeds. Plants 2021, 10, 527. [Google Scholar] [CrossRef] [PubMed]
  55. Giolai, M.; Laine, A.L. A trade-off between investment in molecular defense repertoires and growth in plants. Science 2024, 386, 677–680. [Google Scholar] [CrossRef]
  56. Long, W.; He, Q.; Wang, Y.; Wang, Y.; Wang, J.; Yuan, Z.; Wang, M.; Chen, W.; Luo, L.; Luo, L.; et al. Genome evolution and diversity of wild and cultivated rice species. Nat. Commun. 2024, 15, 9994. [Google Scholar] [CrossRef]
  57. Goodstein, D.M.; Shu, S.; Howson, R.; Neupane, R.; Hayes, R.D.; Fazo, J.; Mitros, T.; Dirks, W.; Hellsten, U.; Putnam, N.; et al. Phytozome: A comparative platform for green plant genomics. Nucleic Acids Res. 2012, 40, D1178–D1186. [Google Scholar] [CrossRef]
  58. Ouyang, S.; Zhu, W.; Hamilton, J.; Lin, H.; Campbell, M.; Childs, K.; Thibaud-Nissen, F.; Malek, R.L.; Lee, Y.; Zheng, L.; et al. The TIGR Rice Genome Annotation Resource: Improvements and new features. Nucleic Acids Res. 2007, 35, D883–D887. [Google Scholar] [CrossRef]
  59. Liu, Y.; Aslam, M.; Yao, L.A.; Zhang, M.; Wang, L.; Chen, H.; Huang, Y.; Qin, Y.; Niu, X. Genomic analysis of SBP gene family in Saccharum spontaneum reveals their association with vegetative and reproductive development. BMC Genom. 2021, 22, 767. [Google Scholar] [CrossRef]
  60. Lescot, M.; Dehais, P.; Thijs, G.; Marchal, K.; Moreau, Y.; Van de Peer, Y.; Rouze, P.; Rombauts, S. PlantCARE, a database of plant cis-acting regulatory elements and a portal to tools for in silico analysis of promoter sequences. Nucleic Acids Res. 2002, 30, 325–327. [Google Scholar] [CrossRef]
  61. Chen, C.; Wu, Y.; Li, J.; Wang, X.; Zeng, Z.; Xu, J.; Liu, Y.; Feng, J.; Chen, H.; He, Y.; et al. TBtools-II: A “one for all, all for one” bioinformatics platform for biological big-data mining. Mol. Plant 2023, 16, 1733–1742. [Google Scholar] [CrossRef] [PubMed]
  62. Zeng, P.; Xie, T.; Shen, J.; Liang, T.; Yin, L.; Liu, K.; He, Y.; Chen, M.; Tang, H.; Chen, S.; et al. Potassium transporter OsHAK9 regulates seed germination under salt stress by preventing gibberellin degradation through mediating OsGA2ox7 in rice. J. Integr. Plant Biol. 2024, 66, 731–748. [Google Scholar] [CrossRef] [PubMed]
  63. Shen, Y.; Shen, L.; Shen, Z.; Jing, W.; Ge, H.; Zhao, J.; Zhang, W. The potassium transporter OsHAK21 functions in the maintenance of ion homeostasis and tolerance to salt stress in rice. Plant Cell Environ. 2015, 38, 2766–2779. [Google Scholar] [CrossRef] [PubMed]
  64. Wang, Q.; Guan, Y.; Wu, Y.; Chen, H.; Chen, F.; Chu, C. Overexpression of a rice OsDREB1F gene increases salt, drought, and low temperature tolerance in both Arabidopsis and rice. Plant Mol. Biol. 2008, 67, 589–602. [Google Scholar] [CrossRef]
  65. Ge, L.F.; Chao, D.Y.; Shi, M.; Zhu, M.Z.; Gao, J.P.; Lin, H.X. Overexpression of the trehalose-6-phosphate phosphatase gene OsTPP1 confers stress tolerance in rice and results in the activation of stress responsive genes. Planta 2008, 228, 191–201. [Google Scholar] [CrossRef]
  66. Do, V.G.; Kim, S.; Win, N.M.; Kwon, S.I.; Kweon, H.; Yang, S.; Park, J.; Do, G.; Lee, Y. Efficient Regeneration of Transgenic Rice from Embryogenic Callus via Agrobacterium-Mediated Transformation: A Case Study Using GFP and Apple MdFT1 Genes. Plants 2024, 13, 19. [Google Scholar] [CrossRef]
  67. Chen, S.; Zhou, Y.; Chen, Y.; Gu, J. fastp: An ultra-fast all-in-one FASTQ preprocessor. Bioinformatics 2018, 34, i884–i890. [Google Scholar] [CrossRef]
  68. Love, M.I.; Huber, W.; Anders, S. Moderated estimation of fold change and dispersion for RNA-seq data with DESeq2. Genome Biol. 2014, 15, 550. [Google Scholar] [CrossRef]
  69. Kim, D.; Paggi, J.M.; Park, C.; Bennett, C.; Salzberg, S.L. Graph-based genome alignment and genotyping with HISAT2 and HISAT-genotype. Nat. Biotechnol. 2019, 37, 907–915. [Google Scholar] [CrossRef]
  70. Yu, G.; Wang, L.G.; Han, Y.; He, Q.Y. clusterProfiler: An R package for comparing biological themes among gene clusters. Omics 2012, 16, 284–287. [Google Scholar] [CrossRef]
Figure 1. Phylogenetic tree analysis of the coding sequences of OsTHION family genes of rice. All 4 groups of OsTHIONs were well separated in different clades and represented by different colors.
Ijms 26 03447 g001
Figure 2. Regulatory elements in the promoter region of OsTHION genes in rice. (A) Distribution of cis-acting elements identified in the 2500 bp upstream region of OsTHION genes. Different colors represent the different types of cis-elements. (B) The number of cis-acting elements on putative promoters of OsTHION genes.
Ijms 26 03447 g002
Figure 3. The expression profiles of selected OsTHION genes. (A) Expression profiles for mature stigma (St) and ovary (Ov), seedling root (R), mature (ML) and young leaf (YL), and shoot apical meristem (SAM), as well as for panicle (P1 to P6) and seed (S1 to S5) developmental stages, were obtained from the rice eFP browser. (B) Expression profiles for four stages of the ovule (AC, MMC, FM, and MO), stigma and style (SS), and the ovary wall (OW) of the FM stage. (C) qRT-PCR results for mature stigma (St) and ovary (Ov), seedling root (R), and young leaf (YL). (D) qRT-PCR results for four stages of the ovule (AC, MMC, FM, and MO). The expression heatmap (A,B) is based on the FPKM values retrieved from the browser. Pixel intensities are proportional to the actual expression levels, which were calculated as log2 expression values. The heatmap of qRT-PCR (C,D) represents the average relative expression levels calculated based on CT values and a normalized presentation of the relative expression levels. Three biological replicates, each with three technical repeats, were conducted for each sample. Data are mean values ± SDs.
Ijms 26 03447 g003
Figure 4. The expression profiles of selected OsTHION genes under abiotic stress. (A) The expression heatmap of OsTHION genes. (B) The qRT-PCR results of selected OsTHION genes. Three biological replicates, each with three technical repeats, were conducted for each sample. Data are mean values ± SDs. a, p < 0.05, b, p < 0.01, c, p < 0.001 by one-way ANOVA.
Ijms 26 03447 g004
Figure 5. Expression pattern of OsTHION15 and subcellular localization of the encoded protein. (AF) Expression pattern of pOsTHION15::GUS in different rice tissues: (A) root, (B) stem, (C) leaf, (D) pistil at the FM stage, (E) florets at eight different developmental stages, and (F) seeding roots at different times under 150 mM mannitol treatment. (G,H) Subcellular localization of p35S::OsTHION15::GFP through transient expression in tobacco (G) and rice protoplasts (H). The upper row is the expression of p35S::GFP as the control. The GFP fluorescence channel is represented in green, and the FM4-64 fluorescence channel is shown in red. (AE) Bar = 5 mm. (F) Bar = 1 mm. (G) Bar = 50 μm.
Ijms 26 03447 g005
Figure 6. The phenotype of the Osthion15 mutant under drought stress. (A) ZH11 and Osthion15 grown in normal conditions as a control. (B) ZH11 and Osthion15 grown under 150 mM mannitol for 10 days. (C) The quantification of fresh weight with a single plant. Data are mean values ± SDs. ***, p < 0.001 by one-way ANOVA. (A,B) Bar = 5 cm.
Ijms 26 03447 g006
Figure 7. The phenotype of the Osthion15 mutant under ABA stress. (A) ZH11 and Osthion15 grown under 1/2 MS medium as a control. (B) ZH11 and Osthion15 continuously grown under 1/2 MS medium containing 2 μM ABA for 20 days. (C) The quantification of the length of the shoots and roots. Data are mean values ± SDs. **, 0.001 < p < 0.01, ***, p < 0.001 by one-way ANOVA. (A,B) Bar = 5 cm.
Ijms 26 03447 g007
Figure 8. The RNA-seq analysis of the Osthion15 mutant under CK, mannitol, and ABA stress. (A) Volcanic plot illustrating differentially expressed genes between the Osthion15 mutant and ZH11 under CK conditions (A), mannitol (B), and ABA stress (C). (D,E). The Venn diagram illustrates the overlap in the number of genes that are concurrently upregulated (D) and downregulated (E) in both the Osthion15 mutant and ZH11 under CK conditions, drought stress, and ABA stress.
Ijms 26 03447 g008
Figure 9. The expression heatmap of differential expression genes. (A-B) The expression heatmap of co-upregulated (A) and co-downregulated (B) genes under CK, drought, and ABA stress.
Ijms 26 03447 g009
Figure 10. Heatmap representation of the expression profiles for the top 20 genes exhibiting the largest differential expression between Osthion15 and ZH11. (AC) The top 20 genes with the most significant upregulation in expression levels under CK (A), ABA stress (B), and drought stress (C). (DF) The top 20 genes with the most significant downregulation in expression levels under CK (D), ABA stress (E), and drought stress (F).
Ijms 26 03447 g010
Figure 11. Expression pattern of stress-response genes under drought and ABA stress. (A) Expression heatmap of drought-stress-responsive genes. (B) qRT-PCR results of drought-stress-responsive genes. Data are mean values ± SDs. (C) Expression heatmap of ABA-stress-responsive genes. (D) qRT-PCR results of ABA-stress-responsive genes. Data are mean values ± SDs. *, p < 0.05, **, p < 0.01, ***, p < 0.001 by one-way ANOVA.
Ijms 26 03447 g011
Figure 12. Model showing the role of OsTHION15 under drought and ABA stress. (The dotted arrows indicate enhanced expression).
Ijms 26 03447 g012
Disclaimer/Publisher’s Note: The statements, opinions and data contained in all publications are solely those of the individual author(s) and contributor(s) and not of MDPI and/or the editor(s). MDPI and/or the editor(s) disclaim responsibility for any injury to people or property resulting from any ideas, methods, instructions or products referred to in the content.

