
Exploring the Role of microRNAs as Blood Biomarkers in Alzheimer’s Disease and Frontotemporal Dementia

 , ,
, ,  ,
,  , , ,
, , ,
Abstract
1. Introduction
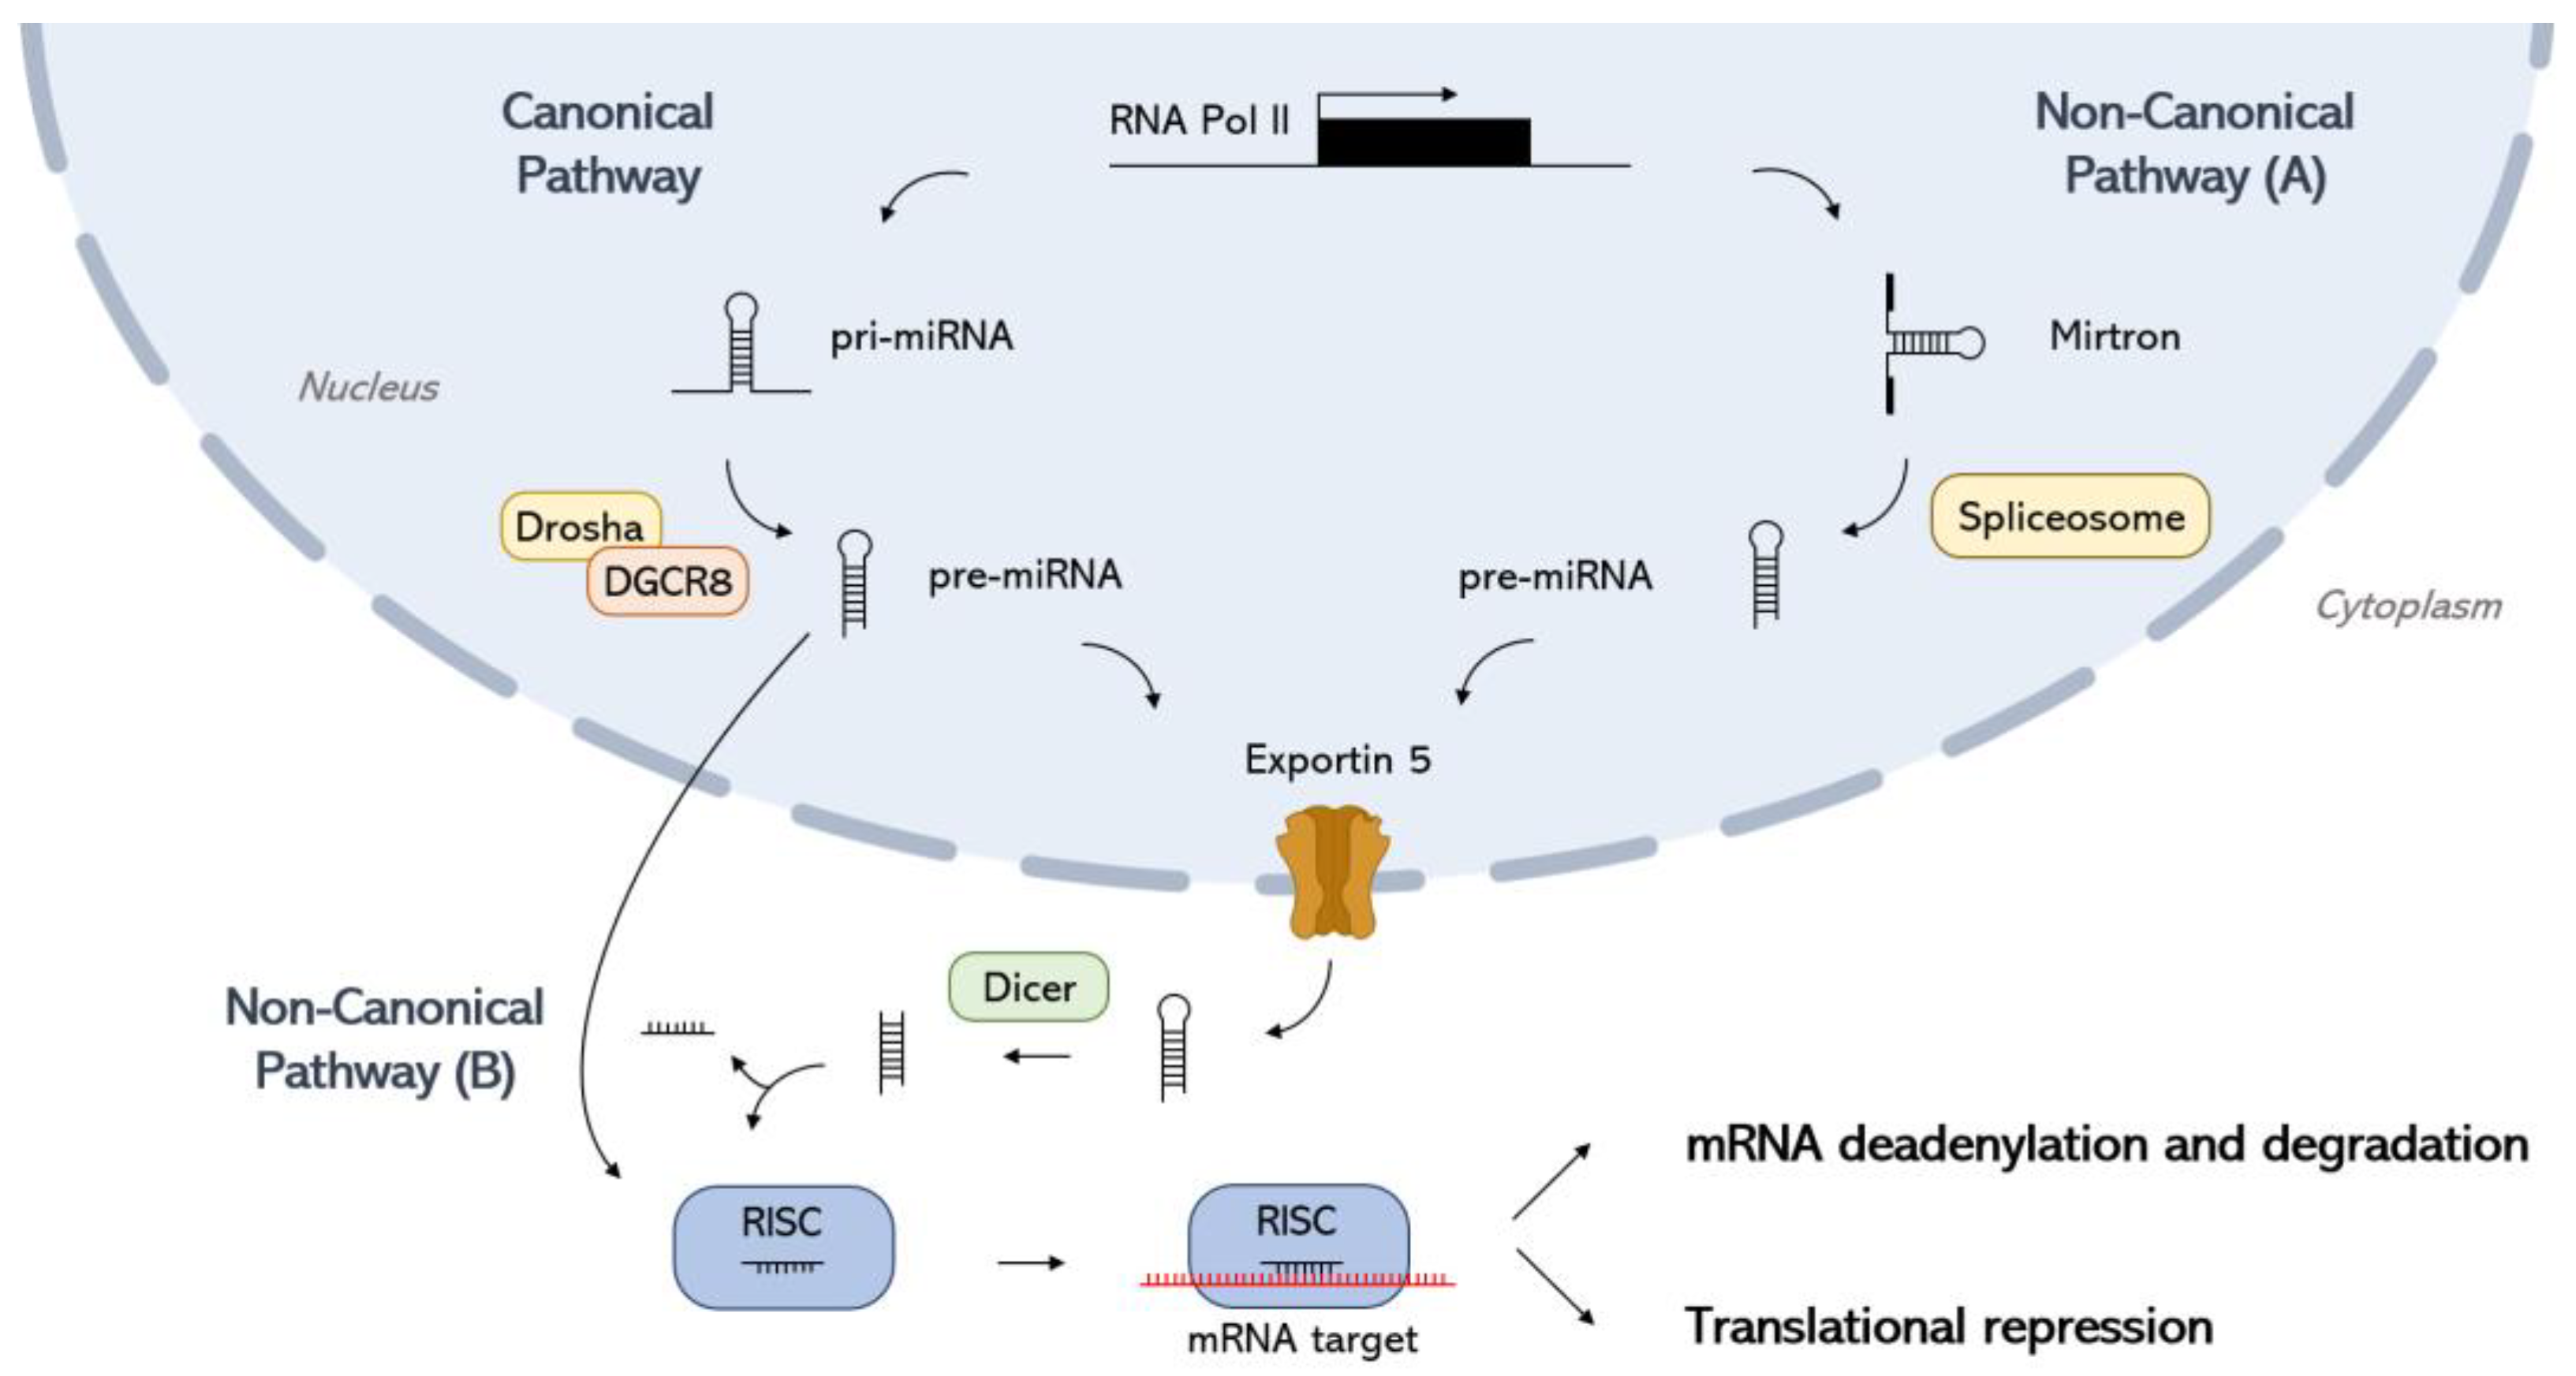
2. miRNA Biogenesis
3. miRNA-Mediated Gene Regulation
4. Extracellular miRNAs and Circulating EVs
5. Crosstalk Between miRNAs and Oxidative Stress Pathways
6. miRNAs as Potential Biomarkers in AD
7. Computational Approaches to Discover miRNA Biomarkers for AD
7.1. Differential Expression Analysis of miRNAs in AD
7.2. Machine Learning Approaches to miRNA Profiling
7.3. Network Analysis Approaches to miRNA Profiling
7.4. Pathway Enrichment Analysis of miRNA Pathways
7.5. Text Mining Approaches to miRNA Profiling
8. miRNAs as Biomarkers in FTD
9. Computational Approaches to Discover miRNA Biomarkers for FTD
10. General Challenges and Future Directions with miRNAs in Dementia Research
- Heterogeneity of phenotypes: All forms of dementia are complex and heterogeneous diseases, and miRNA expression profiles can vary significantly between individuals. This makes it challenging to identify miRNA biomarkers that are consistently accurate across different populations.
- Heterogeneity of the miRNA population: While some miRNAs are brain-enriched and primarily reflect neurodegenerative processes, others can be secreted from various peripheral tissues and organs. Moreover, systemic conditions, such as inflammation or metabolic disorders, can influence the levels of circulating miRNAs and may act as confounding factors, potentially affecting their specificity as biomarkers for neurodegenerative diseases.
- Lack of standardized protocols: There is a lack of standardized protocols for miRNA extraction, quantification, and analysis. This can lead to a high degree of variability in results between different studies.
- Validation in large cohorts: Many studies on miRNA biomarkers for AD have been conducted on small cohorts. Larger studies are needed to validate the findings of these studies and to confirm the clinical utility of miRNA biomarkers.
Methodological Challenges to the Use of miRNAs as Biomarkers
11. Conclusions
Author Contributions
Funding
Conflicts of Interest
References
- Lattante, S.; Ciura, S.; Rouleau, G.A.; Kabashi, E. Defining the genetic connection linking amyotrophic lateral sclerosis (ALS) with frontotemporal dementia (FTD). Trends Genet. 2015, 31, 263–273. [Google Scholar] [CrossRef] [PubMed]
- Cruts, M.; Van Broeckhoven, C. Loss of progranulin function in frontotemporal lobar degeneration. Trends Genet. 2008, 24, 186–194. [Google Scholar] [CrossRef]
- Cobley, J.N.; Fiorello, M.L.; Bailey, D.M. 13 reasons why the brain is susceptible to oxidative stress. Redox Biol. 2018, 15, 490–503. [Google Scholar] [CrossRef] [PubMed]
- Aksenov, M.Y.; Aksenova, M.V.; Butterfield, D.A.; Geddes, J.W.; Markesbery, W.R. Protein oxidation in the brain in Alzheimer’s disease. Neuroscience 2001, 103, 373–383. [Google Scholar] [CrossRef]
- Hee Lee, S.; Kim, I.; Chul Chung, B. Increased urinary level of oxidized nucleosides in patients with mild-to-moderate Alzheimer’s disease. Clin. Biochem. 2007, 40, 936–938. [Google Scholar] [CrossRef]
- Pratico, D.; Uryu, K.; Leight, S.; Trojanoswki, J.Q.; Lee, V.M. Increased Lipid Peroxidation Precedes Amyloid Plaque Formation in an Animal Model of Alzheimer Amyloidosis. J. Neurosci. 2001, 21, 4183–4187. [Google Scholar] [CrossRef]
- Drake, J.; Link, C.D.; Butterfield, D.A. Oxidative stress precedes fibrillar deposition of Alzheimer’s disease amyloid β-peptide (1–42) in a transgenic Caenorhabditis elegans model. Neurobiol. Aging 2003, 24, 415–420. [Google Scholar] [CrossRef]
- Yatin, S.M.; Varadarajan, S.; Link, C.D.; Butterfield, D.A. In vitro and in vivo oxidative stress associated with Alzheimer’s amyloid beta-peptide (1-42). Neurobiol. Aging 1999, 20, 325–330. [Google Scholar] [CrossRef]
- Butterfield, D.A.; Lauderback, C.M. Lipid peroxidation and protein oxidation in alzheimer’s disease brain: Potential causes and consequences involving amyloid β-peptide-associated free radical oxidative stress. Free Radic. Biol. Med. 2002, 32, 1050–1060. [Google Scholar] [CrossRef]
- Markesbery, W.R. The Role of Oxidative Stress in Alzheimer Disease. Arch. Neurol. 1999, 56, 1449–1452. [Google Scholar] [CrossRef]
- Maina, M.B.; Al-Hilaly, Y.K.; Serpell, L.C. Dityrosine cross-linking and its potential roles in Alzheimer’s disease. Front. Neurosci. 2023, 17, 1132670. [Google Scholar] [CrossRef] [PubMed]
- Li, W.; Zheng, Y. MicroRNAs in Extracellular Vesicles of Alzheimer’s Disease. Cells 2023, 12, 1378. [Google Scholar] [CrossRef]
- Manzini, V.; Cappelletti, P.; Orefice, N.S.; Brentari, I.; Rigby, M.J.; Lo Giudice, M.; Feligioni, M.; Rivabene, R.; Crestini, A.; Manfredi, F.; et al. miR-92a-3p and miR-320a are Upregulated in Plasma Neuron-Derived Extracellular Vesicles of Patients with Frontotemporal Dementia. Mol. Neurobiol. 2025, 62, 2573–2586. [Google Scholar] [CrossRef]
- Wightman, B.; Ha, I.; Ruvkun, G. Posttranscriptional regulation of the heterochronic gene lin-14 by lin-4 mediates temporal pattern formation in C. elegans. Cell 1993, 75, 855–862. [Google Scholar] [CrossRef]
- Lee, R.C.; Feinbaum, R.L.; Ambros, V. The C. elegans heterochronic gene lin-4 encodes small RNAs with antisense complementarity to lin-14. Cell 1993, 75, 843–854. [Google Scholar] [CrossRef] [PubMed]
- Fu, G.; Brkic, J.; Hayder, H.; Peng, C. MicroRNAs in Human Placental Development and Pregnancy Complications. Int. J. Mol. Sci. 2013, 14, 5519–5544. [Google Scholar] [CrossRef] [PubMed]
- Ha, M.; Kim, V.N. Regulation of microRNA biogenesis. Nat. Rev. Mol. Cell Biol. 2014, 15, 509–524. [Google Scholar] [CrossRef]
- Kim, Y.; Kim, V.N. Processing of intronic microRNAs. EMBO J. 2007, 26, 775–783. [Google Scholar] [CrossRef]
- Altuvia, Y.; Landgraf, P.; Lithwick, G.; Elefant, N.; Pfeffer, S.; Aravin, A.; Brownstein, M.J.; Tuschl, T.; Margalit, H. Clustering and conservation patterns of human microRNAs. Nucleic Acids Res. 2005, 33, 2697–2706. [Google Scholar] [CrossRef]
- Denli, A.M.; Tops, B.B.J.; Plasterk, R.H.A.; Ketting, R.F.; Hannon, G.J. Processing of primary microRNAs by the microprocessor complex. Nature 2004, 432, 231–235. [Google Scholar] [CrossRef]
- Alarcón, C.R.; Lee, H.; Goodarzi, H.; Halberg, N.; Tavazoie, S.F. N6-methyladenosine marks primary microRNAs for processing. Nature 2015, 519, 482–485. [Google Scholar] [CrossRef] [PubMed]
- Han, J.; Lee, Y.; Yeom, K.; Kim, Y.; Jin, H.; Kim, V.N. The Drosha-DGCR8 complex in primary microRNA processing. Genes Dev. 2004, 18, 3016–3027. [Google Scholar] [CrossRef] [PubMed]
- Shukla, G.C.; Singh, J.; Barik, S. MicroRNAs: Processing, Maturation, Target Recognition and Regulatory Functions. Mol. Cell. Pharmacol. 2011, 3, 83–92. [Google Scholar] [PubMed]
- O’Brien, J.; Hayder, H.; Zayed, Y.; Peng, C. Overview of MicroRNA Biogenesis, Mechanisms of Actions, and Circulation. Front. Endocrinol. 2018, 9, 402. [Google Scholar] [CrossRef]
- Abdelfattah, A.M.; Park, C.; Choi, M.Y. Update on non-canonical microRNAs. Biomol. Concepts 2014, 5, 275–287. [Google Scholar] [CrossRef]
- Meister, G. Argonaute proteins: Functional insights and emerging roles. Nat. Rev. Genet. 2013, 14, 447–459. [Google Scholar] [CrossRef]
- Medley, J.C.; Panzade, G.; Zinovyeva, A.Y. microRNA strand selection: Unwinding the rules. Wiley Interdiscip. Rev. RNA 2021, 12, e1627. [Google Scholar] [CrossRef]
- Nagar, B.; Frank, F.; Sonenberg, N. Structural basis for 5′-nucleotide base-specific recognition of guide RNA by human AGO2. Nature 2010, 465, 818–822. [Google Scholar] [CrossRef]
- Mi, S.; Cai, T.; Hu, Y.; Chen, Y.; Hodges, E.; Ni, F.; Wu, L.; Li, S.; Zhou, H.; Long, C.; et al. Sorting of Small RNAs into Arabidopsis Argonaute Complexes Is Directed by the 5′ Terminal Nucleotide. Cell 2008, 133, 116–127. [Google Scholar] [CrossRef]
- Takeda, A.; Iwasaki, S.; Watanabe, T.; Utsumi, M.; Watanabe, Y. The Mechanism Selecting the Guide Strand from Small RNA Duplexes is Different Among Argonaute Proteins. Plant Cell Physiol. 2008, 49, 493–500. [Google Scholar] [CrossRef]
- Kawamata, T.; Yoda, M.; Tomari, Y. Multilayer checkpoints for microRNA authenticity during RISC assembly. EMBO Rep. 2011, 12, 944–949. [Google Scholar] [CrossRef] [PubMed]
- Khvorova, A.; Reynolds, A.; Jayasena, S.D. Functional siRNAs and miRNAs Exhibit Strand Bias. Cell 2003, 115, 209–216. [Google Scholar] [CrossRef] [PubMed]
- Eulalio, A.; Huntzinger, E.; Nishihara, T.; Rehwinkel, J.; Fauser, M.; Izaurralde, E. Deadenylation is a widespread effect of miRNA regulation. RNA 2009, 15, 21–32. [Google Scholar] [CrossRef] [PubMed]
- Filipowicz, W.; Sonenberg, N.; Bhattacharyya, S.N. Mechanisms of post-transcriptional regulation by microRNAs: Are the answers in sight? Nat. Rev. Genet. 2008, 9, 102–114. [Google Scholar] [CrossRef]
- Truesdell, S.S.; Mortensen, R.D.; Seo, M.; Schroeder, J.C.; Lee, J.H.; LeTonqueze, O.; Vasudevan, S. MicroRNA-mediated mRNA Translation Activation in Quiescent Cells and Oocytes Involves Recruitment of a Nuclear microRNP. Sci. Rep. 2012, 2, 842. [Google Scholar] [CrossRef]
- Ørom, U.A.; Nielsen, F.C.; Lund, A.H. MicroRNA-10a Binds the 5′UTR of Ribosomal Protein mRNAs and Enhances Their Translation. Mol. Cell 2008, 30, 460–471. [Google Scholar] [CrossRef]
- Nishi, K.; Takahashi, T.; Suzawa, M.; Miyakawa, T.; Nagasawa, T.; Ming, Y.; Tanokura, M.; Ui-Tei, K. Control of the localization and function of a miRNA silencing component TNRC6A by Argonaute protein. Nucleic Acids Res. 2015, 43, 9856–9873. [Google Scholar] [CrossRef] [PubMed]
- Gagnon, K.T.; Li, L.; Chu, Y.; Janowski, B.A.; Corey, D.R. RNAi Factors Are Present and Active in Human Cell Nuclei. Cell Rep. 2014, 6, 211–221. [Google Scholar] [CrossRef]
- Barrey, E.; Saint-Auret, G.; Bonnamy, B.; Damas, D.; Boyer, O.; Gidrol, X. Pre-microRNA and Mature microRNA in Human Mitochondria. PLoS ONE 2011, 6, e20220. [Google Scholar] [CrossRef]
- Blazie, S.M.; Geissel, H.C.; Wilky, H.; Joshi, R.; Newbern, J.; Mangone, M. Alternative Polyadenylation Directs Tissue-Specific miRNA Targeting in Caenorhabditis elegans Somatic Tissues. Genetics 2017, 206, 757–774. [Google Scholar] [CrossRef]
- Fabbri, M.; Paone, A.; Calore, F.; Galli, R.; Gaudio, E.; Santhanam, R.; Lovat, F.; Fadda, P.; Mao, C.; Nuovo, G.J.; et al. MicroRNAs bind to Toll-like receptors to induce prometastatic inflammatory response. Proc. Natl. Acad. Sci. USA 2012, 109, 2110. [Google Scholar] [CrossRef] [PubMed]
- Lehmann, S.M.; Krüger, C.; Park, B.; Derkow, K.; Rosenberger, K.; Baumgart, J.; Trimbuch, T.; Eom, G.; Hinz, M.; Kaul, D.; et al. An unconventional role for miRNA: Let-7 activates Toll-like receptor 7 and causes neurodegeneration. Nat. Neurosci. 2012, 15, 827–835. [Google Scholar] [CrossRef] [PubMed]
- Wallach, T.; Mossmann, Z.J.; Szczepek, M.; Wetzel, M.; Machado, R.; Raden, M.; Miladi, M.; Kleinau, G.; Krüger, C.; Dembny, P.; et al. MicroRNA-100-5p and microRNA-298-5p released from apoptotic cortical neurons are endogenous Toll-like receptor 7/8 ligands that contribute to neurodegeneration. Mol. Neurodegener. 2021, 16, 80. [Google Scholar] [CrossRef]
- Sohn, W.; Kim, J.; Kang, S.H.; Yang, S.R.; Cho, J.; Cho, H.C.; Shim, S.G.; Paik, Y. Serum exosomal microRNAs as novel biomarkers for hepatocellular carcinoma. Exp. Mol. Med. 2015, 47, e184. [Google Scholar] [CrossRef] [PubMed]
- Iftikhar, H.; Carney, G.E. Evidence and potential in vivo functions for biofluid miRNAs: From expression profiling to functional testing: Potential roles of extracellular miRNAs as indicators of physiological change and as agents of intercellular information exchange. Bioessays 2016, 38, 367–378. [Google Scholar] [CrossRef]
- Roderburg, C.; Luedde, T. Circulating microRNAs as markers of liver inflammation, fibrosis and cancer. J. Hepatol. 2014, 61, 1434–1437. [Google Scholar] [CrossRef]
- Chim, S.S.C.; Shing, T.K.F.; Hung, E.C.W.; Leung, T.; Lau, T.; Chiu, R.W.K.; Dennis Lo, Y.M. Detection and Characterization of Placental MicroRNAs in Maternal Plasma. Clin. Chem. 2008, 54, 482–490. [Google Scholar] [CrossRef]
- Chen, X.; Ba, Y.; Ma, L.; Cai, X.; Yin, Y.; Wang, K.; Guo, J.; Zhang, Y.; Chen, J.; Guo, X.; et al. Characterization of microRNAs in serum: A novel class of biomarkers for diagnosis of cancer and other diseases. Cell Res. 2008, 18, 997–1006. [Google Scholar] [CrossRef]
- Arroyo, J.D.; Chevillet, J.R.; Kroh, E.M.; Ruf, I.K.; Pritchard, C.C.; Gibson, D.F.; Mitchell, P.S.; Bennett, C.F.; Pogosova-Agadjanyan, E.L.; Stirewalt, D.L.; et al. Argonaute2 complexes carry a population of circulating microRNAs independent of vesicles in human plasma. Proc. Natl. Acad. Sci. USA 2011, 108, 5003–5008. [Google Scholar] [CrossRef]
- Cogswell, J.P.; Ward, J.; Taylor, I.A.; Waters, M.; Shi, Y.; Cannon, B.; Kelnar, K.; Kemppainen, J.; Brown, D.; Chen, C.; et al. Identification of miRNA Changes in Alzheimer’s Disease Brain and CSF Yields Putative Biomarkers and Insights into Disease Pathways. J. Alzheimer’s Dis. 2008, 14, 27–41. [Google Scholar] [CrossRef]
- Gallo, A.; Tandon, M.; Alevizos, I.; Illei, G.G. The majority of microRNAs detectable in serum and saliva is concentrated in exosomes. PLoS ONE 2012, 7, e30679. [Google Scholar] [CrossRef]
- Zhou, Q.; Li, M.; Wang, X.; Li, Q.; Wang, T.; Zhu, Q.; Zhou, X.; Wang, X.; Gao, X.; Li, X. Immune-related MicroRNAs are Abundant in Breast Milk Exosomes. Int. J. Biol. Sci. 2012, 8, 118–123. [Google Scholar] [CrossRef] [PubMed]
- Weber, J.A.; Baxter, D.H.; Zhang, S.; Huang, D.Y.; Huang, K.H.; Lee, M.J.; Galas, D.J.; Wang, K. The MicroRNA Spectrum in 12 Body Fluids. Clin. Chem. 2010, 56, 1733–1741. [Google Scholar] [CrossRef] [PubMed]
- Vickers, K.C.; Palmisano, B.T.; Shoucri, B.M.; Shamburek, R.D.; Remaley, A.T. MicroRNAs are transported in plasma and delivered to recipient cells by high-density lipoproteins. Nat. Cell Biol. 2011, 13, 423–433. [Google Scholar] [CrossRef] [PubMed]
- Tabet, F.; Vickers, K.C.; Cuesta Torres, L.F.; Wiese, C.B.; Shoucri, B.M.; Lambert, G.; Catherinet, C.; Prado-Lourenco, L.; Levin, M.G.; Thacker, S.; et al. HDL-transferred microRNA-223 regulates ICAM-1 expression in endothelial cells. Nat. Commun. 2014, 5, 3292. [Google Scholar] [CrossRef]
- Turchinovich, A.; Weiz, L.; Langheinz, A.; Burwinkel, B. Characterization of extracellular circulating microRNA. Nucleic Acids Res. 2011, 39, 7223–7233. [Google Scholar] [CrossRef]
- Deatherage, B.L.; Cookson, B.T. Membrane vesicle release in bacteria, eukaryotes, and archaea: A conserved yet underappreciated aspect of microbial life. Infect. Immun. 2012, 80, 1948–1957. [Google Scholar] [CrossRef]
- Todorova, D.; Simoncini, S.; Lacroix, R.; Sabatier, F.; Dignat-George, F. Extracellular Vesicles in Angiogenesis. Circ. Res. 2017, 120, 1658–1673. [Google Scholar] [CrossRef]
- Santavanond, J.P.; Rutter, S.F.; Atkin-Smith, G.K.; Poon, I.K.H. Apoptotic Bodies: Mechanism of Formation, Isolation and Functional Relevance. Subcell. Biochem. 2021, 97, 61–88. [Google Scholar] [CrossRef]
- Cocucci, E.; Racchetti, G.; Meldolesi, J. Shedding microvesicles: Artefacts no more. Trends Cell Biol. 2009, 19, 43–51. [Google Scholar] [CrossRef]
- Muralidharan-Chari, V.; Clancy, J.W.; Sedgwick, A.; D’Souza-Schorey, C. Microvesicles: Mediators of extracellular communication during cancer progression. J. Cell Sci. 2010, 123, 1603–1611. [Google Scholar] [CrossRef]
- Simons, M.; Raposo, G. Exosomes--vesicular carriers for intercellular communication. Curr. Opin. Cell Biol. 2009, 21, 575–581. [Google Scholar] [CrossRef] [PubMed]
- Théry, C.; Zitvogel, L.; Amigorena, S. Exosomes: Composition, biogenesis and function. Nat. Rev. Immunol. 2002, 2, 569–579. [Google Scholar] [CrossRef] [PubMed]
- O’Brien, K.; Breyne, K.; Ughetto, S.; Laurent, L.C.; Breakefield, X.O. RNA delivery by extracellular vesicles in mammalian cells and its applications. Nat. Rev. Mol. Cell Biol. 2020, 21, 585–606. [Google Scholar] [CrossRef] [PubMed]
- Hu, Z.; Chen, X.; Zhao, Y.; Tian, T.; Jin, G.; Shu, Y.; Chen, Y.; Xu, L.; Zen, K.; Zhang, C.; et al. Serum microRNA signatures identified in a genome-wide serum microRNA expression profiling predict survival of non-small-cell lung cancer. J. Clin. Oncol. 2010, 28, 1721–1726. [Google Scholar] [CrossRef]
- Pigati, L.; Yaddanapudi, S.C.S.; Iyengar, R.; Kim, D.; Hearn, S.A.; Danforth, D.; Hastings, M.L.; Duelli, D.M. Selective release of microRNA species from normal and malignant mammary epithelial cells. PLoS ONE 2010, 5, e13515. [Google Scholar] [CrossRef]
- Jomova, K.; Raptova, R.; Alomar, S.Y.; Alwasel, S.H.; Nepovimova, E.; Kuca, K.; Valko, M. Reactive oxygen species, toxicity, oxidative stress, and antioxidants: Chronic diseases and aging. Arch. Toxicol. 2023, 97, 2499–2574. [Google Scholar] [CrossRef]
- Jakubczyk, K.; Dec, K.; Kałduńska, J.; Kawczuga, D.; Kochman, J.; Janda, K. Reactive oxygen species—Sources, functions, oxidative damage. Pol. Merkur. Lek. 2020, 48, 124–127. [Google Scholar]
- Hahm, J.Y.; Park, J.; Jang, E.; Chi, S.W. 8-Oxoguanine: From oxidative damage to epigenetic and epitranscriptional modification. Exp. Mol. Med. 2022, 54, 1626–1642. [Google Scholar] [CrossRef]
- Cadet, J.; Douki, T.; Ravanat, J.; Wagner, J.R. Measurement of oxidatively generated base damage to nucleic acids in cells: Facts and artifacts. Bioanal. Rev. 2012, 4, 55–74. [Google Scholar] [CrossRef]
- Li, Z.; Chen, X.; Liu, Z.; Ye, W.; Li, L.; Qian, L.; Ding, H.; Li, P.; Aung, L.H.H. Recent Advances: Molecular Mechanism of RNA Oxidation and Its Role in Various Diseases. Front. Mol. Biosci. 2020, 7, 184. [Google Scholar] [CrossRef]
- Contreras, L.M.; Belfort, M. RNA dynamics in oxidative stress: From obscurity to mechanistic understanding in health and disease. Proc. Natl. Acad. Sci. USA 2024, 121, e2420445121. [Google Scholar] [CrossRef]
- Seok, H.; Lee, H.; Lee, S.; Ahn, S.H.; Lee, H.; Kim, G.D.; Peak, J.; Park, J.; Cho, Y.K.; Jeong, Y.; et al. Position-specific oxidation of miR-1 encodes cardiac hypertrophy. Nature 2020, 584, 279–285. [Google Scholar] [CrossRef]
- MicroRNA: Redox Interplay in Skeletal Muscle Homeostasis. Available online: https://www.physoc.org/abstracts/microrna-redox-interplay-in-skeletal-muscle-homeostasis/ (accessed on 14 February 2025).
- Du, J.; Li, M.; Huang, Q.; Liu, W.; Li, W.; Li, Y.; Gong, Z. The critical role of microRNAs in stress response: Therapeutic prospect and limitation. Pharmacol. Res. 2019, 142, 294–302. [Google Scholar] [CrossRef]
- Ruiz, G.P.; Camara, H.; Fazolini, N.P.B.; Mori, M.A. Extracellular miRNAs in redox signaling: Health, disease and potential therapies. Free Radic. Biol. Med. 2021, 173, 170–187. [Google Scholar] [CrossRef] [PubMed]
- Wang, J.; Gao, J.; Ding, S.; Wang, K.; Jiao, J.; Wang, Y.; Sun, T.; Zhou, L.; Long, B.; Zhang, X.; et al. Oxidative Modification of miR-184 Enables It to Target Bcl-xL and Bcl-w. Mol. Cell 2015, 59, 50–61. [Google Scholar] [CrossRef] [PubMed]
- Liu, Z.; Chen, X.; Li, Z.; Ye, W.; Ding, H.; Li, P.; Aung, L.H.H. Role of RNA Oxidation in Neurodegenerative Diseases. Int. J. Mol. Sci. 2020, 21, 5022. [Google Scholar] [CrossRef]
- Nunomura, A.; Chiba, S.; Lippa, C.F.; Cras, P.; Kalaria, R.N.; Takeda, A.; Honda, K.; Smith, M.A.; Perry, G. Neuronal RNA oxidation is a prominent feature of familial Alzheimer’s disease. Neurobiol. Dis. 2004, 17, 108–113. [Google Scholar] [CrossRef]
- Catalanotto, C.; Cogoni, C.; Zardo, G. MicroRNA in Control of Gene Expression: An Overview of Nuclear Functions. Int. J. Mol. Sci. 2016, 17, 1712. [Google Scholar] [CrossRef]
- Hollins, S.L.; Cairns, M.J. MicroRNA: Small RNA mediators of the brains genomic response to environmental stress. Prog. Neurobiol. 2016, 143, 61–81. [Google Scholar] [CrossRef]
- Vilardo, E.; Barbato, C.; Ciotti, M.; Cogoni, C.; Ruberti, F. MicroRNA-101 regulates amyloid precursor protein expression in hippocampal neurons. J. Biol. Chem. 2010, 285, 18344–18351. [Google Scholar] [CrossRef] [PubMed]
- Hébert, S.S.; Horré, K.; Nicolaï, L.; Bergmans, B.; Papadopoulou, A.S.; Delacourte, A.; De Strooper, B. MicroRNA regulation of Alzheimer’s Amyloid precursor protein expression. Neurobiol. Dis. 2009, 33, 422–428. [Google Scholar] [CrossRef]
- Zhang, J.; Wang, R. Deregulated lncRNA MAGI2-AS3 in Alzheimer’s disease attenuates amyloid-β induced neurotoxicity and neuroinflammation by sponging miR-374b-5p. Exp. Gerontol. 2021, 144, 111180. [Google Scholar] [CrossRef] [PubMed]
- An, F.; Gong, G.; Wang, Y.; Bian, M.; Yu, L.; Wei, C. MiR-124 acts as a target for Alzheimer’s disease by regulating BACE1. Oncotarget 2017, 8, 114065–114071. [Google Scholar] [CrossRef]
- Zhong, Z.; Yuan, K.; Tong, X.; Hu, J.; Song, Z.; Zhang, G.; Fang, X.; Zhang, W. MiR-16 attenuates β-amyloid-induced neurotoxicity through targeting β-site amyloid precursor protein-cleaving enzyme 1 in an Alzheimer’s disease cell model. Neuroreport 2018, 29, 1365–1372. [Google Scholar] [CrossRef]
- Gong, G.; An, F.; Wang, Y.; Bian, M.; Yu, L.; Wei, C. miR-15b represses BACE1 expression in sporadic Alzheimer’s disease. Oncotarget 2017, 8, 91551–91557. [Google Scholar] [CrossRef] [PubMed]
- Li, P.; Xu, Y.; Wang, B.; Huang, J.; Li, Q. miR-34a-5p and miR-125b-5p attenuate Aβ-induced neurotoxicity through targeting BACE1. J. Neurol. Sci. 2020, 413, 116793. [Google Scholar] [CrossRef]
- Du, W.; Lei, C.; Dong, Y. MicroRNA-149 is downregulated in Alzheimer’s disease and inhibits β-amyloid accumulation and ameliorates neuronal viability through targeting BACE1. Genet. Mol. Biol. 2021, 44, e20200064. [Google Scholar] [CrossRef]
- Salta, E.; De Strooper, B. microRNA-132: A key noncoding RNA operating in the cellular phase of Alzheimer’s disease. FASEB J. 2017, 31, 424–433. [Google Scholar] [CrossRef]
- Banzhaf-Strathmann, J.; Benito, E.; May, S.; Arzberger, T.; Tahirovic, S.; Kretzschmar, H.; Fischer, A.; Edbauer, D. MicroRNA-125b induces tau hyperphosphorylation and cognitive deficits in Alzheimer’s disease. EMBO J. 2014, 33, 1667–1680. [Google Scholar] [CrossRef]
- Smith, P.Y.; Hernandez-Rapp, J.; Jolivette, F.; Lecours, C.; Bisht, K.; Goupil, C.; Dorval, V.; Parsi, S.; Morin, F.; Planel, E.; et al. miR-132/212 deficiency impairs tau metabolism and promotes pathological aggregation in vivo. Hum. Mol. Genet. 2015, 24, 6721–6735. [Google Scholar] [CrossRef] [PubMed]
- Nagaraj, S.; Want, A.; Laskowska-Kaszub, K.; Fesiuk, A.; Vaz, S.; Logarinho, E.; Wojda, U. Candidate Alzheimer’s Disease Biomarker miR-483-5p Lowers TAU Phosphorylation by Direct ERK1/2 Repression. Int. J. Mol. Sci. 2021, 22, 3653. [Google Scholar] [CrossRef] [PubMed]
- Zhao, H.; Feng, L.; Zhong, W.; Zhen, H.; Chi, Q.; Wang, X. Hyperphosphorylation of Tau Due to the Interference of Protein Phosphatase Methylesterase-1 Overexpression by MiR-125b-5p in Melatonin Receptor Knockout Mice. Int. J. Mol. Sci. 2021, 22, 11850. [Google Scholar] [CrossRef]
- Pan, K.; Chen, S.; Wang, Y.; Yao, W.; Gao, X. MicroRNA-23b attenuates tau pathology and inhibits oxidative stress by targeting GnT-III in Alzheimer’s disease. Neuropharmacology 2021, 196, 108671. [Google Scholar] [CrossRef] [PubMed]
- Zhang, R.; Zhou, H.; Jiang, L.; Mao, Y.; Cui, X.; Xie, B.; Cui, D.; Wang, H.; Zhang, Q.; Xu, S. MiR-195 dependent roles of mitofusin2 in the mitochondrial dysfunction of hippocampal neurons in SAMP8 mice. Brain Res. 2016, 1652, 135–143. [Google Scholar] [CrossRef]
- Kim, Y.; Kim, S.H.; Park, Y.; Park, J.; Lee, J.H.; Kim, B.C.; Song, W.K. miR-16-5p is upregulated by amyloid β deposition in Alzheimer’s disease models and induces neuronal cell apoptosis through direct targeting and suppression of BCL-2. Exp. Gerontol. 2020, 136, 110954. [Google Scholar] [CrossRef]
- Aschrafi, A.; Schwechter, A.D.; Mameza, M.G.; Natera-Naranjo, O.; Gioio, A.E.; Kaplan, B.B. MicroRNA-338 regulates local cytochrome c oxidase IV mRNA levels and oxidative phosphorylation in the axons of sympathetic neurons. J. Neurosci. 2008, 28, 12581–12590. [Google Scholar] [CrossRef]
- Sarkar, S.; Jun, S.; Rellick, S.; Quintana, D.D.; Cavendish, J.Z.; Simpkins, J.W. Expression of microRNA-34a in Alzheimer’s disease brain targets genes linked to synaptic plasticity, energy metabolism, and resting state network activity. Brain Res. 2016, 1646, 139–151. [Google Scholar] [CrossRef]
- Watts, M.E.; Williams, S.M.; Nithianantharajah, J.; Claudianos, C. Hypoxia-Induced MicroRNA-210 Targets Neurodegenerative Pathways. Noncoding RNA 2018, 4, 10. [Google Scholar] [CrossRef]
- Siedlecki-Wullich, D.; Català-Solsona, J.; Fábregas, C.; Hernández, I.; Clarimon, J.; Lleó, A.; Boada, M.; Saura, C.A.; Rodríguez-Álvarez, J.; Miñano-Molina, A.J. Altered microRNAs related to synaptic function as potential plasma biomarkers for Alzheimer’s disease. Alzheimers Res. Ther. 2019, 11, 46. [Google Scholar] [CrossRef]
- Wu, H.Z.Y.; Thalamuthu, A.; Cheng, L.; Fowler, C.; Masters, C.L.; Sachdev, P.; Mather, K.A. Differential blood miRNA expression in brain amyloid imaging-defined Alzheimer’s disease and controls. Alzheimer’s Res. Ther. 2020, 12, 59. [Google Scholar] [CrossRef]
- Vergallo, A.; Lista, S.; Zhao, Y.; Lemercier, P.; Teipel, S.J.; Potier, M.; Habert, M.; Dubois, B.; Lukiw, W.J.; Hampel, H. MiRNA-15b and miRNA-125b are associated with regional Aβ-PET and FDG-PET uptake in cognitively normal individuals with subjective memory complaints. Transl. Psychiatry 2021, 11, 78. [Google Scholar] [CrossRef] [PubMed]
- Tan, M.S.; Cheah, P.; Chin, A.; Looi, L.; Chang, S. Differential Expression Analysis of Blood MicroRNA in Identifying Potential Genes Relevant to Alzheimer’s Disease Pathogenesis, Using an Integrated Bioinformatics and Machine Learning Approach. Appl. Sci. 2023, 13, 3071. [Google Scholar] [CrossRef]
- Ge, X.; Yao, T.; Zhang, C.; Wang, Q.; Wang, X.; Xu, L. Human microRNA-4433 (hsa-miR-4443) Targets 18 Genes to be a Risk Factor of Neurodegenerative Diseases. Curr. Alzheimer Res. 2022, 19, 511–522. [Google Scholar] [CrossRef] [PubMed]
- Sproviero, D.; Gagliardi, S.; Zucca, S.; Arigoni, M.; Giannini, M.; Garofalo, M.; Olivero, M.; Dell’Orco, M.; Pansarasa, O.; Bernuzzi, S.; et al. Different miRNA Profiles in Plasma Derived Small and Large Extracellular Vesicles from Patients with Neurodegenerative Diseases. Int. J. Mol. Sci. 2021, 22, 2737. [Google Scholar] [CrossRef] [PubMed]
- Cheng, L.; Doecke, J.D.; Sharples, R.A.; Villemagne, V.L.; Fowler, C.J.; Rembach, A.; Martins, R.N.; Rowe, C.C.; Macaulay, S.L.; Masters, C.L.; et al. Prognostic serum miRNA biomarkers associated with Alzheimer’s disease shows concordance with neuropsychological and neuroimaging assessment. Mol. Psychiatry 2015, 20, 1188–1196. [Google Scholar] [CrossRef]
- Swarbrick, S.; Wragg, N.; Ghosh, S.; Stolzing, A. Systematic Review of miRNA as Biomarkers in Alzheimer’s Disease. Mol. Neurobiol. 2019, 56, 6156–6167. [Google Scholar] [CrossRef]
- Yoon, S.; Kim, S.E.; Ko, Y.; Jeong, G.H.; Lee, K.H.; Lee, J.; Solmi, M.; Jacob, L.; Smith, L.; Stickley, A.; et al. Differential expression of MicroRNAs in Alzheimer’s disease: A systematic review and meta-analysis. Mol. Psychiatry 2022, 27, 2405–2413. [Google Scholar] [CrossRef]
- Gámez-Valero, A.; Campdelacreu, J.; Vilas, D.; Ispierto, L.; Reñé, R.; Álvarez, R.; Armengol, M.P.; Borràs, F.E.; Beyer, K. Exploratory study on microRNA profiles from plasma-derived extracellular vesicles in Alzheimer’s disease and dementia with Lewy bodies. Transl. Neurodegener. 2019, 8, 31. [Google Scholar] [CrossRef]
- Li, F.; Xie, X.; Sui, X.; Wang, P.; Chen, Z.; Zhang, J. Profile of Pathogenic Proteins and MicroRNAs in Plasma-derived Extracellular Vesicles in Alzheimer’s Disease: A Pilot Study. Neuroscience 2020, 432, 240–246. [Google Scholar] [CrossRef]
- Visconte, C.; Fenoglio, C.; Serpente, M.; Muti, P.; Sacconi, A.; Rigoni, M.; Arighi, A.; Borracci, V.; Arcaro, M.; Arosio, B.; et al. Altered Extracellular Vesicle miRNA Profile in Prodromal Alzheimer’s Disease. Int. J. Mol. Sci. 2023, 24, 14749. [Google Scholar] [CrossRef] [PubMed]
- Serpente, M.; Fenoglio, C.; D’Anca, M.; Arcaro, M.; Sorrentino, F.; Visconte, C.; Arighi, A.; Fumagalli, G.G.; Porretti, L.; Cattaneo, A.; et al. MiRNA Profiling in Plasma Neural-Derived Small Extracellular Vesicles from Patients with Alzheimer’s Disease. Cells 2020, 9, 1443. [Google Scholar] [CrossRef]
- Kumar, A.; Su, Y.; Sharma, M.; Singh, S.; Kim, S.; Peavey, J.J.; Suerken, C.K.; Lockhart, S.N.; Whitlow, C.T.; Craft, S.; et al. MicroRNA expression in extracellular vesicles as a novel blood-based biomarker for Alzheimer’s disease. Alzheimers Dement. 2023, 19, 4952–4966. [Google Scholar] [CrossRef]
- Liu, S.; Park, T.; Krüger, D.M.; Pena-Centeno, T.; Burkhardt, S.; Schutz, A.; Huang, Y.; Rosewood, T.; Chaudhuri, S.; Cho, M.; et al. Plasma miRNAs across the Alzheimer’s disease continuum: Relationship to central biomarkers. Alzheimers Dement. 2024, 20, 7698–7714. [Google Scholar] [CrossRef] [PubMed]
- Pang, X.; Zhao, Y.; Wang, J.; Zhou, Q.; Xu, L.; Kang, D.; Liu, A.; Du, G. The Bioinformatic Analysis of the Dysregulated Genes and MicroRNAs in Entorhinal Cortex, Hippocampus, and Blood for Alzheimer’s Disease. Biomed. Res. Int. 2017, 2017, 9084507. [Google Scholar] [CrossRef]
- Alamro, H.; Thafar, M.A.; Albaradei, S.; Gojobori, T.; Essack, M.; Gao, X. Exploiting machine learning models to identify novel Alzheimer’s disease biomarkers and potential targets. Sci. Rep. 2023, 13, 4979. [Google Scholar] [CrossRef]
- Durur, D.Y.; Tastan, B.; Ugur Tufekci, K.; Olcum, M.; Uzuner, H.; Karakülah, G.; Yener, G.; Genc, S. Alteration of miRNAs in Small Neuron-Derived Extracellular Vesicles of Alzheimer’s Disease Patients and the Effect of Extracellular Vesicles on Microglial Immune Responses. J. Mol. Neurosci. 2022, 72, 1182–1194. [Google Scholar] [CrossRef]
- Li, K.; Chi, R.; Liu, L.; Feng, M.; Su, K.; Li, X.; He, G.; Shi, Y. 3D genome-selected microRNAs to improve Alzheimer’s disease prediction. Front. Neurol. 2023, 14, 1059492. [Google Scholar] [CrossRef]
- Li, Z.; Guo, W.; Ding, S.; Chen, L.; Feng, K.; Huang, T.; Cai, Y. Identifying Key MicroRNA Signatures for Neurodegenerative Diseases With Machine Learning Methods. Front. Genet. 2022, 13, 880997. [Google Scholar] [CrossRef]
- Yuen, S.C.; Liang, X.; Zhu, H.; Jia, Y.; Leung, S. Prediction of differentially expressed microRNAs in blood as potential biomarkers for Alzheimer’s disease by meta-analysis and adaptive boosting ensemble learning. Alzheimer’s Res. Ther. 2021, 13, 126. [Google Scholar] [CrossRef]
- El Idrissi, F.; Gressier, B.; Devos, D.; Belarbi, K. A Computational Exploration of the Molecular Network Associated to Neuroinflammation in Alzheimer’s Disease. Front. Pharmacol. 2021, 12, 630003. [Google Scholar] [CrossRef]
- Iqbal, S.; Malik, M.Z.; Pal, D. Network-based identification of miRNAs and transcription factors and in silico drug screening targeting δ-secretase involved in Alzheimer’s disease. Heliyon 2021, 7, e08502. [Google Scholar] [CrossRef] [PubMed]
- Zhang, Q.; Chen, B.; Yang, P.; Wu, J.; Pang, X.; Pang, C. Bioinformatics-based study reveals that AP2M1 is regulated by the circRNA-miRNA-mRNA interaction network and affects Alzheimer’s disease. Front. Genet. 2022, 13, 1049786. [Google Scholar] [CrossRef]
- Lin, F.; Zhang, H.; Bao, J.; Li, L. Identification of Potential Diagnostic miRNAs Biomarkers for Alzheimer Disease Based on Weighted Gene Coexpression Network Analysis. World Neurosurg. 2021, 153, e315–e328. [Google Scholar] [CrossRef]
- Chang, W.; Wang, Y.; Zhu, X.; Wu, C. Genome-Wide Profiling of miRNA and mRNA Expression in Alzheimer’s Disease. Med. Sci. Monit. 2017, 23, 2721–2731. [Google Scholar] [CrossRef]
- Moradifard, S.; Hoseinbeyki, M.; Ganji, S.M.; Minuchehr, Z. Analysis of microRNA and Gene Expression Profiles in Alzheimer’s Disease: A Meta-Analysis Approach. Sci. Rep. 2018, 8, 4767. [Google Scholar] [CrossRef]
- Wang, W.; Rajeev, B.W.; Stromberg, A.J.; Ren, N.; Tang, G.; Huang, Q.; Rigoutsos, I.; Nelson, P.T. The Expression of MicroRNA miR-107 Decreases Early in Alzheimer’s Disease and May Accelerate Disease Progression through Regulation of β-Site Amyloid Precursor Protein-Cleaving Enzyme 1. J. Neurosci. 2008, 28, 1213–1223. [Google Scholar] [CrossRef]
- Pritchard, C.C.; Cheng, H.H.; Tewari, M. MicroRNA profiling: Approaches and considerations. Nat. Rev. Genet. 2012, 13, 358–369. [Google Scholar] [CrossRef]
- Love, M.I.; Huber, W.; Anders, S. Moderated estimation of fold change and dispersion for RNA-seq data with DESeq2. Genome Biol. 2014, 15, 550. [Google Scholar] [CrossRef]
- Ritchie, M.E.; Phipson, B.; Wu, D.; Hu, Y.; Law, C.W.; Shi, W.; Smyth, G.K. limma powers differential expression analyses for RNA-sequencing and microarray studies. Nucleic Acids Res. 2015, 43, e47. [Google Scholar] [CrossRef]
- Zhou, X.; Tuck, D.P. MSVM-RFE: Extensions of SVM-RFE for multiclass gene selection on DNA microarray data. Bioinformatics 2007, 23, 1106–1114. [Google Scholar] [CrossRef] [PubMed]
- Pruneski, J.A.; Pareek, A.; Kunze, K.N.; Martin, R.K.; Karlsson, J.; Oeding, J.F.; Kiapour, A.M.; Nwachukwu, B.U.; Williams, R.J. Supervised machine learning and associated algorithms: Applications in orthopedic surgery. Knee Surg. Sports Traumatol. Arthrosc. 2023, 31, 1196–1202. [Google Scholar] [CrossRef]
- Lo Vercio, L.; Amador, K.; Bannister, J.J.; Crites, S.; Gutierrez, A.; MacDonald, M.E.; Moore, J.; Mouches, P.; Rajashekar, D.; Schimert, S.; et al. Supervised machine learning tools: A tutorial for clinicians. J. Neural Eng. 2020, 17, 062001. [Google Scholar] [CrossRef] [PubMed]
- Uddin, S.; Khan, A.; Hossain, M.E.; Moni, M.A. Comparing different supervised machine learning algorithms for disease prediction. BMC Med. Inform. Decis. Mak. 2019, 19, 281. [Google Scholar] [CrossRef]
- Pareek, J.; Jacob, J. Data Compression and Visualization Using PCA and T-SNE; Goar, V., Kuri, M., Kumar, R., Senjyu, T., Eds.; Springer: Singapore, 2021; pp. 327–337. [Google Scholar]
- Vasquez, M.M.; Hu, C.; Roe, D.J.; Chen, Z.; Halonen, M.; Guerra, S. Least absolute shrinkage and selection operator type methods for the identification of serum biomarkers of overweight and obesity: Simulation and application. BMC Med. Res. Methodol. 2016, 16, 154. [Google Scholar] [CrossRef]
- Sokolova, M.; Lapalme, G. A systematic analysis of performance measures for classification tasks. Inf. Process. Manag. 2009, 45, 427–437. [Google Scholar] [CrossRef]
- Vimbi, V.; Shaffi, N.; Mahmud, M. Interpreting artificial intelligence models: A systematic review on the application of LIME and SHAP in Alzheimer’s disease detection. Brain Inform. 2024, 11, 10. [Google Scholar] [CrossRef]
- Liu, D.; Huang, Y.; Nie, W.; Zhang, J.; Deng, L. SMALF: miRNA-disease associations prediction based on stacked autoencoder and XGBoost. BMC Bioinform. 2021, 22, 219. [Google Scholar] [CrossRef]
- Li, G.; Zhang, J.; Liu, D.; Wei, Q.; Wang, H.; Lv, Y.; Ye, Z.; Liu, G.; Li, L. Identification of Hub Genes and Potential ceRNA Networks of Diabetic Nephropathy by Weighted Gene Co-Expression Network Analysis. Front. Genet. 2021, 12, 767654. [Google Scholar] [CrossRef]
- Hou, J.; Liang, W.Y.; Xiong, S.; Long, P.; Yue, T.; Wen, X.; Wang, T.; Deng, H. Identification of hub genes and potential ceRNA networks of diabetic cardiomyopathy. Sci. Rep. 2023, 13, 10258. [Google Scholar] [CrossRef]
- Qu, Q.; Sun, J.; Zhang, Z.; Su, Y.; Li, S.; Li, F.; Wang, R. Hub microRNAs and genes in the development of atrial fibrillation identified by weighted gene co-expression network analysis. BMC Med. Genom. 2021, 14, 271. [Google Scholar] [CrossRef]
- Wang, Z.; Shen, L.; Wang, Y.; Huang, S. Integrated analysis of miRNA and mRNA expression in the blood of patients with Alzheimer’s disease. Mol. Med. Rep. 2020, 22, 1053–1062. [Google Scholar] [CrossRef] [PubMed]
- Langfelder, P.; Horvath, S. WGCNA: An R package for weighted correlation network analysis. BMC Bioinform. 2008, 9, 559. [Google Scholar] [CrossRef] [PubMed]
- Pascut, D.; Pratama, M.Y.; Gilardi, F.; Giuffrè, M.; Crocè, L.S.; Tiribelli, C. Weighted miRNA co-expression networks analysis identifies circulating miRNA predicting overall survival in hepatocellular carcinoma patients. Sci. Rep. 2020, 10, 18967. [Google Scholar] [CrossRef] [PubMed]
- Hu, R.; Yu, Q.; Zhou, S.; Yin, Y.; Hu, R.; Lu, H.; Hu, B. Co-expression Network Analysis Reveals Novel Genes Underlying Alzheimer’s Disease Pathogenesis. Front. Aging Neurosci. 2020, 12, 605961. [Google Scholar] [CrossRef]
- Yan, T.; Ding, F.; Zhao, Y. Integrated identification of key genes and pathways in Alzheimer’s disease via comprehensive bioinformatical analyses. Hereditas 2019, 156, 25. [Google Scholar] [CrossRef]
- Li, H.; Zou, L.; Shi, J.; Han, X. Bioinformatics analysis of differentially expressed genes and identification of an miRNA–mRNA network associated with entorhinal cortex and hippocampus in Alzheimer’s disease. Hereditas 2021, 158, 25. [Google Scholar] [CrossRef]
- Hu, Y.; Xin, J.; Hu, Y.; Zhang, L.; Wang, J. Analyzing the genes related to Alzheimer’s disease via a network and pathway-based approach. Alzheimer’s Res. Ther. 2017, 9, 29. [Google Scholar] [CrossRef]
- Agarwal, V.; Bell, G.W.; Nam, J.; Bartel, D.P. Predicting effective microRNA target sites in mammalian mRNAs. eLife 2015, 4, e05005. [Google Scholar] [CrossRef]
- Hsu, S.; Lin, F.; Wu, W.; Liang, C.; Huang, W.; Chan, W.; Tsai, W.; Chen, G.; Lee, C.; Chiu, C.; et al. miRTarBase: A database curates experimentally validated microRNA–target interactions. Nucleic Acids Res. 2011, 39, D163–D169. [Google Scholar] [CrossRef]
- Kanehisa, M.; Goto, S. KEGG: Kyoto Encyclopedia of Genes and Genomes. Nucleic Acids Res. 2000, 28, 27–30. [Google Scholar] [CrossRef] [PubMed]
- Aleksander, S.A.; Balhoff, J.; Carbon, S.; Cherry, J.M.; Drabkin, H.J.; Ebert, D.; Feuermann, M.; Gaudet, P.; Harris, N.L.; Hill, D.P.; et al. The Gene Ontology knowledgebase in 2023. Genetics 2023, 224, iyad031. [Google Scholar] [CrossRef] [PubMed]
- Ashburner, M.; Ball, C.A.; Blake, J.A.; Botstein, D.; Butler, H.; Cherry, J.M.; Davis, A.P.; Dolinski, K.; Dwight, S.S.; Eppig, J.T.; et al. Gene Ontology: Tool for the unification of biology. Nat. Genet. 2000, 25, 25–29. [Google Scholar] [CrossRef] [PubMed]
- Croft, D.; O’Kelly, G.; Wu, G.; Haw, R.; Gillespie, M.; Matthews, L.; Caudy, M.; Garapati, P.; Gopinath, G.; Jassal, B.; et al. Reactome: A database of reactions, pathways and biological processes. Nucleic Acids Res. 2011, 39, D691–D697. [Google Scholar] [CrossRef]
- Bakulin, A.; Teyssier, N.B.; Kampmann, M.; Khoroshkin, M.; Goodarzi, H. pyPAGE: A framework for Addressing biases in gene-set enrichment analysis—A case study on Alzheimer’s disease. PLoS Comput. Biol. 2024, 20, e1012346. [Google Scholar] [CrossRef]
- Dong, Z.; Gu, H.; Guo, Q.; Liang, S.; Xue, J.; Yao, F.; Liu, X.; Li, F.; Liu, H.; Sun, L.; et al. Profiling of Serum Exosome MiRNA Reveals the Potential of a MiRNA Panel as Diagnostic Biomarker for Alzheimer’s Disease. Mol. Neurobiol. 2021, 58, 3084–3094. [Google Scholar] [CrossRef]
- Qin, H.; Hu, C.; Zhao, X.; Tian, M.; Zhu, B. Usefulness of candidate mRNAs and miRNAs as biomarkers for mild cognitive impairment and Alzheimer’s disease. Int. J. Neurosci. 2023, 133, 89–102. [Google Scholar] [CrossRef]
- Fan, J. Literature Mining of Disease Associated Noncoding RNA in the Omics Era. Molecules 2022, 27, 4710. [Google Scholar] [CrossRef]
- Bhasuran, B.; Manoharan, S.; Iyyappan, O.R.; Murugesan, G.; Prabahar, A.; Raja, K. Large Language Models and Genomics for Summarizing the Role of microRNA in Regulating mRNA Expression. Biomedicines 2024, 12, 1535. [Google Scholar] [CrossRef]
- Integrative Analysis of Key Candidate Genes and Signaling Pathways in Alzheimer’s Disease Related to Chronic Periodontitis Based on Analysis of GEO Dataset and Text Mining. Available online: https://www.researchsquare.com/article/rs-358537/v1 (accessed on 18 February 2025).
- Gupta, S.; Ross, K.E.; Tudor, C.O.; Wu, C.H.; Schmidt, C.J.; Vijay-Shanker, K. miRiaD: A Text Mining Tool for Detecting Associations of microRNAs with Diseases. J. Biomed. Semant. 2016, 7, 9. [Google Scholar] [CrossRef]
- Madan, S.; Kühnel, L.; Fröhlich, H.; Hofmann-Apitius, M.; Fluck, J. Dataset of miRNA–disease relations extracted from textual data using transformer-based neural networks. Database 2024, 2024, baae066. [Google Scholar] [CrossRef] [PubMed]
- Dong, B.; Sun, W.; Xu, D.; Wang, G.; Zhang, T. MDformer: A transformer-based method for predicting miRNA-Disease associations using multi-source feature fusion and maximal meta-path instances encoding. Comput. Biol. Med. 2023, 167, 107585. [Google Scholar] [CrossRef]
- Pang, S.; Zhuang, Y.; Qiao, S.; Wang, F.; Wang, S.; Lv, Z. DCTGM: A Novel Dual-channel Transformer Graph Model for miRNA-disease Association Prediction. Cogn. Comput. 2024, 16, 2009–2018. [Google Scholar] [CrossRef]
- Sheinerman, K.S.; Toledo, J.B.; Tsivinsky, V.G.; Irwin, D.; Grossman, M.; Weintraub, D.; Hurtig, H.I.; Chen-Plotkin, A.; Wolk, D.A.; McCluskey, L.F.; et al. Circulating brain-enriched microRNAs as novel biomarkers for detection and differentiation of neurodegenerative diseases. Alzheimers Res. Ther. 2017, 9, 89. [Google Scholar] [CrossRef] [PubMed]
- Denk, J.; Oberhauser, F.; Kornhuber, J.; Wiltfang, J.; Fassbender, K.; Schroeter, M.L.; Volk, A.E.; Diehl-Schmid, J.; Prudlo, J.; Danek, A.; et al. Specific serum and CSF microRNA profiles distinguish sporadic behavioural variant of frontotemporal dementia compared with Alzheimer patients and cognitively healthy controls. PLoS ONE 2018, 13, e0197329. [Google Scholar] [CrossRef]
- Grasso, M.; Piscopo, P.; Talarico, G.; Ricci, L.; Crestini, A.; Tosto, G.; Gasparini, M.; Bruno, G.; Denti, M.A.; Confaloni, A. Plasma microRNA profiling distinguishes patients with frontotemporal dementia from healthy subjects. Neurobiol. Aging 2019, 84, 240.e1–240.e12. [Google Scholar] [CrossRef]
- Kmetzsch, V.; Anquetil, V.; Saracino, D.; Rinaldi, D.; Camuzat, A.; Gareau, T.; Jornea, L.; Forlani, S.; Couratier, P.; Wallon, D.; et al. Plasma microRNA signature in presymptomatic and symptomatic subjects with C9orf72-associated frontotemporal dementia and amyotrophic lateral sclerosis. J. Neurol. Neurosurg. Psychiatry 2021, 92, 485–493. [Google Scholar] [CrossRef]
- Magen, I.; Yacovzada, N.; Warren, J.D.; Heller, C.; Swift, I.; Bobeva, Y.; Malaspina, A.; Rohrer, J.D.; Fratta, P.; Hornstein, E. microRNA-based predictor for diagnosis of frontotemporal dementia. Neuropathol. Appl. Neurobiol. 2023, 49, e12916. [Google Scholar] [CrossRef]
- Pounders, J.; Hill, E.J.; Hooper, D.; Zhang, X.; Biesiada, J.; Kuhnell, D.; Greenland, H.L.; Esfandiari, L.; Timmerman, E.; Foster, F.; et al. MicroRNA expression within neuronal-derived small extracellular vesicles in frontotemporal degeneration. Medicine 2022, 101, e30854. [Google Scholar] [CrossRef]
- Kmetzsch, V.; Latouche, M.; Saracino, D.; Rinaldi, D.; Camuzat, A.; Gareau, T.; Le Ber, I.; Colliot, O.; Becker, E. MicroRNA signatures in genetic frontotemporal dementia and amyotrophic lateral sclerosis. Ann. Clin. Transl. Neurol. 2022, 9, 1778–1791. [Google Scholar] [CrossRef]
- Broedbaek, K.; Weimann, A.; Stovgaard, E.S.; Poulsen, H.E. Urinary 8-oxo-7,8-dihydro-2′-deoxyguanosine as a biomarker in type 2 diabetes. Free Radic. Biol. Med. 2011, 51, 1473–1479. [Google Scholar] [CrossRef] [PubMed]
- Poulsen, H.E.; Weimann, A.; Henriksen, T.; Kjær, L.K.; Larsen, E.L.; Carlsson, E.R.; Christensen, C.K.; Brandslund, I.; Fenger, M. Oxidatively generated modifications to nucleic acids in vivo: Measurement in urine and plasma. Free Radic. Biol. Med. 2019, 145, 336–341. [Google Scholar] [CrossRef] [PubMed]
- Piscopo, P.; Grasso, M.; Puopolo, M.; D’Acunto, E.; Talarico, G.; Crestini, A.; Gasparini, M.; Campopiano, R.; Gambardella, S.; Castellano, A.E.; et al. Circulating miR-127-3p as a Potential Biomarker for Differential Diagnosis in Frontotemporal Dementia. J. Alzheimer’s Dis. 2018, 65, 455–464. [Google Scholar] [CrossRef] [PubMed]
- Swarup, V.; Hinz, F.I.; Rexach, J.E.; Noguchi, K.; Toyoshiba, H.; Oda, A.; Hirai, K.; Sarkar, A.; Seyfried, N.T.; Cheng, C.; et al. Identification of evolutionarily conserved gene networks mediating neurodegenerative dementia. Nat. Med. 2019, 25, 152–164. [Google Scholar] [CrossRef]
- Ferrari, R.; Forabosco, P.; Vandrovcova, J.; Botía, J.A.; Guelfi, S.; Warren, J.D.; Momeni, P.; Weale, M.E.; Ryten, M.; Hardy, J. Frontotemporal dementia: Insights into the biological underpinnings of disease through gene co-expression network analysis. Mol. Neurodegener. 2016, 11, 21. [Google Scholar] [CrossRef]
- Schneider, R.; McKeever, P.; Kim, T.; Graff, C.; van Swieten, J.C.; Karydas, A.; Boxer, A.; Rosen, H.; Miller, B.L.; Laforce Jr, R.; et al. Downregulation of exosomal miR-204-5p and miR-632 as a biomarker for FTD: A GENFI study. J. Neurol. Neurosurg. Psychiatry 2018, 89, 851–858. [Google Scholar] [CrossRef]
- Kaurani, L.; Pradhan, R.; Schröder, S.; Burkhardt, S.; Schuetz, A.; Krüger, D.M.; Pena, T.; Heutink, P.; Sananbenesi, F.; Fischer, A. A role for astrocytic miR-129-5p in Frontotemporal Dementia. BioRxiv2024. Available online: https://www.biorxiv.org/content/10.1101/2024.04.15.589528v1 (accessed on 20 February 2025).
- Moldovan, L.; Batte, K.E.; Trgovcich, J.; Wisler, J.; Marsh, C.B.; Piper, M. Methodological challenges in utilizing miRNAs as circulating biomarkers. J. Cell Mol. Med. 2014, 18, 371–390. [Google Scholar] [CrossRef]
- Singh, R.; Ramasubramanian, B.; Kanji, S.; Chakraborty, A.R.; Haque, S.J.; Chakravarti, A. Circulating microRNAs in cancer: Hope or hype? Cancer Lett. 2016, 381, 113–121. [Google Scholar] [CrossRef]
- Shende, V.R.; Goldrick, M.M.; Ramani, S.; Earnest, D.J. Expression and rhythmic modulation of circulating microRNAs targeting the clock gene Bmal1 in mice. PLoS ONE 2011, 6, e22586. [Google Scholar] [CrossRef]
- Moldovan, L.; Batte, K.; Wang, Y.; Wisler, J.; Piper, M. Analyzing the circulating microRNAs in exosomes/extracellular vesicles from serum or plasma by qRT-PCR. Methods Mol. Biol. 2013, 1024, 129–145. [Google Scholar] [CrossRef]
- Eldh, M.; Lötvall, J.; Malmhäll, C.; Ekström, K. Importance of RNA isolation methods for analysis of exosomal RNA: Evaluation of different methods. Mol. Immunol. 2012, 50, 278–286. [Google Scholar] [CrossRef] [PubMed]
- Jensen, S.G.; Lamy, P.; Rasmussen, M.H.; Ostenfeld, M.S.; Dyrskjøt, L.; Orntoft, T.F.; Andersen, C.L. Evaluation of two commercial global miRNA expression profiling platforms for detection of less abundant miRNAs. BMC Genom. 2011, 12, 435. [Google Scholar] [CrossRef] [PubMed]
- Willems, M.; Moshage, H.; Nevens, F.; Fevery, J.; Yap, S.H. Plasma collected from heparinized blood is not suitable for HCV-RNA detection by conventional RT-PCR assay. J. Virol. Methods 1993, 42, 127–130. [Google Scholar] [CrossRef] [PubMed]
- Masè, M.; Grasso, M.; Avogaro, L.; D’Amato, E.; Tessarolo, F.; Graffigna, A.; Denti, M.A.; Ravelli, F. Selection of reference genes is critical for miRNA expression analysis in human cardiac tissue. A focus on atrial fibrillation. Sci. Rep. 2017, 7, 41127. [Google Scholar] [CrossRef]
- Liu, C.; Calin, G.A.; Meloon, B.; Gamliel, N.; Sevignani, C.; Ferracin, M.; Dumitru, C.D.; Shimizu, M.; Zupo, S.; Dono, M.; et al. An oligonucleotide microchip for genome-wide microRNA profiling in human and mouse tissues. Proc. Natl. Acad. Sci. USA 2004, 101, 9740–9744. [Google Scholar] [CrossRef]

| miRNA | Direction of Changes | Biological Effects | Biological Specimen/Animal Models | References |
|---|---|---|---|---|
| miR-149 | ↓ | Target BACE1 to modulate Aβ production | SH-SY5Y | [89] |
| miR-34a-5p | ↓ | MCN, N2a | [88] | |
| miR-125b-5p | ↓ | |||
| miR-15b | ↓ | SH-SY5Y | [87] | |
| miR-16 | ↓ | AD brain, PC12, N2a | [86] | |
| miR-124 | ↓ | SH-SY5Y | [85] | |
| miR-374b-5p | ↓ | SH-SY5Y, BV2 | [84] | |
| miR-125b | ↑ | Promote tau phosphorylation | Rat hippocampal and cortical neurons | [91] |
| miR-483-5p | ↑ | HEK293 | [93] | |
| miR-16-5p | ↑ | Promote apoptosis via BCL-2 | 5xFAD mice, SH-SY5Y | [97] |
| miR-34a | ↑ | Modulate synaptic plasticity | AD brain, 3xTg-AD mice | [99] |
| miR-92a-3p | ↑ | Plasma samples | [101] | |
| miR-181c-5p | ↑ | |||
| miR-210-3p | ↑ | |||
| miR-146b-5p | ↓ | Modulate innate immune system and cytokine pathways | Whole blood | [102] |
| miR-15b-5p | ↓ | Target cell cycle and apoptosis | ||
| miR-6501-5p | ↓ | Modulate oxidative phosphorylation, mitochondrial dysfunction, and calcium-mediated signaling | Whole blood | [104] |
| miR-4433b-5p | ↓ | |||
| miR-143-3p | ↓ | |||
| miR-26b | ↓ | Associated with the immune system, cell cycle, gene expression, cellular response to stress, neuron growth factor signaling, Wnt signaling, cellular senescence, and Rho GTPases | Whole blood | [108] |
| miR-30e | ↑ | Exosomes and serum samples | ||
| miR-34a, miR-107 | ↓ | Plasma samples | ||
| miR-200c | ↑ | |||
| miR-34c | ↑ | Serum samples | ||
| miR-125b, miR-210, miR-485 | ↓ | |||
| miR-146a | ↓ | Plasma and serum samples | ||
| miR-30e-5p, miR-18b-5p, miR-424-5p, miR-582-5p, miR-335-5p, miR-20a-5p, miR-106a-5p, miR-361-5p, miR-15a-5p | ↑ | Associated with apoptosis, immune response, and inflammation | Whole blood | [109] |
| miR-29b-3p, miR-27b-3p, miR-221-3p, miR-146a-5p, miR-15b-3p, miR-31-5p, miR-9-5p, miR-107, miR-103a-3p, miR-1306-5p | ↓ | Whole blood | ||
| miR-451a, miR-21-5p, miR-23a-3p, miR-126-3p, let-7i-5p, miR-151a-3p | ↓ | Implicated in metabolic processes and protein phosphorylation | Plasma-derived EVs | [110] |
| miR-424-5p, miR-93-5p, miR-3065-5p | ↑ | N/A | Plasma-derived EVs | [111] |
| miR-1306-5p | ↓ | |||
| miR-106a-5p, miR-16-5p, miR-17-5p, miR-195-5p, miR-19b-3p, miR-20a-5p, miR-223-3p, miR-25-3p, miR-296-5p, miR-30b-5p, miR-532-3p, miR-92a-3p, miR-451a | ↑ | Regulate the TGF-β signaling pathway and apoptosis and suppress APP | Plasma-derived EVs | [112] |
| miR-23a-3p, miR-223-3p, miR-190a-5p | ↑ | Regulate axon guidance, long term depression, and calcium signaling | Plasma-derived EVs | [113] |
| miR-100-3p | ↓ | |||
| miR-106b-5p, miR-107, miR-135b-5p | ↑ | Target BACE1, promote neuronal damage (inducing hypoxia and M1-type microglia polarization), regulate cytokine and chemokine release from microglia, and control BBB integrity | Plasma-derived EVs | [114] |
| miR-29a-5p, miR-9-5p, miR-125b-5p, miR-132-5p, miR-210-3p | ↑↓ |
| miRNA | Methods | References |
|---|---|---|
| hsa-miR-6501-5p, hsa-miR-1296-5p, hsa-miR-1307-3p, hsa-miR-4433b-5p, and hsa-miR-143-3p | TMM normalization, differential expression with EdgeR 3.38.4, hybrid carss-SVMRFE feature selection, miRNA target prediction (DIANA-microT-CDS v5.0), KEGG pathway analysis (DIANA-miRPath v3.0), and network visualization (Cytoscape version 3.9.1 Bioinformatics Resources 6.7). | [104] |
| hsa-miR-483-3p, hsa-miR-145-5p, hsa-miR-374a-3p, hsa-miR-1180-3p, hsa-miR-337-5p, and hsa-miR-1224-5p, hsa-miR-652-3p, hsa-miR-95-3p, hsa-miR-339-5p, hsa-miR-628-5p, hsa-miR-190a-5p, and hsa-miR-3679-5p, hsa-miR-1255b-5p, hsa-miR-941, hsa-miR-369-5p, hsa-miR-193b-5p, hsa-miR-215-5p | miRNA expression analysis (DESeq2 version 1.42.1), target prediction (mirTarBase Release 9.0), network analysis with STRING database and Cytoscape version 3.10.1, pathway analysis (Metascape v3.5.20240101), disease classification (STREAMLINE, release beta 0.3.4), and feature importance via mutual information and MultiSURF algorithm. | [115] |
| has-let-7d, has-miR-144, has-miR-374a, has-miR-106b | WGCNA for gene coexpression, GO/KEGG analysis (DAVID Bioinformatics Resources 6.7), gene comparison (FunRich 2.1.2.), drug screening with CMAP (Available from: https://www.broadinstitute.org/connectivity-map-cmap, accessed 17 February 2025), and miRNA differential expression (Limma 3.28.14 R Package). | [116] |
| hsa-mir-16-5p, hsa-mir-34a-5p, hsa-mir-1-3p, hsa-mir-26a-5p, hsa-mir-93-5p, hsa-mir-155-5p | Meta-analysis of GEO datasets with ImaGEO2 (Available from: https://imageo.genyo.es/, accessed 17 February 2025), network analysis (STRING database 2021, Cytoscape version 3.9.1), feature selection (LASSO), classification (RF, SVM, DNN, CNN algorithms), and gene set analysis using DisGeNET in Enrichr (Available from: https://maayanlab.cloud/Enrichr/, accessed 18 February 2025). | [117] |
| let-7e, miR-96, and miR-484, miR-99b, miR-100, miR-30e, miR-378i, miR-145, miR-378c, miR-451a | Diff. expr. with Limma (R v3.5.1), up- and downregulation with multiMiR (R v3.5.1), target gene and KEGG pathway analysis with DIANA-miRPath 3.03.0, and GO enrichment analyses with FunRich (Available from: http://www.funrich.org/, accessed 18 February 2025). | [118] |
| miR-128, miR-210 | miRNA name mapping (miEAA 2.0, miRBase V22), sequence alignment (bioMart 2.52.0), 3D genome modeling (Hi-C data), clustering (DBSCAN algorithm), correlation analysis (Spearman), and model training (sklearn, leave-one-out cross-validation). | [119] |
| hsa-miR-3184-5p, hsa-miR-1227-5p, hsa-miR-3181, hsa-miR-6088 | miRNA expression profiling (GEO Available from: https://www.ncbi.nlm.nih.gov/geo/query/acc.cgi?acc=GSE120584 accessed 17 February 2025), feature selection (Boruta, mRMR, MCFS algorithms), classification models (RF, PART algorithms), incremental feature selection (IFS algorithm), oversampling (SMOTE algorithm), and performance evaluation (MCC, accuracy metrices). | [120] |
| let-7d-5p, miR-106b-3p, miR-107, miR-126-5p, miR-148b-5p, miR-181c-3p, miR-191-5p, miR-200a-3p, miR-22-3p, miR-483-5p, miR-486-5p, miR-502-3p, miR-93-5p | Meta-analysis (metafor 4.0.0), miRNA standardization (miRNAmeConverter 3.20, miRBase 22.1), miRNA–disease association identification (ABMDA method), disease similarity (DOSE 3.30.0), miRNA similarity (MISIM database v2.0), pathway enrichment (clusterProfiler 4.0.5, KEGG database), gene network analysis with STRING (version 11), target gene retrieval (multiMiR release 3.12, miRTarBase 9.0), and risk of bias assessment (MIQE). | [121] |
| hsa-miR-26a-5p, hsa-miR-107, hsa-miR-26b-5p or hsa-let-7f-5p | Protein collection (pubmed2ensembl v1.0, UniProtKB v1.0), gene set enrichment (ClueGo v1.0, CluePedia v1.0, GO database, Reactome database), protein interaction network (STRING version 11, CentiScaPe v1.0), miRNA and lncRNA targeting (miRTarBase Homo sapiens 8.0 database, LncRNA2Target 2.0 database, CyTargetLinker v4.1.0), drug–gene interaction (Drug–Gene Interaction database 3.0, Cytoscape 3.7.2). | [122] |
| hsa-mir-26b-5p, hsa-mir-192-5p, hsa-let-7e-5p, hsa-let-7f-5p, hsa-mir-124-3p, hsa-mir-20a-3p, hsa-mir-217, hsa-mir-433-3p, hsa-mir-1-3p, hsa-mir-128-3p, hsa-mir-129-2-3p, hsa-mir-146a-5p, hsa-mir-194-5p, hsa-mir-23b-3p, hsa-mir-34a-5p, hsa-mir-375 | PPI network construction (Genemania database 2008, Cytoscape, Network Analyzer), miRNA identification (Starbase v2.0, miRWalk v3.0, miRanda v1.0), TF identification (Network Analyst 3.0, TRRUST v2.0, ENCODE registry v2), expression validation (GTEx v8, Brainspan – Available from https://www.brainspan.org/, accessed 17 February 2025; BrainEXP release 2019), shape-based screening (Pubchem, Swiss Similarity, CHEMBL database – Available from https://www.ebi.ac.uk/chembl/, accessed 17 February 2025), ligand–protein preparation (Schrödinger 14-2, Ligprep Schrödinger module), docking (Glide release 2021), molecular dynamics (Desmond), and normal mode analysis (iMODS server release 2014). | [123] |
| hsa-miR-422a, hsa-miR-4784, hsa-miR-3944-3p | Gene expression data mapping (GEO database – Available from https://www.ncbi.nlm.nih.gov/geo/, accessed 17 February 2025, miRNA: miRBase V22), data processing (GEO2R– Available from https://www.ncbi.nlm.nih.gov/geo/geo2r/, accessed 17 Febraury 2025, R: limma & clusterProfiler from Bioconductor release 3.15, GGplot2 3.3.6, enrichPlot in Bioconductor 3.15, survival 3.3-13.3-1), pathway analysis (DAVID v2022q3, KEGG release 104.0, GO database), PPI network construction (STRING database 11.5, Cytoscape 3.9, CytoHubba, Between Centrality), survival analysis (R: survival, Cox method, Kaplan–Meier), ceRNA network analysis (Cytoscape 3.9, ENCORE database 2022), and clinical validation (GSEA, correlation analysis with MMSE, NFT, Braak). | [124] |
| hsa-miR-30d-5p, hsa-miR-186-5p, hsa-miR-425-5p, hsa-miR-4781-3p, hsa-miR-361-5p, hsa-miR-26b-3p, hsa-miR-30a-5p, hsa-miR-30a-3p, hsa-miR-30e-3p, hsa-miR-151a-5p, hsa-miR-151b | Data collection (GEO, GSE46579, GSE85426), preprocessing (quantile normalization), differential expression (limma, FDR < 0.01), WGCNA, miRNA–mRNA network (miRWalk 2.0, Cytoscape 3.7.2), RT-PCR validation, and statistical analysis. | [125] |
| miR 26b-5p, miR-103a-3p, miR-107, miR-26a-5p, let-7f-5p, miR 532-5p, miR-151a-3p, miR-5010-3p, miR-1285-5p, let-7d-3p | Data preprocessing (background correction, Limma package), differential expression (Student’s t-test, Stouffer test, FDR < 0.001), miRNA–target prediction (RNA22 v2.0, miRanda v1.0, miRDB v5.0, miRWalk v1, PICTAR2 v1, TargetScan 7.1), functional annotation using GeneCodis (Available from: https://genecodis.genyo.es/, accessed 17 February 2025), GO and KEGG databases, miRNA–target network with Cytoscape 3.5.1, and RT-qPCR validation. | [126] |
| miR-30a-5p, miR-335 | miRNA–gene interaction network (Cytoscape 3.2.1, ClueGO v2.2.5), microarray data preprocessing (affy, plier, piano packages in R), differential expression using GEO2R tool (Available from: https://www.ncbi.nlm.nih.gov/geo/geo2r/, accessed 18 February 2025), RNA-seq data analysis (FastQC v0.11.5, TopHat2 version 2.0.8, Cuffdiff v1), miRNA–target gene identification with cyTargetLinker ( Available from: https://apps.cytoscape.org/apps/cytargetlinker, accessed 18 February 2025) using miRTarBase, TarBase v.8 and miRWalk 2.0 databases, gene ontology and pathway analysis (ClueGO v2.2.5), and clustering (gplots, RcolorBrewer1.1-2). | [127] |
| miRNA | Direction of Changes | Biological Effects | Biological Specimen/Animal Models | References |
|---|---|---|---|---|
| miR-103a-3p, miR-142-3p, miR-20a-5p, miR-29b-3p, miR-143-3p, miR-197-3p, miR-27a-3p, miR-338-3p, miR-491-5p, miR-7b-5p, miR-7g-5p, miR-106a-5p, miR-106b-5p, miR-18b-5p, miR-223-3p, miR-26a-5p, miR-26b-5p, miR-301a-3p, miR-30b-5p | ↑ | N/A | Serum samples | [168] |
| miR-132-3p, miR-100-5p, miR-335-5p, miR-99a-5p, miR-146a-5p, miR-15a-5p, miR-22-3p, miR-320a, miR-320b, miR-92a-3p, miR-1246 | ↓ | |||
| miR-663a, miR-502-3p, miR-206 | ↓ | Modulate inflammatory responses, cell proliferation, and BDNF protein synthesis | Plasma samples | [169] |
| miR-345-5p, miR-34a-5p | ↑ | Involved in cell signaling, apoptosis, and intermediary metabolism | Plasma samples | [170] |
| miR-200c-3p, miR-10a-3 | ↓ | |||
| miR-181c | ↓ | Promote microglial-directed neuroinflammation and translocation of TDP-43 from the nucleus to the cytoplasm | Plasma-derived EVs | [172] |
| miR-92a-3p, miR-320a | ↑ | Regulate Tau expression, TGF-β signaling pathway, and apoptosis | Plasma-derived EVs | [13] |
| miRNA | Methods | References |
|---|---|---|
| miR-34a-5p, miR-345-5p, miR-200c-3p, miR-10a-3p | miRNA extraction (miRNeasy Serum/Plasma Kit (Qiagen)), sequencing (Illumina NovaSeq6000), raw reads processing with FastQC (Available from: http://www.bioinformatics.babraham.ac.uk/projects/fastqc, accessed 18 February 2025), UMI-tools, Cutadapt, Bowtie, Samtools, miRDeep2), statistical analysis using EdgeR (R V.3.6.1), logistic regression (scikit-learn), cross-validation, feature selection, and pathway analysis (DIANA-miRPath V.3). | [170] |
| miR-34a-5p, miR-338-3p, miR-142-3p, miR-320a, miR-145-5p, miR-92a-3p, let-7 g-5p, miR-199a-5p, miR-206, miR-30b-5p, miR-191-5p, miR-27a, miR-320b, miR-143-3p, miR-1246, miR-223-3p, miR-144-3p, miR-451, miR-194-5p, miR-144-5p, miR-29b-3p, miR-29c-3p, miR-192-5p, miR-19a-3p, miR-502-3p, miR-15a-5p, miR-374b-5p, miR-7-1-3p, miR-320c, miR-106b-5p, miR-146a-5p, miR-133b, let-7b-5p, miR-345-5p, miR-22-3p | Quality control with FastQC, sequence cleaning with UMI-tools and Cutadapt, sequence alignment with Bowtie, PCR duplicate removal with UMI-tools, data quantification with Samtools idxstats v1.15, differential expression analysis with EdgeR from Bioconductor 3.14, binary classification with logistic regression, cross-validation, and ROC-AUC evaluation. | [173] |
| miR-127-3p | T-test or Mann–Whitney test, ROC curve analysis, sensitivity, and specificity. All statistical analyses were performed using STATA 13. | [176] |
| miR-423-5p, miR-125b-5p, miR-26a-5p, miR-326, miR-185-5p, miR-629-5p, miR-484, let-7d-3p, miR-107, let-7c-5p, miR-361-5p, miR-379-5p, miR-378a-5p | Classification with logistic regression, evaluation using ROC-AUC, feature selection via RFE, and feature importance analysis with SHapley Additive exPlanations (SHAP v0.44.0). | [171] |
| miR-203 | Log2-transformed FPKM values were quantile-normalized (betweenLaneNormalization) using the EDAseq package in R (freely available at https://bioconductor.org/packages/release/bioc/html/EDASeq.html accessed 18 February 2025). PCA, WGCNA package in R (CRAN v1.68), module preservation analysis, enrichment analysis (GO-Elite), and PPI network analysis (igraph package in R v1.2.3) were performed. | [177] |
| miR-204-5p, miR-632 | miRNA expression processing was performed prior to statistical analysis using GenEx 6 (MultiD Analyses). Statistical analysis involved a t-test with Holm–Sidak correction, logistic regression, ROC calculations, and cross-validation, all conducted using GraphPad Prism V.7.01. | [179] |
| miR-129-5p | Batch effect correction was performed using the RUVSeq package (freely available at https://bioconductor.org/packages/release/bioc/html/RUVSeq.html accessed 18 February 2025), followed by differential expression analysis with DESeq2. Target annotation was performed with miRTarBase v7.0, and target gene selection was based on the GTEx portal(Available from: https://gtexportal.org/home/, accessed 18 February 2025). Network analysis and pathway enrichment were conducted using tools such as NPInter v5.0, RegNetwork, Rise2.14, STRING 12.0, TarBase v9, and TransmiR v3. Bioconductor version 3.20 used. | [180] |
Disclaimer/Publisher’s Note: The statements, opinions and data contained in all publications are solely those of the individual author(s) and contributor(s) and not of MDPI and/or the editor(s). MDPI and/or the editor(s) disclaim responsibility for any injury to people or property resulting from any ideas, methods, instructions or products referred to in the content. |
© 2025 by the authors. Licensee MDPI, Basel, Switzerland. This article is an open access article distributed under the terms and conditions of the Creative Commons Attribution (CC BY) license (https://creativecommons.org/licenses/by/4.0/).
Share and Cite
Petracci, I.; Bellini, S.; Goljanek-Whysall, K.; Quinlan, L.R.; Fiszer, A.; Cakmak, A.; Njume, C.M.; Borroni, B.; Ghidoni, R. Exploring the Role of microRNAs as Blood Biomarkers in Alzheimer’s Disease and Frontotemporal Dementia. Int. J. Mol. Sci. 2025, 26, 3399. https://doi.org/10.3390/ijms26073399
Petracci I, Bellini S, Goljanek-Whysall K, Quinlan LR, Fiszer A, Cakmak A, Njume CM, Borroni B, Ghidoni R. Exploring the Role of microRNAs as Blood Biomarkers in Alzheimer’s Disease and Frontotemporal Dementia. International Journal of Molecular Sciences. 2025; 26(7):3399. https://doi.org/10.3390/ijms26073399
Chicago/Turabian StylePetracci, Irene, Sonia Bellini, Katarzyna Goljanek-Whysall, Leo R. Quinlan, Agnieszka Fiszer, Ali Cakmak, Cyrille Mesue Njume, Barbara Borroni, and Roberta Ghidoni. 2025. "Exploring the Role of microRNAs as Blood Biomarkers in Alzheimer’s Disease and Frontotemporal Dementia" International Journal of Molecular Sciences 26, no. 7: 3399. https://doi.org/10.3390/ijms26073399
APA StylePetracci, I., Bellini, S., Goljanek-Whysall, K., Quinlan, L. R., Fiszer, A., Cakmak, A., Njume, C. M., Borroni, B., & Ghidoni, R. (2025). Exploring the Role of microRNAs as Blood Biomarkers in Alzheimer’s Disease and Frontotemporal Dementia. International Journal of Molecular Sciences, 26(7), 3399. https://doi.org/10.3390/ijms26073399