

The Involvement of Serotonin in the Obesity Pathway—A Last Decade Systematic Review of the Literature
 ,
,  ,
,  ,
,
Abstract
1. Introduction
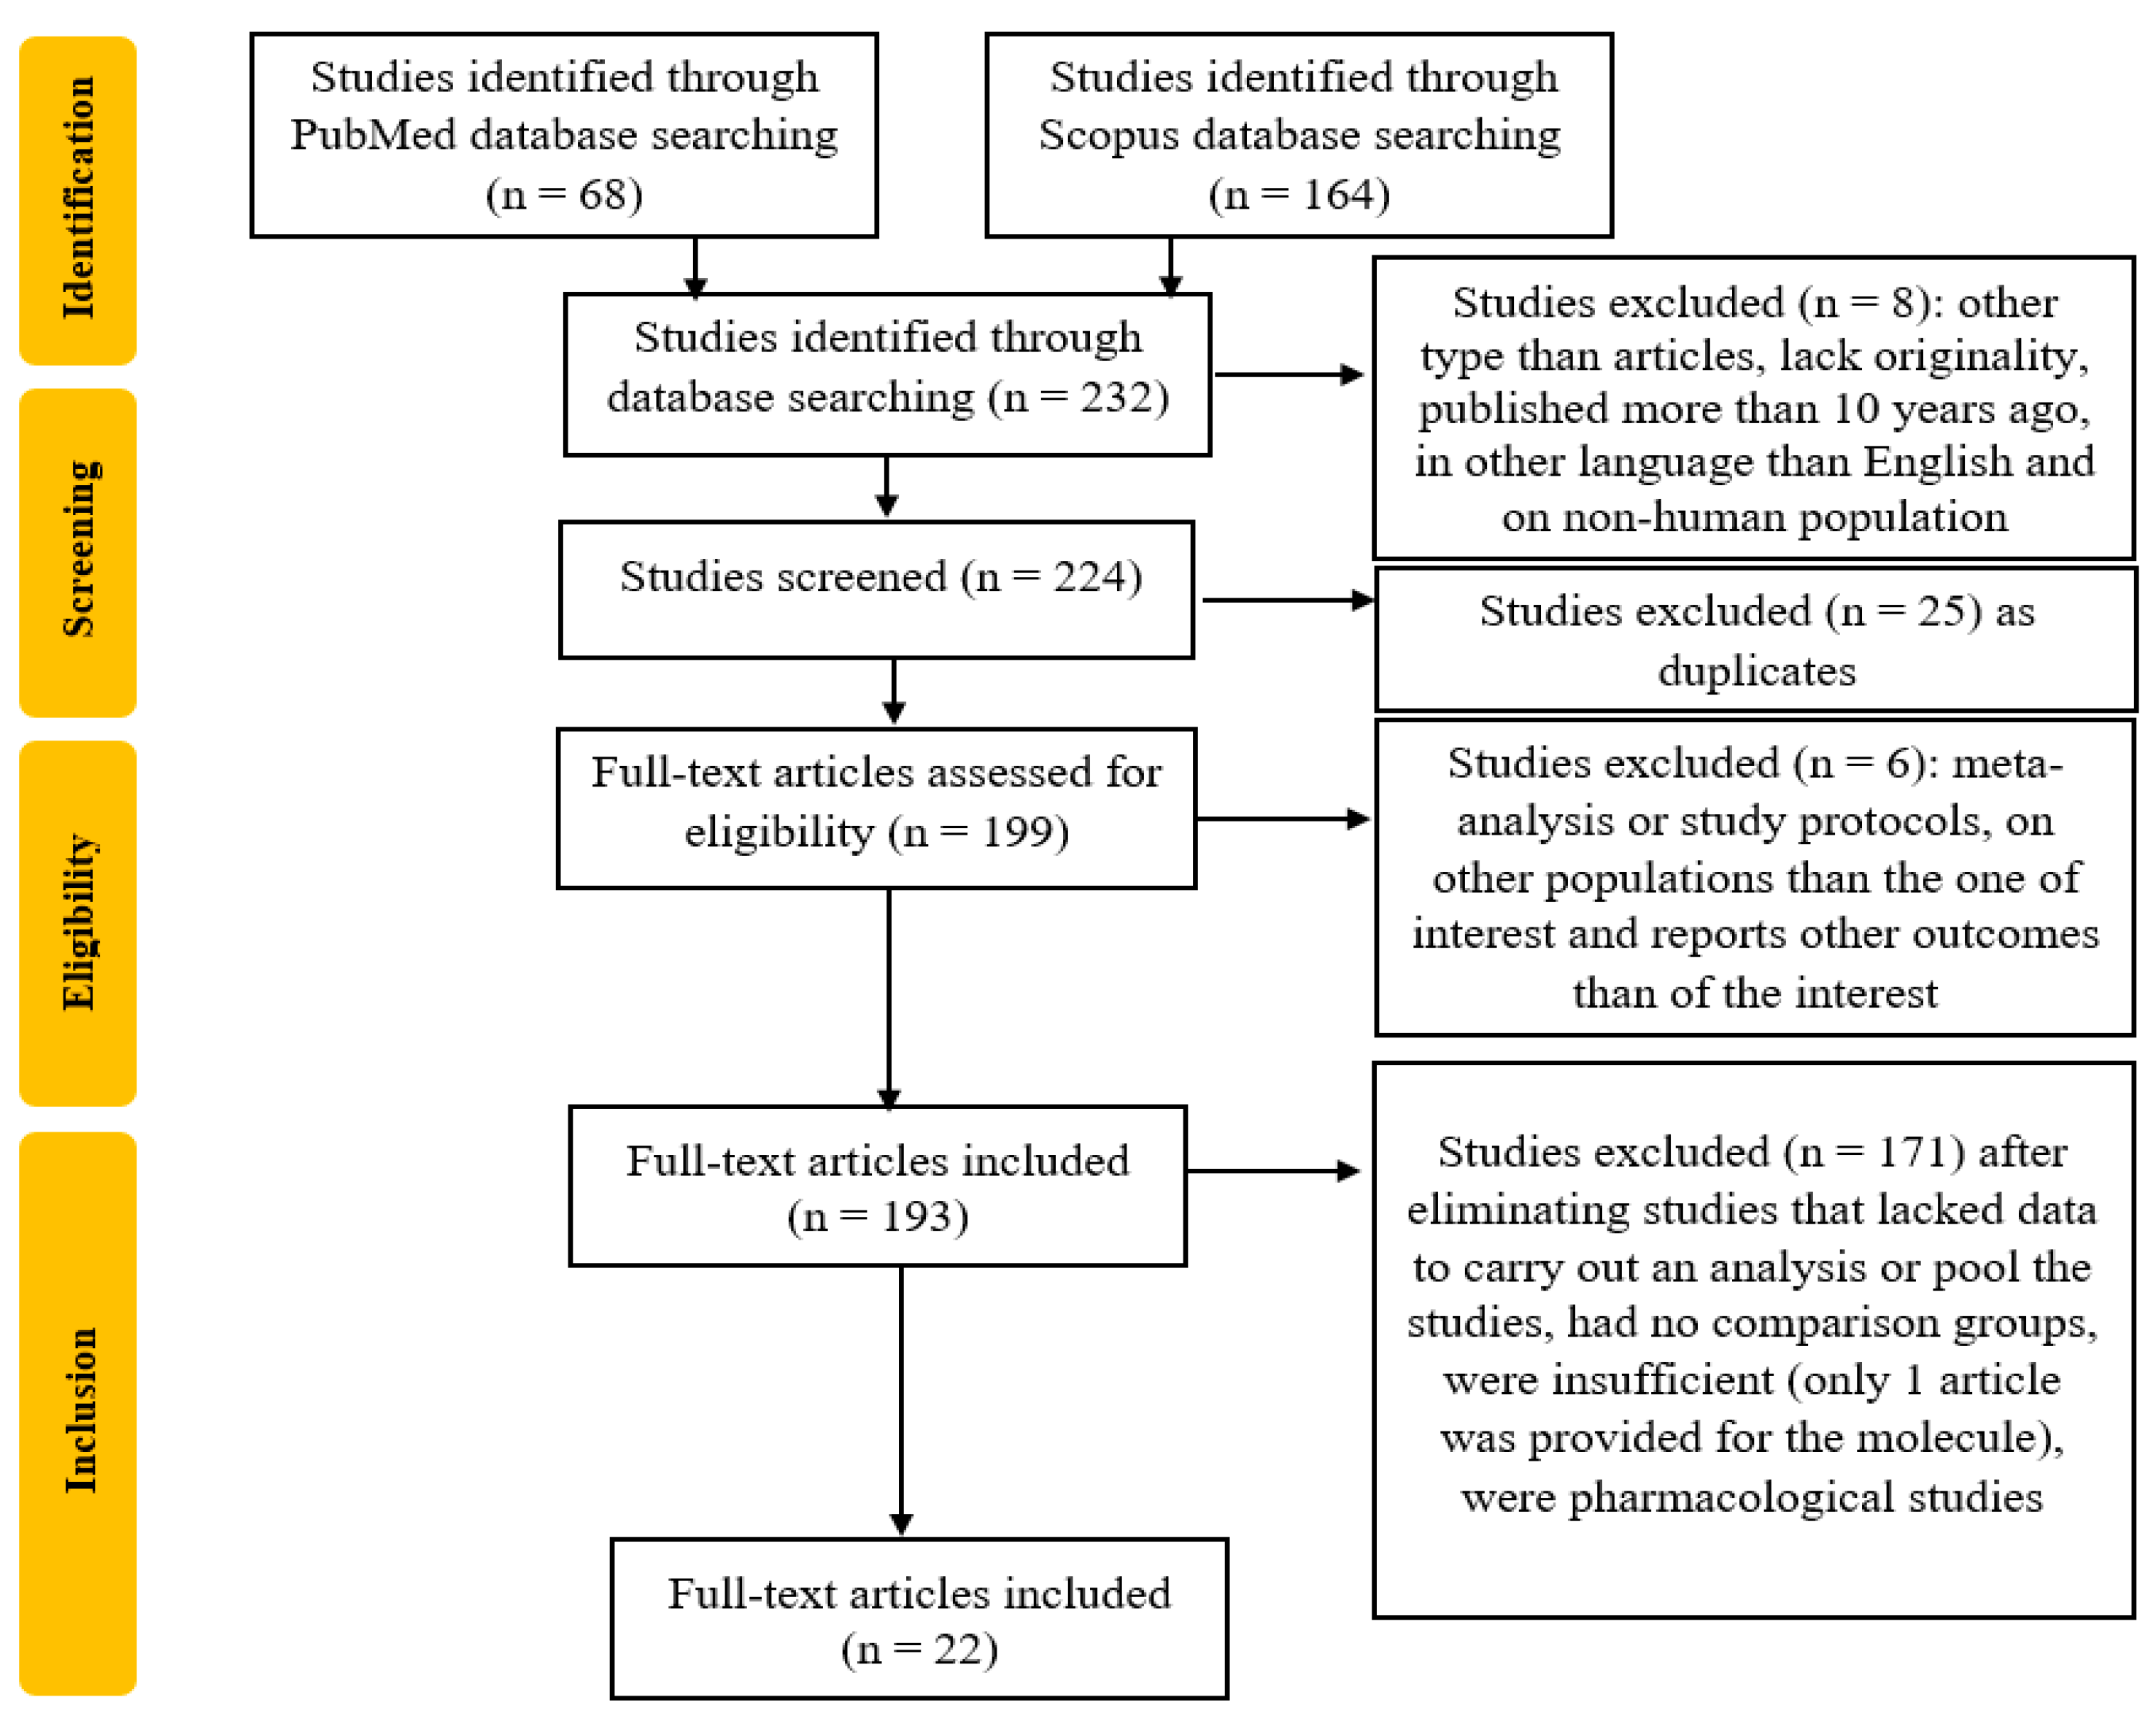
2. Methods
2.1. Research Question and Search Strategy
2.2. Inclusion Criteria
2.3. Exclusion Criteria
2.4. Study Selection
2.5. Data Extractions
2.6. Risk of Bias
2.7. Strategy of Data Synthesis
3. Results and Discussion
3.1. Correlation Between Metabolic Factors, Serotonin and Obesity
3.2. Correlation Between Gut Microbiota, Serotonin, and Obesity
3.3. Correlation Between Genetics, Serotonin, and Obesity
3.4. Correlation Between Lifestyle, Serotonin and Obesity
3.5. Correlation Between Neurotransmitters, Serotonin, and Obesity
3.6. Serotonin Pathways in Obesity Development
3.7. Limits
3.8. Research Future Directions and Perspective Targeted Treatments
4. Conclusions
Author Contributions
Funding
Acknowledgments
Conflicts of Interest
References
- Lingvay, I.; Cohen, R.V.; Roux, C.W.L.; Sumithran, P. Obesity in adults. Lancet 2024, 404, 972–987. [Google Scholar] [CrossRef] [PubMed]
- Schunkert, H. Obesity and target organ damage: The heart. Int. J. Obes. Relat. Metab. Disord. 2002, 26, S15–S20. [Google Scholar] [CrossRef]
- de Jong, P.E.; Verhave, J.C.; Pinto-Sietsma, S.J.; Hillege, H.L.; PREVEND study group. Obesity and target organ damage: The kidney. Int. J. Obes. Relat. Metab. Disord. 2002, 26, S21–S24. [Google Scholar] [CrossRef] [PubMed]
- Lambert, E.A.; Esler, M.D.; Schlaich, M.P.; Dixon, J.; Eikelis, N.; Lambert, G.W. Obesity-Associated Organ Damage and Sympathetic Nervous Activity. Hypertension 2019, 73, 1150–1159. [Google Scholar] [CrossRef]
- Lustig, R.H.; Collier, D.; Kassotis, C.; Roepke, T.A.; Kim, M.J.; Blanc, E.; Barouki, R.; Bansal, A.; Cave, M.C.; Chatterjee, S.; et al. Obesity I: Overview and molecular and biochemical mechanisms. Biochem. Pharmacol. 2022, 199, 115012. [Google Scholar] [CrossRef]
- Heindel, J.J.; Howard, S.; Agay-Shay, K.; Arrebola, J.P.; Audouze, K.; Babin, P.J.; Barouki, R.; Bansal, A.; Blanc, E.; Cave, M.C.; et al. Obesity II: Establishing causal links between chemical exposures and obesity. Biochem. Pharmacol. 2022, 199, 115015, Erratum in Biochem. Pharmacol. 2022, 202, 115144. [Google Scholar] [CrossRef]
- Kassotis, C.D.; Vom Saal, F.S.; Babin, P.J.; Lagadic-Gossmann, D.; Le Mentec, H.; Blumberg, B.; Mohajer, N.; Legrand, A.; Munic Kos, V.; Martin-Chouly, C.; et al. Obesity III: Obesogen assays: Limitations, strengths, and new directions. Biochem. Pharmacol. 2022, 199, 115014, Erratum in Biochem. Pharmacol. 2022, 202, 115145. [Google Scholar] [CrossRef]
- Oussaada, S.M.; van Galen, K.A.; Cooiman, M.I.; Kleinendorst, L.; Hazebroek, E.J.; van Haelst, M.M.; Ter Horst, K.W.; Serlie, M.J. The pathogenesis of obesity. Metabolism 2019, 92, 26–36. [Google Scholar] [CrossRef]
- Caron, A.; Jane Michael, N. New Horizons: Is Obesity a Disorder of Neurotransmission? J. Clin. Endocrinol. Metab. 2021, 106, e4872–e4886. [Google Scholar] [CrossRef]
- Jonnakuty, C.; Gragnoli, C. What do we know about serotonin? J. Cell Physiol. 2008, 17, 301–306. [Google Scholar] [CrossRef]
- Mohammad-Zadeh, L.F.; Moses, L.; Gwaltney-Brant, S.M. Serotonin: A review. J. Vet. Pharmacol. Ther. 2008, 31, 187–199. [Google Scholar] [CrossRef]
- Szeitz, A.; Bandiera, S.M. Analysis and measurement of serotonin. Biomed. Chromatogr. 2018, 32, e4135. [Google Scholar] [CrossRef]
- Hornung, J.P. The human raphe nuclei and the serotonergic system. J. Chem. Neuroanat. 2003, 26, 331–343. [Google Scholar] [CrossRef]
- Chen, X.; Ye, R.; Gargus, J.J.; Blakely, R.D.; Dobrenis, K.; Sze, J.Y. Disruption of Transient Serotonin Accumulation by Non-Serotonin-Producing Neurons Impairs Cortical Map Development. Cell Rep. 2015, 10, 346–358. [Google Scholar] [CrossRef] [PubMed]
- Lucki, I. The spectrum of behaviors influenced by serotonin. Biol. Psychiatry 1998, 44, 151–162. [Google Scholar] [CrossRef] [PubMed]
- Georgescu, T.; Lyons, D.; Heisler, L.K. Role of serotonin in body weight, insulin secretion and glycaemic control. J. Neuroendocr. 2021, 33, e12960. [Google Scholar] [CrossRef]
- Almaça, J.; Molina, J.; Menegaz, D.; Pronin, A.N.; Tamayo, A.; Slepak, V.; Berggren, P.-O.; Caicedo, A. Human beta cells produce and release serotonin to inhibit glucagon secretion from alpha cells. Cell Rep. 2016, 17, 3281–3291. [Google Scholar]
- Kim, K.; Oh, C.M.; Ohara-Imaizumi, M.; Park, S.; Namkung, J.; Yadav, V.K.; Tamarina, N.A.; Roe, M.W.; Philipson, L.H.; Karsenty, G.; et al. Functional role of sero tonin in insulin secretion in a diet- induced insulin- resistant state. Endocrinology 2015, 156, 444–452. [Google Scholar]
- Ohara-Imaizumi, M.; Kim, H.; Yoshida, M.; Fujiwara, T.; Aoyagi, K.; Toyofuku, Y.; Nakamichi, Y.; Nishiwaki, C.; Okamura, T.; Uchida, T.; et al. Serotonin regulates glucose- stimulated insulin secretion from pancreatic β cells during pregnancy. Proc. Natl. Acad. Sci. USA 2013, 110, 19420–19425. [Google Scholar]
- Bennet, H.; Mollet, I.G.; Balhuizen, A.; Medina, A.; Nagorny, C.; Bagge, A.; Fadista, J.; Ottosson-Laakso, E.; Vikman, P.; Dekker-Nitert, M.; et al. Serotonin (5- HT) receptor 2b activation augments glucose- stimulated insulin se cretion in human and mouse islets of Langerhans. Diabetologia 2016, 59, 744–754. [Google Scholar]
- Blodgett, D.M.; Nowosielska, A.; Afik, S.; Pechhold, S.; Cura, A.J.; Kennedy, N.J.; Kim, S.; Kucukural, A.; Davis, R.J.; Kent, S.C.; et al. Novel observations from next-generation RNA sequencing of highly purified human adult and fetal islet cell subsets. Diabetes 2015, 64, 3172–3181. [Google Scholar] [CrossRef] [PubMed]
- Breisch, S.T.; Zemlan, F.P.; Hoebel, B.G.; Url, S. Hyperphagia and obesity following serotonin depletion by intraventricular p-Chlorophenylalanine Hyperphagia and obesity following serotonin depletion by Intraventricular p-Chlorophenylalanine. Science 1976, 192, 382–385. [Google Scholar] [CrossRef]
- Saller, C.F.; Stricker, E.M. Hyperphagia and increased growth in rats after intraventricular injection of 5,7- dihydroxytryptamine. Science 1976, 191, 385–387. [Google Scholar] [CrossRef]
- Miller, G.D. Appetite Regulation: Hormones, Peptides, and Neurotransmitters and Their Role in Obesity. Am. J. Lifestyle Med. 2017, 13, 586–601. [Google Scholar] [CrossRef]
- Nonogaki, K.; Strack, A.M.; Dallman, M.F.; Tecott, L.H. Leptin-independent hyperphagia and type 2 diabetes in mice with a mutated serotonin 5-HT2C receptor gene. Nat. Med. 1998, 4, 1152–1156. [Google Scholar] [CrossRef] [PubMed]
- Xu, Y.; Berglund, E.D.; Sohn, J.W.; Holland, W.L.; Chuang, J.-C.; Fukuda, M.; Rossi, J.; Williams, K.W.; E Jones, J.; Zigman, J.M.; et al. 5-HT2CRs expressed by pro opiomelanocortin neurons regulate insulin sensitivity in liver. Nat. Neurosci. 2010, 13, 1457–1459. [Google Scholar] [CrossRef] [PubMed]
- Xu, Y.; Jones, J.E.; Kohno, D.; Williams, K.W.; Lee, C.E.; Choi, M.J.; Anderson, J.G.; Heisler, L.K.; Zigman, J.M.; Lowell, B.B.; et al. 5-HT2CRs expressed by pro-opiomelanocortin neurons regulate energy homeostasis. Neuron 2008, 60, 582–589. [Google Scholar] [CrossRef]
- Ho, A.J.; Raji, C.A.; Becker, J.T.; Lopez, O.L.; Kuller, L.H.; Hua, X.; Lee, S.; Hibar, D.; Dinov, I.D.; Stein, J.L.; et al. Obesity is linked with lower brain volume in 700 AD and MCI patients. Neurobiol. Aging 2010, 31, 1326–1339. [Google Scholar] [CrossRef]
- Huang, H.; Li, J.; Shen, J.; Zhao, T.; Xiao, R.; Ma, W. Dietary Inflammatory Index and Cognitive Function: Findings from a Cross-Sectional Study in Obese Chinese Township Population from 45 to 75 Years. J. Inflamm. Res. 2024, 17, 2365–2382. [Google Scholar] [CrossRef]
- Kim, C.Y.; Park, Y.; Namgung, J.Y.; Park, Y.; Park, B.Y. The macroscale routing mechanism of structural brain connectivity related to body mass index. Hum. Brain Mapp. 2024, 45, e70019. [Google Scholar] [CrossRef]
- Liikonen, V.; Näätänen, M.; Kårlund, A.; Hanhineva, K.; Karhunen, L.; Kolehmainen, M. Association between whole-grain consumption, tryptophan metabolism and psychological distress: A secondary analysis of a randomised controlled trial. Br. J. Nutr. 2024, 132, 330–340. [Google Scholar] [CrossRef] [PubMed]
- Borroni, E.; Frigerio, G.; Polledri, E.; Mercadante, R.; Maggioni, C.; Fedrizzi, L.; Pesatori, A.C.; Fustinoni, S.; Carugno, M. Metabolomic profiles in night shift workers: A cross-sectional study on hospital female nurses. Front. Public. Health 2023, 11, 1082074. [Google Scholar] [CrossRef] [PubMed]
- Tkachenko, V.; Bagro, T. The Correlation Between Body Weight, Serotonin Levels, Mental Health Status, Sleep Disorders and Metabolism in Patients with Obesity. Int. J. Endocrinol. (Ukr.) 2023, 19, 354–362. [Google Scholar] [CrossRef]
- Tkachenko, V.; Bagro, T. Effectiveness of Motivational Counseling for Lifestyle Modification in Obese Patients Using a Patient-centered Approach. Fam. Med. Eur. Pract. 2023, 1, 20–27. [Google Scholar] [CrossRef]
- Castell, A.L.; Goubault, C.; Ethier, M.; Fergusson, G.; Tremblay, C.; Baltz, M.; Dal Soglio, D.; Ghislain, J.; Poitout, V. β Cell mass expansion during puberty involves serotonin signaling and determines glucose homeostasis in adulthood. JCI Insight 2022, 7, e160854. [Google Scholar] [CrossRef] [PubMed]
- Dong, T.S.; Guan, M.; Mayer, E.A.; Stains, J.; Liu, C.; Vora, P.; Jacobs, J.P.; Lagishetty, V.; Chang, L.; Barry, R.L.; et al. Obesity is associated with a distinct brain-gut microbiome signature that connects Prevotella and Bacteroides to the brain’s reward center. Gut Microbes 2022, 14, 2051999. [Google Scholar] [CrossRef]
- Orozco-Ruiz, X.; Anesi, A.; Mattivi, F.; Breteler, M.M.B. Branched-Chain and Aromatic Amino Acids Related to Visceral Adipose Tissue Impact Metabolic Health Risk Markers. J. Clin. Endocrinol. Metab. 2022, 107, e2896–e2905. [Google Scholar] [CrossRef]
- Wu, C.H.; Chang, C.S.; Yang, Y.K.; Shen, L.H.; Yao, W.J. Comparison of brain serotonin transporter using [I-123]-ADAM between obese and non-obese young adults without an eating disorder. PLoS ONE 2017, 12, e0170886. [Google Scholar] [CrossRef]
- Baumard, L.; Weerts, Z.Z.R.M.; Masclee, A.A.M.; Keszthelyi, D.; Michael-Titus, A.T.; Peiris, M. Effect of Obesity on the Expression of Nutrient Receptors and Satiety Hormones in the Human Colon. Nutrients 2021, 13, 1271. [Google Scholar] [CrossRef]
- van Galen, K.A.; Booij, J.; Schrantee, A.; Adriaanse, S.M.; Unmehopa, U.A.; Fliers, E.; Schwartz, G.J.; DiLeone, R.J.; Ter Horst, K.W.; la Fleur, S.E.; et al. The response to prolonged fasting in hypothalamic serotonin transporter availability is blunted in obesity. Metabolism 2021, 123, 154839. [Google Scholar] [CrossRef]
- Hartstra, A.V.; Schüppel, V.; Imangaliyev, S.; Schrantee, A.; Prodan, A.; Collard, D.; Levin, E.; Dallinga-Thie, G.; Ackermans, M.T.; Winkelmeijer, M.; et al. Infusion of donor feces affects the gut-brain axis in humans with metabolic syndrome. Mol. Metab. 2020, 42, 101076. [Google Scholar] [CrossRef] [PubMed]
- Palmeira, L.; Cunha, M.; Padez, C.; Alvarez, M.; Pinto-Gouveia, J.; Manco, L. Association study of variants in genes FTO, SLC6A4, DRD2, BDNF and GHRL with binge eating disorder (BED) in Portuguese women. Psychiatry Res. 2019, 273, 309–311. [Google Scholar] [CrossRef]
- Fakhry, J.; Stebbing, M.J.; Hunne, B.; Bayguinov, Y.; Ward, S.M.; Sasse, K.C.; Callaghan, B.; McQuade, R.M.; Furness, J.B. Relationships of endocrine cells to each other and to other cell types in the human gastric fundus and corpus. Cell Tissue Res. 2019, 376, 37–49. [Google Scholar] [CrossRef]
- Nam, S.B.; Kim, K.; Kim, B.S.; Im, H.J.; Lee, S.H.; Kim, S.J.; Kim, I.J.; Pak, K. The Effect of Obesity on the Availabilities of Dopamine and Serotonin Transporters. Sci. Rep. 2018, 8, 4924. [Google Scholar] [CrossRef]
- Groer, M.; Fuchs, D.; Duffy, A.; Louis-Jacques, A.; D’Agata, A.; Postolache, T.T. Associations Among Obesity, Inflammation, and Tryptophan Catabolism in Pregnancy. Biol. Res. Nurs. 2018, 20, 284–291. [Google Scholar] [CrossRef]
- Drabe, M.; Rullmann, M.; Luthardt, J.; Boettcher, Y.; Regenthal, R.; Ploetz, T.; Becker, G.A.; Patt, M.; Schinke, C.; Bergh, F.T.; et al. Serotonin transporter gene promoter methylation status correlates with in vivo prefrontal 5-HTT availability and reward function in human obesity. Transl. Psychiatry 2017, 7, e1167. [Google Scholar] [CrossRef] [PubMed]
- Ioannou, S.; Williams, A.L. Preliminary fMRI findings concerning the influence of 5-HTP on food selection. Brain Behav. 2016, 7, e00594. [Google Scholar] [CrossRef]
- Frigerio, G.; Favero, C.; Savino, D.; Mercadante, R.; Albetti, B.; Dioni, L.; Vigna, L.; Bollati, V.; Pesatori, A.C.; Fustinoni, S. Plasma Metabolomic Profiling in 1391 Subjects with Overweight and Obesity from the SPHERE Study. Metabolites 2021, 11, 194. [Google Scholar] [CrossRef]
- Grundmann, R.; Rullmann, M.; Luthardt, J.; Zientek, F.; Becker, G.A.; Patt, M.; Hankir, M.K.; Blüher, M.; Sabri, O.; Hesse, S. Higher HbA1c levels associate with lower hippocampal serotonin transporter availability in non-diabetic adults with obesity. Sci. Rep. 2020, 10, 21383. [Google Scholar] [CrossRef]
- Versteeg, R.I.; Koopman, K.E.; Booij, J.; Ackermans, M.T.; Unmehopa, U.A.; Fliers, E.; la Fleur, S.E.; Serlie, M.J. Serotonin Transporter Binding in the Diencephalon Is Reduced in Insulin-Resistant Obese Humans. Neuroendocrinology 2017, 105, 141–149. [Google Scholar] [CrossRef]
- Bollati, V.; Iodice, S.; Favero, C.; Angelici, L.; Albetti, B.; Cacace, R.; Cantone, L.; Carugno, M.; Cavalleri, T.; De Giorgio, B.; et al. Susceptibility to particle health effects, miRNA and exosomes: Rationale and study protocol of the SPHERE study. BMC Public Health 2014, 14, 1137. [Google Scholar] [CrossRef] [PubMed]
- Yano, J.M.; Yu, K.; Donaldson, G.P.; Shastri, G.G.; Ann, P.; Ma, L.; Nagler, C.R.; Ismagilov, R.F.; Mazmanian, S.K.; Hsiao, E.Y. Indigenous bacteria from the gut microbiota regulate host serotonin biosynthesis. Cell 2015, 161, 264–276, Erratum in Cell 2015, 163, 258. [Google Scholar] [CrossRef]
- Salmen, T.; Pietrosel, V.-A.; Reurean-Pintilei, D.; Iancu, M.A.; Cimpeanu, R.C.; Bica, I.-C.; Dumitriu-Stan, R.-I.; Potcovaru, C.-G.; Salmen, B.-M.; Diaconu, C.-C.; et al. Assessing Cardiovascular Target Attainment in Type 2 Diabetes Mellitus Patients in Tertiary Diabetes Center in Romania. Pharmaceuticals 2024, 17, 1249. [Google Scholar] [CrossRef] [PubMed]
- Xiao, N.; Ding, Y.; Cui, B.; Li, R.-R.; Qu, X.-R.; Zhou, H.; Au, K.-H.; Fan, X.-D.; Xie, J.-C.; Huang, Y.; et al. Navigating obesity: A comprehensive review of epidemiology, pathophysiology, complications and management strategies. Innov. Med. 2024, 2, 100090. [Google Scholar] [CrossRef]
- Sui, S.X.; Pasco, J.A. Obesity and Brain Function: The Brain-Body Crosstalk. Medicina 2020, 56, 499. [Google Scholar] [CrossRef]
- Picó, C.; Palou, M.; Pomar, C.A.; Rodríguez, A.M.; Palou, A. Leptin as a key regulator of the adipose organ. Rev. Endocr. Metab. Disord. 2022, 23, 13–30. [Google Scholar] [CrossRef]
- van Galen, K.A.; Ter Horst, K.W.; Serlie, M.J. Serotonin, food intake, and obesity. Obes. Rev. 2021, 22, e13210. [Google Scholar] [CrossRef]
- Calapai, G.; Corica, F.; Corsonello, A.; Sautebin, L.; Di Rosa, M.; Campo, G.M.; Buemi, M.; Mauro, V.N.; Caputi, A.P. Leptin increases serotonin turnover by inhibition of brain nitric oxide synthesis. J. Clin. Investig. 1999, 104, 975–982. [Google Scholar] [CrossRef]
- Marazziti, D.; Betti, L.; Baroni, S.; Palego, L.; Mucci, F.; Carpita, B.; Cremone, I.M.; Santini, F.; Fabbrini, L.; Pelosini, C.; et al. The complex interactions among serotonin, insulin, leptin, and glycolipid metabolic parameters in human obesity. CNS Spectr. 2022, 27, 99–108. [Google Scholar] [CrossRef]
- Reurean-Pintilei, D.; Pantea Stoian, A.; Potcovaru, C.-G.; Salmen, T.; Cinteză, D.; Stoica, R.-A.; Lazăr, S.; Timar, B. Skin Autofluorescence as a Potential Adjunctive Marker for Cardiovascular Risk Assessment in Type 2 Diabetes: A Systematic Review. Int. J. Mol. Sci. 2024, 25, 3889. [Google Scholar] [CrossRef]
- van Son, J.; Koekkoek, L.L.; La Fleur, S.E.; Serlie, M.J.; Nieuwdorp, M. The Role of the Gut Microbiota in the Gut-Brain Axis in Obesity: Mechanisms and Future Implications. Int. J. Mol. Sci. 2021, 22, 2993. [Google Scholar] [CrossRef] [PubMed]


| Author (Reference) | Selection | Comparability | Outcome | Total Score | Quality | |||||
|---|---|---|---|---|---|---|---|---|---|---|
| Representativeness of the Exposed Cohort | Selection of the Non-Exposed Cohort | Ascertainment of Exposure | Demonstration that Outcome of Interest Was Not Present at Start of Study | Comparability of Cohorts Based on the Design or Analysis | Assessment of Outcome | Was Follow-Up Long Enough for Outcomes to Occur | Adequacy of Follow-Up of Cohorts | |||
| Huang et al. [29], 2024 | * | * | * | * | * | * | * | * | 8 | Good |
| Kim et al. [30], 2023 | * | * | * | * | * | * | * | * | 8 | Good |
| Liikonen et al. [31], 2024 | * | * | * | * | * | * | * | * | 8 | Good |
| Borroni et.al [32], 2023 | * | * | * | * | * | * | * | * | 7 | Good |
| Tkachenko et al. [33], 2023 | * | - | * | * | * | * | * | * | 7 | Good |
| Tkachenko et al. [34],2023 | * | - | * | * | * | * | * | - | 6 | Good |
| Castell et al. [35], 2022 | * | - | * | * | * | * | * | * | 8 | Good |
| Dong et al. [36], 2022 | * | * | * | * | * | * | * | - | 7 | Good |
| Orozco-Ruiz et al. [37], 2022 | * | * | * | * | * | * | * | * | 8 | Good |
| Wu et al. [38], 2017 | * | - | * | * | * | * | * | - | 6 | Good |
| Baumard et al. [39], 2021 | * | * | * | * | * | * | * | * | 8 | Good |
| Van Galen et al. [40], 2021 | - | - | * | * | * | * | * | * | 6 | Good |
| Hartstra et al. [41], 2020 | * | * | * | * | * | * | * | * | 8 | Good |
| Palmeira et al. [42], 2019 | * | * | * | * | - | * | * | * | 7 | Good |
| Fakhry et al. [43], 2018 | - | * | * | * | - | * | * | - | 6 | Good |
| Nam et al. [44], 2018 | * | * | * | * | * | * | * | * | 8 | Good |
| Groer et al [45], 2018 | * | * | * | * | * | * | * | * | 8 | Good |
| Drabe et al. [46], 2017 | * | * | * | * | * | * | * | * | 7 | Good |
| Ioannou et al. [47], 2016 | * | - | * | * | * | * | * | * | 7 | Good |
| Article’s Title | Evaluation | Randomization Process | Deviations from Intended Interventions | Missing Outcome Data | Measurement of the Outcome | Selection of the Reported Results | Overall |
|---|---|---|---|---|---|---|---|
| Frigerio et al. [48], 2021 | + | + | + | + | + | + | |
| Grundmann et al. [49], 2020 | + | + | + | + | + | + | |
| Versteeg et al. [50], 2017 | + | - | + | - | + | - | |
| Author, Year [Reference] | Participants * Study Design * Aim of the Study | Sample | Parameters | Outcomes | Discussions | Limitations | Future Directions | |
|---|---|---|---|---|---|---|---|---|
| Inclusion Criteria | Exclusion Criteria | |||||||
| Huang, 2024 [29] | 579 patients. * Cross-sectional study. * To investigate the correlation between DII and cognitive function. | 45–75 yrs. Residents of 3 villages from Beijing. BMI = 18–24 kg/m2 or ≥28 kg/m2. | BMI <18 kg/m2 or 24–28 kg/m2. Severe thyroid, renal dysfunction. History of CNS or mental disease. Reading, hearing, visual impairment. Missing or mandatory suspicious data. | Anthropometric measurements. Cognitive function assessment (MoCA scale). Dietary inflammatory index (FFQ, DII). Metabolic biomarkers (FBG, lipid profile, ApoE, 5-HT). Inflammatory cytokines. Erythrocyte membrane fatty acid. | The 5-HT serum level was lower in patients with obesity compared to those with normal weight. Regarding diet type (anti-inflammatory, neutral and pro-inflammatory), there was no significant difference in 5-HT serum levels among the studied groups. | This study demonstrated a negative relationship between DII score and the cognitive function when comparing normal-weight to obese patients. The results suggest that erythrocyte membrane fatty acids could be the mediator for this result. | Small sample. Cross-sectional study. FFQ may result in recall bias. The result cannot be generalized because the study was conducted in a specific population. | Longitudinal and interventional studies are required to evaluate the association between DII and cognitive function, along with the cofactors implicated in this relationship. |
| Kim, 2024 [30] | 290 patients. * Cross-sectional study. * To investigate the BMI and brain connectivity, exploring the neurotransmitter involvement and gene expression. | Healthy individuals from Human Connectome Project. | Genetically related Family history of mental illness History of drug abuse | MRI | Patients with increased BMI have a better navigation efficiency in the sensory, reward and executive control-related brain regions. All the modifications in navigation efficiency might be related to the serotonergic, dopaminergic, opioid and norepinephrine systems. | Patients with increased BMI had an altered brain communication pattern, particularly in the reward, cognitive and sensory-related regions. These relationships could be linked to dopaminergic, serotoninergic and cannabinoid systems. | Cross-sectional study. The participants were not followed-up. Did not account for others cofactors, such as eating disorders, or other communication models. | Longitudinal studies are necessary to evaluate the connection between BMI and brain connectivity changes over time, along with investigating supplementary network communications models, exploring brain networks associated with eating disorders, and potentially integrating multimodal imaging with molecular data. |
| Liikonen, 2024 [31] | 79 patients. * Secondary analysis of a randomized controlled trial. * To investigate the correlation between whole-grain consumption, TRP metabolism, and psychological distress in a weight management intervention. | 30–65 yrs. BMI 30–40kg/m2 | BMI out of the inclusion range. DM Pregnancy. Kidney or thyroid dysfunction. Heart or liver diseases POS Diagnosed ED. Alcohol consumption. Neuroleptic medication. Oral cortisone medication. | GHQ Anthropometric measurements TRP metabolites | There was no significant association between whole-grain consumption and psychological distress. 5-HT levels increased after weight loss in patients with low psychological distress, as well as in those with high psychological distress, during the weight maintenance period. There were small differences over time in the serum levels of other TRP metabolites, but these differences were not statistically significant. | Whole-grain consumption influences TRP metabolism, potentially leading to positive outcomes for mental status. Psychological distress did not interfere with whole-grain consumption. TRP metabolism is directly influenced by weight loss and dietary changes, regardless of psychological discomfort. | Small sample The fiber content, not the percentage of whole grains in cereal items, served as the foundation for the study’s definition of whole grains. Self-reported food diaries which may contain misreporting were used to gauge consumption of whole grains. | Larger, long-term studies re necessary to assess the causality between whole grains, TRP metabolism, and psychological distress. It is important to evaluate all the cofactors involved, such as gut microbiota composition, gut-brain axis mechanisms, and the biochemical pathways linking weight-loss interventions to mental health. |
| Borroni, 2023 [32] | 91 patients. * Cross-sectional study. * To assess the impact of night shift work on serum metabolites in a group of female nurses working in a hospital. | 30–45 yrs. Nurse, with ≥1 year in service. Caucasian. | Male nurses. Insufficient metabolomics data. | BMI. Metabolomic profile (21 amino acids, 21 biogenic amines, hexoses, 40 acylcarnitine, 15 sphingolipids, and 90 glycerophospholipids). Years of night shift work experience. Different night shift schedules. | Low levels of glycerophospholipids and sphingolipids were detected in night-shift patients. Increased levels of taurine, 5-HT, aspartic acids were observed in night-shift patients. | This study compared the metabolic profile of individuals depending on the work schedule. The association between 5-HT, taurine, aspartic acid and schedule type was not statistically significant in this population. However, the differences between active night shift nurses compared with non-night shift nurses emphasize the potential disturbances associated with night shift work. | Small sample. Cross-sectional design. Population was composed only from women. Could not assess if the results are due to night shift work or the changes in behavioral. Could not be assessed if the metabolic reversible or if the exposure to night shift work affects metabolism over time. Unclear distinction between circadian disruption vs behavioral changes in metabolism changes. The blood sample collection (for night shift workers – at the end of the shift, for non-shift workers – at the start of the workday). | Larger studies, including male participants, are needed. Future research should also evaluate differences between various shift schedules and determine whether observed metabolic changes result from direct circadian rhythm disruption or altered behaviors. |
| Tkachenko, 2023 [33] | 75 patients. * Prospective, cohort study. * To determine the correlation between body weight, 5-HT levels, mental health, sleep disturbances and metabolism in patients with obesity. | BMI = 25–39.9 kg/m2. 25–54 yrs. | BMI <25 kg/m2 or >40 kg/m2. <25 yrs. >54 yrs. Pregnancy or breastfeeding. History of allergic reactions. Chronic diseases (POS, hypothyroidism, Cushing’s syndrome, DM, resistant HTN, CKD stage 2–5). | Anthropometric measurements. BP. Psychological and sleep assessment (HADS, HAM-A, ESS, PSQI). QoL-SF-36 questionnaire. Metabolic panel (lipid profile, FBG, insulin, leptin, 5-HT). | Strong correlations were observed between BMI and anthropometric measurements, BP, lipid profile, and psychological assessment scores (HADS, BDI, HAM-A, and ESS). At baseline, 5-HT levels were inversely associated with all studied parameters. After 6 months of therapeutic intervention, 5-HT levels significantly increased in the obese group (p < 0.001) but showed no significant change in normal-weight patients (p > 0.05). | Sleep disorders contribute to the obesity’s development. Decreased 5-HT levels interfere with mood disorders, lipid and carbohydrate metabolism and contribute to the increased BMI. | No control group. Short follow-up period (6 months). Results are part of a larger ongoing study, published separately. Self-reported sleep and mental health data may introduce bias. Results cannot be generalized to overweight or normal-weight individuals, as the study population consisted exclusively of obese patients. | Longer follow-up studies and larger sample sizes are needed to better understand the metabolic and psychological effects of obesity. Additionally, further investigation into 5-HT’s role in weight management and the mechanisms of obesity is required. |
| Tkachenko, 2023 [34] | 37 patients. * Prospective observational study. * To evaluate the impact of patient-centered motivational therapy on lifestyle improvements in obese individuals. | BMI = 30–40 kg/m2. Prime working age. | Severe comorbidities (DM, cardiovascular, thyroid disorders). Pregnant or breastfeeding. | Anthropometric measurements. Clinical examination. Metabolic parameters (FBG, insulin, HOMA index, lipid profile, leptin, 5-HT). Cognitive and depression questionnaires. | At the first visit, serotonin levels were low. At the 1- and 3-month visits, serotonin levels increased, but the change was not statistically significant (p > 0.05). After 6 months, 5-HT levels increased significantly compared to the first visit (p < 0.05). Other parameters, including BMI, BP, glucose, HDL, VLDL, as well as cognitive and depression questionnaire scores, showed significant improvement (p < 0.05). | The patient-centered approach improves 5-HT levels, along with most of the other parameters assessed in this study, suggesting potential neuroendocrine benefits | Small sample. No control group. Short period of follow-up. Self-reported data (such as mental health, eating behavior, physical activity) increase the risk of bias. | Longer follow-up studies and larger sample sizes are needed to better understand the metabolic and psychological effects of obesity. Additionally, further investigation into 5-HT’s role in weight management and the mechanisms of obesity is required. |
| Castell, 2022 [35] | 13 children (8–15 yrs.). * Experimental study. * To investigate the β-cell mass expansion in puberty using human pancreatic samples and rat models. | Postmortem pancreatic samples form 13 children. Wistar rats used for β-cell proliferation during puberty * Wistar rats at weaning, puberty, and young adulthood. Groups fed with normal or high-fat diet. | Adults or children outside the 8–15-year range. Patients with DM or pancreatic disease. * Rats with developmental abnormalities. | β-cell proliferation. Metabolic markers (glucose, insulin sensitivity, GH, IGF-1, 5-HT). Gene expression (GH/GHR/5-HT signaling pathways). | β-cell proliferation was stimulated by puberty in both rats and humans. During puberty, increased GH levels stimulate 5-HT production in pancreatic β-cells. β-cell proliferation was inhibited by blocking HTR2B signaling, suggesting that 5-HT acts through the HTR2B receptor. A high fat diet suppressed β-cell proliferation, resulting in metabolic disturbances, such as glucose intolerance and impaired insulin secretion. | β-cell proliferation during puberty is stimulated through GH and 5-HT signaling. Impairment of β-cell proliferation, due to obesity and high-fat diet, leads to glucose intolerance. Any changes in pubertal period increase the risk of metabolic disorders in adulthood, especially T2DM. | Small size for human pancreatic samples. Cross sectional human study. High-fat diet experiments were limited to male rats. Did not directly measure insulin secretion in humans, only β-cell markers. | Longitudinal studies are needed to track β-cell changes over time in humans. Furthermore, interventional studies should assess whether the GH/5-HT signaling pathways, along with pharmacological modulation of HTR2B, can influence β-cell proliferation and reduce the risk of DM. |
| Dong, 2022 [36] | 287 patients. * Cross-sectional study. * To identify association between obesity and BGM signature, evaluating the gut microbiota composition, brain network activity and metabolites. | Right-handed patients. No medical or psychiatric diseases. | Pregnant or breastfeeding. Substance or tobacco use. Chronic disorders (neurological, psychiatric, metabolic disorders). Extreme workout (>8 h/week). Chronic medication (that interfere with CNS, analgesic drugs). No administration of antibiotic 3 months prior to admission. | MRI. Anthropometric measurements. Stool sample (16s ribosomal RNA gene sequencing, metabolite analysis). Diet surveys. | Altered brain connectivity, especially in the reward system, observed in patients with obesity, suggests appetite dysregulations. Fecal levels of TRP were decreased in obesity group. The Prevotella/Bacteroides (P/B) ratio was elevated in obesity group. The correlation between P/B ratio and nucleus accumbens centrality was positive (p = 0.03). The correlation between P/B ratio and fecal TRP levels was negative (p = 0.004). | In individuals with obesity, alterations of brain network activity, particularly in appetite regulation centers, imply a distinct BGM signature, regarding of race, sex, and diet. An increased P/B ratio, along with increased nucleus accumbens activity, are obesity risk factors. | Cross sectional study design. Self-reported dietary data may induce bias. Results may be influenced by racial differences. 16s rRNA sequencing has limited resolution in terms of species- and strain-level analyses. Metabolic hormones were not assessed. No longitudinal follow-up to evaluate the long-term effects of microbiome-brain interactions. | Longitudinal studies are needed to assess the relationship between the microbiome and brain activity. Moreover, gut microbiome composition should be analyzed to explore potential mechanisms for weight management strategies. |
| Orozco-Ruiz, 2022 [37] | 1790 patients. * Cross-sectional study. * To investigate whether VAT and SAT influence metabolic health through specific metabolite concentrations, including BCAA and AAA. Additionally, the study explored the effects of VAT on insulin resistance, inflammation, and metabolic risk. | >30 yrs. Participants from the Rhineland Study with available MRI and blood metabolomics data. | Participants with extreme values in metabolite concentration and cardiometabolic risk markers. Participants without valid data on abdominal MRI-fat segmentation. | Anthropometric measurements. Assessment of physical activity, cardiovascular health, cognitive, neurological, ophthalmological function. Metabolomics analysis (TRP, 5-HT, tyrosine, methionine, KYN, 5-hydroxyindole-acetic acid, DA) Cardiometabolic risk markers (insulin, lipid profile, FBG, hs-CRP, BP). MRI. | BCAA and AAA increased levels were observed in patients with metabolic risk factors. VAT correlated with systemic inflammation through KYN, as the primary metabolite mediating. VAT volume correlated with high levels of AAA (L-isoleucine, L-leucine, indole-3-lactic acid). Indole-3-propionic acid was inversely correlated with VAT. TRP metabolites were correlated with inflammation biomarkers. 5-HT was associated with an increased risk of hypertriglyceridemia in men compared to women. | BCAA and AAA exhibit increased serum levels in patients with elevated VAT. In this group, both BCAA and AAA, mediate VAT’s implication on metabolic pathways. 5-HT metabolism shows sex-specific effects on lipid metabolism. | Cross-sectional study design. Lack of tissue-specific metabolomics; adipose tissue metabolic activity was not directly assessed. Self-reported dietary data may induce bias. The study did not account for genetic factors or gut microbiota contributions to metabolite variation. 5-HT metabolism exhibits sex-specific effects on lipid metabolism, requiring further investigation. | Longitudinal studies are needed to assess the causal effects between VAT and metabolite alterations over time. These studies should integrate genetic and microbiome analyses to better characterize their role in obesity development. Further research is required to investigate sex differences in 5-HT metabolism and lipid regulation. |
| Wu, 2017 [38] | 20 patients. * Cross-sectional study. * To assess the SERT in patients with morbid obesity and ED using SPECT imaging. | Young adults. Morbid obesity. No history of ED. | History of psychiatric or neurological disorder. Head trauma. Cardiometabolic disorders (HTN, DM). Anorexic medications use. Use of any systemic medication in the last 4 weeks. Smoking or alcohol abuse. Participation in a weight-loss trial in the past 12 months. | SCOFF questionnaire. SPECT. DXA. Anthropometric measurements. | No significant correlations between SERT and age, BMI and BF distribution. | No significant correlations between midbrain SERT availability and BMI or BF. No significant differences were observed in radiotracer delivery (10-min MID/CE ratio) and SERT availability (6-h MID/CE ratio) between morbidly obese and non-obese individuals without ED. | Small sample. Cross-sectional study design. Not included patients with BMI between 25–39.9 kg/m2. Did not measure 5-HT levels. SPECT is not the best imagistic method to assess the serotoninergic regulation. Others regulatory systems, such as dopaminergic, noradrenergic or leptin levels were not evaluated. | Larger longitudinal studies with a broader BMI range are needed to track SERT changes in response to weight fluctuations. Also, these studies should evaluate dietary factors, gut microbiota, and hormonal influences. Furthermore, assessing 5-HT receptor function instead of SERT may provide a more accurate tool for understanding these correlations. |
| Baumard, 2021 [39] | 67 patients. * Cross-sectional study. * To determine whether obesity affects the expression of EECs and nutrient-sensing G-protein-coupled receptors in the human colon. Additionally, it assessed whether alterations in gut-derived satiety hormones contribute to appetite dysregulation in obesity. | Adult patients undergoing colorectal surgery or colonoscopy. | Patients with inflammatory bowel disease, active cancer, intestinal inflammation. Patients using medications that affect gut hormone levels. | Gene expression analysis (mRNA levels of nutrient receptors, mRNA levels of satiety hormones). Protein expression. BMI and colonic tissue sampling. | No significant differences in gut hormone expression between obese and non-obese participants regarding mRNA levels of 5-HT, glucagon, PYY, cholecystokinin, and somatostatin were unchanged between BMI groups. Also, no significant changes in enteroendocrine cell numbers between BMI groups. Obesity was associated with increased GPR40 expression in the sigmoid colon. No significant difference in 5-HT -positive EECs or PYY-expressing L-cells in the colon, but calcium-sensing receptor was highly expressed on 5-HT -positive EECs, regardless of BMI. | In this study, obesity does not significantly influence EECs numbers or satiety hormone expression in the human colon. The results suggest that appetite dysregulation present in obesity group is not caused by alteration of gut hormone production, but may involve impaired hormone release or receptor sensitivity. | Small sample size. Cross-sectional study design. Assessment was limited to mRNA and protein expression; functional hormone secretion was not measured. Differences in patient group. No followed-up of patients. Hormone release from EECs and their activation in response to nutrient binding were not evaluated. | Others studies are necessary to establish the influence of gut microbiota and dietary components on nutrient-sensing receptors. Moreover, it is mandatory to assess the impact of obesity management interventions, such as weight loss and bariatric surgery, on gut microbiota components and hormone function. |
| Van Galen [40] | 20 subjects. * Randomized controlled crossover study. * To investigate the effects of 12-hour vs. 24-hour fasting on SERT and DAT availability in the hypothalamus/ thalamus and striatum using SPECT imaging, comparing lean vs. obese individuals. | Men. 50–75 yrs. BMI <25 kg/m2 and >30 kg/m2. Stable weight (<5% weight change in the last 3 months). | Use of any medication (except for thyroid hormone, antihypertensive, and/or lipid-lowering drugs). History of any psychiatric or eating disorder. Shift work, irregular sleeping habits, regular vigorous exercise. Substance abuse (smoking, alcohol >3 units/ day, and/or recreational drugs). Any contra-indication for MRI. | SPECT. Metabolic markers (FBG, insulin, glucagon, leptin, ghrelin). FFA. | Patients with normal BMI showed a significant increase in hypothalamic SERT availability after 24-hour fasting (p = 0.044), with no significant changes in the obesity group. Lean men had a significant drop in insulin and leptin compared to obese individuals. Increased FFA serum levels positively correlated with hypothalamic SERT availability and negatively correlated with striatal DAT availability. DAT availability did not significantly differ between fasting conditions. | Regarding of fasting effect, a 24-hour fast increases hypothalamic SERT availability in patients with normal BMI, with no effect in patients with obesity. The results from this study suggest that metabolic dysregulations observed in patients with obesity may influence the serotoninergic system, being a potential mechanism in obesity development. | Small sample size. All participants were male, so findings cannot be generalized to females. Participants had mostly Class I obesity, meaning results may not apply to severe obesity. Did not measure actual 5-HT or dopamine levels, only transporter availability. SPECT imaging resolution limits detailed analysis of neurotransmitter subregions. | Larger studies should investigate whether fasting may induce changes in serotonin signalling, and if these changes could predict weight loss outcomes. Also, these studies should include both male and female, to proper evaluate the sex-specific differences. Further exploration of 5-HT and DA receptor function in obesity is necessary. |
| Hartstra et al., 2020 [41] | 24 patients. * Double-blind randomized controlled intervention trial. * To investigate the effects of FMT from post-RYGB donors versus oral butyrate supplementation on the gut-brain axis, DAT and SERT binding, and metabolic outcomes in individuals with MetS. | 50–70 yrs. MetS. | Use of any medication in the last 3 months. Pre- and/or probiotics use. Substance abuse. eGFR <60 mL/min/1.73 m2. Contraindications for MRI. History of cardiovascular event. History of psychiatric disorder. | SPECT. Metabolic markers (FBG, insulin, HOMA-IR, plasma metabolites, resting energy expenditure and intestinal transit time, urinary 5-HIAA). Gut microbiota analysis (16S rRNA sequencing). | FMT from post-RYGB donors increased striatal DAT binding, while butyrate supplementation reduced DAT binding (p = 0.02). SERT binding in the hypothalamus showed a positive trend after FMT, but this was not significant. No significant effects of FMT or butyrate on weight or insulin sensitivity. Increased Bacteroides uniformis was associated with higher DAT binding, while increased Prevotella spp. was linked to lower DAT binding. Glycine, betaine, methionine, and lysine levels (metabolites involved in 5-HT and DA synthesis) were associated with changes in DAT expression. | Changes in gut microbiome were associated with alteration of DAT binding, with no effect on SERT availability. FMT increased brain DAT binding, while butyrate supplementation reduced DAT binding Despite these results, neither FMT or butyrate administration significantly influenced insulin sensitivity and body weight. | Small sample size. Cross-sectional study. No follow-up. No normal-weight control group. Did not measure actual neuro-transmitter levels, only transporter binding. Limited dietary control beyond monitoring via self-reported food diaries. | Larger, long-term studies are needed to confirm the gut-brain effects of FMT and butyrate. Including a normal-weight control group would help clarify obesity-related differences. Investigating whether modifying gut microbiota could serve as a therapeutic strategy for metabolic and neuropsychiatric disorders is essential. |
| Palmeira, 2019 [42] | 93 patients. * Case-control study. * To investigate the association of genetic variants associated with BED in overweight/obese women. | 20–58 yrs. BMI >25 kg/m2. Diagnosed BED. | Men. Other psychiatric condition than BED. Use of weight-loss medication or prior bariatric surgery. | Genetic polymorphisms (FTO, SLC6A4, DRD2, BDNF, GHRL). Psychological and behavioral assessment (EDE, BES). Anthropometric measurement. Metabolic biomarkers (FGB, lipid profile). | No significant association between any of the genetic variants and BED. Lower frequency of the FTO obesity risk in BED patients than in controls. SERT gene showed no association with BED (p = 0.689). DRD2 gene also showed no association with BED (p = 0.278). BDNF polymorphisms did not significantly differ between groups. GHRL polymorphisms were not associated with BED. | No correlations were found between BED and genetic polymorphisms (FTO, SLC6A4, DRD2, BDNF, or GHRL). The FTO gene, linked to obesity risk in other studies, was less frequent in BED patients than in controls. | Small sample size. No men included. No functional analysis of genetic polymorphisms’ implication on gene expression or metabolism. Findings contrast with previous studies linking FTO rs9939609 to other eating disorders (AN and BN). No interactions’ assessment between genetics and environmental factors (e.g., diet, stress). | Longitudinal research is necessary to determine the effect of genetic and environmental factors in the development of BED. Also, evaluating the impact of genetic variants on brain function and appetite regulation could provide new information regarding BED mechanisms and possible therapeutical approaches. |
| Fakhry, 2018 [43] | 6 patients. * Observational, descriptive study. * The characterization of different types of ECs in the human gastric fundus and corpus and to examine the relationships between EECs and other gastric mucosal cells. | 48–60 yrs. Gastric resection (greater curvature). Non-diabetic patients. | Diabetes. Patients with inflammatory or cancerous gastric conditions. History of prior gastric surgery. | Immunohistochemistry for specific ECs markers (ghrelin, 5-HT, somatostatin, PYY, GLP-1, gastrin and pancreastatin). | In four cases, through IHC methods, were found ghrelin, pancreastatin-, 5-HT-, and somatostatin-immunoreactive cells. In the process of calbindin, PYY and GLP-1 detections, few cells presented the last two searched markers. It was not obtained the IMR for calbindin in analyzed probes. It was used anti-H/K ATPase antibody to mark the parietal cells. 5-HT cells and somatostatin cells were less dense, compared to both ghrelin and pancreastatin in each region. 5-HT cells were evidenced by anit-5-HT antibodies – without IMR in mast cells, and positive IMR in EECs. 5-HT and somatostatin presented a small degree of colocalisation. | 5-HT and somatostatin cells are often closely associated with parietal cells, suggesting possible paracrine regulation of acid secretion. Enteroendocrine-like cells contain both pancreastatin and 5-HT, suggesting a novel subpopulation of 5-HT-releasing gastric cells. | Small sample size. Cross-sectional study design. No followed-up. Only obese patients undergoing surgery were included, excluding non-obese or diabetic individuals. No functional analysis of hormone secretion—only cell morphology and distribution were examined. Did not analyze how EECs distribution varies with diet, metabolic status, or obesity severity. | New research is needed to evaluate the role of gastric EECs in appetite regulation, acid secretion, and digestion. Research should investigate EECs’ changes in metabolic disorders such as DM, obesity, and after bariatric surgery. Further exploration of gut-brain signalling pathways involving 5-HT and ghrelin is essential. |
| Nam, 2018 [44] | 192 patients. * Cross-sectional study. * To evaluate the relationship between DAT and SERT availability in the brain and obesity. | >30 yrs. No history of neurological disorders. No use of medication affecting DAT or SERT. | Neurological disease. First-degree relatives with Parkinson’s disease. MoCA ≤ 26. Anticoagulation. Use of investigational drugs. | SPECT. Anthropometrics measurements. | Negative correlation between BMI and midbrain SERT (p = 0.0496) and positive correlation between BMI and midbrain SERT in non-obese individuals (p = 0.0053). Higher BMI was associated with increased SERT binding in the pons (p = 0.0026). DAT availability was not significantly correlated with BMI. SERT availability was significantly higher in men than women (p < 0.05). DAT availability decreased with age in the caudate nucleus (p = 0.0001), striatum (p = 0.0022) and thalamus (p = 0.0074). | Obesity influences midbrain SERT availability. Striatal DAT availability showed no correlation with BMI, whereas pontine SERT availability was positively correlated with BMI. SERT availability was higher in men, while DAT availability showed no sex-related differences. Both DAT and SERT exhibited age-related declines, consistent with previous studies. | Cross-sectional study design. No longitudinal follow-up to assess whether changes in neurotransmitter transporters predict weight gain or loss. Did not assess behavioral measures (e.g., appetite control, food reward sensitivity). BMI was used as the primary obesity measure, but fat distribution (visceral vs. subcutaneous fat) was not examined. Only transporter availability was assessed. | Further studies are needed to explore the associations between neuroimaging findings and BMI, specifically examining the effects of food intake, food stimulation, and glucose loading in both obese and lean individuals. Longitudinal studies are needed to determine whether SERT changes contribute to obesity development or result from obesity. Future research should incorporate additional measures, such as gut microbiota analysis and dietary intake, to better assess gut-brain interactions. Investigation into how 5-HT receptor function (5-HT1B, 5-HT2C) differs between obese and non-obese individuals is essential. |
| Groer, 2018 [45] | 374 participants. * Cross-sectional study. To investigate whether obesity-induced inflammation influences the TRP-KYN pathway and its potential effects on 5-HT availability, depression, and metabolic function in pregnancy. | Pregnant women. 2nd trimester. Prepregnancy BMI availability to classify participants into groups. | Drug or alcohol abuse. Autoimmune disease. Previous thyroid disease. Use of medication that could affect the immune function. BMI <18 kg/m2. In vitro fertilization, multiple pregnancies | Anthropometrics measurements. TRP metabolism (TRP, KYN, KYN/TRP ratio as an index for IDO-1 enzyme activation). Profile of mood state depression/dejection subscale instrument (POMS-D). Inflammatory biomarkers (neopterin, nitrite levels). | Patients with obesity before pregnancy experienced an increased weight during pregnancy compared with overweight. Women with obesity had significantly lower TRP levels compared to non-obese women (p < 0.01). KYN/TRP ratio was significantly higher in obese vs non-obese patients (p < 0.01) Nitrite levels was higher in patients with obesity (p < 0.05). TRP levels was lower in patients with high POMS-D score (p = 0.017). | In this study, KYN/TRP ratio was used as a substitute for IDO-1 activity. Increased IDO-1 activity may reduce 5-HT availability, contributing to mood disturbances and systemic inflammation. The findings support the hypothesis that systemic chronic inflammation from obesity influences 5-HT synthesis, which might increase the risk of depression and metabolic dysfunction during pregnancy. | Cross-sectional study design. The participants were not followed during pregnancy and postpartum. Lack of inflammatory markers measurements. Did not directly measure 5-HT or its metabolites. Did not assess dietary intake, which could influence TRP and KYN levels. POMS-D was not validated in pregnancy. | Longitudinal studies are needed to track TRP metabolism throughout pregnancy and postpartum. Moreover, measuring 5-HT and its metabolites is essential to confirm the effects of TRP depletion or IDO-1 pathway of TRP’s metabolization. Further research should investigate the influence of diet and the microbiome on TRP metabolism. |
| Drabe, 2017 [46] | 44 patients. * Cross-sectional study. * To investigate DNA methylation of the SERT gene and its relation to SERT availability and reward function in obesity. | 21–59 yrs. BMI >35 kg/m2. No history of psychiatric disorder or major metabolic disease | Alcohol or drug abuse. Neurological or psychiatric disorders. Current use of medication affecting brain 5-HT function. Diabetes (insulin-dependent or poorly controlled). Contraindications for MRI. | PET. Genetic and epigenetic assessments (SERTLPR genotyping, DNA methylation). Reward sensitivity assessment (BAS, BIS). Anthropometric measurements. Metabolic biomarkers (FBG, insulin, HbA1c). | Increased levels of SERTLPR were associated with lower SERT availability in the prefrontal cortex of obese individuals (p < 0.05). Higher rates of CpG10 methylation in the SERTLPR gene were associated with greater reward sensitivity in obesity (p = 0.001). SERTLPR methylation was not directly correlated with BMI values. | The results from this study highlights the obesity implication in SERT availability, by epigenetic modifications of the SERT gene, along with neurobiological alteration in the reward sensitivity center. These findings explain the compulsive eating in patients with obesity. | Small sample size. Cross-sectional study design. Peripheral blood leukocytes were used to assess SERTLPR methylation, which may not fully reflect brain methylation patterns. The exclusion of SERTLPR/rs25531 genotype. Did not investigate the 5-HT receptor system or 5-HT metabolism. No dietary intake or eating behavior assessment beyond BAS/BIS scales. | Longitudinal studies are needed to assess whether SERTLPR methylation changes over time with weight gain or loss. Research should explore the impact of dietary and behavioural interventions on 5-HT -related reward processing. Further investigation is required to determine whether pharmacological or lifestyle interventions targeting 5-HT signaling can reduce ED in obesity. |
| Ioannou, 2016. [47] | 14 patients. * Randomized, placebo-controlled study. * To determine whether 5-HTP influences brain activity in response to food stimuli, potentially affecting food preferences. | Patients in the mid-20s of life. No physical, neurological, or ED. Not taking any medications affecting 5-HT function. | Psychiatric or neurological disorders. History of ED. Chronic medication. | Functional MRI. Food stimuli categories (visual stimuli). Macronutrient preference and food recall. | In the 5-HT group, patients exhibited increased activation in prefrontal cortex, limbic structures and basal ganglia, compared to Vitamin C group. In the Vitamin C group, increased activation was observed in visual processing areas, including the fusiform gyrus, occipital lobe, and temporal gyrus. Not statistically significant difference between caloric intake recalls between 5-HT group and Vitamin C group. | The results of this study sustain the brain activation signature differs according to food preferences, along with 5-HT role in regulating food selection and eating behaviors. Patients from 5-HT group exhibited a stronger preference for protein-rich foods, and patients from Vitamin C group, for high-calorie and carbohydrate-rich food. | Small sample size. Short-term study. Did not measure actual food intake after scanning, only food recall and brain activity. Did not directly measure 5-HT levels in blood or cerebrospinal fluid. Limited control over dietary habits before the experiment. | Long-term studies are needed to assess the sustained effects of 5-HT on food preferences and weight management. Moreover, direct measurement of 5-HT levels is necessary to establish its implication and possible mechanism. |
| Frigerio, 2021 [48] | 1391 patients. * Cross-sectional study. * To identify the metabolome profile of individuals with overweight and obesity and to explore the association between metabolites and obesity-related metabolic dysfunction. | >18 yrs. BMI > 25 kg/m2. Residents of Lombardy, Italy. [51] | Pregnant or breastfeeding women. History of cancer, heart disease, stroke, multiple sclerosis, Alzheimer’s disease, Parkinson’s disease, psychiatric diseases, epilepsy. | Anthropometric measurements. Metabolomic profile (amino acids, biogenic amines, acylcarnitine, sphingolipids and glycerophospholipids, hexose) | In this study, patients had increased BCAA, AAA, KYN, and hexoses serum levels, along with decreased phosphatidylcholines, lysophosphatidylcholines, and 5-HT serum levels. Increased levels of BCAAs and AAAs were positively correlated with metabolic risk factors (BMI, insulin resistance). Lipid profile modification correlated with higher BMI. 5-HT levels were negatively associated with BMI. KYN was positively associated with BMI. | The results of this study highlighted that obesity is associated with increased serum levels of BCAA, AAA, and glucose-related metabolites. Also, low serum levels of 5-HT levels correlate with obesity, suggesting a possible pathway between neurotransmitter function and obesity. | Cross-sectional study design. Did not measure hormone levels (insulin, leptin, cortisol) to link metabolism with obesity. The metabolome is influenced by diet. The majority of patients were female. No correlation between metabolomic profile and metabolic status. | Longitudinal studies are needed to assess metabolic changes over time in obesity progression, along with the incorporation of dietary intake and microbiome analysis to refine metabolic associations. Additionally, investigating 5-HT’s role in both the metabolic and psychological aspects of obesity may be crucial in understanding obesity-related metabolic risk |
| Grundmann, 2020 [49] | 37 patients. * Cross-sectional study. * To evaluate the association between central SERT and HbA1c levels in patients with obesity and without T2DM. | Adults with obesity (BMI > 35 kg/m2). HbA1c ≤ 5.9%. | Obesity due to prediabetic metabolism. History of psychiatric or neurological disease. Family history of psychiatric disease. Metabolic risk factors (resistant HTN, DM). Centrally-acting medication. Diet in the last 6 months. Alcohol or drugs use. Pregnancy or breastfeeding. Contraindication for MRI. | Blood biomarkers (HbA1c, BDNF). SERT. PET. | Increased HbA1c levels are associated with lower hippocampal SERT availability in obesity individuals. In patients with structural changes in the hippocampus were observed increased serum levels of HbA1c. In individuals with the S allele of the SERT gene, higher values of HbA1c correlated with lower BDNF levels. No significant differences in overall SERT availability between obese and non-obese individuals. | The results of this study suggest that chronic high blood glucose levels may be involved in hippocampus’ microstructural changes, and possible alteration of 5-HT signaling pathways. The effects of these alterations imply cognitive, appetite, and metabolic dysregulations. Also, BDNF could be the connection between glucose metabolism and hippocampal 5-HT function, especially in individuals with certain genetic variants. | Small sample size. Cross-sectional study design. Only non-diabetic individuals were included, so findings may not apply to obese individuals with diabetes. Did not measure FBG or insulin, which could further clarify metabolic dysfunction. No direct assessment of 5-HT levels, only SERT availability. | Longitudinal studies are needed to assess whether high levels of HbA1c interfere with 5-HT changes, and these could predict cognitive impairment or metabolic dysfunction over time. Including patients with T2DM is essential to establish whether these modifications are more important in diabetic populations. Further research should explore gut-brain interactions, particularly the microbiome’s influence on 5-HT signaling. |
| Versteeg et al. 2017 [50] | 20 patients. * Case-control study. * To investigate whether SERT and DAT binding differ in lean, ISO, and IRO individuals. | 21–59 yrs. BMI >35 kg/m2. Normal liver, renal, thyroid function. Non-smokers. No medication use. Stable weight in the last 3 months. | Pregnancy. History of psychiatric, eating disorders. Shift workers. Substance abuse. | SPECT. Metabolic biomarkers (FBG, insulin, C-peptide levels). Anthropometric measurements. | SERT binding in the diencephalon was significantly lower IRO individuals compared to ISO (p = 0.009) and lean individuals (p = 0.019). Not statistically significant difference between the three groups regarding hypothalamic SERT binding (p = 0.059). No difference between groups regarding DAT availability in the striatum. Lower diencephalic SERT binding correlated with increase HOMA-IR score. | The results of this study highlight a possible link between 5-HT signaling and insulin resistance, independent of body weight. Reduced 5-HT function in patients with increased values of HOMA-IR, regardless of their BMI, could explain metabolic modifications along with the 5-HT implication in insulin sensitivity. | Small sample size. The radiotracer is not selective regarding SERT vs DAT binding. Did not measure 5-HT levels directly—only transporter availability. Did not assess dietary intake, which could influence 5-HT function. | Longitudinal studies are needed to assess whether SERT availability changes in response to metabolic interventions. Also, advancements in imaging techniques are needed to improve the analysis of SERT availability. |
| Mechanism | Features | Reference |
|---|---|---|
| Metabolic factors | Increased BCAA concentrations can lead to Insulin resistance. | [37,48] |
| Dysregulation of BCAAs pathways lead to serotonin signaling impairment. | [36,37,48] | |
| 5-HT, GH and IGF-1 interfere with β-cell mass expansion leading to obesity and an increased risk of T2DM later in life. | [35] | |
| Decreased levels of 5-HT correlate with mood disturbances and overeating. | [33,34,35] | |
| Microbiome rich in Prevotella spp. contribute to insulin resistance via BCAA production. | [36] | |
| Insulin resistance is associated with impaired 5-HT signaling and chronic inflammation. | [45,50] | |
| Serotonin-dopamine dysregulation leads to increased appetite for high-calorie food, leading to obesity. | [30,33,34] | |
| Microbiota and diet habits | 5-HT levels are decreased in patients with obesity, being influenced by diet habits and sleep disturbances. | [29,32] |
| Peripheral serotonin influences the brain-serotonin via vagal signaling. | [31,35,48] | |
| Tryptophan metabolism dysregulation decreases the brain serotonin production. | [31,36,37,45,48] | |
|
High-fat diets contribute to microbiota dysregulation, which maintains low-grade inflammation through increased Prevotella spp. | [36] | |
| SCFAs improve serotonin signaling | [41] | |
| Genetics | Genetic variants such as rs6265 (for BDNF) or SLC6A4 (for 5-HTTLPR), are genetic variations which affect serotonin signaling and may contribute to obesity through increased appetite. | [42,46] |
| Neurotransmitters | Dopamine and serotonin modulate motivation and reward mechanisms through 5HT receptors and D1 receptors. | [30,44,47] |
| Serotonergic agonists via 5-HT1B and 5-HT2C receptors and antagonism via 5-HT6 receptor lead to an anorexic effect. | [38] | |
| Enterochromaffin cells release serotonin in response to gastrointestinal tract content. | [39,43] | |
| High levels of HbA1c interfere with SERT availability in the hippocampus of patients with obesity. BDNF is involved in pathogenesis of T2DM, depression and dementia. | [49] | |
| In obesity, fasting did not increase SERT availability, suggesting a chronic perturbation in serotonergic signaling. | [40] | |
| BMI influences brain communication pattern, through serotoninergic and dopaminergic systems. | [30] | |
| Serotonin and dopamine dysregulations contribute to eating disorders and obesity. | [46] |
Disclaimer/Publisher’s Note: The statements, opinions and data contained in all publications are solely those of the individual author(s) and contributor(s) and not of MDPI and/or the editor(s). MDPI and/or the editor(s) disclaim responsibility for any injury to people or property resulting from any ideas, methods, instructions or products referred to in the content. |
© 2025 by the authors. Licensee MDPI, Basel, Switzerland. This article is an open access article distributed under the terms and conditions of the Creative Commons Attribution (CC BY) license (https://creativecommons.org/licenses/by/4.0/).
Share and Cite
Cîmpeanu, R.-C.; Caragea, E.-M.; Mustață, L.-M.; Forțofoiu, D.; Dragne, I.-G.; Alexa, R.-E.; Balta, A.; Ceasovschih, A.; Șorodoc, L.; Săndulescu, L.-D. The Involvement of Serotonin in the Obesity Pathway—A Last Decade Systematic Review of the Literature. Int. J. Mol. Sci. 2025, 26, 3081. https://doi.org/10.3390/ijms26073081
Cîmpeanu R-C, Caragea E-M, Mustață L-M, Forțofoiu D, Dragne I-G, Alexa R-E, Balta A, Ceasovschih A, Șorodoc L, Săndulescu L-D. The Involvement of Serotonin in the Obesity Pathway—A Last Decade Systematic Review of the Literature. International Journal of Molecular Sciences. 2025; 26(7):3081. https://doi.org/10.3390/ijms26073081
Chicago/Turabian StyleCîmpeanu, Radu-Cristian, Emilia-Mariana Caragea, Lorena-Maria Mustață, Dragoș Forțofoiu, Ioana-Gabriela Dragne, Raluca-Elena Alexa, Anastasia Balta, Alexandr Ceasovschih, Laurențiu Șorodoc, and Larisa-Daniela Săndulescu. 2025. "The Involvement of Serotonin in the Obesity Pathway—A Last Decade Systematic Review of the Literature" International Journal of Molecular Sciences 26, no. 7: 3081. https://doi.org/10.3390/ijms26073081
APA StyleCîmpeanu, R.-C., Caragea, E.-M., Mustață, L.-M., Forțofoiu, D., Dragne, I.-G., Alexa, R.-E., Balta, A., Ceasovschih, A., Șorodoc, L., & Săndulescu, L.-D. (2025). The Involvement of Serotonin in the Obesity Pathway—A Last Decade Systematic Review of the Literature. International Journal of Molecular Sciences, 26(7), 3081. https://doi.org/10.3390/ijms26073081