
Assessment of Cardiovascular Risk in the PURE Poland Cohort Study Using the Systematic Coronary Risk Evaluation (SCORE) Scale and Galectin-3 Concentrations: A Cross-Sectional Study

 ,
,  ,
,  and
and
Abstract
1. Introduction
2. Results
3. Discussion
4. Materials and Methods
5. Conclusions
Author Contributions
Funding
Institutional Review Board Statement
Informed Consent Statement
Data Availability Statement
Conflicts of Interest
Abbreviations
| AH | Arterial hypertension |
| BMI | Body mass index |
| BP | Blood pressure |
| CVD | Cardiovascular diseases |
| EF | Ejection fraction |
| FDA | Food and Drug Administration |
| FRS | Framingham Risk Score |
| DBP | Diastolic blood pressure |
| Gal-3 | Galectin-3 |
| HDL | High-density lipoprotein |
| HF | Heart failure |
| HFpEF | Heart failure with preserved ejection fraction |
| HR | Hazard ratio |
| LDL | Low-density lipoprotein |
| LR− | Negative likelihood ratio |
| LR+ | Positive likelihood ratio |
| Me | Median |
| NPV | Negative predictive value |
| PPV | Positive predictive value |
| PURE | Prospective Urban and Rural Epidemiological Study |
| ROC | Receiver operating characteristic |
| SBP | Systolic blood pressure |
| SCORE | Systematic Coronary Risk Evaluation |
| SD | Standard deviation |
| Q1 | first quartile (25th percentile) |
| Q3 | third quartile (75th percentile) |
References
- Timmis, A.; Townsend, N.; Gale, C.P.; Torbica, A.; Lettino, M.; Petersen, S.E.; Mossialos, E.A.; Maggioni, A.P.; Kazakiewicz, D.; May, H.T.; et al. European Society of Cardiology: Cardiovascular Disease Statistics 2019. Eur. Heart J. 2020, 41, 12–85. [Google Scholar] [CrossRef] [PubMed]
- Conroy, R. Estimation of Ten-Year Risk of Fatal Cardiovascular Disease in Europe: The SCORE Project. Eur. Heart J. 2003, 24, 987–1003. [Google Scholar] [CrossRef] [PubMed]
- Ibrahim, N.E.; Januzzi, J.L. Established and Emerging Roles of Biomarkers in Heart Failure. Circ. Res. 2018, 123, 614–629. [Google Scholar] [CrossRef]
- Cheng, J.M.; Akkerhuis, K.M.; Battes, L.C.; Van Vark, L.C.; Hillege, H.L.; Paulus, W.J.; Boersma, E.; Kardys, I. Biomarkers of Heart Failure with Normal Ejection Fraction: A Systematic Review. Eur. J. Heart Fail. 2013, 15, 1350–1362. [Google Scholar] [CrossRef] [PubMed]
- Aguilar, D.; Sun, C.; Hoogeveen, R.C.; Nambi, V.; Selvin, E.; Matsushita, K.; Saeed, A.; McEvoy, J.W.; Shah, A.M.; Solomon, S.D.; et al. Levels and Change in Galectin-3 and Association With Cardiovascular Events: The ARIC Study. JAHA 2020, 9, e015405. [Google Scholar] [CrossRef]
- Baccouche, B.M.; Mahmoud, M.A.; Nief, C.; Patel, K.; Natterson-Horowitz, B. Galectin-3 Is Associated with Heart Failure Incidence: A Meta-Analysis. CCR 2023, 19, e171122211004. [Google Scholar] [CrossRef]
- Blanda, V.; Bracale, U.M.; Di Taranto, M.D.; Fortunato, G. Galectin-3 in Cardiovascular Diseases. Int. J. Mol. Sci. 2020, 21, 9232. [Google Scholar] [CrossRef]
- Yancy, C.W.; Jessup, M.; Bozkurt, B.; Butler, J.; Casey, D.E.; Drazner, M.H.; Fonarow, G.C.; Geraci, S.A.; Horwich, T.; Januzzi, J.L.; et al. 2013 ACCF/AHA Guideline for the Management of Heart Failure. J. Am. Coll. Cardiol. 2013, 62, e147–e239. [Google Scholar] [CrossRef]
- Ponikowski, P.; Voors, A.A.; Anker, S.D.; Bueno, H.; Cleland, J.G.F.; Coats, A.J.S.; Falk, V.; González-Juanatey, J.R.; Harjola, V.; Jankowska, E.A.; et al. 2016 ESC Guidelines for the Diagnosis and Treatment of Acute and Chronic Heart Failure: The Task Force for the Diagnosis and Treatment of Acute and Chronic Heart Failure of the European Society of Cardiology (ESC). Developed with the Special Contribution of the Heart Failure Association (HFA) of the ESC. Eur. J Heart Fail 2016, 18, 891–975. [Google Scholar] [CrossRef]
- Zaborska, B.; Sikora-Frąc, M.; Smarż, K.; Pilichowska-Paszkiet, E.; Budaj, A.; Sitkiewicz, D.; Sygitowicz, G. The Role of Galectin-3 in Heart Failure—The Diagnostic, Prognostic and Therapeutic Potential—Where Do We Stand? Int. J. Mol. Sci. 2023, 24, 13111. [Google Scholar] [CrossRef]
- Zatońska, K.; Psikus, P.; Basiak-Rasała, A.; Stępnicka, Z.; Wołyniec, M.; Wojtyła, A.; Szuba, A.; Połtyn-Zaradna, K. Patterns of Alcohol Consumption in the PURE Poland Cohort Study and Their Relationship with Health Problems. Int. J. Environ. Res. Public Health 2021, 18, 4185. [Google Scholar] [CrossRef] [PubMed]
- Dancey, C.P.; Reidy, J. Statistics Without Maths for Psychology, 4th ed.; Pearson Education Limited: Harlow, UK, 2007; ISBN 978-0-13-205160-6. [Google Scholar]
- Gagno, G.; Padoan, L.; Stenner, E.; Beleù, A.; Ziberna, F.; Hiche, C.; Paldino, A.; Barbati, G.; Biolo, G.; Fiotti, N.; et al. Galectin 3 and Galectin 3 Binding Protein Improve the Risk Stratification after Myocardial Infarction. J. Clin. Med. 2019, 8, 570. [Google Scholar] [CrossRef]
- Brouwers, F.P.; Van Gilst, W.H.; Damman, K.; Van Den Berg, M.P.; Gansevoort, R.T.; Bakker, S.J.L.; Hillege, H.L.; Van Veldhuisen, D.J.; Van Der Harst, P.; De Boer, R.A. Clinical Risk Stratification Optimizes Value of Biomarkers to Predict New-Onset Heart Failure in a Community-Based Cohort. Circ. Heart Fail. 2014, 7, 723–731. [Google Scholar] [CrossRef]
- Xue, S.; Lozinski, B.M.; Ghorbani, S.; Ta, K.; D’Mello, C.; Yong, V.W.; Dong, Y. Elevated Galectin-3 Is Associated with Aging, Multiple Sclerosis, and Oxidized Phosphatidylcholine-Induced Neurodegeneration. J. Neurosci. 2023, 43, 4725–4737. [Google Scholar] [CrossRef]
- Sanchis-Gomar, F.; Santos-Lozano, A.; Pareja-Galeano, H.; Garatachea, N.; Alis, R.; Fiuza-Luces, C.; Morán, M.; Emanuele, E.; Lucia, A. Galectin-3, Osteopontin and Successful Aging. Clin. Chem. Lab. Med. CCLM 2016, 54, 873–877. [Google Scholar] [CrossRef]
- Sharma, J.R.; Dubey, A.; Yadav, U.C.S. Cigarette Smoke-Induced Galectin-3 as a Diagnostic Biomarker and Therapeutic Target in Lung Tissue Remodeling. Life Sci. 2024, 339, 122433. [Google Scholar] [CrossRef] [PubMed]
- Schwerg, M.; Eilers, B.; Wienecke, A.; Baumann, G.; Laule, M.; Knebel, F.; Stangl, K.; Stangl, V. Galectin-3 and Prediction of Therapeutic Response to Renal Sympathetic Denervation. Clin. Exp. Hypertens. 2016, 38, 399–403. [Google Scholar] [CrossRef]
- Zeytinli Aksit, M.; Demet Arslan, F.; Karakoyun, I.; Aydin, C.; Turgut, E.; Parildar, H.; Gokbalci, U.; Isbilen Basok, B.; Duman, C.; Emiroglu, M. Galectin-3 Levels and Inflammatory Response in Patients Undergoing Bariatric Surgery. Cytokine 2022, 151, 155793. [Google Scholar] [CrossRef] [PubMed]
- Święcki, P.; Sawicki, R.; Knapp, M.; Kamiński, K.A.; Ptaszyńska-Kopczyńska, K.; Sobkowicz, B.; Lisowska, A. Galectin-3 as the Prognostic Factor of Adverse Cardiovascular Events in Long-Term Follow up in Patients after Myocardial Infarction—A Pilot Study. J. Clin. Med. 2020, 9, 1640. [Google Scholar] [CrossRef] [PubMed]
- Gyöngyösi, H.; Szőllősi, G.J.; Csenteri, O.; Jancsó, Z.; Móczár, C.; Torzsa, P.; Andréka, P.; Vajer, P.; Nemcsik, J. Differences between SCORE, Framingham Risk Score, and Estimated Pulse Wave Velocity-Based Vascular Age Calculation Methods Based on Data from the Three Generations Health Program in Hungary. J. Clin. Med. 2023, 13, 205. [Google Scholar] [CrossRef]
- Miljković, M.; Stefanović, A.; Bogavac-Stanojević, N.; Simić-Ogrizović, S.; Dumić, J.; Cerne, D.; Jelić-Ivanović, Z.; Kotur-Stevuljević, J. Association of Pentraxin-3, Galectin-3 and Matrix Metalloproteinase-9/Timp-1 with Cardiovascular Risk in Renal Disease Patients. ACC 2017, 56, 673–680. [Google Scholar] [CrossRef] [PubMed]
- Martínez-Martínez, E.; Calvier, L.; Fernández-Celis, A.; Rousseau, E.; Jurado-López, R.; Rossoni, L.V.; Jaisser, F.; Zannad, F.; Rossignol, P.; Cachofeiro, V.; et al. Galectin-3 Blockade Inhibits Cardiac Inflammation and Fibrosis in Experimental Hyperaldosteronism and Hypertension. Hypertension 2015, 66, 767–775. [Google Scholar] [CrossRef] [PubMed]
- Todor, S.B.; Ichim, C.; Boicean, A.; Mihaila, R.G. Cardiovascular Risk in Philadelphia-Negative Myeloproliferative Neoplasms: Mechanisms and Implications-A Narrative Review. Curr. Issues Mol. Biol. 2024, 46, 8407–8423. [Google Scholar] [CrossRef] [PubMed]

| Quantitative Variables | |||||
|---|---|---|---|---|---|
| Variable | Mean | Median | Q1 | Q3 | SD |
| Age [years] | 55.54 | 56.00 | 49.00 | 61.00 | 8.00 |
| BMI [kg/m2] | 28.06 | 27.24 | 24.07 | 31.26 | 5.46 |
| SBP [mmHg] | 137.91 | 137.00 | 126.50 | 148.50 | 15.91 |
| DBP [mmHg] | 82.73 | 82.50 | 76.50 | 89.00 | 9.80 |
| Total cholesterol [mg/dL] | 175.93 | 181.00 | 166.00 | 190.00 | 18.64 |
| Triglycerides [mg/dL] | 103.40 | 91.00 | 70.00 | 119.00 | 54.57 |
| LDL cholesterol [mg/dL] | 100.95 | 102.00 | 88.00 | 113.00 | 18.18 |
| HDL cholesterol [mg/dL] | 54.70 | 53.00 | 44.00 | 64.00 | 14.02 |
| Glucose [mg/dL] | 95.56 | 95.00 | 88.00 | 101.00 | 11.10 |
| Galectin-3 [ng/mL] | 305.38 | 221.32 | 161.64 | 360.00 | 209.84 |
| SCORE | 2.96 | 2.00 | 1.00 | 4.00 | 3.33 |
| Qualitative Variables | |||||
| Variable | Absolute Value | Percentage | |||
| Male gender | 109 | 42.1% | |||
| Female gender | 150 | 57.9% | |||
| Smoking | 37 | 14.3% | |||
| SCORE < 1% | 37 | 14.3% | |||
| SCORE 1–4% | 167 | 64.5% | |||
| SCORE 5–9% | 34 | 13.1% | |||
| SCORE ≥ 10% | 21 | 8.1% | |||
| Variable | Galectin-3 [ng/mL] | |||
|---|---|---|---|---|
| Median | Q1 | Q3 | ||
| Age a | ≥Me (≥56 years) | 228.09 | 177.44 | 456.33 |
| <Me (<56 years) | 209.13 | 152.06 | 301.90 | |
| p | p < 0.05 | |||
| Gender | male | 247.31 | 191.71 | 448.66 |
| female | 199.73 | 154.33 | 313.41 | |
| p | p < 0.05 | |||
| Smoking | yes | 410.00 | 237.20 | 709.11 |
| no | 206.27 | 156.19 | 302.54 | |
| p | p < 0.05 | |||
| SBP a | ≥Me (≥137.0 mmHg) | 302.35 | 221.38 | 584.75 |
| <Me (<137.00 mmHg) | 170.67 | 144.82 | 213.01 | |
| p | p < 0.05 | |||
| Total cholesterol a | ≥Me (≥181 mg/dL) | 229.17 | 162.45 | 410.93 |
| <Me (<181 mg/dL) | 208.90 | 160.94 | 302.54 | |
| p | not statistically significant | |||
| SCORE | <1% | 177.16 | 130.12 | 259.28 |
| 1–4% | 206.42 | 161.64 | 299.69 | |
| 5–9% | 450.05 | 207.72 | 639.24 | |
| ≥10% | 382.99 | 243.00 | 699.89 | |
| p | p < 0.05 for: <1% vs. 5–9%, <1% vs. ≥10%, 1–4% vs. 5–9%, 1–4% vs. ≥10% | |||
| <1% | 177.16 | 130.12 | 259.28 | |
| ≥1% | 225.61 | 168.35 | 389.43 | |
| p | p < 0.05 | |||
| <5% | 205.63 | 155.19 | 282.75 | |
| ≥5% | 429.80 | 232.98 | 653.63 | |
| p | p < 0.05 | |||
| <10% | 209.22 | 160.24 | 337.33 | |
| ≥10% | 382.99 | 243.00 | 699.89 | |
| p | p < 0.05 | |||
| Variable | SCORE [%] | |||
|---|---|---|---|---|
| Median | Q1 | Q3 | ||
| Galectin-3 a | <Me (<221.31 ng/mL) | 1.00 | 1.00 | 2.00 |
| ≥Me (≥221.31 ng/mL) | 2.00 | 1.00 | 6.00 | |
| p b | <0.05 | |||
| Model for Galectin-3 [ng/mL] | ||||
|---|---|---|---|---|
| Regression Coefficient | SEM of Rc | p | p of the Model | |
| SCORE | 22.443 | 3.305 | <0.001 | <0.01 |
| DBP | 7.537 | 0.878 | <0.001 | |
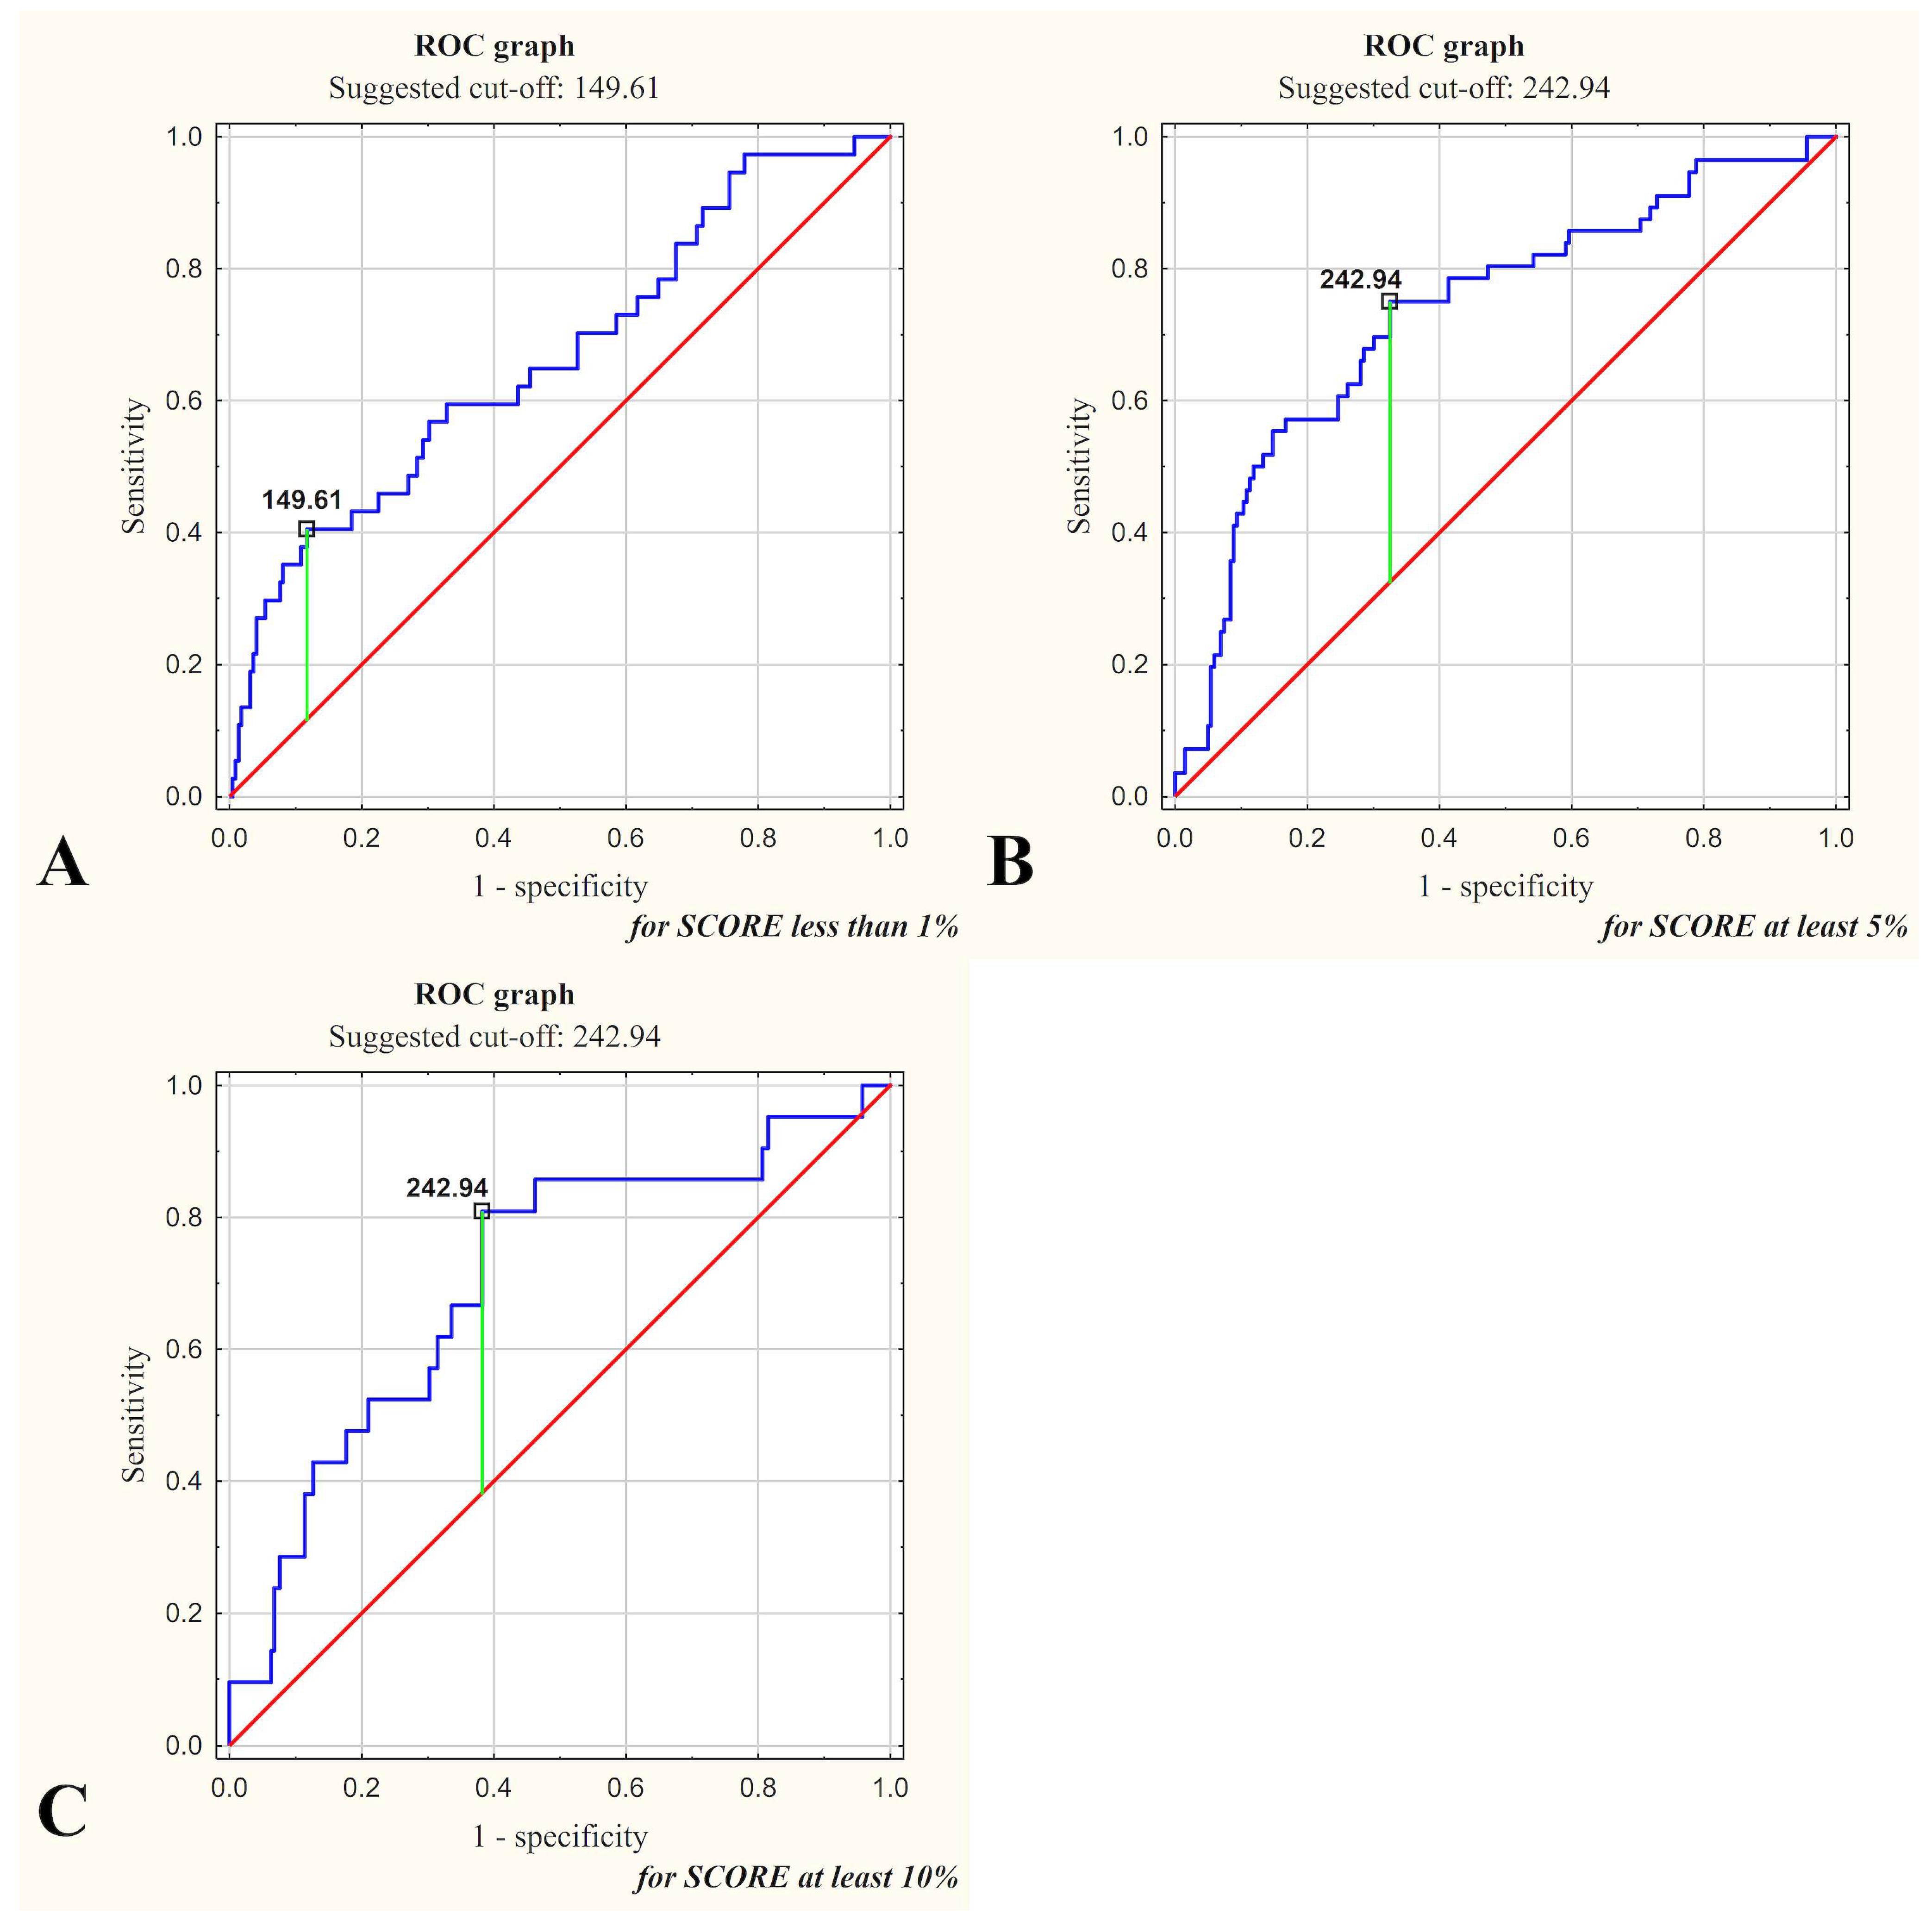
| Variable | SCORE < 1% | SCORE ≥ 5% | SCORE ≥ 10% |
|---|---|---|---|
| Galectin-3 Concentration as Predictor of SCORE | <149.61 ng/mL | ≥242.94 ng/mL | ≥242.94 ng/mL |
| Sensitivity | 0.883 a | 0.675 | 0.618 |
| Specificity | 0.378 | 0.750 | 0.810 a |
| Accuracy | 0.811 a | 0.691 | 0.633 |
| LR+ | 1.420 | 2.700 | 3.243 |
| LR− | 0.310 | 0.433 | 0.472 |
| PPV | 0.895 | 0.907 | 0.974 |
| NPV | 0.350 | 0.389 | 0.157 |
| Variable | Galectin-3 [ng/mL] | p | ||||
|---|---|---|---|---|---|---|
| Gender | Risk Factor | Subgroup | Median | Q1 | Q3 | |
| Female | Age a | ≥Me (≥56 years) | 205.63 | 167.60 | 351.16 | ns |
| <Me (<56 years) | 177.66 | 144.37 | 273.10 | |||
| Male | ≥Me (≥56 years) | 259.65 | 199.38 | 575.68 | p < 0.05 | |
| <Me (<56 years) | 228.12 | 174.85 | 369.51 | |||
| Female | Smoking | yes | 301.90 | 237.08 | 677.43 | p < 0.05 |
| no | 187.32 | 150.20 | 279.13 | |||
| Male | yes | 527.29 | 274.83 | 727.84 | p < 0.05 | |
| no | 238.24 | 176.63 | 354.63 | |||
| Female | SBP a | ≥Me (≥137 mmHg) | 332.25 | 214.78 | 566.94 | p < 0.05 |
| <Me (<137 mmHg) | 166.55 | 140.15 | 566.94 | |||
| Male | ≥Me (≥137 mmHg) | 278.36 | 221.45 | 593.82 | p < 0.05 | |
| <Me (<137 mmHg) | 190.79 | 153.25 | 256.22 | |||
| Female | Total cholesterol a | ≥Me (≥181 mg/dL) | 209.11 | 156.84 | 376.89 | p < 0.05 |
| <Me (<181 mg/dL) | 182.71 | 149.86 | 249.29 | |||
| Male | ≥Me (≥181 mg/dL) | 251.76 | 191.71 | 516.90 | ns | |
| <Me (<181 mg/dL) | 243.00 | 190.37 | 448.66 | |||
Disclaimer/Publisher’s Note: The statements, opinions and data contained in all publications are solely those of the individual author(s) and contributor(s) and not of MDPI and/or the editor(s). MDPI and/or the editor(s) disclaim responsibility for any injury to people or property resulting from any ideas, methods, instructions or products referred to in the content. |
© 2025 by the authors. Licensee MDPI, Basel, Switzerland. This article is an open access article distributed under the terms and conditions of the Creative Commons Attribution (CC BY) license (https://creativecommons.org/licenses/by/4.0/).
Share and Cite
Martuszewski, A.; Paluszkiewicz, P.; Połtyn-Zaradna, K.; Kusnerż, A.; Poręba, R.; Szuba, A.; Gać, P.; Zatońska, K. Assessment of Cardiovascular Risk in the PURE Poland Cohort Study Using the Systematic Coronary Risk Evaluation (SCORE) Scale and Galectin-3 Concentrations: A Cross-Sectional Study. Int. J. Mol. Sci. 2025, 26, 3064. https://doi.org/10.3390/ijms26073064
Martuszewski A, Paluszkiewicz P, Połtyn-Zaradna K, Kusnerż A, Poręba R, Szuba A, Gać P, Zatońska K. Assessment of Cardiovascular Risk in the PURE Poland Cohort Study Using the Systematic Coronary Risk Evaluation (SCORE) Scale and Galectin-3 Concentrations: A Cross-Sectional Study. International Journal of Molecular Sciences. 2025; 26(7):3064. https://doi.org/10.3390/ijms26073064
Chicago/Turabian StyleMartuszewski, Adrian, Patrycja Paluszkiewicz, Katarzyna Połtyn-Zaradna, Agnieszka Kusnerż, Rafał Poręba, Andrzej Szuba, Paweł Gać, and Katarzyna Zatońska. 2025. "Assessment of Cardiovascular Risk in the PURE Poland Cohort Study Using the Systematic Coronary Risk Evaluation (SCORE) Scale and Galectin-3 Concentrations: A Cross-Sectional Study" International Journal of Molecular Sciences 26, no. 7: 3064. https://doi.org/10.3390/ijms26073064
APA StyleMartuszewski, A., Paluszkiewicz, P., Połtyn-Zaradna, K., Kusnerż, A., Poręba, R., Szuba, A., Gać, P., & Zatońska, K. (2025). Assessment of Cardiovascular Risk in the PURE Poland Cohort Study Using the Systematic Coronary Risk Evaluation (SCORE) Scale and Galectin-3 Concentrations: A Cross-Sectional Study. International Journal of Molecular Sciences, 26(7), 3064. https://doi.org/10.3390/ijms26073064