

Adiponectin and TNF-Alpha Differentially Mediate the Association Between Cystatin C and Oxidized LDL in Type 2 Diabetes Mellitus Patients

 , ,
, ,
Abstract
1. Introduction
2. Results
2.1. Baseline Characteristics of the Study Subjects with T2DM
2.2. Quantification of Plasma and Urinary Cys-C and ox-LDL Levels Among T2DM Patients
2.3. Correlations Between Plasma and Urinary Cys-C and ox-LDL Levels and Clinical Parameters in T2DM Patients
2.4. Univariate Regression Analysis for the Association of Plasma and Urinary Cys-C with ox-LDL in T2DM Patients
2.5. Multivariate Regression Analysis for the Association Between Plasma and Urinary Cys-C with ox-LDL in T2DM Patients
2.6. Stepwise Regression Analysis for the Identification of the Best Predictors for the Association with ox-LDL Among Circulating Adipokines and Cytokines in T2DM Patients
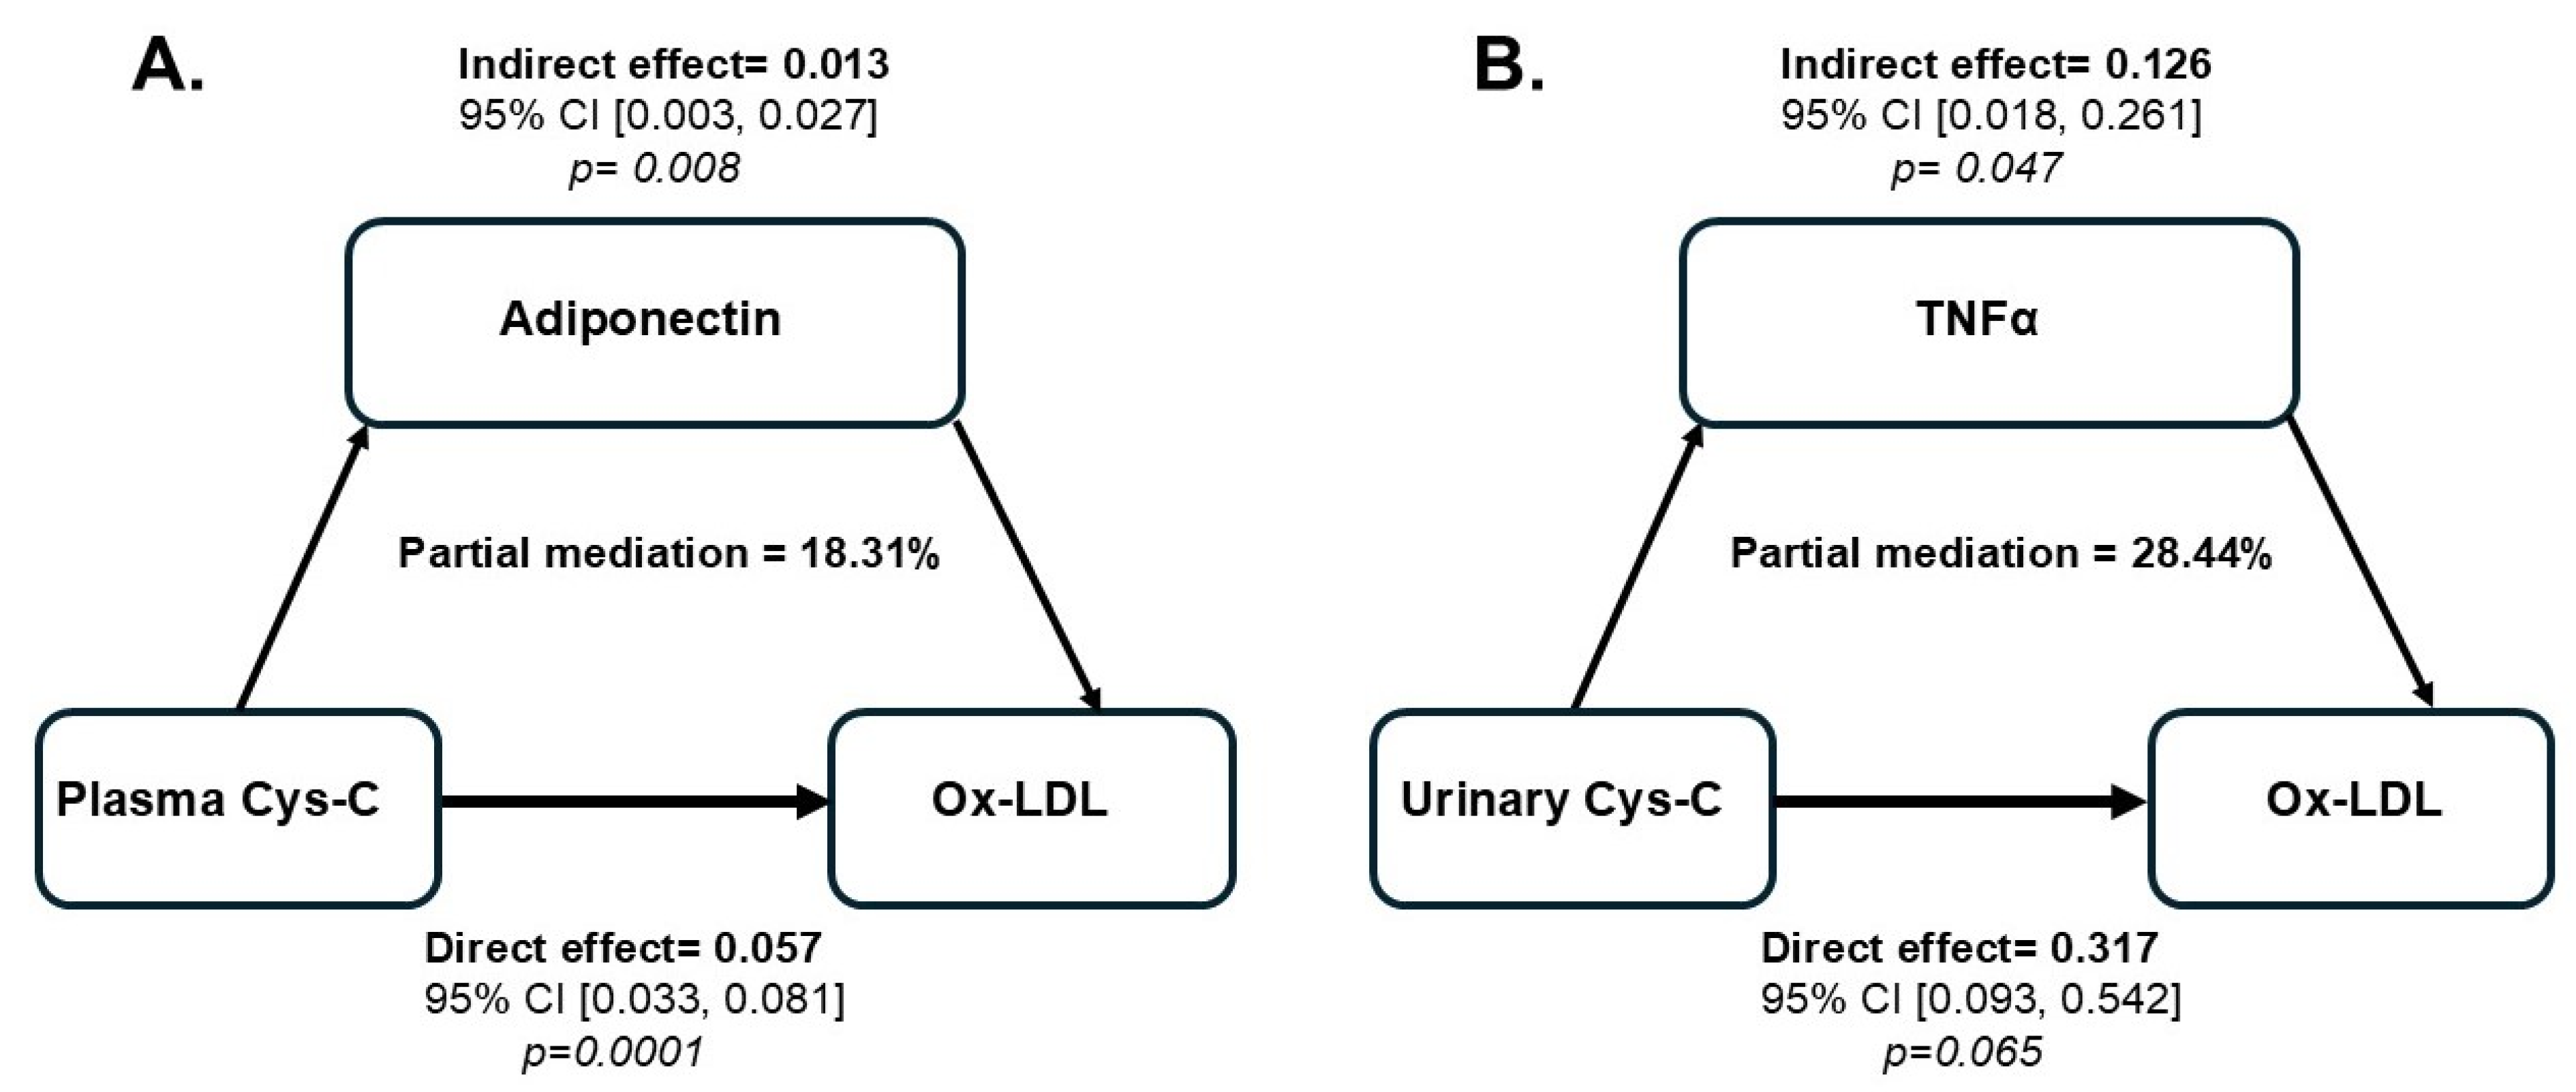
2.7. Regression Analysis of the Potential Mediating Effects of the Relationship Between Plasma and Urinary Cys-C and ox-LDL in T2DM Patients
3. Discussion
4. Materials and Methods
4.1. Study Population and Protocol
4.2. Measurement of Plasma Levels of Cys-C, Ox-LDL, Adipokines, and Cytokines in T2DM Patients
4.3. Statistical Analysis
5. Conclusions
Supplementary Materials
Author Contributions
Funding
Institutional Review Board Statement
Informed Consent Statement
Data Availability Statement
Acknowledgments
Conflicts of Interest
References
- Li, Y.; Liu, Y.; Liu, S.; Gao, M.; Wang, W.; Chen, K.; Huang, L.; Liu, Y. Diabetic vascular diseases: Molecular mechanisms and therapeutic strategies. Signal Transduct. Target. Ther. 2023, 8, 152. [Google Scholar] [CrossRef]
- Wu, T.; Ding, L.; Andoh, V.; Zhang, J.; Chen, L. The Mechanism of Hyperglycemia-Induced Renal Cell Injury in Diabetic Nephropathy Disease: An Update. Life 2023, 13, 539. [Google Scholar] [CrossRef]
- Thomas, M.C.; Brownlee, M.; Susztak, K.; Sharma, K.; Jandeleit-Dahm, K.A.; Zoungas, S.; Rossing, P.; Groop, P.H.; Cooper, M.E. Diabetic kidney disease. Nat. Rev. Dis. Primers 2015, 1, 15018. [Google Scholar] [CrossRef]
- Siracusa, C.; Carabetta, N.; Morano, M.B.; Manica, M.; Strangio, A.; Sabatino, J.; Leo, I.; Castagna, A.; Cianflone, E.; Torella, D.; et al. Understanding Vascular Calcification in Chronic Kidney Disease: Pathogenesis and Therapeutic Implications. Int. J. Mol. Sci. 2024, 25, 13096. [Google Scholar] [CrossRef] [PubMed]
- Jha, R.; Lopez-Trevino, S.; Kankanamalage, H.R.; Jha, J.C. Diabetes and Renal Complications: An Overview on Pathophysiology, Biomarkers and Therapeutic Interventions. Biomedicines 2024, 12, 1098. [Google Scholar] [CrossRef]
- Kon, V.; Linton, M.F.; Fazio, S. Atherosclerosis in chronic kidney disease: The role of macrophages. Nat. Rev. Nephrol. 2011, 7, 45–54. [Google Scholar] [CrossRef]
- Valdivielso, J.M.; Rodriguez-Puyol, D.; Pascual, J.; Barrios, C.; Bermudez-Lopez, M.; Sanchez-Nino, M.D.; Perez-Fernandez, M.; Ortiz, A. Atherosclerosis in Chronic Kidney Disease: More, Less, or Just Different? Arter. Thromb. Vasc. Biol. 2019, 39, 1938–1966. [Google Scholar] [CrossRef]
- Libby, P. The changing landscape of atherosclerosis. Nature 2021, 592, 524–533. [Google Scholar] [CrossRef]
- Caturano, A.; Rocco, M.; Tagliaferri, G.; Piacevole, A.; Nilo, D.; Di Lorenzo, G.; Iadicicco, I.; Donnarumma, M.; Galiero, R.; Acierno, C.; et al. Oxidative Stress and Cardiovascular Complications in Type 2 Diabetes: From Pathophysiology to Lifestyle Modifications. Antioxidants 2025, 14, 72. [Google Scholar] [CrossRef]
- Huang, H.; Mai, W.; Liu, D.; Hao, Y.; Tao, J.; Dong, Y. The oxidation ratio of LDL: A predictor for coronary artery disease. Dis. Markers 2008, 24, 341–349. [Google Scholar] [CrossRef]
- Huang, H.; Ma, R.; Liu, D.; Liu, C.; Ma, Y.; Mai, W.; Dong, Y. Oxidized low-density lipoprotein cholesterol and the ratio in the diagnosis and evaluation of therapeutic effect in patients with coronary artery disease. Dis. Markers 2012, 33, 295–302. [Google Scholar] [CrossRef] [PubMed]
- Marin, M.T.; Dasari, P.S.; Tryggestad, J.B.; Aston, C.E.; Teague, A.M.; Short, K.R. Oxidized HDL and LDL in adolescents with type 2 diabetes compared to normal weight and obese peers. J. Diabetes Complicat. 2015, 29, 679–685. [Google Scholar] [CrossRef] [PubMed]
- Raikou, V.; Kardalinos, V.; Kyriaki, D. Oxidized Low-Density Lipoprotein Serum Concentrations and Cardiovascular Morbidity in End Stage of Renal Disease. J. Cardiovasc. Dev. Dis. 2018, 5, 35. [Google Scholar] [CrossRef] [PubMed]
- Hassan, M.; Hatata, E.Z.; Al-Arman, M.; Aboelnaga, M.M. Urinary cystatin C as a biomarker of early renal dysfunction in type 2 diabetic patients. Diabetes Metab. Syndr. 2021, 15, 102152. [Google Scholar] [CrossRef]
- Visinescu, A.M.; Rusu, E.; Cosoreanu, A.; Radulian, G. CYSTATIN C-A Monitoring Perspective of Chronic Kidney Disease in Patients with Diabetes. Int. J. Mol. Sci. 2024, 25, 8135. [Google Scholar] [CrossRef]
- Mende, C.W.; Bloomgarden, Z. Measurement of renal function: Should cystatin C be more widely used for people with diabetes? J. Diabetes 2024, 16, e13534. [Google Scholar] [CrossRef]
- Knight, E.L.; Verhave, J.C.; Spiegelman, D.; Hillege, H.L.; de Zeeuw, D.; Curhan, G.C.; de Jong, P.E. Factors influencing serum cystatin C levels other than renal function and the impact on renal function measurement. Kidney Int. 2004, 65, 1416–1421. [Google Scholar] [CrossRef]
- Yim, J.; Son, N.H.; Kim, K.M.; Yoon, D.; Cho, Y.; Kyong, T.; Moon, J.Y.; Yi, T.I.; Lee, S.G.; Park, Y.; et al. Establishment of muscle mass-based indications for the cystatin C test in renal function evaluation. Front. Med. 2022, 9, 1021936. [Google Scholar] [CrossRef]
- Chen, J.; Shen, J.; Pan, Y.; Jing, J.; Wang, Y.; Wei, T.; Lyu, L. Association of serum cystatin C level with coronary atherosclerotic plaque burden: A comprehensive analysis of observational studies and genetic study. BMC Cardiovasc. Disord. 2023, 23, 499. [Google Scholar] [CrossRef]
- Herget-Rosenthal, S.; van Wijk, J.A.; Brocker-Preuss, M.; Bokenkamp, A. Increased urinary cystatin C reflects structural and functional renal tubular impairment independent of glomerular filtration rate. Clin. Biochem. 2007, 40, 946–951. [Google Scholar] [CrossRef]
- Piko, N.; Bevc, S.; Hojs, R.; Ekart, R. The Role of Oxidative Stress in Kidney Injury. Antioxidants 2023, 12, 1772. [Google Scholar] [CrossRef]
- Clemente-Suarez, V.J.; Redondo-Florez, L.; Beltran-Velasco, A.I.; Martin-Rodriguez, A.; Martinez-Guardado, I.; Navarro-Jimenez, E.; Laborde-Cardenas, C.C.; Tornero-Aguilera, J.F. The Role of Adipokines in Health and Disease. Biomedicines 2023, 11, 1290. [Google Scholar] [CrossRef]
- Savulescu-Fiedler, I.; Mihalcea, R.; Dragosloveanu, S.; Scheau, C.; Baz, R.O.; Caruntu, A.; Scheau, A.E.; Caruntu, C.; Benea, S.N. The Interplay between Obesity and Inflammation. Life 2024, 14, 856. [Google Scholar] [CrossRef] [PubMed]
- Balistreri, C.R.; Caruso, C.; Candore, G. The role of adipose tissue and adipokines in obesity-related inflammatory diseases. Mediat. Inflamm. 2010, 2010, 802078. [Google Scholar] [CrossRef]
- Suren Garg, S.; Kushwaha, K.; Dubey, R.; Gupta, J. Association between obesity, inflammation and insulin resistance: Insights into signaling pathways and therapeutic interventions. Diabetes Res. Clin. Pract. 2023, 200, 110691. [Google Scholar] [CrossRef]
- Lima, J.R.; Salgado, J.V.; Ferreira, T.C.; Oliveira, M.I.; Santos, A.M.; Salgado Filho, N. Cystatin C and inflammatory markers in kidney transplant recipients. Rev. Assoc. Med. Bras. 2011, 57, 347–352. [Google Scholar] [CrossRef]
- Luo, Y.; Wang, Q.; Li, H.; Lin, W.; Yao, J.; Zhang, J.; Duan, S.; Zhang, W.; Zheng, Y.; Cai, G.; et al. Serum cystatin C is associated with peripheral artery stiffness in patients with type 2 diabetes mellitus combined with chronic kidney disease. Clin. Biochem. 2023, 118, 110593. [Google Scholar] [CrossRef]
- West, M.; Kirby, A.; Stewart, R.A.; Blankenberg, S.; Sullivan, D.; White, H.D.; Hunt, D.; Marschner, I.; Janus, E.; Kritharides, L.; et al. Circulating Cystatin C Is an Independent Risk Marker for Cardiovascular Outcomes, Development of Renal Impairment, and Long-Term Mortality in Patients With Stable Coronary Heart Disease: The LIPID Study. J. Am. Heart Assoc. 2022, 11, e020745. [Google Scholar] [CrossRef]
- Carvalho, L.S.F.; Silva, T.Q.A.; Coelho-Filho, O.R. Cystatin C as a Candidate Biomarker of Cardiovascular Outcomes: Too Near, but too Far from Reality. Arq. Bras. Cardiol. 2018, 111, 808–809. [Google Scholar] [CrossRef]
- van der Laan, S.W.; Fall, T.; Soumare, A.; Teumer, A.; Sedaghat, S.; Baumert, J.; Zabaneh, D.; van Setten, J.; Isgum, I.; Galesloot, T.E.; et al. Cystatin C and Cardiovascular Disease: A Mendelian Randomization Study. J. Am. Coll. Cardiol. 2016, 68, 934–945. [Google Scholar] [CrossRef]
- Lertnawapan, R.; Bian, A.; Rho, Y.H.; Raggi, P.; Oeser, A.; Solus, J.F.; Gebretsadik, T.; Shintani, A.; Stein, C.M. Cystatin C is associated with inflammation but not atherosclerosis in systemic lupus erythematosus. Lupus 2012, 21, 279–287. [Google Scholar] [CrossRef] [PubMed]
- Ruze, R.; Liu, T.; Zou, X.; Song, J.; Chen, Y.; Xu, R.; Yin, X.; Xu, Q. Obesity and type 2 diabetes mellitus: Connections in epidemiology, pathogenesis, and treatments. Front. Endocrinol. 2023, 14, 1161521. [Google Scholar] [CrossRef] [PubMed]
- Cho, M.; Park, J.S.; Nam, J.; Kim, C.S.; Nam, J.H.; Kim, H.J.; Ahn, C.W.; Cha, B.S.; Lim, S.K.; Kim, K.R.; et al. Association of abdominal obesity with atherosclerosis in type 2 diabetes mellitus (T2DM) in Korea. J. Korean Med. Sci. 2008, 23, 781–788. [Google Scholar] [CrossRef] [PubMed]
- Taha, M.M.; Mahdy-Abdallah, H.; Shahy, E.M.; Helmy, M.A.; ElLaithy, L.S. Diagnostic efficacy of cystatin-c in association with different ACE genes predicting renal insufficiency in T2DM. Sci. Rep. 2023, 13, 5288. [Google Scholar] [CrossRef]
- Gounden, V.; Bhatt, H.; Jialal, I. Renal Function Tests. In StatPearls; StatPearls Publishing: Treasure Island, FL, USA, 2025. [Google Scholar]
- Bakillah, A.; Zaiou, M. The “forgotten” modified lipoprotein subspecies. Front. Biosci. Landmark Ed. 2018, 23, 458–463. [Google Scholar] [CrossRef]
- Jiang, H.; Zhou, Y.; Nabavi, S.M.; Sahebkar, A.; Little, P.J.; Xu, S.; Weng, J.; Ge, J. Mechanisms of Oxidized LDL-Mediated Endothelial Dysfunction and Its Consequences for the Development of Atherosclerosis. Front. Cardiovasc. Med. 2022, 9, 925923. [Google Scholar] [CrossRef]
- Hartley, A.; Haskard, D.; Khamis, R. Oxidized LDL and anti-oxidized LDL antibodies in atherosclerosis—Novel insights and future directions in diagnosis and therapy. Trends Cardiovasc. Med. 2019, 29, 22–26. [Google Scholar] [CrossRef]
- Njajou, O.T.; Kanaya, A.M.; Holvoet, P.; Connelly, S.; Strotmeyer, E.S.; Harris, T.B.; Cummings, S.R.; Hsueh, W.C.; Health, A.B.C.S. Association between oxidized LDL, obesity and type 2 diabetes in a population-based cohort, the Health, Aging and Body Composition Study. Diabetes Metab. Res. Rev. 2009, 25, 733–739. [Google Scholar] [CrossRef]
- Jhatta, C.; Girdhar, J.; Gupta, S.; Verma, I. To Compare the Level of Cystatin C in Type 2 Diabetes Mellitus with Obesity. Indian. J. Endocrinol. Metab. 2020, 24, 312–318. [Google Scholar] [CrossRef]
- Ma, C.C.; Duan, C.C.; Huang, R.C.; Tang, H.Q. Association of circulating cystatin C levels with type 2 diabetes mellitus: A systematic review and meta-analysis. Arch. Med. Sci. 2020, 16, 648–656. [Google Scholar] [CrossRef]
- Kelly, A.S.; Jacobs, D.R., Jr.; Sinaiko, A.R.; Moran, A.; Steffen, L.M.; Steinberger, J. Relation of circulating oxidized LDL to obesity and insulin resistance in children. Pediatr. Diabetes 2010, 11, 552–555. [Google Scholar] [CrossRef] [PubMed]
- Hamed, S.; Brenner, B.; Abassi, Z.; Aharon, A.; Daoud, D.; Roguin, A. Hyperglycemia and oxidized-LDL exert a deleterious effect on endothelial progenitor cell migration in type 2 diabetes mellitus. Thromb. Res. 2010, 126, 166–174. [Google Scholar] [CrossRef] [PubMed]
- Nilsson, C.; Dereke, J. Cystatin C as an adjunct to HbA1c may prove useful in predicting the development of diabetic complications in children and adolescents with type 1 diabetes. J. Diabetes Metab. Disord. 2024, 23, 1251–1257. [Google Scholar] [CrossRef]
- Qian, T.; Tian, L.; Li, Y.; Zhang, Z.; Tian, X.; Sun, D. Value of the combined examination of Cys-C and HbA1c for diagnosis of early renal injury in pediatric diabetes. Exp. Ther. Med. 2017, 13, 515–518. [Google Scholar] [CrossRef] [PubMed]
- Rabizadeh, S.; Seyedi, S.A.; Nabipoorashrafi, S.A.; Omidvar Siahkalmahalleh, M.; Yadegar, A.; Mohammadi, F.; Rajab, A.; Esteghamati, A.; Nakhjavani, M. The lack of association between different LDL-C levels and oxidized LDL in patients with type 2 diabetes. Chronic Dis. Transl. Med. 2023, 9, 329–335. [Google Scholar] [CrossRef]
- de Carvalho, M.H.; Colaco, A.L.; Fortes, Z.B. Cytokines, endothelial dysfunction, and insulin resistance. Arq. Bras. Endocrinol. Metab. 2006, 50, 304–312. [Google Scholar] [CrossRef]
- Achari, A.E.; Jain, S.K. Adiponectin, a Therapeutic Target for Obesity, Diabetes, and Endothelial Dysfunction. Int. J. Mol. Sci. 2017, 18, 1321. [Google Scholar] [CrossRef]
- Levitan, I.; Volkov, S.; Subbaiah, P.V. Oxidized LDL: Diversity, patterns of recognition, and pathophysiology. Antioxid. Redox Signal. 2010, 13, 39–75. [Google Scholar] [CrossRef]
- Trpkovic, A.; Resanovic, I.; Stanimirovic, J.; Radak, D.; Mousa, S.A.; Cenic-Milosevic, D.; Jevremovic, D.; Isenovic, E.R. Oxidized low-density lipoprotein as a biomarker of cardiovascular diseases. Crit. Rev. Clin. Lab. Sci. 2015, 52, 70–85. [Google Scholar] [CrossRef]
- Spessatto, D.; Brum, L.; Camargo, J.L. Oxidized LDL but not total LDL is associated with HbA1c in individuals without diabetes. Clin. Chim. Acta 2017, 471, 171–176. [Google Scholar] [CrossRef]
- Singh, P.; Goncalves, I.; Tengryd, C.; Nitulescu, M.; Persson, A.F.; To, F.; Bengtsson, E.; Volkov, P.; Orho-Melander, M.; Nilsson, J.; et al. Reduced oxidized LDL in T2D plaques is associated with a greater statin usage but not with future cardiovascular events. Cardiovasc. Diabetol. 2020, 19, 214. [Google Scholar] [CrossRef]
- Poznyak, A.V.; Nikiforov, N.G.; Markin, A.M.; Kashirskikh, D.A.; Myasoedova, V.A.; Gerasimova, E.V.; Orekhov, A.N. Overview of OxLDL and Its Impact on Cardiovascular Health: Focus on Atherosclerosis. Front. Pharmacol. 2020, 11, 613780. [Google Scholar] [CrossRef] [PubMed]
- Tsuboi, A.; Takeuchi, M.; Terazawa-Watanabe, M.; Fukuo, K.; Kazumi, T. Association of cystatin C with leptin and TNF-α in elderly Japanese women. Asia Pac. J. Clin. Nutr. 2015, 24, 626–632. [Google Scholar] [CrossRef] [PubMed]
- Dedual, M.A.; Wueest, S.; Challa, T.D.; Lucchini, F.C.; Aeppli, T.R.J.; Borsigova, M.; Mauracher, A.A.; Vavassori, S.; Pachlopnik Schmid, J.; Bluher, M.; et al. Obesity-Induced Increase in Cystatin C Alleviates Tissue Inflammation. Diabetes 2020, 69, 1927–1935. [Google Scholar] [CrossRef]
- Hosokawa, Y.; Yamada, Y.; Obata, Y.; Baden, M.Y.; Saisho, K.; Ihara, A.; Yamamoto, K.; Katsuragi, K.; Matsuzawa, Y. Relationship between serum cystatin C and serum adiponectin level in type 2 diabetic patients. Clin. Exp. Nephrol. 2012, 16, 399–405. [Google Scholar] [CrossRef]
- Wolff, C.; Durruty, P.; Espinoza, J.; Ripamonti, S.; Diaz, J. Cystatin C and adiponectin in diabetics with and without coronary artery disease. Rev. Medica Chile 2009, 137, 729–736. [Google Scholar]
- Bogdan, S.; Puscion-Jakubik, A.; Klimiuk, K.; Socha, K.; Kochanowicz, J.; Gorodkiewicz, E. The Levels of Leptin, Cystatin C, Neuropilin-1 and Tau Protein in Relation to Dietary Habits in Patients with Alzheimer’s Disease. J. Clin. Med. 2023, 12, 6855. [Google Scholar] [CrossRef]
- Kakino, A.; Fujita, Y.; Ke, L.Y.; Chan, H.C.; Tsai, M.H.; Dai, C.Y.; Chen, C.H.; Sawamura, T. Adiponectin forms a complex with atherogenic LDL and inhibits its downstream effects. J. Lipid Res. 2021, 62, 100001. [Google Scholar] [CrossRef]
- Choi, S.W.; Ho, C.K. Metformin restores the correlation between serum-oxidized LDL and leptin levels in type 2 diabetic patients. Redox Rep. 2018, 23, 1–24. [Google Scholar]
- Hashizume, M.; Mihara, M. Atherogenic effects of TNF-α and IL-6 via up-regulation of scavenger receptors. Cytokine 2012, 58, 424–430. [Google Scholar] [CrossRef]
- Liu, C.; Li, Q.; Feng, X.; Zhu, J.; Li, Q. Deterioration of diabetic nephropathy via stimulating secretion of cytokines by atrial natriuretic peptide. BMC Endocr. Disord. 2021, 21, 204. [Google Scholar] [CrossRef]
- Li, C.; Wang, Y.; Zhu, G.; Shang, Y.; Kang, J.; Li, J. IL-6 induced enhanced clearance of proANP and ANP by insulin-degrading enzyme in T1DM mice. Biochem. Cell Biol. 2022, 100, 37–44. [Google Scholar] [CrossRef] [PubMed]
- Scheja, L.; Heeren, J. The endocrine function of adipose tissues in health and cardiometabolic disease. Nat. Rev. Endocrinol. 2019, 15, 507–524. [Google Scholar] [CrossRef] [PubMed]
- Arnadottir, M.; Thysell, H.; Dallongeville, J.; Fruchart, J.C.; Nilsson-Ehle, P. Evidence that reduced lipoprotein lipase activity is not a primary pathogenetic factor for hypertriglyceridemia in renal failure. Kidney Int. 1995, 48, 779–784. [Google Scholar] [CrossRef]
- Kwon, H.; Pessin, J.E. Adipokines mediate inflammation and insulin resistance. Front. Endocrinol. 2013, 4, 71. [Google Scholar] [CrossRef]
- Sethi, J.K.; Hotamisligil, G.S. Metabolic Messengers: Tumour necrosis factor. Nat. Metab. 2021, 3, 1302–1312. [Google Scholar] [CrossRef]
- Coimbra, S.; Rocha, S.; Valente, M.J.; Catarino, C.; Bronze-da-Rocha, E.; Belo, L.; Santos-Silva, A. New Insights into Adiponectin and Leptin Roles in Chronic Kidney Disease. Biomedicines 2022, 10, 2642. [Google Scholar] [CrossRef]
- Yanai, H.; Yoshida, H. Beneficial Effects of Adiponectin on Glucose and Lipid Metabolism and Atherosclerotic Progression: Mechanisms and Perspectives. Int. J. Mol. Sci. 2019, 20, 1190. [Google Scholar] [CrossRef]
- Kadatane, S.P.; Satariano, M.; Massey, M.; Mongan, K.; Raina, R. The Role of Inflammation in CKD. Cells 2023, 12, 1581. [Google Scholar] [CrossRef]
- Choi, H.M.; Doss, H.M.; Kim, K.S. Multifaceted Physiological Roles of Adiponectin in Inflammation and Diseases. Int. J. Mol. Sci. 2020, 21, 1219. [Google Scholar] [CrossRef]
- Lautamaki, R.; Ronnemaa, T.; Huupponen, R.; Lehtimaki, T.; Iozzo, P.; Airaksinen, K.E.; Knuuti, J.; Nuutila, P. Low serum adiponectin is associated with high circulating oxidized low-density lipoprotein in patients with type 2 diabetes mellitus and coronary artery disease. Metabolism 2007, 56, 881–886. [Google Scholar] [CrossRef] [PubMed]
- Gui, Y.; Zheng, H.; Cao, R.Y. Foam Cells in Atherosclerosis: Novel Insights Into Its Origins, Consequences, and Molecular Mechanisms. Front. Cardiovasc. Med. 2022, 9, 845942. [Google Scholar] [CrossRef] [PubMed]
- Luo, B.; Xu, Y.; Bai, J.; Yao, X.; Kong, Y.; Wang, P.; Du, J. Higher serum cystatin C and matrix metalloproteinase 9 levels effectively predict in-stent restenosis after stent implantation for intracranial and extracranial arterial stenosis. Pathol. Res. Pract. 2024, 266, 155751. [Google Scholar] [CrossRef] [PubMed]
- Munno, M.; Mallia, A.; Greco, A.; Modafferi, G.; Banfi, C.; Eligini, S. Radical Oxygen Species, Oxidized Low-Density Lipoproteins, and Lectin-like Oxidized Low-Density Lipoprotein Receptor 1: A Vicious Circle in Atherosclerotic Process. Antioxidants 2024, 13, 583. [Google Scholar] [CrossRef]
- Podkowinska, A.; Formanowicz, D. Chronic Kidney Disease as Oxidative Stress- and Inflammatory-Mediated Cardiovascular Disease. Antioxidants 2020, 9, 752. [Google Scholar] [CrossRef]


| Baseline Characteristics | T2DM Cohort (N = 57) |
|---|---|
| Age (years) * | 60.96 ± 9.99 |
| BMI (kg/m2) * | 35.15 ± 6.65 |
| Normal Weight: BMI 18.5–24.9; N (%) | 3 (5.26) |
| Overweight: BMI 25–29.9; N (%) | 8 (14.03) |
| Obesity Class I (Moderate): BMI 30–34.9; N (%) | 21 (36.84) |
| Obesity Class II (Severe): BMI 35–39.9; N (%) | 13 (22.81) |
| Obesity Class III (Very Severe or Morbidity Obese): BMI ≥ 40; N (%) | 12 (21.05) |
| Systolic BP (mmHg) | 145.00 (123.50, 153.50) |
| Diastolic BP (mmHg) | 71.00 (61.50, 81.00) |
| HbA1c (%) * | 8.66 ± 1.60 |
| Fasting Glucose (mg/dL) | 8.00 (6.67, 14.27) |
| Hs-CRP (mg/L) | 7.60 (3.40, 25.97) |
| Creatinine (µmol/L) | 111.50 (81.00, 142.25) |
| eGFR (mL/min/1.73 m2) * | 58.04 ± 26.50 |
| Total Cholesterol (mg/dL) | 154.68 (116.01, 193.35) |
| LDL-c (mg/dL) | 77.34 (77.34, 116.01) |
| HDL-c (mg/dL) | 38.67 (38.67, 38.67) |
| Triglycerides (mg/dL) | 177.14 (88.57, 177.14) |
| ApoB (mg/mL) | 86.00 (78.00, 103.50) |
| Pl-Cys-C (ng/mL) * | 1357.58 ± 598.90 |
| Ur-Cys-C (ng/mL) | 104.96 (111.33, 143.33) |
| Ox-LDL (ng/mL) * | 247.97 ± 67.50 |
| Ox-LDL/LDLc (mg/dL) | 251.75 (174.90, 317.95) |
| Ox-LDL/LDLc (%) | 0.025 (0.017, 0.034) |
| NO (µmol/L) * | 130.27 ± 3.01 |
| Adiponectin (pg/mL) * | 141.87 ± 63.22 |
| NGF (pg/mL) | 8.80 (6.99, 11.60) |
| IL8 (pg/mL) | 13.98 (9.75, 18.45) |
| MCP1 (pg/mL) * | 233.46 ± 93.92 |
| IL1b (pg/mL) | 0.93 (0.60, 1.60) |
| GLP1 (pg/mL) | 562.06 (418.74, 857.79) |
| IL6 (pg/mL) | 24.72 (16.25, 32.93) |
| Insulin (pg/mL) | 1615.57 (1180.50, 2386.68) |
| Leptin (pg/mL) * | 8593.25 ± 3556.26 |
| TNFα (pg/mL) | 38.80 (32.01, 52.55) |
| Family Disease History | |
| Diabetes (%) | 81.80 |
| Hypertension (%) | 25.50 |
| CAD (%) | 38.20 |
| Cholesterol (%) | 57.70 |
| Stroke (%) | 14.30 |
| Medication | |
| Insulin (%) | 47.37 |
| HMG-CoA reductase inhibitors (%) | 19.30 |
| Metformin (%) | 14.03 |
| DPP4 inhibitors (%) | 14.03 |
| Sulfonylurea (%) | 10.53 |
| Calcium channel blockers (%) | 8.77 |
| ACE inhibitors (%) | 7.02 |
| NSAID (%)HMG-CoA reductase inhibitors (%) | 7.02 |
| Diuretics (%) | 3.51 |
| PPI (%) | 3.51 |
| Variables | PlCys-C | UrCys-C | Age | Gender | HbA1c | Cre | Chol-t | LDL-c | HDL-c | TAG | Hs-CRP | BMI | Ox-LDL | NO | eGFR |
|---|---|---|---|---|---|---|---|---|---|---|---|---|---|---|---|
| PlCys-C | 1 | 0.279 | 0.065 | −0.185 | −0.062 | 0.215 | −0.089 | −0.121 | −0.033 | 0.124 | −0.046 | −0.172 | 0.569 | 0.042 | −0.242 |
| UrCys-C | 0.279 | 1 | −0.007 | 0.055 | −0.058 | −0.071 | 0.139 | 0.05 | −0.182 | 0.031 | −0.03 | 0.043 | 0.485 | −0.181 | −0.077 |
| Age | 0.065 | −0.007 | 1 | −0.076 | 0.044 | 0.186 | −0.191 | −0.241 | 0.042 | −0.047 | 0.013 | −0.063 | 0.082 | −0.171 | −0.384 |
| Gender | −0.185 | 0.055 | −0.076 | 1 | −0.023 | −0.429 | 0.116 | 0.36 | −0.06 | −0.292 | 0.053 | 0.167 | 0.064 | −0.185 | 0.228 |
| HbA1c | −0.062 | −0.058 | 0.044 | −0.023 | 1 | −0.003 | 0.062 | 0.1 | 0.178 | 0.063 | 0.147 | 0.204 | −0.098 | 0.079 | 0.028 |
| Cre | 0.215 | −0.071 | 0.186 | −0.429 | −0.003 | 1 | −0.089 | −0.113 | −0.134 | 0.091 | 0.083 | −0.166 | 0.099 | 0.247 | −0.864 |
| Chol-t | −0.089 | 0.139 | −0.191 | 0.116 | 0.062 | −0.089 | 1 | 0.661 | −0.253 | 0.297 | 0.056 | 0.091 | −0.048 | 0.04 | 0.165 |
| LDL-c | −0.121 | 0.05 | −0.241 | 0.36 | 0.1 | −0.113 | 0.661 | 1 | −0.107 | 0.083 | 0.081 | 0.061 | −0.032 | 0.002 | 0.173 |
| HDL-c | −0.033 | −0.182 | 0.042 | −0.06 | 0.178 | −0.134 | −0.253 | −0.107 | 1 | 0.064 | 0.219 | −0.236 | −0.079 | −0.144 | 0.165 |
| TAG | 0.124 | 0.031 | −0.047 | −0.292 | 0.063 | 0.091 | 0.297 | 0.083 | 0.064 | 1 | 0.165 | 0.109 | −0.206 | −0.085 | 0.011 |
| Hs-CRP | −0.046 | −0.03 | 0.013 | 0.053 | 0.147 | 0.083 | 0.056 | 0.081 | 0.219 | 0.165 | 1 | 0.26 | −0.149 | −0.123 | −0.141 |
| BMI | −0.172 | 0.043 | −0.063 | 0.167 | 0.204 | −0.166 | 0.091 | 0.061 | −0.236 | 0.109 | 0.26 | 1 | −0.119 | 0.002 | 0.107 |
| Ox-LDL | 0.569 | 0.485 | 0.082 | 0.064 | −0.098 | 0.099 | −0.048 | −0.032 | −0.079 | −0.206 | −0.149 | −0.119 | 1 | 0.152 | −0.241 |
| NO | 0.042 | −0.181 | −0.171 | −0.185 | 0.079 | 0.247 | 0.04 | 0.002 | −0.144 | −0.085 | −0.123 | 0.002 | 0.152 | 1 | −0.123 |
| eGFR | −0.242 | −0.077 | −0.384 | 0.228 | 0.028 | −0.864 | 0.165 | 0.173 | 0.165 | 0.011 | −0.141 | 0.107 | −0.241 | −0.123 | 1 |
| Heatmap scale | 1.000 | 0.750 | 0.500 | 0.250 | 0.000 | −0.250 | −0.500 | −0.750 | −1.000 |
| Variables | PlCys-C | UrCys-C | Ox-LDL | ADP | NGF | IL−8 | MCP1 | IL-1b | GLP1 | IL-6 | INS | LEP | TNFα |
|---|---|---|---|---|---|---|---|---|---|---|---|---|---|
| PlCys-C | 1 | 0.279 | 0.569 | −0.346 | 0.3 | 0.024 | 0.104 | 0.051 | 0.194 | 0.397 | 0.04 | 0.342 | 0.663 |
| UrCys-C | 0.279 | 1 | 0.485 | −0.182 | 0.031 | −0.084 | −0.04 | −0.203 | 0.214 | 0.164 | 0.177 | 0.223 | 0.333 |
| Ox-LDL | 0.569 | 0.485 | 1 | −0.465 | 0.175 | 0.07 | 0.066 | −0.136 | 0.225 | 0.34 | −0.148 | 0.353 | 0.53 |
| ADP | −0.346 | −0.182 | −0.465 | 1 | −0.021 | 0.128 | 0.152 | −0.109 | −0.143 | −0.068 | 0.047 | −0.179 | −0.276 |
| NGF | 0.3 | 0.031 | 0.175 | −0.021 | 1 | 0.38 | 0.027 | 0.355 | 0.115 | 0.348 | 0.109 | 0.283 | 0.375 |
| IL-8 | 0.024 | −0.084 | 0.07 | 0.128 | 0.38 | 1 | 0.149 | 0.427 | −0.061 | 0.265 | −0.072 | −0.181 | 0.364 |
| MCP1 | 0.104 | −0.04 | 0.066 | 0.152 | 0.027 | 0.149 | 1 | −0.098 | 0.095 | 0.183 | −0.038 | 0.102 | 0.171 |
| IL-1b | 0.051 | −0.203 | −0.136 | −0.109 | 0.355 | 0.427 | −0.098 | 1 | −0.207 | 0.089 | −0.034 | −0.185 | 0.153 |
| GLP1 | 0.194 | 0.214 | 0.225 | −0.143 | 0.115 | −0.061 | 0.095 | −0.207 | 1 | 0.008 | 0.316 | 0.053 | 0.114 |
| IL-6 | 0.397 | 0.164 | 0.34 | −0.068 | 0.348 | 0.265 | 0.183 | 0.089 | 0.008 | 1 | 0.03 | 0.353 | 0.529 |
| INS | 0.04 | 0.177 | −0.148 | 0.047 | 0.109 | −0.072 | −0.038 | −0.034 | 0.316 | 0.03 | 1 | 0.204 | 0.005 |
| LEP | 0.342 | 0.223 | 0.353 | −0.179 | 0.283 | −0.181 | 0.102 | −0.185 | 0.053 | 0.353 | 0.204 | 1 | 0.237 |
| TNFα | 0.663 | 0.333 | 0.53 | −0.276 | 0.375 | 0.364 | 0.171 | 0.153 | 0.114 | 0.529 | 0.005 | 0.237 | 1 |
| Heatmap scale | 1.000 | 0.750 | 0.500 | 0.250 | 0.000 | −0.250 | −0.500 | −0.750 | −1.000 |
| Model 1 (R2 = 0.393) DV: Ox-LDL | Unstandardized Coefficients | Standardized Coefficients | t | P | 95% CI for B | ||
| B | SE | B | Lower Bound | Upper Bound | |||
| (Constant) | 152.000 | 17.539 | 8.666 | 0.0001 | 116.851 | 187.150 | |
| PlCys-C | 0.071 | 0.012 | 0.627 | 5.972 | 0.0001 | 0.047 | 0.094 |
| Model 2 (R2 = 0.205) DV: Ox-LDL | Unstandardized Coefficients | Standardized Coefficients | t | P | 95% CI for B | ||
| B | SE | B | Lower Bound | Upper Bound | |||
| (Constant) | 201.300 | 14.759 | 13.640 | 0.0001 | 171.723 | 230.877 | |
| UrCys-C | 0.443 | 0.118 | 0.453 | 3.771 | 0.0001 | 0.208 | 0.679 |
| Model 3 (R2 = 0.680) DV: Ox-LDL | Unstandardized Coefficients | Standardized Coefficients | t | P | 95% CI for B | ||
| B | SE | B | Lower Bound | Upper Bound | |||
| (Constant) | 137.146 | 17.576 | 7.803 | 0.0001 | 101.909 | 172.383 | |
| PlCys-C | 0.060 | 0.012 | 0.537 | 5.088 | 0.0001 | 0.037 | 0.084 |
| UrCys-C | 0.273 | 0.103 | 0.279 | 2.645 | 0.011 | 0.066 | 0.479 |
| Model 1 (R2 = 0.383) DV: Ox-LDL | Unstandardized Coefficients | P | 95% CI for B | |||
| B | SE | Lower Bound | Upper Bound | |||
| M1 | (Constant) | 127.439 | 65.707 | 0.058 | −4.538 | 259.416 |
| PlCys-C | 0.067 | 0.013 | 0.0001 | 0.042 | 0.092 | |
| Age | 0.577 | 0.724 | 0.429 | −0.877 | 2.030 | |
| Gender | 11.137 | 14.578 | 0.448 | −18.144 | 40.419 | |
| HbA1c | −2.538 | 4.563 | 0.580 | −11.704 | 6.627 | |
| Model 2 (R2 = 0.607) DV: Ox-LDL | Unstandardized Coefficients | P | 95% CI for B | |||
| M2 | (Constant) | B | SE | Lower Bound | Upper Bound | |
| 60.009 | 127.676 | 0.643 | −204.108 | 324.127 | ||
| PlCys-C | 0.067 | 0.018 | 0.0001 | 0.030 | 0.103 | |
| Age | 1.782 | 1.062 | 0.107 | −0.415 | 3.979 | |
| Gender | 21.245 | 21.271 | 0.328 | −22.758 | 65.249 | |
| HbA1c | 5.621 | 6.580 | 0.402 | −7.990 | 19.232 | |
| Creatinine | −0.001 | 0.101 | 0.989 | −0.211 | 0.208 | |
| Cholesterol-t | 15.941 | 14.139 | 0.271 | −13.309 | 45.190 | |
| LDL-c | −8.344 | 16.309 | 0.614 | −42.082 | 25.394 | |
| HDL-c | −5.630 | 26.820 | 0.836 | −61.111 | 49.851 | |
| Triglycerides | −19.989 | 11.079 | 0.084 | −42.907 | 2.930 | |
| Hs-CRP | −0.367 | 0.283 | 0.207 | −0.952 | 0.218 | |
| BMI | −2.707 | 1.590 | 0.102 | −5.996 | 0.583 | |
| NO | −0.009 | 0.417 | 0.983 | −0.871 | 0.853 | |
| Model 3 (R2 = 0.811) DV: Ox-LDL | Unstandardized Coefficients | P | 95% CI for B | |||
| M3 | (Constant) | B | SE | Lower Bound | Upper Bound | |
| 104.326 | 120.518 | 0.398 | −148.873 | 357.525 | ||
| PlCys-C | 0.057 | 0.014 | 0.0001 | 0.027 | 0.086 | |
| Age | 1.238 | 0.962 | 0.215 | −0.784 | 3.260 | |
| Gender | 53.418 | 21.976 | 0.026 | 7.248 | 99.589 | |
| HbA1c | 7.770 | 5.343 | 0.163 | −3.456 | 18.996 | |
| Creatinine | 0.039 | 0.091 | 0.671 | −0.152 | 0.231 | |
| Cholesterol-t | 55.064 | 16.787 | 0.004 | 19.795 | 90.333 | |
| LDL-c | −49.867 | 18.394 | 0.014 | −88.512 | −11.222 | |
| HDL-c | 26.252 | 23.360 | 0.276 | −22.826 | 75.330 | |
| Triglycerides | −32.158 | 11.143 | 0.010 | −55.568 | −8.748 | |
| Hs-CRP | −0.580 | 0.235 | 0.024 | −1.074 | − 0.087 | |
| BMI | −3.170 | 1.315 | 0.027 | −5.933 | − 0.407 | |
| NO | −0.337 | 0.339 | 0.333 | −1.049 | 0.374 | |
| CAD | −23.602 | 13.669 | 0.101 | −52.319 | 5.116 | |
| Stroke | −0.124 | 0.102 | 0.239 | −0.338 | 0.090 | |
| Dyslipidemia | 0.057 | 0.014 | 0.699 | −60.451 | 41.412 | |
| Model 4 (R2 = 0.903) DV: Ox-LDL | Unstandardized Coefficients | P | 95% CI for B | |||
| M4 | (Constant) | B | SE | Lower Bound | Upper Bound | |
| 50.543 | 155.125 | 0.753 | −307.175 | 408.261 | ||
| PlCys-C | 0.036 | 0.025 | 0.191 | −0.022 | 0.094 | |
| Age | 1.275 | 1.344 | 0.371 | −1.825 | 4.375 | |
| Gender | 68.092 | 31.747 | 0.064 | −5.116 | 141.300 | |
| HbA1c | 12.080 | 7.287 | 0.136 | −4.724 | 28.884 | |
| Creatinine | 0.052 | 0.126 | 0.692 | −0.238 | 0.342 | |
| Cholesterol-t | 32.151 | 25.284 | 0.239 | −26.153 | 90.456 | |
| LDL-c | −21.341 | 30.869 | 0.509 | −92.524 | 49.843 | |
| HDL-c | −4.117 | 31.061 | 0.898 | −75.742 | 67.509 | |
| Triglycerides | −17.046 | 15.794 | 0.312 | −53.468 | 19.376 | |
| Hs-CRP | −0.311 | 0.316 | 0.354 | −1.038 | 0.417 | |
| BMI | −4.318 | 1.860 | 0.049 | −8.608 | −0.027 | |
| NO | −0.276 | 0.624 | 0.670 | −1.716 | 1.164 | |
| CAD | −5.194 | 56.769 | 0.929 | −136.104 | 125.716 | |
| Stroke | −29.095 | 21.624 | 0.215 | −78.960 | 20.770 | |
| Dyslipidemia | 0.442 | 41.628 | 0.992 | −95.553 | 96.436 | |
| Adiponectin | −0.014 | 0.229 | 0.953 | −0.541 | 0.514 | |
| NGF | −3.715 | 4.077 | 0.389 | −13.116 | 5.687 | |
| IL-8 | 0.088 | 2.696 | 0.975 | −6.129 | 6.306 | |
| MCP1 | 0.016 | 0.165 | 0.925 | −0.364 | 0.395 | |
| IL-1b | −0.129 | 7.983 | 0.987 | −18.537 | 18.278 | |
| GLP1 | −0.007 | 0.034 | 0.842 | −0.086 | 0.072 | |
| IL-6 | 0.274 | 0.956 | 0.782 | −1.930 | 2.479 | |
| Insulin | 0.007 | 0.012 | 0.591 | −0.021 | 0.035 | |
| Leptin | 0.007 | 0.005 | 0.196 | −0.004 | 0.018 | |
| TNFα | 0.861 | 1.215 | 0.499 | −1.941 | 3.664 | |
| Model 1 (R2 = 0.258) DV: Ox-LDL | Unstandardized Coefficients | P | 95% CI for B | |||
| B | SE | Lowe Bound | Upper Bound | |||
| M1 | (Constant) | 198.644 | 68.846 | 0.006 | 60.362 | 336.926 |
| UrCys-C | 0.445 | 0.114 | 0.0001 | 0.216 | 0.675 | |
| Age | 0.617 | 0.794 | 0.441 | −0.978 | 2.211 | |
| Gender | −4.252 | 15.750 | 0.788 | −35.886 | 27.382 | |
| HbA1c | −3.611 | 4.989 | 0.473 | −13.632 | 6.410 | |
| Model 2 (R2 = 0.563) DV: Ox-LDL | Unstandardized Coefficients | P | 95% CI for B | |||
| M2 | (Constant) | B | SE | Lower Bound | Upper Bound | |
| 108.111 | 131.725 | 0.420 | −164.384 | 380.606 | ||
| UrCys-C | 0.486 | 0.149 | 0.003 | 0.178 | 0.794 | |
| Age | 1.498 | 1.134 | 0.200 | −0.848 | 3.843 | |
| Gender | 18.101 | 22.374 | 0.427 | −28.182 | 64.384 | |
| HbA1c | 5.069 | 6.925 | 0.472 | −9.257 | 19.394 | |
| Creatinine | 0.092 | 0.104 | 0.384 | −0.123 | 0.308 | |
| Cholesterol-t | 0.690 | 15.143 | 0.964 | −30.636 | 32.015 | |
| LDL-c | 11.360 | 17.043 | 0.512 | −23.896 | 46.616 | |
| HDL-c | −22.347 | 27.726 | 0.429 | −79.701 | 35.008 | |
| Triglycerides | −8.502 | 12.033 | 0.487 | −33.394 | 16.389 | |
| Hs-CRP | −0.346 | 0.299 | 0.259 | −0.965 | 0.272 | |
| BMI | −2.496 | 1.673 | 0.149 | −5.956 | 0.965 | |
| NO | 0.031 | 0.449 | 0.945 | −0.897 | 0.960 | |
| Model 3 (R2 = 0.701) DV: Ox-LDL | Unstandardized Coefficients | P | 95% CI for B | |||
| M3 | (Constant) | B | SE | Lower Bound | Upper Bound | |
| 214.187 | 145.383 | 0.158 | −91.252 | 519.626 | ||
| UrCys-C | 0.309 | 0.158 | 0.066 | −0.022 | 0.641 | |
| Age | 0.853 | 1.221 | 0.494 | −1.713 | 3.419 | |
| Gender | 45.786 | 27.655 | 0.115 | −12.315 | 103.886 | |
| HbA1c | 5.412 | 6.711 | 0.430 | −8.686 | 19.511 | |
| Creatinine | 0.139 | 0.111 | 0.225 | −0.094 | 0.372 | |
| Cholesterol-t | 40.844 | 22.692 | 0.089 | −6.829 | 88.517 | |
| LDL-c | −29.745 | 24.665 | 0.243 | −81.565 | 22.076 | |
| HDL-c | 9.456 | 29.319 | 0.751 | −52.142 | 71.053 | |
| Triglycerides | −25.015 | 14.863 | 0.110 | −56.242 | 6.211 | |
| Hs-CRP | −0.595 | 0.301 | 0.064 | −1.227 | 0.037 | |
| BMI | −2.878 | 1.656 | 0.099 | −6.358 | 0.601 | |
| NO | −0.392 | 0.455 | 0.401 | −1.347 | 0.564 | |
| CAD | −24.604 | 17.187 | 0.169 | −60.713 | 11.504 | |
| Stroke | −0.086 | 0.131 | 0.519 | −0.362 | 0.189 | |
| Dyslipidemia | −20.048 | 30.350 | 0.517 | −83.811 | 43.715 | |
| Model 4 (R2 = 0.890) DV: Ox-LDL | Unstandardized Coefficients | P | 95% CI for B | |||
| M4 | (Constant) | B | SE | Lower Bound | Upper Bound | |
| 87.285 | 161.315 | 0.603 | −284.708 | 459.278 | ||
| UrCys-C | 0.149 | 0.161 | 0.382 | −0.222 | 0.521 | |
| Age | 1.390 | 1.427 | 0.358 | −1.899 | 4.680 | |
| Gender | 55.839 | 33.417 | 0.133 | −21.222 | 132.899 | |
| HbA1c | 9.570 | 7.959 | 0.264 | −8.783 | 27.923 | |
| Creatinine | 0.110 | 0.129 | 0.420 | −0.188 | 0.408 | |
| Cholesterol-t | 21.566 | 26.966 | 0.447 | −40.616 | 83.749 | |
| LDL-c | −16.295 | 33.218 | 0.637 | −92.896 | 60.306 | |
| HDL-c | −5.630 | 33.057 | 0.869 | −81.860 | 70.600 | |
| Triglycerides | −14.535 | 16.970 | 0.417 | −53.668 | 24.598 | |
| Hs-CRP | −0.220 | 0.330 | 0.523 | −0.980 | 0.540 | |
| BMI | −3.213 | 1.950 | 0.138 | −7.709 | 1.283 | |
| NO | 0.182 | 0.652 | 0.788 | −1.322 | 1.685 | |
| CAD | −25.028 | 57.626 | 0.676 | −157.914 | 107.858 | |
| Stroke | −15.093 | 20.842 | 0.490 | −63.155 | 32.970 | |
| Dyslipidemia | −19.615 | 42.016 | 0.653 | −116.504 | 77.274 | |
| Adiponectin | −0.200 | 0.216 | 0.380 | −0.697 | 0.297 | |
| NGF | −1.811 | 4.212 | 0.679 | −11.523 | 7.901 | |
| IL-8 | −1.296 | 2.638 | 0.636 | −7.379 | 4.786 | |
| MCP1 | −0.062 | 0.167 | 0.720 | −0.447 | 0.323 | |
| IL-1b | −5.192 | 7.697 | 0.519 | −22.940 | 12.557 | |
| GLP1 | 0.004 | 0.035 | 0.904 | −0.076 | 0.085 | |
| IL-6 | 0.635 | 1.014 | 0.549 | −1.702 | 2.972 | |
| Insulin | 0.000 | 0.012 | 0.988 | −0.028 | 0.028 | |
| Leptin | 0.004 | 0.005 | 0.472 | −0.008 | 0.016 | |
| TNFα | 1.649 | 1.091 | 0.169 | −0.866 | 4.164 | |
| Plasma Cystatin C Interaction with Ox-LDL | ||||||
| Model 1 (R2 = 0.369) DV: Ox-LDL | Unstandardized Coefficients | P | 95% CI for B | |||
| B | SE | Lower Bound | Upper Bound | |||
| M1 | (Constant) | 146.402 | 24.371 | 0.0001 | 96.761 | 196.043 |
| PlCys-C | 0.069 | 0.016 | 0.0001 | 0.037 | 0.102 | |
| Model 2 (R2 = 0.461) DV: Ox-LDL | Unstandardized Coefficients | P | 95% CI for B | |||
| M2 | (Constant) | B | SE | Lower Bound | Upper Bound | |
| 225.484 | 41.238 | <0.001 | 141.378 | 309.590 | ||
| PlCys-C | 0.051 | 0.017 | 0.005 | 0.017 | 0.086 | |
| Adiponectin | −0.363 | 0.158 | 0.028 | −0.685 | −0.042 | |
| Urinary Cystatin C Interaction with Ox-LDL | ||||||
| Model 1 (R2 = 0.351) DV: Ox-LDL | Unstandardized Coefficients | P | 95% CI for B | |||
| M1 | (Constant) | B | SE | Lower Bound | Upper Bound | |
| 179.781 | 18.072 | 0.0001 | 142.969 | 216.593 | ||
| UrCys-C | 0.555 | 0.134 | 0.0001 | 0.283 | 0.827 | |
| Model 2 (R2 = 0.527) DV: Ox-LDL | Unstandardized Coefficients | P | 95% CI for B | |||
| M2 | (Constant) | B | SE | Lower Bound | Upper Bound | |
| 259.036 | 28.048 | 0.0001 | 201.832 | 316.239 | ||
| UrCys-C | 0.459 | 0.119 | 0.0001 | 0.216 | 0.702 | |
| Adiponectin | −0.460 | 0.135 | 0.002 | −0.735 | −0.184 | |
| Mode 3 (R2 = 0.637) DV: Ox-LDL | Unstandardized Coefficients | P | 95% CI for B | |||
| M3 | (Constant) | B | SE | Lower Bound | Upper Bound | |
| 199.194 | 31.918 | 0.0001 | 134.009 | 264.379 | ||
| UrCys-C | 0.382 | 0.109 | 0.001 | 0.159 | 0.605 | |
| Adiponectin | −0.395 | 0.122 | 0.003 | −0.645 | −0.146 | |
| TNFα | 1.307 | 0.434 | 0.005 | 0.421 | 2.193 | |
| Relationship | Plasma Cystatin C | Urinary Cystatin C | ||||||||
|---|---|---|---|---|---|---|---|---|---|---|
| Mediation Type | Effect (β) (p-Value) | SE | t | 95% CI (LLCI) (ULCI) | Mediation (%) | Effect (β) (p-Value) | SE | t | 95% CI (LLCI) (ULCI) | Mediation (%) |
| Adiponectin | ||||||||||
| Total (c) | 0.071 (0.0001) | 0.012 | 5.972 | (0.047) (0.094) | - | 0.443 (0.0004) | 0.117 | 3.771 | (0.208) (0.679) | - |
| Direct (c’) | 0.057 (0.0001) | 0.012 | 4.816 | (0.033) (0.081) | - | 0.347 (0.0022) | 0.108 | 3.213 | (0.130) (0.563) | - |
| Indirect (a*b) | 0.013 | 0.006 | - | (0.003) (0.027) | 18.31 (PM) | 0.096 | 0.055 | - | (−0.004) (0.212) | 21.67 (NS) |
| Leptin | ||||||||||
| Total (c) | 0.071 (0.0001) | 0.012 | 5.972 | (0.047) (0.094) | - | 0.443 (0.0004) | 0.117 | 3.771 | (0.208) (0.679) | - |
| Direct (c’) | 0.067 (0.0001) | 0.012 | 5.343 | (0.042) (0.092) | - | 0.391 (0.023) | 0.122 | 3.200 | (0.146) (0.636) | - |
| Indirect (a*b) | 0.004 | 0.008 | - | (−0.003) (0.030) | 5.63 (NS) | 0.052 | 0.066 | - | (−0.069) (0.194) | 11.74 (NS) |
| TNFα | ||||||||||
| Total (c) | 0.071 (0.0001) | 0.012 | 5.972 | (0.047) (0.094) | - | 0.443 (0.0004) | 0.117 | 3.771 | (0.208) (0.679) | - |
| Direct (c’) | 0.057 (0.0001) | 0.015 | 3.768 | (0.027) (0.087) | - | 0.317 (0.065) | 0.112 | 2.830 | (0.093) (0.542) | - |
| Indirect (a*b) | 0.014 | 0.012 | - | (−0.010) (0.036) | 19.72 (NS) | 0.126 | 0.062 | - | (0.018) (0.261) | 28.44 (PM) |
| Insulin | ||||||||||
| Total (c) | 0.071 (0.0001) | 0.012 | 5.972 | (0.047) (0.094) | - | 0.443 (0.0004) | 0.117 | 3.771 | (0.208) (0.679) | - |
| Direct (c’) | 0.070 (0.0001) | 0.0001 | 5.931 | (0.040) (0.094) | - | 0.475 (0.0002) | 0.118 | 4.022 | (0.238) (0.712) | - |
| Indirect (a*b) | 0.000 | 0.002 | - | (−0.004) (0.625) | 0.00 (NS) | −0.032 | 0.031 | - | (−0.093) (0.032) | 0.00 (NS) |
| IL-6 | ||||||||||
| Total (c) | 0.071 (0.0001) | 0.012 | 5.972 | (0.047) (0.094) | - | 0.443 (0.0004) | 0.117 | 3.771 | (0.208) (0.679) | - |
| Direct (c’) | 0.068 (0.0001) | 0.013 | 5.218 | (0.042) (0.094) | - | 0.421 (0.0005) | 0.114 | 3.703 | (0.193) (0.649) | - |
| Indirect (a*b) | 0.003 | 0.006 | - | (−0.008) (0.016) | 4.22 (NS) | 0.022 | 0.033 | - | (−0.050) (0.089) | 4.99 (NS) |
| GLP1 | ||||||||||
| Total (c) | 0.071 (0.0001) | 0.012 | 5.972 | (0.047) (0.094) | - | 0.443 (0.0004) | 0.117 | 3.771 | (0.208) (0.679) | - |
| Direct (c’) | 0.067 (0.0001) | 0.012 | 5.366 | (0.042) (0.092) | - | 0.403 (0.0011) | 0.117 | 3.443 | (−0.016) (0.126) | - |
| Indirect (a*b) | 0.004 | 0.005 | - | (−0.003) (0.015) | 5.63 (NS) | 0.040 | 0.037 | - | (−0.016) (0.013) | 9.03 (NS) |
| IL-1b | ||||||||||
| Total (c) | 0.071 (0.0001) | 0.012 | 5.972 | (0.047) (0.094) | - | 0.443 (0.0004) | 0.117 | 3.771 | (0.208) (0.679) | - |
| Direct (c’) | 0.070 (0.0001) | 0.012 | 5.843 | (0.046) (0.094) | - | 0.438 (0.0007) | 0.122 | 3.605 | (0.195) (0.682) | - |
| Indirect (a*b) | 0.001 | 0.001 | - | (−0.003) (0.003) | 1.41 (NS) | 0.005 | 0.023 | - | (−0.057) (0.038) | 1.13 (NS) |
| MCP1 | ||||||||||
| Total (c) | 0.071 (0.0001) | 0.012 | 5.972 | (0.047) (0.094) | - | 0.443 (0.0004) | 0.117 | 3.771 | (0.208) (0.679) | - |
| Direct (c’) | 0.071 (0.0001) | 0.012 | 5.915 | (0.047) (0.095) | - | 0.443 (0.0005) | 0.119 | 3.734 | (0.205) (0.681) | - |
| Indirect (a*b) | 0.0001 | 0.002 | - | (−0.007) (0.003) | 1.41 (NS) | 0.0003 | 0.015 | - | (−0.036) (0.031) | 0.07 (NS) |
| IL-8 | ||||||||||
| Total (c) | 0.071 (0.0001) | 0.012 | 5.972 | (0.047) (0.094) | - | 0.443 (0.0004) | 0.117 | 3.771 | (0.208) (0.679) | - |
| Direct (c’) | 0.071 (0.0001) | 0.012 | 5.917 | (0.095) (0.627) | - | 0.447 (0.0004) | 0.119 | 3.745 | (0.208) (0.686) | - |
| Indirect (a*b) | 0.0001 | 0.002 | - | (−0.005) (0.002) | 1.41 (NS) | -0.004 | 0.025 | - | (−0.079) (0.018) | 0.00 (NS) |
| NGF | ||||||||||
| Total (c) | 0.071 (0.0001) | 0.012 | 5.972 | (0.047) (0.094) | - | 0.443 (0.0004) | 0.117 | 3.771 | (0.208) (0.679) | - |
| Direct (c’) | 0.074 (0.0001) | 0.013 | 5.825 | (0.099) (0.655) | - | 0.440 (0.0004) | 0.117 | 3.753 | (0.205) (0.675) | - |
| Indirect (a*b) | −0.003 | 0.004 | - | (−0.013) (0.004) | 0.00 (NS) | 0.003 | 0.026 | - | (−0.063) (0.049) | 0.68 (NS) |
Disclaimer/Publisher’s Note: The statements, opinions and data contained in all publications are solely those of the individual author(s) and contributor(s) and not of MDPI and/or the editor(s). MDPI and/or the editor(s) disclaim responsibility for any injury to people or property resulting from any ideas, methods, instructions or products referred to in the content. |
© 2025 by the authors. Licensee MDPI, Basel, Switzerland. This article is an open access article distributed under the terms and conditions of the Creative Commons Attribution (CC BY) license (https://creativecommons.org/licenses/by/4.0/).
Share and Cite
Bakillah, A.; Soliman, A.F.; Al Subaiee, M.; Obeid, K.K.; Al Hussaini, A.; Bashir, S.F.; Al Arab, M.; Al Otaibi, A.; Mubarak, S.A.S.; Al Qarni, A.A. Adiponectin and TNF-Alpha Differentially Mediate the Association Between Cystatin C and Oxidized LDL in Type 2 Diabetes Mellitus Patients. Int. J. Mol. Sci. 2025, 26, 3001. https://doi.org/10.3390/ijms26073001
Bakillah A, Soliman AF, Al Subaiee M, Obeid KK, Al Hussaini A, Bashir SF, Al Arab M, Al Otaibi A, Mubarak SAS, Al Qarni AA. Adiponectin and TNF-Alpha Differentially Mediate the Association Between Cystatin C and Oxidized LDL in Type 2 Diabetes Mellitus Patients. International Journal of Molecular Sciences. 2025; 26(7):3001. https://doi.org/10.3390/ijms26073001
Chicago/Turabian StyleBakillah, Ahmed, Ayman Farouk Soliman, Maram Al Subaiee, Khamis Khamees Obeid, Arwa Al Hussaini, Shahinaz Faisal Bashir, Mohammad Al Arab, Abeer Al Otaibi, Sindiyan Al Shaikh Mubarak, and Ali Ahmed Al Qarni. 2025. "Adiponectin and TNF-Alpha Differentially Mediate the Association Between Cystatin C and Oxidized LDL in Type 2 Diabetes Mellitus Patients" International Journal of Molecular Sciences 26, no. 7: 3001. https://doi.org/10.3390/ijms26073001
APA StyleBakillah, A., Soliman, A. F., Al Subaiee, M., Obeid, K. K., Al Hussaini, A., Bashir, S. F., Al Arab, M., Al Otaibi, A., Mubarak, S. A. S., & Al Qarni, A. A. (2025). Adiponectin and TNF-Alpha Differentially Mediate the Association Between Cystatin C and Oxidized LDL in Type 2 Diabetes Mellitus Patients. International Journal of Molecular Sciences, 26(7), 3001. https://doi.org/10.3390/ijms26073001