Article

Functional Differentiation and Regulatory Mechanisms of Ferrochelatases HemH1 and HemH2 in Bacillus thuringiensis Under Iron and Oxidative Stress

1
Hubei Key Laboratory of Regional Development and Environmental Response, Faculty of Resources and Environmental Science, Hubei University, Wuhan 430062, China
2
National Key Laboratory of Agricultural Microbiology, College of Life Science and Technology, Huazhong Agricultural University, Wuhan 430062, China
*
Author to whom correspondence should be addressed.
These authors contributed equally to this work.
Int. J. Mol. Sci. 2025, 26(7), 2911; https://doi.org/10.3390/ijms26072911
Submission received: 19 February 2025 / Revised: 14 March 2025 / Accepted: 20 March 2025 / Published: 23 March 2025
(This article belongs to the Special Issue Molecular Research on Bacteria)

Abstract

Ferrochelatase is the terminal enzyme in heme biosynthesis. Bacillus thuringiensis (Bt) 97-27 contains two ferrochelatases, HemH1 and HemH2, but their regulatory mechanisms and functional differences under virous environmental stimuli remain unclear. This study confirmed that the iron uptake regulator protein (Fur) bound to the promoters of hemH1 and hemH2, with Fe2+ or Fe3+ enhancing this binding. Heterologous expression of HemH1 and HemH2 in Escherichia coli showed that pEH2/BL grew better than pEH1/BL under different 2,2′-Bipyridyl, Fe2+, and Fe3+ concentrations. Under iron limitation, the heme precursor ALA production decreased significantly in both strains. The heme production of pEH2/BL decreased sharply under iron-limited conditions, while that of pEH1/BL decreased significantly under iron-rich conditions. The H2O2 sensitivity experiment revealed that E. coli pEH1/BL was more tolerant to H2O2 than pEH2/BL. In Bt, ΔhemH2 was most sensitive to H2O2 stress, but complementation of hemH1 or hemH2 partially restored H2O2 resistance, with the overexpressed strain pHH2/Bt being most tolerant. β-galactosidase assays indicated that Fur positively regulated hemH1 and negatively regulated hemH2 under normal conditions, but this regulation reversed with 2.5 mM Fe3+. qRT-PCR showed upregulation of genes related to heme synthesis, oxidative stress, and ferrous iron transport. This study reveals the functional differentiation of HemH1 and HemH2 under the joint regulation of Fur and environmental factors, highlighting their synergistic roles in heme synthesis, heavy metal detoxification, and oxidative stress resistance to maintain bacterial physiological homeostasis.

1. Introduction

Heme, an iron-containing porphyrin macrocycle, is also known as hematin or iron porphyrin and belongs to the family of cyclic modified tetrapyrroles [1]. As a prosthetic group for numerous metalloenzymes [2], heme plays critical roles in cellular signaling, cell differentiation, gene transcription regulation, and protein translation [3,4,5,6]. Due to its high bioavailability, no side effects, and easy of absorption, heme is widely utilized as a food additive and a natural iron supplement in the food industry, medicine, and biotechnology fields [7,8,9]. Currently, three distinct heme biosynthesis pathways have been identified in prokaryotes: the protoporphyrin-dependent (PPD) pathway, the coproporphyrin-dependent (CPD) pathway, and the siroheme-dependent (SHD) pathway [10]. The PPD pathway is predominantly found in eukaryotes and most Gram-negative bacteria, while the CPD pathway, is primarily present in Gram-positive bacteria. The SHD pathway (initially termed the alternative heme biosynthesis pathway, Ahb) is active in sulfate-reducing Proteobacteria and Archaea [11].
Ferrochelatase, encoded by the hemH gene, is the terminal enzyme in heme biosynthesis. In the PPD pathway, protoporphyrin ferrochelatase catalyzes the insertion of Fe2+ into protoporphyrin IX ring to form heme. In the CPD pathway, coproporphyrin ferrochelatase (CpfC) incorporates Fe2+ into coproporphyrin III to generate Fe-coproheme, which is subsequently decarboxylated to form heme [12]. Notably, the SHD pathway does not require ferrochelatase for heme synthesis. At present, most bacteria contain only one HemH. The existence of two ferrochelatase paralogues, HemH1 and HemH2, has been reported only in Shewanella species [13,14]. For instance, in S. loihica PV-4, disrupting hemH1, rather than hemH2, leads to a significant accumulation of the heme precursor, extracellular protoporphyrin IX (PPIX). Notably, hemH2 compensates for the loss of hemH1 by driving heme and cytochrome synthesis in the ΔhemH1 strain, albeit with reduced intracellular heme levels [13]. However, S. oneidensis MR-1 exhibits distinct regulatory mechanisms. The deletion of hemH1 or hemH2 alone does not cause PPIX accumulation. PPIX accumulates only in the ΔhemH1ΔhemH2 double mutant under aerobic conditions. Furthermore, hemH1 exhibits constitutive expression, and its disruption triggers significant transcriptional upregulation of hemH2 to compensate for functional deficits [13,14]. The transcription of the heme synthesis gene hemH1 is regulated by the housekeeping sigma factor RpoD and potentially by OxyR, while that of hemH2 appears to be regulated by the oxidative stress-associated sigma factor RpoE2 [14]. These findings suggest that while the two ferrochelatases share functional redundancy in heme biosynthesis with compensatory interactions, they are subjected to differential regulatory mechanisms under environmental stresses to maintain heme homeostasis.
The central ferrous ion coordinated within heme is crucial for its electron transfer capacity and redox activity. Studies have shown that iron levels can influence heme synthesis to some extent [15,16]. The ferric uptake regulator (Fur) protein plays a pivotal role in iron metabolism regulation [17]. As a DNA-binding protein, Fur recognizes specific DNA sequences and utilizes Fe2+ or Mn2+ as a corepressor to modulate the transcription of target genes [18]. Under iron-deficient conditions, Fur cannot bind Fe2+ and exists in its apo-Fur form, allowing RNA polymerase to bind to promoter regions and initiate gene transcription [19]. Conversely, under iron-sufficient conditions, the Fur binds to Fe2+ to form a complex and binds to promoter regions, preventing RNA polymerase binding and thereby repressing the transcription of target genes such as endd, entF, entCEBA, and iucABCD [20]. Previous studies have reported that overexpression of the furA gene in Anabaena sp. activates the transcription and translation of the ferrochelatase gene hemH, indicating a regulatory role of FurA in heme biosynthesis [19]. However, the specific mechanisms by which Fur regulates hemH in other bacterial strains, as well as the influence of metal ions, remain poorly understood. Additionally, whether the hemH gene participates in other physiological functions beyond its role as a ferrochelatase is still unclear.
Bacillus thuringiensis serovar konkukian strain 97-27 (hereafter, Bt 97-27), ubiquitously distributed in soil, aquatic systems, and insect intestinal tracts, also has two ferrochelatases, HemH1 and HemH2 like Shewanella. These characteristics make Bt 97-27 an ideal system for studying heme synthesis and homeostasis in environmental microbes. However, the molecular mechanisms underlying functional divergence between HemH1 and HemH2 in Bt 97-27 remain elusive, and their differential transcriptional regulatory networks under varying physiological conditions are yet to be elucidated. To address these knowledge gaps, we first constructed hemH1 and hemH2 heterologous expression strains, designated as pEH1/BL and pEH2/BL, along with an empty vector control strain (pE/BL) in Escherichia coli BL21(DE3). Subsequently, we generated a hemH2 knockout strain (ΔhemH2), an empty vector control strain (pH/Bt), an overexpression strain (pHH2/Bt), and complemented strains (pHH1/Δh2 and pHH2/Δh2) in Bt 97-27. Systematic functional analyses were performed to dissect the roles of HemH1 and HemH2 in antioxidant stress response, heavy metal detoxification, and heme synthesis. Furthermore, the regulatory mechanisms of the Fur protein on hemH1 and hemH2 under the action of various environmental stressors, including 2,2′-bipyridyl (Dip), Fe2+, Fe3+, and H2O2, were also investigated. This study not only advances our understanding of the complexity of heme biosynthesis regulatory networks in bacterial environmental adaptation but also provides potential mechanistic insights into human pathologies such as anemia, porphyria, and cancer.

2. Results

2.1. The Effect of Different Concentrations of Dip, Fe2+, and Fe3+ on Strain Growth

The growth curve analysis of different E. coli strains showed that, during the initial 8 h, the host strain BL21(DE3), the empty vector strain pE/BL, and the recombinant strains pEH1/BL and pEH2/BL exhibited nearly identical growth trends (Figure S1A). However, from 10 to 168 h, the growth of the recombinant strain pEH1/BL was significantly inhibited, while the growth of the recombinant strain pEH2/BL was significantly promoted compared to other strains (Figure S1B). When the Dip concentration was ≤0.1 mM, it had a minimal impact on the growth of the host strain BL21(DE3) (Figure 1A), the empty vector strain pE/BL (Figure 1B), and the recombinant strain pEH2/BL (Figure 1D) at the vast majority of times. However, the growth of the recombinant strain pEH1/BL was moderately inhibited, and this inhibitory effect intensified with increasing Dip concentrations (Figure 1C). When the Dip concentration reached 0.2 mM, the growth of all four strains was significantly suppressed (Figure 1A–D).
The growth curves of the four E. coli strains under different Fe2+ concentrations are shown in Figure 1E–H. When the Fe2+ concentration was ≤0.5 mM, it moderately promoted the growth of all four strains, which was especially significant at 12 h (Figure 1E–H). However, when the Fe2+ concentration reached 1 mM, it significantly inhibited the growth of the empty vector strain pE/BL (Figure 1F) and the recombinant strain pEH1/BL (Figure 1G), but had little effect on the growth of the host strain BL21 (DE3) (Figure 1E) and the recombinant strain pEH2/BL (Figure 1H), with only significant effects at certain time points (Figure 1H).
The growth curves of the four E. coli strains under different Fe3+ concentrations are shown in Figure 1I–L. For the host strain BL21(DE3) and the empty vector strain pE/BL, varying Fe3+ concentrations did not exhibit significant effects on their growth within 8 h (Figure 1I,J). For the recombinant strain pEH1/BL, Fe3+ concentrations ≥0.5 mM significantly inhibited its growth after 8 h (Figure 1K). In contrast, for the recombinant strain pEH2/BL, Fe3+ concentrations ranging from 0.25 to 1 mM promoted its growth, and the promoting effect increased with higher Fe3+ concentrations (Figure 1L).
In Bt strains, the addition of Fe2+ and Fe3+ at concentrations ranging from 0 to 1 mM had minimal impact on bacterial growth. Therefore, this study focused on examining the effects of iron-limited conditions induced by varying concentrations of Dip on the growth of different strains (Figure 2A–F). The results demonstrated that, compared to other strains, the overexpression strain pHH2/Bt and the complemented strains pHH1/Δh2 and pHH2/Δh2 all grew slower in LB containing erythromycin due to the presence of pHT315 plasmid (Figure 2D–F). When Dip concentrations were ≤0.05 mM, there was no significant effect on the growth of all the strains. When the Dip concentration was 0.1 mM, only the growth of the knockout strain ΔhemH2 was significantly inhibited. When the Dip concentration was 2mM, all strains showed significant inhibitory effects from the eighth hour onwards at different time points (Figure 2A–F).

2.2. The Effect of Different Concentrations of H2O2 on Bacterial Growth

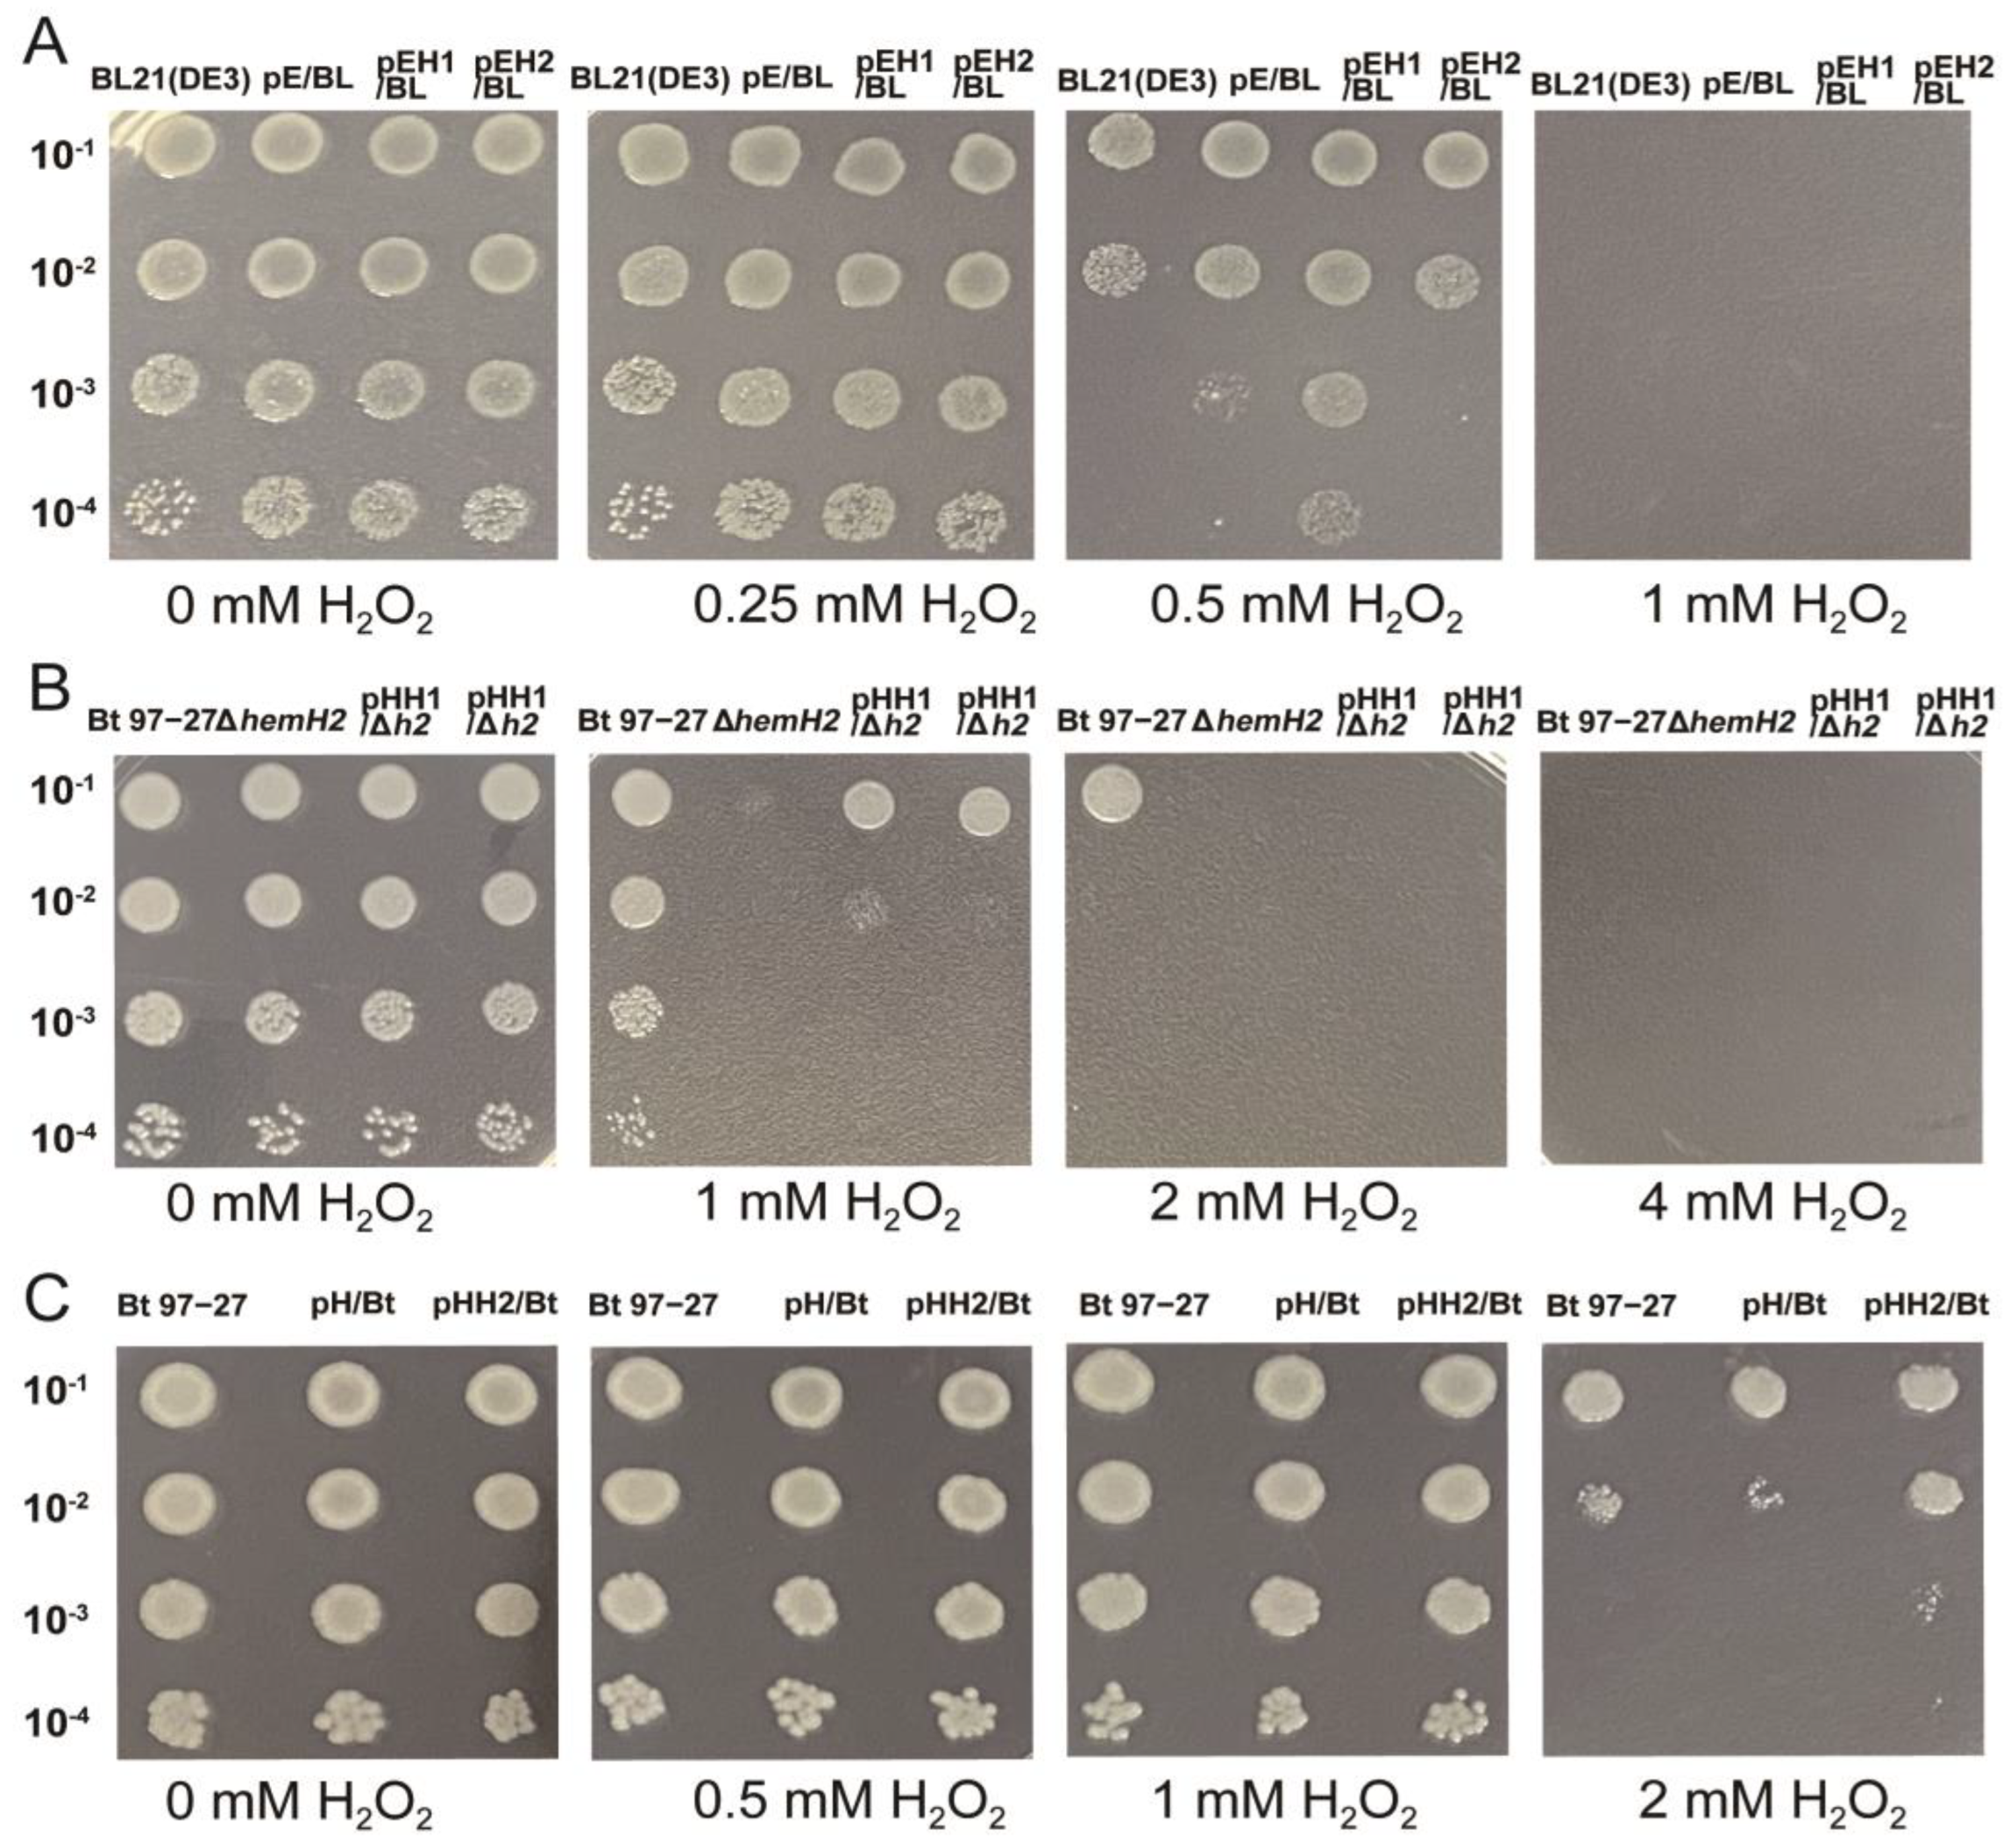
The H2O2 sensitivity experiment found that on LB solid plates containing 0.25 mM H2O2, the four dilution gradients of E. coli BL21(DE3), pE/BL, pEH1/BL, and pEH2/BL strains all grew normally (Figure 3A). On LB solid plates containing 0.5 mM H2O2, the host strain BL21(DE3) and the recombinant strain pEH2/BL with dilutions exceeding 10−3 could not grow, while the empty vector strain pE/BL and the recombinant strain pEH1/BL could grow, with pEH1/BL growing even better. Therefore, the recombinant strain pEH2/BL is more sensitive to H2O2 than the empty vector strain pE/BL and the recombinant strain pEH1/BL. However, on LB solid plates containing 1 mM H2O2, none of the four strains could grow (Figure 3A).
This study also examined the sensitivity of six Bt strains to H2O2. It was found that on solid plates containing 1 mM H2O2, at a dilution of 10−2, only ΔhemH2 could not grow, although pHH1/Δh2 and pHH2/Δh2 also showed poor growth. At a dilution of 10−3, only Bt 97-27 could grow, while the other three strains could not, indicating that the H2O2 tolerance of the knockout strain ΔhemH2 was significantly reduced compared to the wild-type strain Bt 97-27. However, when the complemented recombinant plasmids pHT315-hemH1 and pHT315-hemH2 were introduced into ΔhemH2, the ability of complemented strains pHH1/Δh2 and pHH2/Δh2 to resist H2O2 was significantly enhanced, although they still could not be restored to the level of the wild-type strain Bt 97-27 (Figure 3B). On LB solid plates containing 2 mM H2O2, Bt 97-27, pH/Bt, and pHH2/Bt could all grow, with pHH2/Bt growing the best, but ΔhemH2, pHH1/Δh2, and pHH2/Δh2 could not grow (Figure 3B,C). Therefore, compared to the wild-type strain Bt 97-27 and the empty vector strain pH/Bt, the overexpressed strain pHH2/Bt is the most tolerant to H2O2, while ΔhemH2 is the most sensitive to H2O2.

2.3. The Effect of Iron-Limited Conditions on the Production of 5-ALA by E. coli Strains

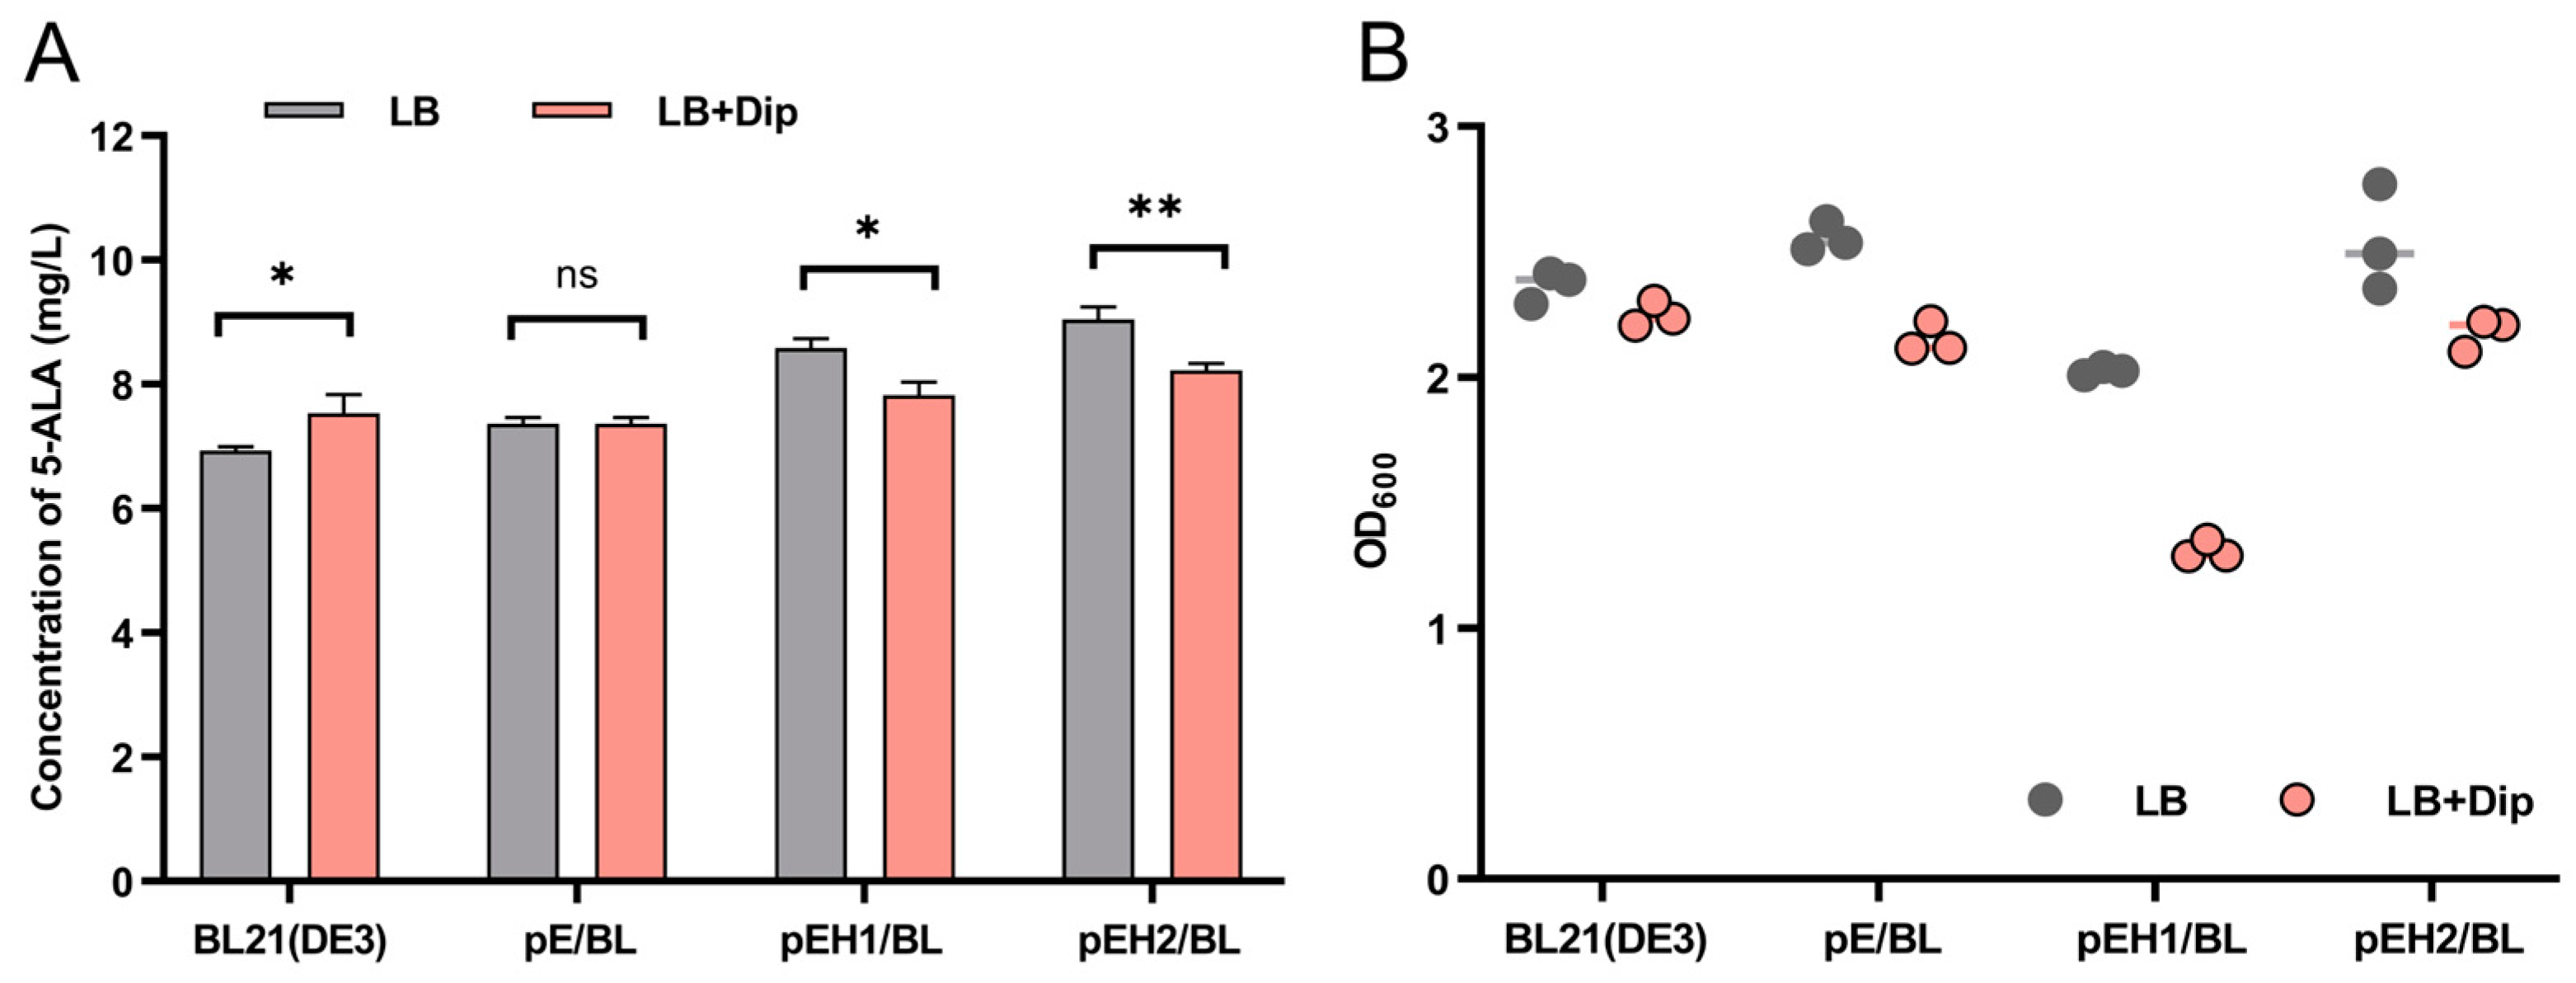
Under iron-limited conditions created by adding 0.2 mM Dip to LB medium, the ALA production of the host strain BL21(DE3) (7.53 mg/L) was significantly higher than that without Dip (6.94 mg/L) (p < 0.05). In contrast, the ALA production of the empty vector strain pE/BL (7.37 mg/L) showed no significant change compared to that without Dip (7.37 mg/L). However, the ALA production of the recombinant strains pEH1/BL (7.83 mg/L) and pEH2/BL (8.22 mg/L) significantly decreased compared to their respective productions without Dip (8.59 mg/L and 9.05 mg/L, p < 0.05) (Figure 4A). Although the addition of Dip led to a relative decrease in the cell density of pEH1/BL, it had no significant effect on the cell density of pEH2/BL. This indicates that the reduction in ALA production is not directly correlated with changes in cell density (Figure 4B).

2.4. The Effect of Dip, Fe2+, Fe3+ on the Production of Heme by E. coli Strains

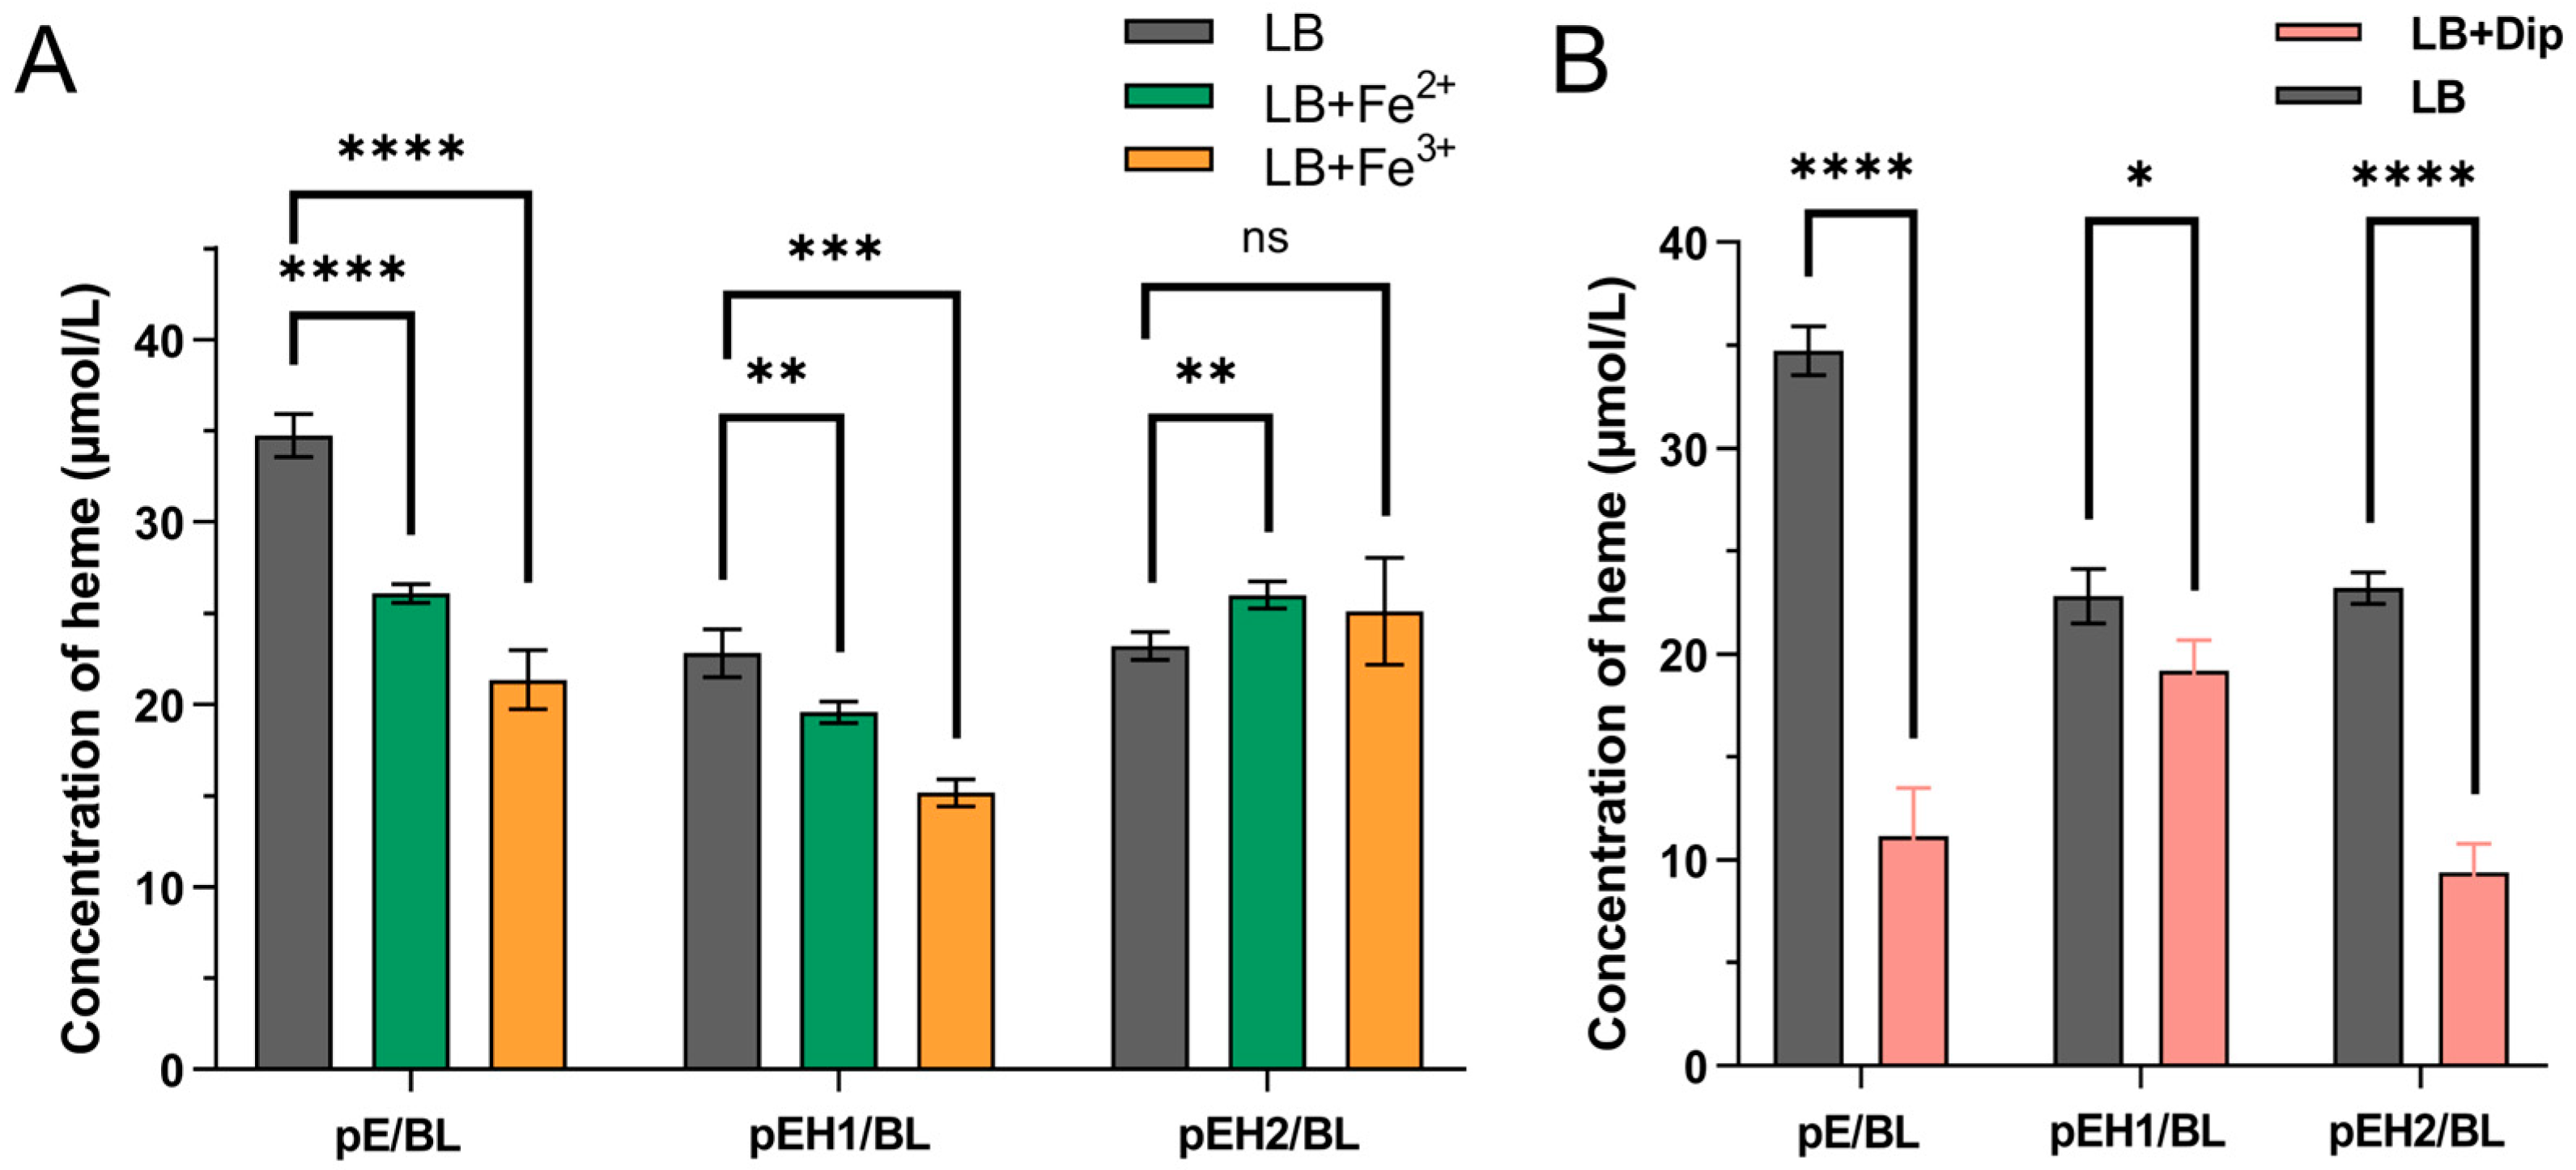
As shown in Figure 5A, the empty vector strain pE/BL can produce 34.74 µM heme in LB medium, while the heme content decreases to 26.08 µM and 21.35 µM in LB containing 0.1 mM Fe2+ and 0.025 mM Fe3+, respectively. The recombinant strain pEH1/BL can produce 22.82 µM heme in LB, while the heme production decreases to 19.58 µM and 15.16 µM in LB containing 0.1 mM Fe2+ and 0.025 mM Fe3+, respectively. The recombinant strain pEH2/BL can produce 23.21 µM heme in LB. In LB containing 0.1 mM Fe2+ and 0.025 mM Fe3+, the heme production increases to 25.99 µM and 25.12 µM, respectively, maintaining an upward or stable trend.
According to Figure 5B, the empty vector strain pE/BL can produce 37.47 µM heme in LB, but its yield decreases to 11.17 µM under iron-limiting conditions with 0.2 mM Dip. The recombinant strain pEH2/BL can produce 23.20 µM heme in LB, but its yield sharply decreases to 9.39 µM/L under iron-limited conditions with 0.2 mM Dip. The recombinant strain pEH1/BL can produce 22.82 µM heme in LB, but its heme yield decreases to 19.19 µM under iron-limited conditions with 0.2 mM Dip.

2.5. Metal Ion-Dependent Fur Binding to PhemH1 or PhemH2 Promoters and Binding Region Verification

The SDS-PAGE results demonstrated that the recombinant Fur protein purified by Ni-NTA (19.3 mg/mL) exhibited high purity and matched the theoretical molecular weight of Fur (21.68 kDa) (Figure S2), which was suitable for subsequent electrophoretic mobility shift assay (EMSA) experiments.
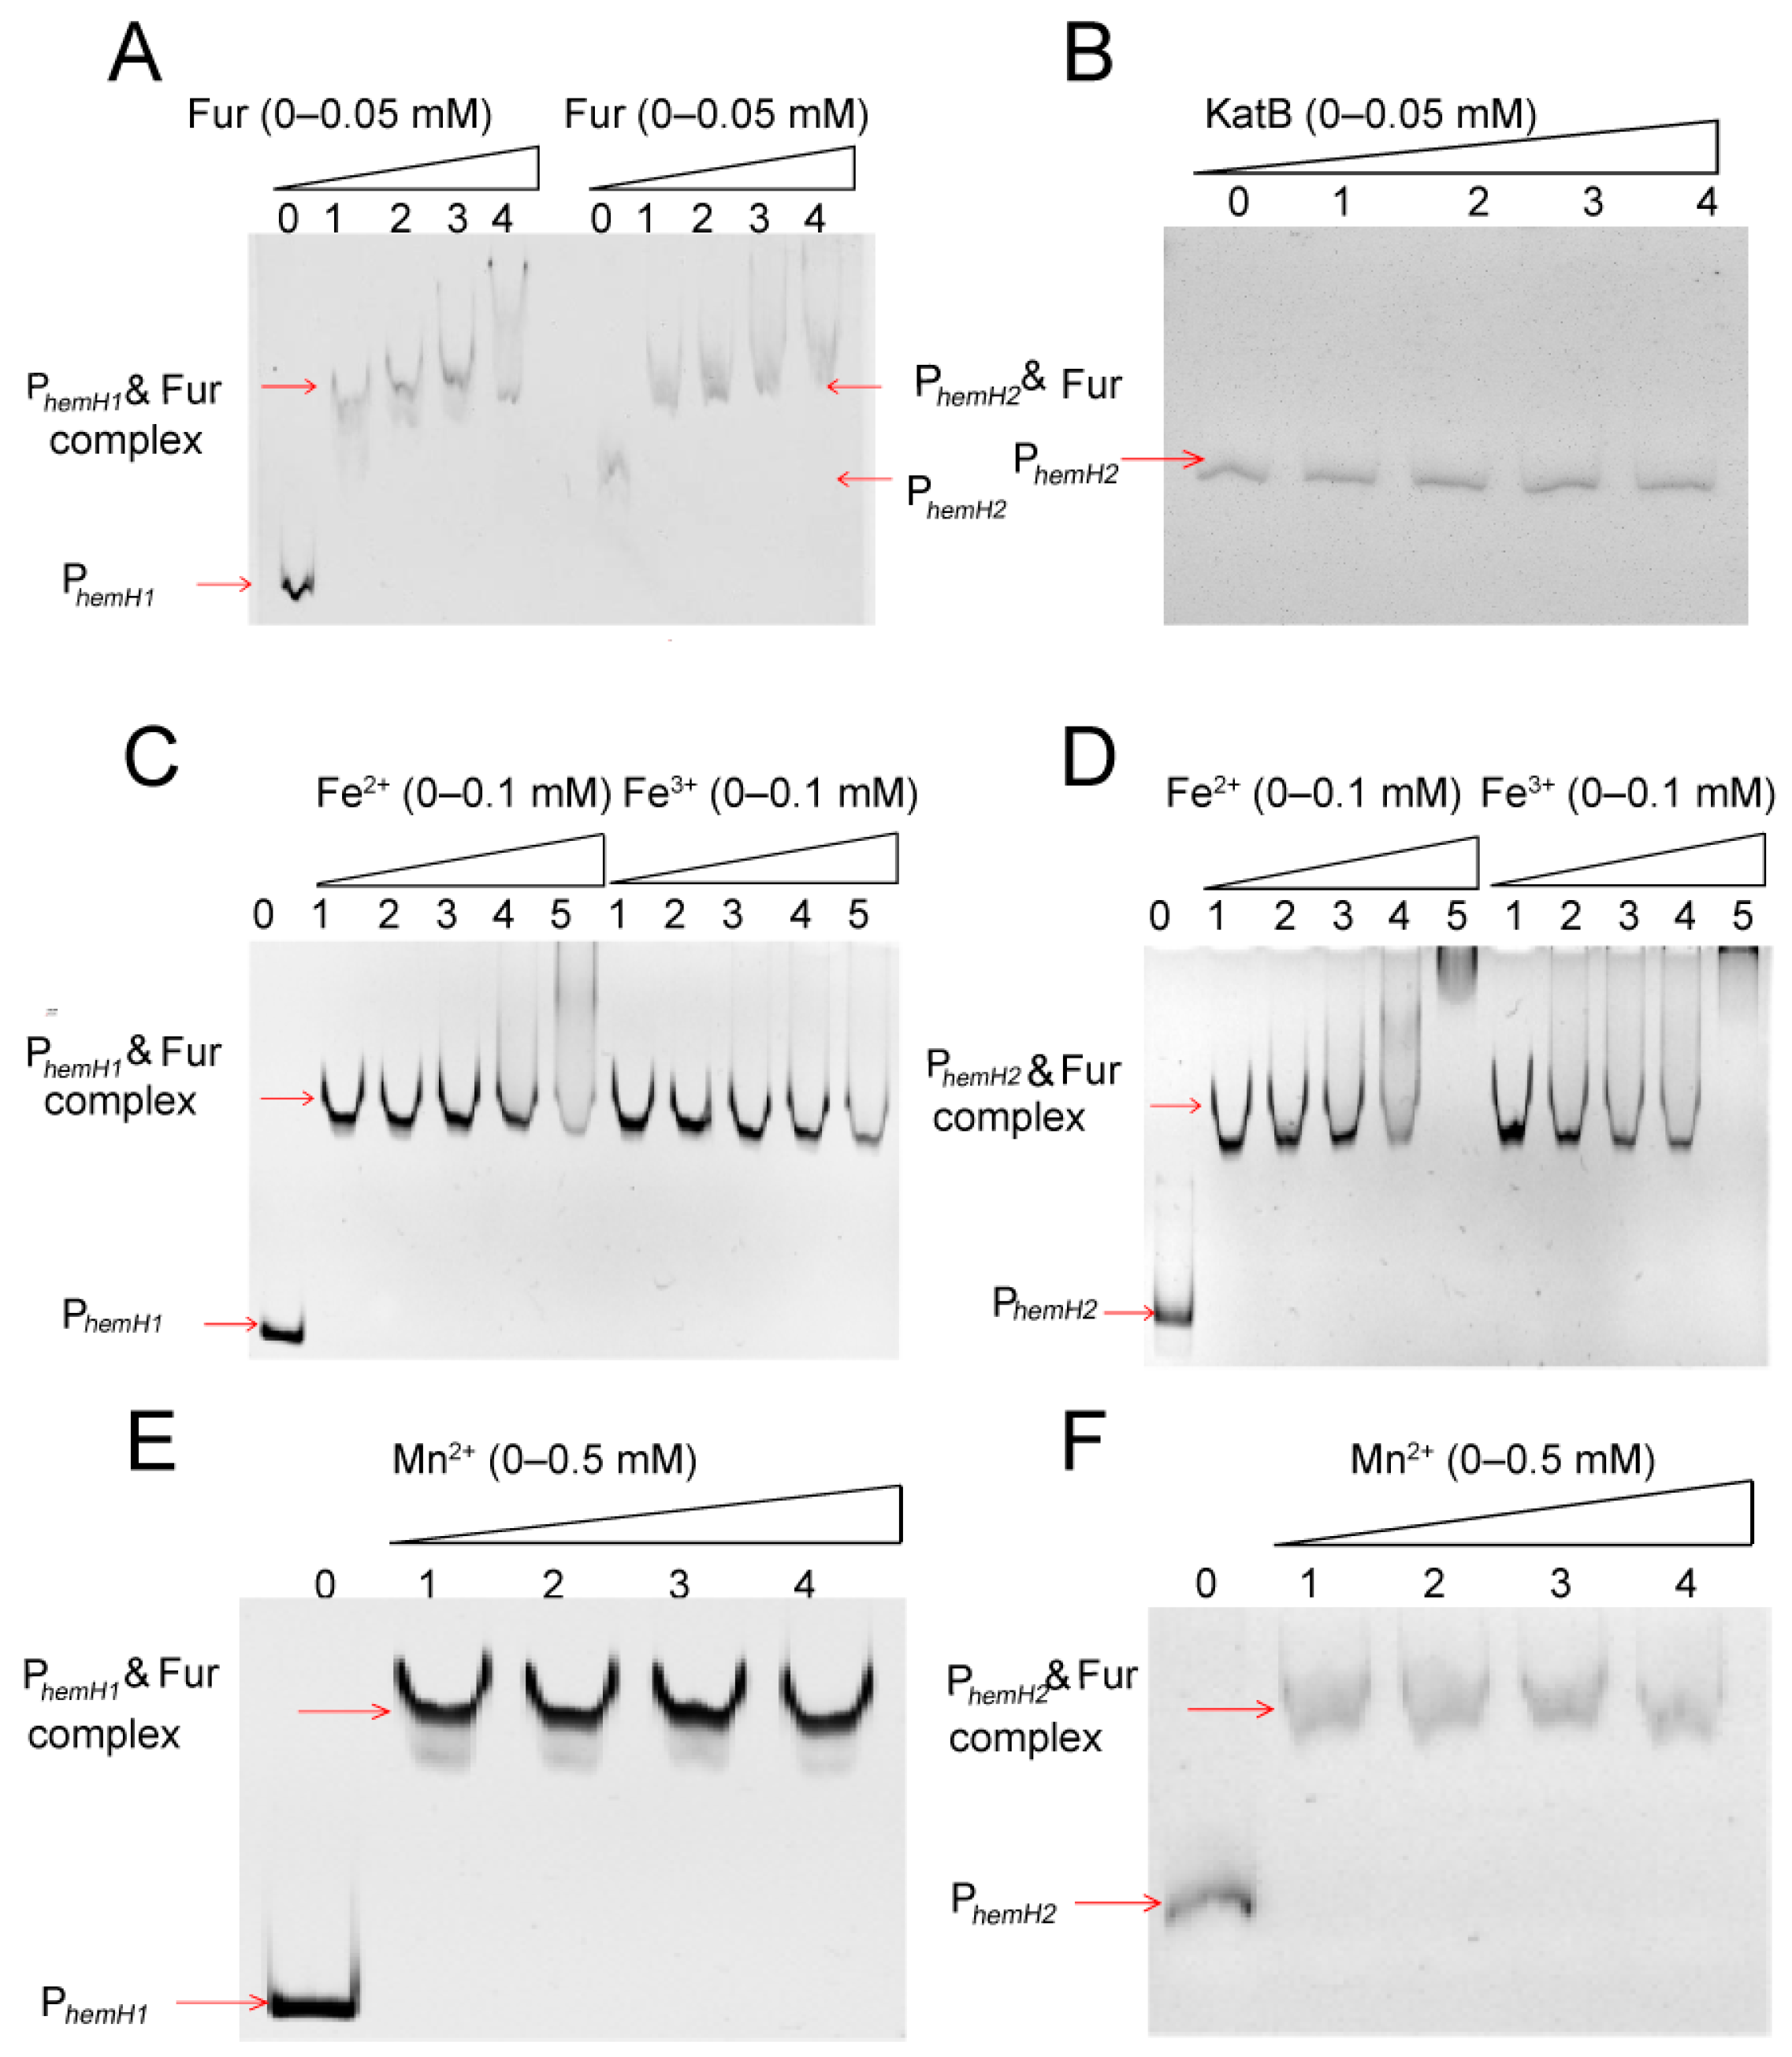
As shown in Figure 6A, for both PhemH1 and PhemH2, the migration of the promoter DNA bands slowed down and shifted upward with increasing concentrations of the Fur protein. This indicates that Fur, as a regulatory protein, can bind to the promoter DNA of PhemH1 and PhemH2, forming Fur–PhemH1 and Fur–PhemH2 complexes, respectively. Moreover, higher concentrations of Fur enhanced the binding affinity between Fur and the promoter DNA. In contrast, the non-regulatory protein KatB (catalase) did not bind to PhemH2, as no band shift was observed even with increasing concentrations of KatB (Figure 6B).
Figure 6C,D displayed that as the concentrations of Fe2+ or Fe3+ in the EMSA reaction system increased, the binding between Fur and the promoter DNA became stronger, while the amount of free promoter DNA fragments decreased. This suggests that both Fe2+ and Fe3+ promoted the binding of Fur to PhemH1 and PhemH2, and this promoting effect intensified with increasing concentrations of Fe2+ or Fe3+. However, as shown in Figure 6E,F, increasing concentrations of Mn2+ had no effect on the binding of Fur to either PhemH1 or PhemH2.

2.6. Verification of the Binding Regions of Fur with PhemH1 and PhemH2 with Fur by DNase I Footprinting

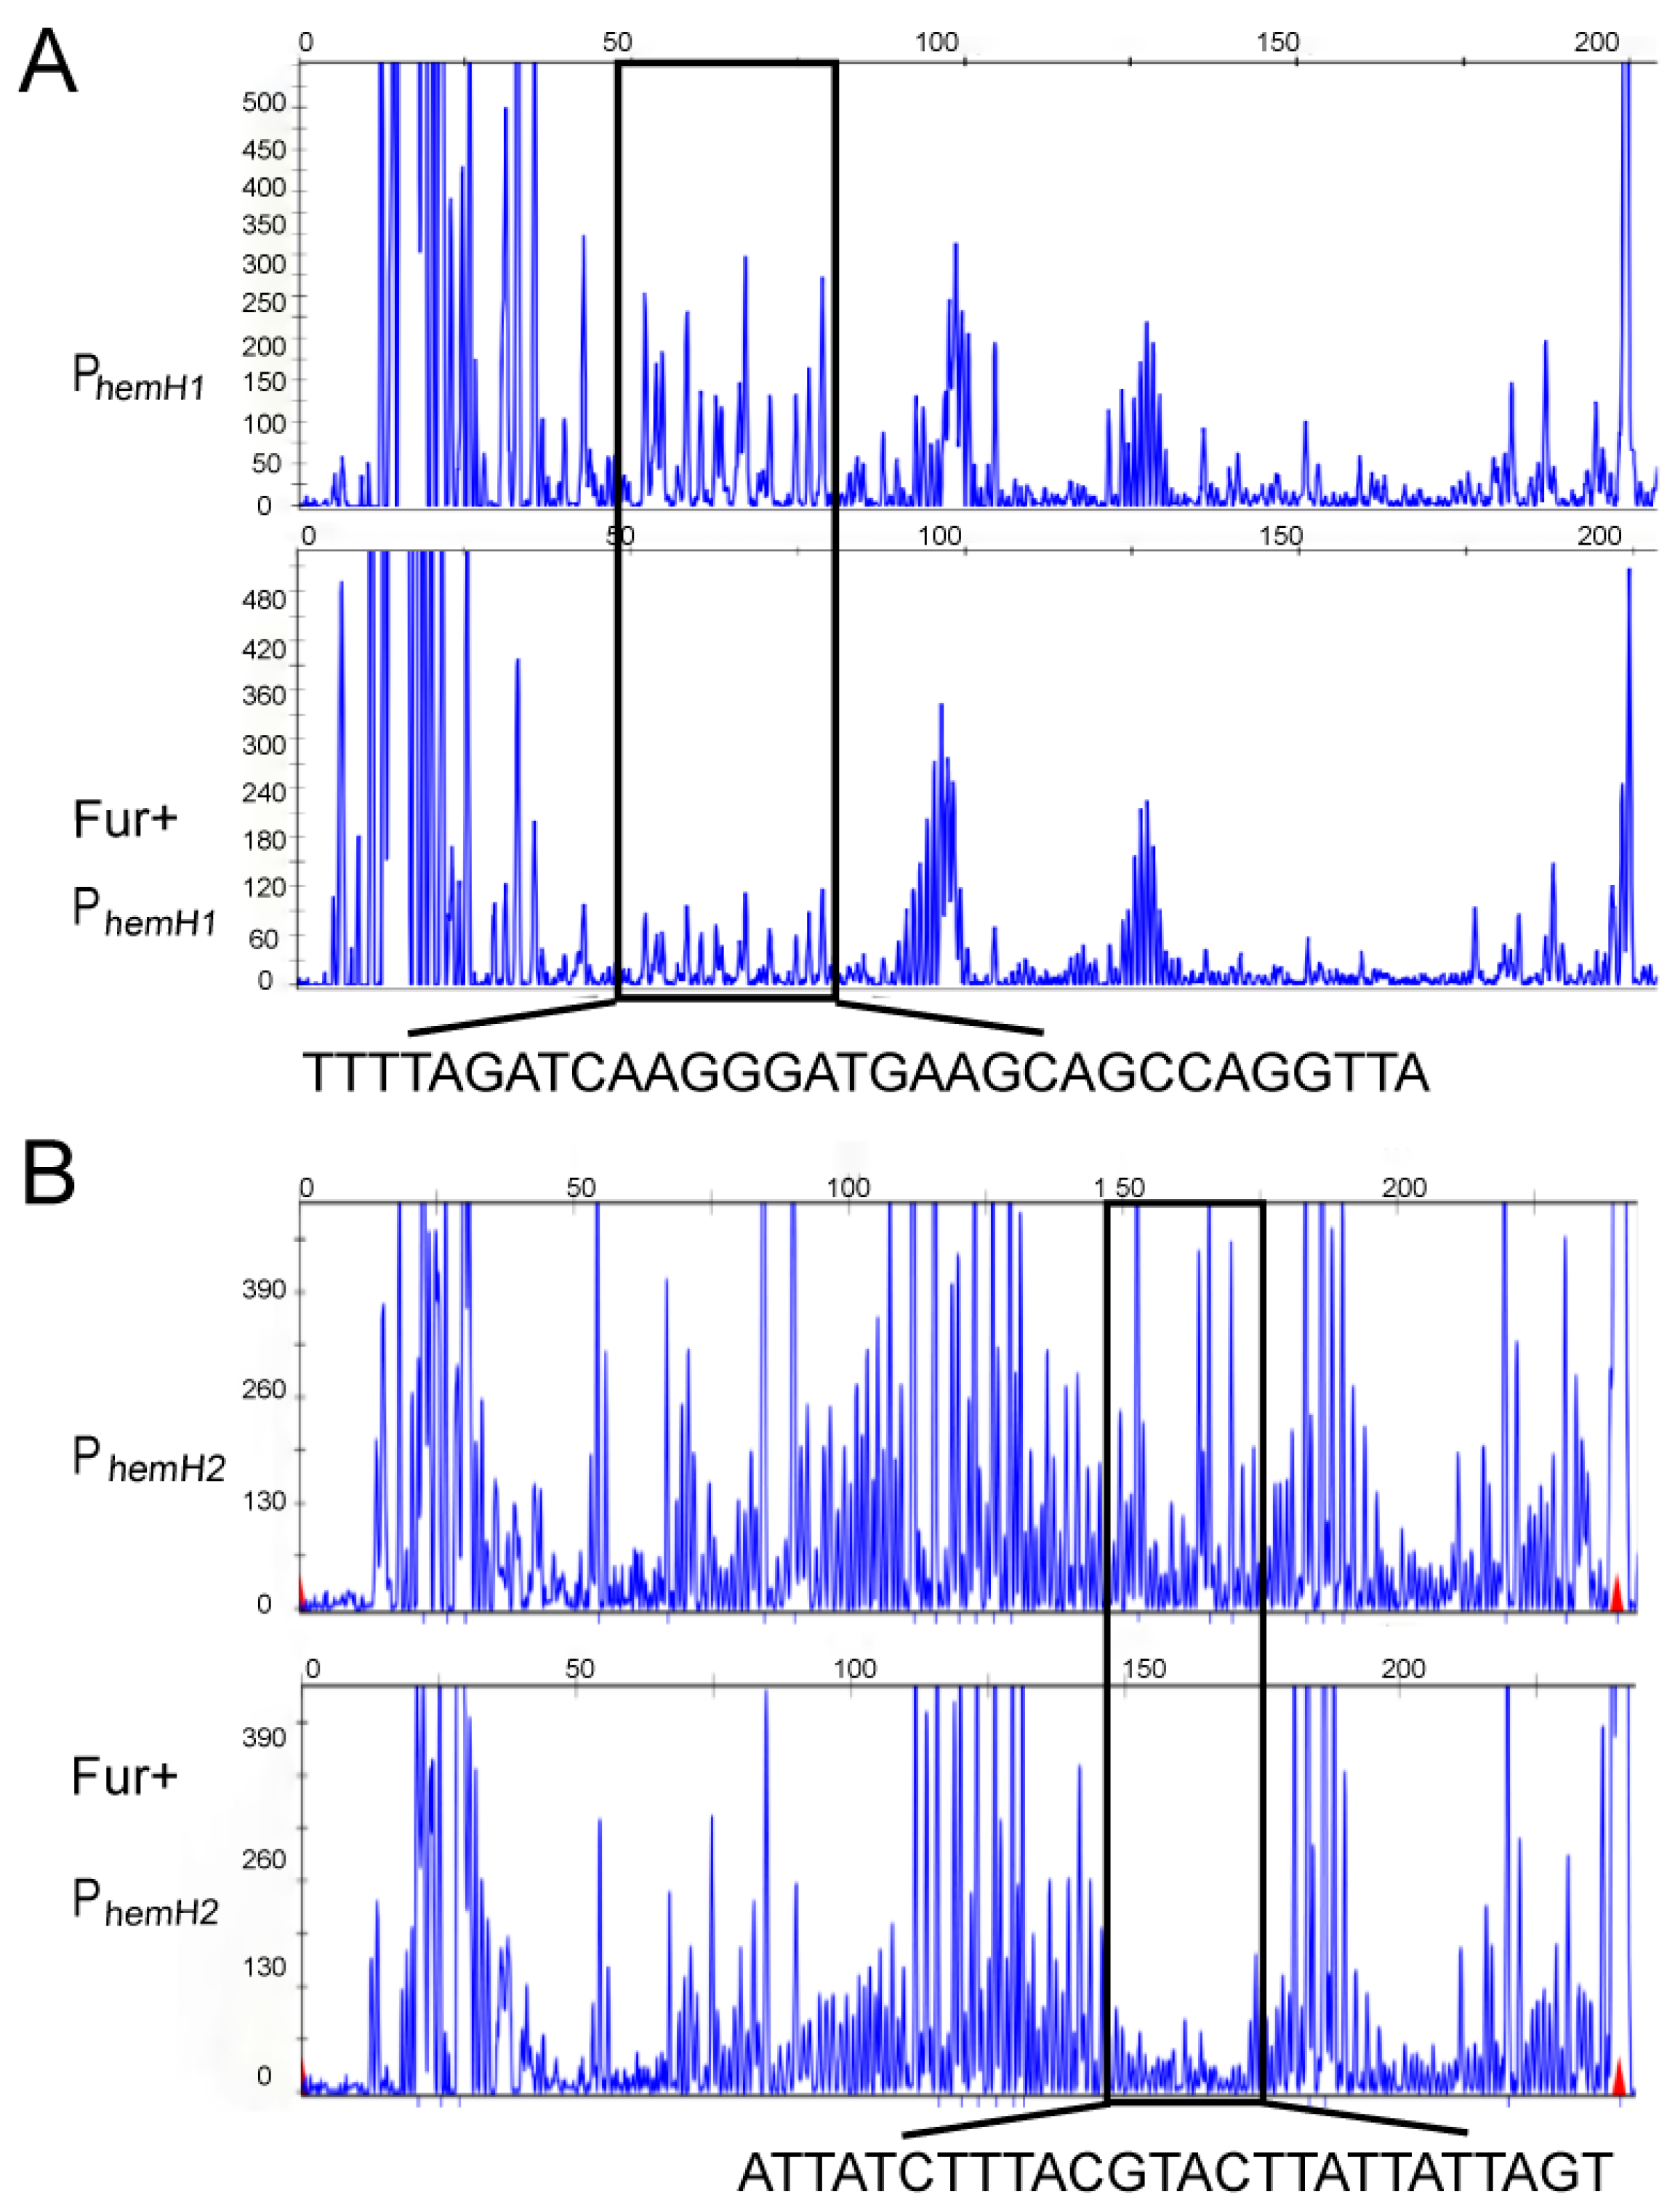
The DNase I footprinting assay showed that the binding region between Fur and the PhemH1 promoter DNA was located at 50–80 bp of the PhemH1 promoter DNA fragment (Figure 7A), with the specific sequence being TTTTAGATCAAGGGATGAAGCAGCCAGGTTA. The confirmed binding sequence between Fur and the PhemH1 promoter partially overlaps with the previously predicted Fur box (GGTTATATCTT) in the PhemH1 promoter fragment (the overlap is indicated by the underline), located right at the front of the predicted Fur box. The binding region of PhemH2 promoter DNA with Fur was located at the 150–175 bp of the PhemH2 promoter (Figure 7B), with the specific sequence being ATTATCTTTACGTACTTATTATTAGT. The confirmed binding sequence between Fur and the PhemH2 promoter overlaps partially with the previously predicted Fur box (AGAATAATTATC) in the PhemH2 promoter fragment (the overlap is indicated by the underline), located just after the predicted Fur box.

2.7. The Regulation Mode of Fur on hemH1 and hemH2 and Its Influence by Fe3+

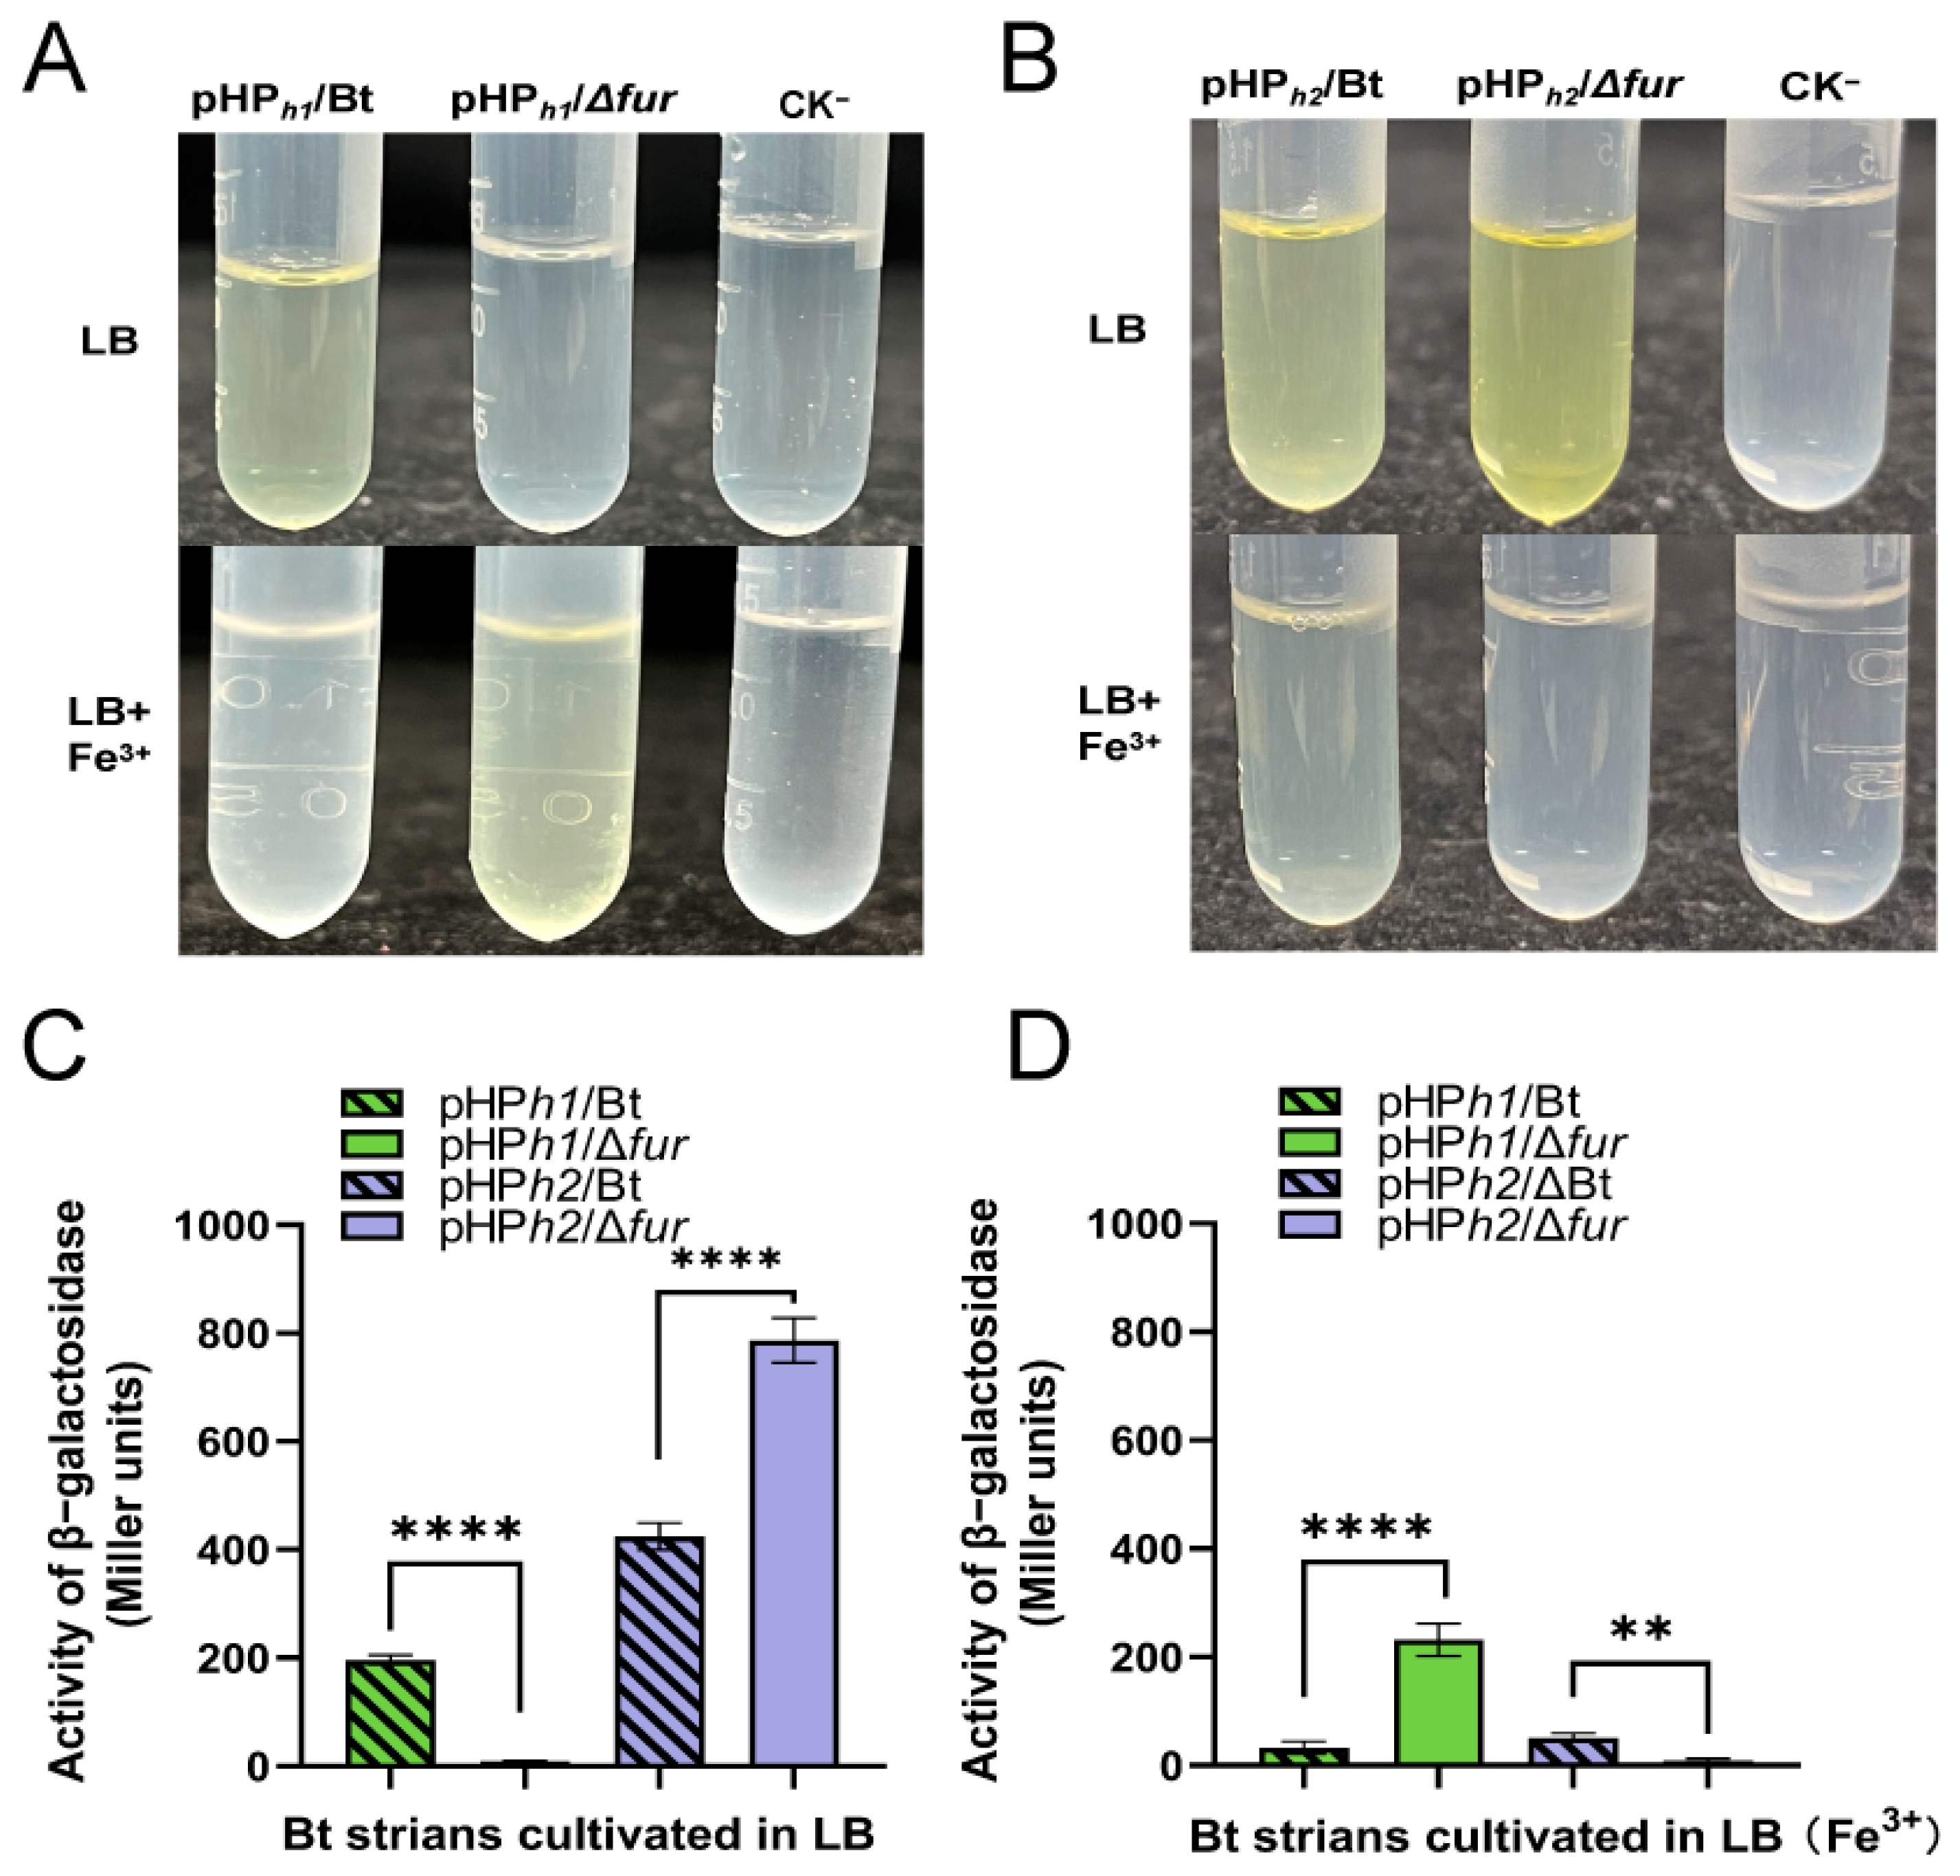
The β-galactosidase activity assay revealed that in LB medium, the activity of β-galactosidase in pHPh1/Bt was higher than that in pHPh1fur, indicating that Fur in pHPh1/Bt could bind to PhemH1, thereby activating the expression of the downstream reporter gene lacZ. However, in LB medium supplemented with 2.5 mM Fe3+, the β-galactosidase activity of pHPh1/Bt (44.81 M.U.) was significantly lower than that of pHPh1fur (275.72 M.U.) (Figure 8A). Furthermore, in LB medium containing 2.5 mM Fe2+, no β-galactosidase activity was detected in either pHPh1/Bt or pHPh1fur (Figure S3). These results suggest that in the presence of Fe3+, Fur in pHPh1/Bt binds to PhemH1, partially repressing or downregulating the expression of the downstream gene lacZ. In contrast, in the presence of Fe2+, the expression of the downstream reporter gene is completely repressed.
The pHPh2/Bt and pHPh2fur strains were cultured in LB medium supplemented with 2.5 mM Fe2+ or 2.5 mM Fe3+ for 8 h to measure β-galactosidase activity. At the 21 min mark of the reaction, the samples of pHPh2/Bt and pHPh2fur without Fe3+ turned yellow. The β-galactosidase activity of pHPh2/Bt was 438.12 M.U., while that of pHPh2fur was 786.73 M.U. After more than 2 h of reaction, a faint yellow color was observed in the pHPh2/Bt sample supplemented with Fe3+, with a β-galactosidase activity of 70.86 M.U. (Figure 8B). Additionally, in LB medium containing 2.5 mM Fe2+, no β-galactosidase activity was detected in either pHPh2/Bt or pHPh2fur (Figure S3). These experimental results demonstrate that in LB medium, the activity of PhemH2 in Bt 97-27 is lower than that in Δfur. In LB medium supplemented with Fe3+, the activity of PhemH2 in Bt 97-27 is higher than that in Δfur. However, in LB medium containing Fe2+, no activity of PhemH2 is detected in both Bt 97-27 and Δfur.

2.8. qRT-PCR Results

As shown in Figure 9, the fold changes in gene expression were normalized relative to a reference gene, with 16S rRNA used as the internal control and Bt 97-27 as the comparator. The qRT-PCR results revealed that, compared with Bt 97-27, the relative mRNA levels of nine heme-related genes in the ΔhemH2 strain were significantly upregulated, These included genes involved in heme biosynthesis and modification (hemX), heme uptake and catabolism (isdE, isdG), nitrogen metabolism in the heme synthesis pathway (asnA, asnB, gdhA, glnQ), heme detoxification and oxidative stress response (hmp), and heme-related signaling (nos). Notably, genes such as asnA, glnQ, and isdG exhibited particularly pronounced upregulation (Figure 9A).
Genes associated with the coproporphyrin-dependent heme synthesis pathway included those encoding ALA precursor synthesis (hemA, hemL1, hemL2, alaS1, alaS2, gltX), porphyrin backbone assembly (hemB, hemC, hemD), coproporphyrinogen modification (hemE, hemN1, hemN2), protoporphyrinogen oxidation (hemY1, hemY2), protoporphyrin IX iron chelation (hemH1, hemH2), and coproporphyrin branch regulation (chdC). Compared to Bt 97-27, the relative mRNA levels of 16 coproporphyrin-dependent heme synthesis pathway genes were significantly upregulated in the ΔhemH2 strain, with the exception of hemH2, which was not expressed. The top four most highly expressed genes were hemE, hemD, hemC, and hemN2 (Figure 9B).
In the ΔhemH2 strain, the relative mRNA levels of 17 oxidative stress-related genes were all significantly upregulated compared to Bt 97-27. These included catalase genes (katA, katB, katB2, katX, ahpC), peroxidase genes (tpx, bsA), superoxide dismutase genes (sodA1, sodA2, sodC, sodF, ohrA), DNA-binding protein genes (dps), heat shock protein genes (hslQ), and nitroreductase genes (BT9727-1760, BT9727-1785, BT9727-3172). Notably, genes such as katB2, BT9727-1785, BT9727-1760, sodC, hslO, and ohrA showed particularly strong upregulation. These findings suggest that hemH2 plays a critical role in antioxidant stress responses, and its deletion activates the relative expression of other oxidative stress-related genes (Figure 9C).
Regarding iron transport-related genes, including those encoding ferrous iron transporters (feoA1, feoA2, feoB1, feoB2, feoB3), iron–sulfur cluster carrier proteins (mrp1, mrp2), siderophore-related genes (glcF), and iron uptake regulatory proteins (fur, perR), the relative mRNA levels of all genes except feoB3 and glcF were significantly upregulated in the ΔhemH2 strain compared to Bt 97-27. Notably, genes encoding iron–sulfur cluster carrier proteins (mrp1, mrp2) and iron uptake regulatory proteins (fur) exhibited particularly strong upregulation (Figure 9D).

3. Discussion

3.1. The Sequence Analysis of Ferrochelatases from Different Strains

In Bt 97-27, we identified two ferrochelatases, HemH1 and HemH2, also known as CpfC1 and CpfC2. We first performed multiple-sequence alignment analyses of HemH1 and HemH2 with homologs from species containing one or two HemH enzymes (Figure S4). The selected species are either well characterized for HemH or represent typical model strains, including Gram-positive bacteria (Staphylococcus aureus, Streptococcus sp., Bacillus subtilis) [21,22,23] and Gram-negative bacteria (Escherichia coli BL21(DE3), Pseudomonas aeruginosa, Shewanella PV-4 and MR-1) [13,14,24,25]. These species have been extensively studied in the context of heme biosynthesis and iron metabolism, making them ideal comparators for sequence analysis. This study found a 63.5% sequence identity between HemH1 and HemH2 in Bt 97-27. HemH1 exhibited sequence similarities of 19.73%, 21.30%, 51.0%, 28.9%, 71.8%%, 21.3%, and 24.5% with the ferrochelatases of Shewanella loihica PV-4 (ABO23011), Shewanella oneidensis MR-1 (AAN55069.2), Staphylococcus aureus (ABD73483.1), Streptococcus (WP_023944239.1), Bacillus subtilis (SPY20679.1), Pseudomonas (WP_003171634.1), and E. coli BL21(DE3) (CAQ30948.1), respectively. Similarly, HemH2 showed sequence similarities of 21.1%, 22.2%, 46.3%, 30.0%, 58.9%, 16.2%, and 21.3% with the ferrochelatases of the same organisms, respectively. Generally, when sequence identity exceeds 65–80%, enzyme functions are highly conserved, with nearly identical catalytic mechanisms and substrate specificity. Although bacterial and mammalian ferrochelatases often exhibit low sequence identity (e.g., ~10% between humans and B. subtilis), their core regions retain similar secondary and tertiary structures [26]. Thus, HemH1 and HemH2 in Bt 97-27 likely retain the core ferrochelatase function shared across species, namely facilitating metal ion insertion into porphyrin to produce heme.
However, even among HemHs with divergent overall sequence identities, conservation of residues in catalytic active sites, substrate-binding pockets, or cofactor-binding regions may preserve the same substrate specificity and core catalytic mechanism, though catalytic efficiency or substrate preferences may vary [27]. Reports in the literature indicate that ferrochelatase catalytic rates (kcat) differ significantly across species, typically ranging from 0.11 to 15.3 min−1. Notably, S. aureus HemH exhibits a kcat of 165 min−1 when using coproporphyrin III and Fe2+ as substrates 28], while B. subtilis HemH shows conflicting kcat values of 78 min−1 [28] and 0.11 min−1 [29]. Furthermore, the catalytic function of B. subtilis HemH relies on cooperative interactions among residues such as Tyr13, His183, and Glu272. Mutations at these sites markedly alter metal specificity, catalytic efficiency, or substrate-binding capacity. For example, the Y13M mutation (tyrosine to methionine) shifts metal specificity, accelerating Co2+ insertion while abolishing Cu2+ utilization [22], and Glu272 mutation eliminates the Mg2+-mediated stimulation of Zn2+ insertion into deuteroporphyrin IX [23]. Therefore, the enzymatic function of HemH is not only influenced by sequence similarity, but also by other environmental factors such as co-factors, substrate concentration, enzyme stability and kinetic parameters.

3.2. The Effect of Different Concentrations of Dip, Fe2+, and Fe3+ on the Function of Ferrochelatases HemH1 and HemH2

Our research found that the functional differences between HemH1 and HemH2 are related to the levels of ferrous and ferric ions in the environment. The growth curve results of the recombinant E. coli strains indicated that the high expression of the ferrous chelator HemH2 promoted the growth of the recombinant strain pEH2/BL, while the high expression of HemH1 inhibited the growth of the recombinant strain pEH1/BL. However, under appropriate iron-limiting conditions (≤0.1 mM Dip), the growth of the recombinant strain pEH1/BL was somewhat inhibited, while the growth of the recombinant strain pEH2/BL was not affected, but under extremely iron-limiting conditions, the growth of both strains is affected. Similarly, under extreme iron restriction conditions, the growth of Bt 97-27, the empty vector strain pH/Bt, and the knockout strain ΔhemH2 was also inhibited. This may have been because under iron-deficient conditions, the iron content within microorganisms decreases, leading to reduced enzyme activity necessary for the synthesis of DNA, RNA, and proteins, thereby limiting microbial growth and reproduction. Li also reported that in LB medium supplemented with Dip, the intracellular iron levels in bacterial strains were significantly reduced, resulting in a marked inhibition of growth [30,31]. Under low concentrations of Fe2+ (≤0.5 mM) or Fe3+ (≤0.25 mM), the growth of recombinant strains pEH1/BL and pEH2/BL was promoted to some extent, which is consistent with literature reports that low concentrations of iron could promote bacterial growth and reproduction [32]; however, supplementing with high concentrations of Fe2+ (1 mM) or Fe3+ (≥0.5 mM) had no effect or even had a promoting effect on the growth of recombinant strain pEH2/BL, but it inhibited the growth of recombinant strain pEH1/BL. This might be because the high concentration of iron ions triggered the Fenton reaction in pEH1/BL, causing toxicity to the strain [33]. Therefore, within an appropriate range, whether in iron-deficient or iron-rich (Fe2+ or Fe3+) environments, the expression of HemH2 significantly enhances the growth and tolerance of the recombinant strain pEH2/BL.
Ferrochelatase is a crucial enzyme in heme biosynthesis. However, in our heme synthesis experiments, the heterologous expression of both HemH1 and HemH2 led to a reduction in heme production in E. coli. Studies have shown that overexpression of the hemH gene in E. coli does not increase heme synthesis but instead suppresses it [29]. Similarly, Kwon et al. reported that heterologous expression of the hemH gene from Bacillus subtilis in E. coli failed to enhance heme production [34]. Additionally, Franken et al. observed no significant increase in heme synthesis when overexpressing the hemH gene in Aspergillus niger [35]. It is hypothesized that the hemH gene may be subject to post-transcriptional feedback regulation, resulting in reduced ferrochelatase activity and, consequently, an inability to effectively increase heme yield.
Iron, as a cofactor for ferrochelatase, is crucial for the enzyme’s activity and function. Consequently, iron limitation or excess can also affect the production of heme synthesis precursors, such as ALA, and heme itself in recombinant strains. Under iron-limited conditions, the ALA production in the host strain BL21(DE3) increased, while it decreased in the recombinant strains pEH1/BL and pEH2/BL. This observation aligned with findings by Li et al., who reported a decrease in ALA production under Dip iron-limited conditions after overexpressing ferrochelatase in E. coli [31]. The reduction in ALA precursors in pEH1/BL and pEH2/BL might be attributed to the expression of ferrochelatases HemH1 and HemH2 under iron-limited conditions, which promoted the conversion of ALA to downstream heme, thereby preventing the cytotoxic accumulation of ALA and ensuring normal heme synthesis in E. coli. Under iron-limited conditions, heme production in pEH2/BL decreased sharply, while the decline in pEH1/BL was more gradual. In contrast, in the presence of 0.1 mM Fe2+ or 0.025 mM Fe3+, heme production in pEH1/BL decreased, whereas it remained stable or increased in pEH2/BL. Hobbs et al. found that adding 0.3–0.7 μL of Fe2+ significantly increased the Km value of ferrochelatase in Staphylococcus aureus, suggesting that elevated iron concentrations enhance the Km value of coproporphyrin III [27]. Similarly, Li et al., reported that the addition of 0.1 mM FeSO4 significantly reduced the accumulation of ALA while increasing heme accumulation, which aligns with our findings [36]. Furthermore, Wang et al. demonstrated that exogenous addition of 100 μmol/L Fe2+ effectively converted PPIX into heme, increasing the heme content to 29.44 μmol/g-DCW, compared to conditions without exogenous Fe2+. Similarly, the addition of 25 μmol/L Fe3+ also significantly enhanced heme production, reaching a concentration of 38.22 μmol/g-DCW [37]. These results indicate that under iron-limited conditions, ferrochelatase HemH1 plays a critical role in heme synthesis, whereas HemH2 becomes more important under iron-replete conditions.
Knocking out hemH2 in Bt 97-27 upregulated the expression of genes involved in heme synthesis, particularly hemE, hemD, and hemC, suggesting that the knockout of hemH2 most significantly affected the process from porphobilinogen to coproporphyrinogen III in the heme biosynthesis pathway. Additionally, the genes encoding asparagine synthetase (asnA) and glutamine transporter (glnQ), both critical for ALA synthesis, were significantly upregulated. This indicates that hemH2 knockout also impacts the production of the heme precursor ALA. In Riemerella anatipestifer, knockout of the hemH gene leads to a deficiency in heme required for respiratory processes, significantly impairing respiratory function. This heme deficiency not only affects metabolic activities and the tricarboxylic acid cycle but also upregulates the expression of genes encoding heme-binding proteins [38].

3.3. The Role of hemH1 and hemH2 in Antioxidant Stress

The H2O2 sensitivity experiment found that among the E. coli strains, the recombinant strain pEH1/BL was the most tolerant to H2O2, followed by the empty vector strain pE/BL, the recombinant strain pEH2/BL, and the host strain BL21(DE3). This indicates that the expression of ferrochelatase HemH1 can significantly enhance the ability of the recombinant strain pEH1/BL to resist H2O2, whereas the expression of HemH2 does not improve the resistance of the recombinant strain pEH2/BL to H2O2. In Bt, compared with the wild-type strain Bt 97-27 and the empty vector strain pH/Bt, the overexpressed strain pHH2/Bt was the most tolerant to H2O2, while ΔhemH2 was the most sensitive to H2O2, indicating that HemH2 played an important role in the oxidative stress response of Bt. Through sequence analysis, we found that the downstream gene of the hemH2 gene in the Bt 97-27 strain was the catalase katB gene. Catalase can decompose H2O2 into water and oxygen, protecting cells from the toxic effects of H2O2 [39]. To verify whether the oxidative stress capacity of the hemH2 gene was related to the function of the katB gene, we designed primers katB-1151580, hemH-1150700, and hemH-1151000 within the katB gene and the hemH2 gene. The PCR amplification and sequencing results indicate that the hemH2 gene and the downstream katB gene are co-transcribed in the Bt 97-27 strain (Figure S5A,B). Therefore, knocking out the hemH2 gene may affect the transcription of the downstream katB gene. The transcription of the gene therefore makes the ΔhemH2 knockout strain most sensitive to H2O2 stress. In fact, after knocking out the katB gene, we indeed found that the ΔkatB strain was less tolerant to H2O2 than the ΔhemH2 strain (Figure S5C).
After complementing the hemH1 or hemH2 gene in ΔhemH2, both pHH1/Δh2 and pHH2/Δh2 could partially restore the ability to resist H2O2, indicating that HemH1 and HemH2 played a protective role in the strain’s defense against H2O2 damage, and there is a compensatory mechanism between the two in resisting oxidative stress damage. Dai found that there were also two ferrochelatases in Shewanella sp. PV-4, with the encoded gene hemH1 playing a more crucial role in the oxidative stress response, while hemH2 might serve as a backup to maintain heme dynamic balance [13]. Under normal growth conditions, hemH1 is a dominant gene, and when it is absent, hemH2 can serve as a substitute [14].
This compensatory phenomenon was confirmed by qRT-PCR results. After knocking out hemH2, in addition to the upregulation of hemH1 gene expression, the expression of other antioxidant system related genes was also upregulated to compensate for the loss of the antioxidant stress function of the hemH2 gene, thereby reducing oxidative damage to the strain. Among the four catalase genes detected, katA, katB, katB2, and katX, the relative expression level of katB2 was the highest, rather than the katB gene downstream of hemH2. This indicates that the expression of the katB gene is not entirely influenced by the upstream hemH2 gene; it has its own independent promoter and can still participate in antioxidant activity even after hemH2 knockout. Superoxide dismutase (SOD) is an antioxidant enzyme that contains metal ions (such as Cu/Zn, Mn, Fe). Its main function is to catalyze the conversion of superoxide anions (O2−) into oxygen and more stable H2O2 [40,41]. This study found that among the four genes, sodA1, sodA2, sodF, and sodC, the relative expression level of sodC was the highest. Nitro reductase belongs to the flavoprotein family and can directly or indirectly eliminate ROS, protecting cells from oxidative damage, or it can indirectly affect the activity of antioxidant enzymes (such as SOD and catalase) by regulating the ratio of NAD(P)H/NAD(P)+ [42]. This study found that among the nitro-reductase family protein genes BT9727_1760, BT9727_1785, and BT9727_3172, the relative expression levels of BT9727_1760 and BT9727_1785 were both relatively high.

3.4. Differential Regulatory Mechanisms of Fur on hemH1 and hemH2

Fur is a global transcriptional regulator present in the vast majority of bacteria which uses Fe2+ as a cofactor to maintain iron homeostasis within bacteria by regulating iron uptake and storage systems. Studies have confirmed that Fur can participate in the Fe2+ transport and the heme synthesis pathway [43,44], but there are very few reports on the regulation of hemH1 and hemH2 by Fur. This study first verified through EMSA experiments that Fur could indeed bind to the promoters of hemH1 and hemH2, and the increase of Fe2+ and Fe3+ concentrations promoted the binding of Fur to PhemH1 and PhemH2. Next, through DNase I footprinting experiments, the identified binding sequences were basically aligned with the predicted Fur boxes positions, but the sequences of Fur boxes were not the same. Although the Fur box is usually considered one of the key criteria for determining whether a gene is regulated by Fur, in bacteria, the DNA sequences actually recognized by Fur exhibit a certain degree of conservation and varying levels of diversity [45,46]. For example, a study in 2014 on E. coli demonstrated that Fur bound to the different DNA sequences when activating or repressing target genes [47]. Additionally, in the case of Griffithsia sp., the crystal structure of the complex formed by Fur binding to the DNA of the feo AB1 promoter region (an atypical Fur box sequence) has also been discovered [48]. These findings indicate that the DNA sequences actually bound by Fur are more diverse and complex than the known Fur boxes box is more diverse and complex.
When Fur binds to the DNA of target genes, it can inhibit or activate the expression of certain genes. In this study, β-galactosidase activity assays revealed that under normal conditions (LB), Fur exhibited a positive regulatory mode on hemH1 and a negative regulatory mode on hemH2. However, in the presence of 2.5 mM Fe3+, Fur exhibited a negative regulatory mode on hemH1 and a positive regulatory mode on hemH2 (Figure 10). Studies have shown that in the presence of sufficient iron content, the apo-Fur protein undergoes structural changes, transforming into the holo-Fur dimer form, which tightly binds to the promoter region of the target gene. This binding creates spatial hindrance that inhibits RNA polymerase, thereby suppressing the transcriptional activity of iron uptake-related genes. In an iron-deficient environment, Fur protein cannot effectively bind to the target gene region, leading to the restoration of the previously suppressed transcriptional activity of iron uptake genes, further enhancing the bacteria’s efficiency in iron absorption [48,49]. However, in the presence of 2.5 mM Fe2+, the β-galactosidase activity of these Bt reporter strains was not detected in this study, indicating that the hemH1 and hemH2 genes could not be expressed in environments rich in Fe2+ (Figure S3). It is speculated that the high iron ion concentration repression mechanism of holo-Fur may have been activated, meaning that when the iron ion concentration inside the bacteria is too high or reaches equilibrium, Fur will bind with Fe2+, acting as an inhibitor and attaching to the promoter region of the target gene. This binding hinders RNA polymerase from binding to the target gene, thereby inhibiting the expression of the target gene [16].
Although our study has elucidated the functional divergence between HemH1 and HemH2, numerous details remain to be explored. For instance, the precise molecular mechanism underlying the iron-mediated differential regulation of HemH1 and HemH2 remains unclear. Furthermore, the regulatory networks governing hemH1 and hemH2 expression under varying iron conditions warrant systematic investigation through integrated transcriptomic and proteomic analyses. Such comprehensive approaches would provide valuable insights into the complex regulatory mechanisms controlling porphyrin biosynthesis homeostasis.

4. Materials and Methods

4.1. Strains, Plasmids, and Culture Conditions

E. coli and Bacillus thuringiensis (Bt 97-27) were cultured in Luria–Bertani medium [50]. E. coli was cultured at 37 °C and 200 rpm, while Bacillus thuringiensis was cultured at 28 °C and 200 rpm. The bacterial strains and plasmids used in this study are listed in Table S1.

4.2. Construction of E. coli Recombinant Strains Expressing fur and hemH

Using Bt 97-27 genomic DNA as a template, the fur gene was amplified by PCR with the primer pair fur-F (BamH I) and fur-R (Xho I); the hemH1 gene was amplified with the primer pair hemH1-F (Nco I) and hemH1-R (Xho I); and the hemH2 gene was amplified with the primer pair hemH2-F (Nco I) and hemH2-R (Xho I). The oligonucleotide primers used in this study are listed in Table S2. The above PCR products were digested with corresponding restriction endonucleases (Takara, Beijing, China), and then ligated with T4 DNA Ligase (Thermo Scientific, Waltham, MA, USA) to the linearized pET28b plasmid. The connected product was then transformed into E. coli BL21(DE3) to obtain the pEF/BL recombinant strains of fur (Figure S6), pEH1/BL recombinant strains of hemH1 (Figure S7), and pEH2/BL recombinant strains of hemH1 (Figure S8). After PCR validation and sequencing, we transferred the E. coli recombinant strains to LB medium containing 100 mg/mL Kanamycin (Kan) and cultured it at 37 °C at 200 rpm, respectively. When the OD600 of the bacterial cells reached 0.6–0.8, 0.25 mM IPTG was added and cultivated at 28 °C for 12–16 h to induce the expression of the recombinant proteins. The Ni-NTA method was used to purify the recombinant protein Fur [51,52].

4.3. Construction of hemH Knockout, Overexpression, and Complementation Strains

The markerless gene deletion system was successfully developed for Bt 97-27 based on an I-SceI-mediated replacement method as established in B. anthracis by Janes and Stibitz (2006) [53]. The detailed procedures have been well described in a previous publication [52,54]. We used primers hemH2-UF (Kpn I), hemH2-UR, hemH2-DF and hemH2-DR (Mlu I) (see Table S2) to amplify the sequences of the upstream and downstream arms of the hemH2 gene; these were amplified separately. Next, the overlapping extension PCR technique was used to synthesize the upstream and downstream sequences of the hemH2 gene, namely the UD sequence. Then, the UD fragment was digested with the corresponding restriction endonucleases, and then ligated into the linearized pRP1028 plasmid using T4 DNA Ligase to construct the hemH2 gene knockout plasmid pRP1028-hemH2-UD. This plasmid was then transformed into E. coli DH5α to obtain the pRH2/DH strain (see Figure S9). Using a triparental mating system containing pRH2/DH (donor strain), DH5α containing the helper plasmid pSS1827 (helper strain) and Bt 97-27 (recipient strain) was used to form the pRH2/DH plasmid-integrated Bt 97-27 strain by homologous single cross-over recombination. The I-Sce I endonuclease resulted in a chromosomal double-stranded break and thus stimulated host genetic repair by homologous recombination between the flanking repeat sequences [44,55]. Positive deletion strains of hemH2 were verified by PCR and sequencing, which obtained the hemH2 gene knockout strain (∆hemH2). Deletion of fur was performed using the same method.
We used primers OEhemH2-F (EcoR I) and OEhemH2-R (Hind III) for PCR to amplify the hemH2 gene (Table S2). Then, double digestion of the pHT315 plasmid and hemH2 gene fragment with EcoR I and Hind III, followed by ligation with T4 DNA Ligase, occurred. The constructed pHT315-hemH2 overexpression plasmid was then electroporated into Bt 97-27 to obtain the hemH2 overexpression strain (pHH2/Bt) (Figure S10A,B). Using the same method, the recombinant plasmid pHT315-hemH1 was also constructed (Figure S10C). The electroporator (Bio-Rad, Gene Pulser Xcell™) parameters were as follows: voltage, 2300 V; capacitance, 25 μF; resistance, 200 Ω; cuvette, 1 mm.
The correctly sequenced recombinant plasmids pHT315-hemH1 and pHT315-hemH2 were electroporated into ∆hemH2 competent cells, resulting in two complemented strains of the ∆hemH2 strain, pHH1/∆h2 and pHH2/∆h2. All the aforementioned Bt strains were cultured in LB at 28 °C, with pHH2/Bt, pHH1/Δh2, and pHH2/Δh2 strains requiring the addition of erythromycin (Ery) at a final concentration of 25 μg/mL.

4.4. Determination of the Growth Curve of the Strain

This study explored the effects of different iron-rich and iron-limited conditions on the growth of the E. coli host strain BL21(DE3), the empty vector strain pE/BL, and the recombinant strains pEH1/BL and pEH2/BL. We set the Dip concentrations to 0, 0.05, 0.1, and 0.2 mM; set the Fe2+ concentrations to 0, 0.25, 0.5, and 1 mM; and set the Fe3+ concentrations to 0, 0.25, 0.5, and 1 mM. After overnight activation of the above strains at 37 °C, we transferred them to LB medium at a concentration of 1% of inoculum (adding 50 μg/mL Kan, if necessary). The recombinant strains also required the addition of 0.2 mM IPTG when the OD600 was approximately 0.6–0.8 (about 2 h). We recorded the initial OD600 value as 0 h, took samples every 2 h to measure the OD600, and continuously monitored them for 12 h. All growth curve assays were performed with triplicate technical replicates for each treatment group, which underwent batch-to-batch validation.
At the same time, the effects of different iron-limiting conditions on Bt 97-27, the knockout strain ΔhemH2, the empty vector strain pH/Bt, the overexpression strain pHH2/Bt, and the complemented strains pHH1/Δh2 and pHH2/Δh2 were also explored. The aforementioned strains were transferred to 100 mL of LB medium (adding 25 μg/mL Ery, if necessary) at an initial OD600 of 0.01, followed by the addition of different concentrations of Dip, and cultivated at 28 °C. For the first 24 h, the OD600 was measured every 2 h, and then measured every 24 h for seven days.

4.5. H2O2 Tolerance Experiment

After transferring the activated E. coli BL21(DE3), empty strain pE/BL, and recombinant vector strains pEH1/BL and pEH2/BL in a certain proportion to LB medium (adding 50 μg/mL Kan, if necessary), they were cultured at 37 °C, 200 rpm until OD600 = 0.6. After diluting it in a 10−1 to 10−4 gradient, 3 μL of the above bacterial solution was taken and spotted onto solid LB plates containing 0, 0.25, 0.5, and 1 mM H2O2 respectively, The growth of the strains was observed after culturing at 37 °C for 12 h.
We transferred the activated Bt 97-27, knockout strain ΔhemH2, empty vector strain pH/Bt, overexpression strain pHH2/Bt, complemented strain pHH1/Δh2, and pHH2/Δh2 in a certain ratio, and cultured them at 28 °C, 200 rpm until OD600 = 0.6. After diluting in a 10−1 to 10−4 gradient, we took 3 μL of the above bacterial solution and spotted it on solid LB plates containing different concentrations of H2O2 (0–4 mM). We observed the growth of the strains after culturing them at 28 °C for 12 h.

4.6. Determination of Heme and 5-Aminolevulinic Acid Concentrations

The activated E. coli BL21(DE3), empty vector strain pE/BL, and recombinant strains pEH1/BL and pEH2/BL were individually transferred in specific proportions to LB medium containing 0.1 mM Fe2+, 0.025 mM Fe3+, and 0.2 mM Dip, and cultured at 37 °C, 200 r/min. Among them, when the recombinant strains pEH1/BL and pEH2/BL were cultured to OD600 ≈ 0.6 (approximately 2 h), 0.2 mM IPTG was added and induced for 5 h. We took a certain amount of each bacterial sample, centrifuged it at 4 °C, 8000× g for 1 min, and then discarded the supernatant. We added 500 μL of 20 mM oxalic acid solution to suspend the cells, and let them stand in the dark at 4 °C for 16 h. Then, we added 500 μL of 2 M oxalic acid solution and mixed it thoroughly. We took half of the sample and heated it at 95 °C for 30 min to fully react hemin with oxalic acid and convert it into porphyrin; we placed the other half of the sample reacting at room temperature as a control group. Then, we centrifuged it at 6000× g for 5 min, took 200 μL of the supernatant and added it to a black 96-well plate to measure the fluorescence value (Arbitrary Units), with the excitation wavelength set at 400 nm and the emission wavelength set at 620 nm. We calculated the heme content according to the standard curve of heme and fluorescence values [56].
We transferred the above four strains of E. coli to LB medium (adding 50 μg/mL Kan, if necessary) containing 0.2 mM Dip. Then, we investigated the content of 5-aminolevulinic acid (ALA), the heme synthesis precursor, under iron-limited conditions for each strain. We took an appropriate amount of each bacterial culture, and centrifuged it at 4 °C, 8000× g for 1 min. We added 500 μL of 2 M acetate buffer (pH 4.6) and 250 μL of 99% acetylacetone to the supernatant. We mixed this well and heated it at 100 °C for 15 min. After cooling, we added 1 mL of Ehrlich’s reagent (Solabio, China), reacted it for 20 min, and measured the ALA content at OD554 according to the ALA standard curve [57].

4.7. Gel Mobility Shift Assay (EMSA) and DNase I Footprinting Assay

Using Bt 97-27 genomic DNA as a template, primers PhemH1-F and PhemH1-R, and primers PhemH2-F and PhemH2-R were used to PCR amplify approximately 200 bp DNA fragments upstream of the hemH1 and hemH2 genes, which were used as the PhemH1 and PhemH2 promoter regions, respectively. The purified PhemH1 and PhemH2 promoter DNA fragments were incubated with different concentrations of Fur protein (0–0.05 mM) in EMSA buffer (50 mM Tris-HCl, pH 7.5; 10 mM MgCl2; 1 mM DTT; and 100 mM NaCl) at 25 °C for 30 min. Then, the mixed samples were subjected to electrophoresis through an 8% (w/v) native polyacrylamide gel in 0.5× Tris-borate-EDTA (TBE) buffer (0.044 M Tris base, 0.044 M boric acid, and 0.001 M EDTA, pH 8.0) to separate the protein–DNA complexes from the free DNA. The buffer was pre-run on ice at 80 V for 30 min and then electrophoresed at 150 V for 1 h. After staining with ethidium bromide, visualized bands were obtained through gel imager (BG-gdsAUTO 320) [46,48,52,53]
Further EMSA investigation was conducted on the effects of different concentrations of Fe2+ or Fe3+ (0, 0.0125, 0.025, and 0.01 mM), and Mn2+ (0, 0.125, 0.25, and 0.5 mM) on the binding of Fur protein (0.05 mM) to PhemH1 and PhemH2 promoter DNA fragments (0.001 mM). In addition, the non-transcriptional regulatory protein KatB (catalase) was selected as the negative control for the protein.
To investigate the binding sites of Fur with the PhemH1 and PhemH2 promoters, a DNase I footprinting experiment was conducted. First, fluorescently labeled primers PhemH1-F (FAM) and PhemH2-F (FAM) were synthesized (Sangon Biotech, Shanghai, China) (Table S2). We then synthesized the PhemH1 and PhemH2 promoter regions labeled with 5′-FAM by PCR amplification, and incubated the labeled promoter DNA fragments with Fur protein at 25 °C for 30 min to form the protein–DNA complex (described above for EMSA). Then, 5 U of DNase I (Takara, Shanghai, China) was added to the above reaction mixture and incubated at 25 °C for 1 min. Subsequently, 0.25 M EDTA was added to the mixture, and incubated in a 75 °C water bath for 15 min to terminate the reaction. The mixture was then sent to Qingke Sequencing Company for STR sequencing (Beijing, China). According to the sequencing profile analysis, the DNA regions bound by the Fur protein will be protected and cannot be degraded by DNase I, resulting in blank areas forming “footprints”. By comparing these regions with the negative control without Fur protein, the DNA sequence information of the promoters PhemH1 and PhemH2 binding to Fur can be obtained [55,56].

4.8. Determination of β-Galactosidase Activity

The PhemH1 and PhemH2 promoter DNA fragments were amplified using primers PhemH1-F (Nco I) and PhemH1-R (BamH I), and PhemH2-F (Nco I) and PhemH2-R (BamH I), respectively (Table S2). PhemH1 and PhemH2 were then double-digested with Nco I and BamH I, respectively, and then ligated into the linearized shuttle plasmid pHT1K-lacZ [51,52] to construct the recombinant plasmids pHT1K-lacZ-PhemH1 and pHT1K-lacZ-PhemH2 (Figure S11). The recombinant plasmids were separately electroporated into Bt 97-27 and Δfur competent cells to obtain four reporter strains for β-galactosidase activity assays: pHPh1/Bt, pHPh1fur, pHPh2/Bt, and pHPh2fur.
We transferred the four activated reporter strains to 50 mL of LB medium (containing 25 μg/mL Ery) at an initial OD600 concentration of 0.01, and cultured them at 28 °C, 200 rpm. When the strains reached the logarithmic growth phase, we took appropriate volumes of samples at intervals to measure the OD600, centrifuged them at 8000× g for 1 min, and discarded the supernatant. Subsequently, we added 5 mL of Z Buffer to resuspend the cells, sonicated the cell samples on ice, and started timing the reactions after adding 200 μL of ONPG to the treated samples. When a pale yellow reaction appeared, we immediately added 500 μL of Na2CO3 to stop the reaction and record the reaction time. We measured the absorbance of the sample at 420 and 550 nm, calculated the β-galactosidase activity, and expressed it in Miller units (M.U.) [58].

4.9. RNA Extraction and qRT-PCR Analysis

We activated the Bt 97-27 and ∆hemH2 strains overnight, transferred them at 1%, and incubated them at 28 °C, 200 rpm until the logarithmic growth phase was reached. We used a bacterial RNA extraction kit (Yisheng, Shanghai, China) to extract the total RNA of the Bt 97-27 and ∆hemH2 strains separately. The final total RNA was analyzed by 1% agarose gel electrophoresis and quantified by NanoDrop (Thermo Scientific, USA). We used Hifair III 1st Strand cDNA Synthesis SuperMix as the qPCR reverse transcription kit (Yeasen, Shanghai, China) to reverse-transcribe RNA into cDNA. Primers were designed using the Primer 5.0 tool and tested for unique binding by Primer-BLAST (Table S3). The gene transcription levels were quantified by real-time qRT-PCR (StepOnePlus Applied Biosystems, Carlsbad, CA, USA) relative to the transcription of reference gene 16S rRNA. We then analyzed the relative expression levels of the genes according to the 2−ΔΔCt method.

4.10. Bioinformatics and Statistical Analyses

Amino acid and nucleotide sequences were retrieved from the NCBI database using the BLAST search tool. The ClustalW2 (version 2.1) package (http://www.ebi.ac.uk/Tools/msa/clustalw2/ (accessed on 15 March 2025)) was used for amino acid and nucleotide sequence alignments. All the results data in this study are expressed as mean ± standard error (mean ± SE). Data were plotted and analyzed using GraphPad Prism 8.0 and SPSS 25.0. Statistical differences were firstly determined by one-way ANOVA then by Duncan’s post hoc tests. Among them, “ns” indicates p > 0.05, no statistical difference; p < 0.05 indicates a statistical difference. “*” indicates p < 0.05; “**” indicates p < 0.01; “***” indicates p < 0.001; “****” indicates p < 0.0001.

5. Conclusions

Bt 97-27 contains two ferrochelatases, HemH1 and HemH2, which exhibit different function and regulatory mechanisms under various environmental conditions (iron restriction, iron stress, and oxidative stress). Our results demonstrate that HemH2 promotes better growth of recombinant strains under both iron-limited and iron-rich conditions compared with HemH1. HemH1 primarily facilitates heme synthesis under iron-limited conditions by maintaining ALA precursor utilization, while HemH2 drives heme production under iron-replete conditions. Both HemH1 and HemH2 contribute to oxidative stress resistance, with HemH1 conferring greater tolerance to H2O2 in E. coli and Bt 97-27 In terms of bacterial growth, the recombinant strain pEH2/BL grows better than the recombinant strain pEH2/BL under both iron-limited and iron-rich conditions. hemH1 and hemH2 both contribute to antioxidant stress in E. coli and Bt. EMSA, DNase I footprinting, and β-galactosidase assays all confirmed that Fur can bind to the PhemH1 and PhemH2 promoter DNA, with Fe2+ or Fe3+ promoting this binding. Fur regulates hemH1 and hemH2 differently under various conditions, suggesting that their expression is jointly regulated by Fur and environmental factors. In summary, HemH1 and HemH2 work synergistically to maintain the physiological homeostasis of Bt 97-27 during bacterial growth, heme biosynthesis, iron concentration stress, and antioxidant stress.

Supplementary Materials

The following supporting information can be downloaded at: https://www.mdpi.com/article/10.3390/ijms26072911/s1.

Author Contributions

Conceptualization, J.W., Y.L., T.J. and J.S.; methodology, J.W.; software, J.W., S.L. and H.M.; validation, J.W., H.M., T.L. and Y.L.; formal analysis, J.W., Y.L. and T.L.; investigation, Y.L., J.W. and S.C.; resources, S.C., Q.Y. and S.L.; data curation, J.W. and J.S.; writing—original draft preparation, Y.L.; writing—review and editing, J.S., J.H. and J.W.; visualization, T.J. and H.M.; supervision, T.J.; project administration, J.S.; funding acquisition, J.S. All authors have read and agreed to the published version of the manuscript.

Funding

This research was financially supported by the National Natural Science Foundation of China (Grant No. 31800027), the open funds of Hubei Key Laboratory of Regional Development and Environmental (2019(A)002), the Key Project of Science and Technology Research Program of Hubei Educational Commission (D20211004), and the open funds of the State Key Laboratory of Agricultural Microbiology (AMLKF202004).

Institutional Review Board Statement

Not applicable.

Informed Consent Statement

Not applicable.

Data Availability Statement

All relevant data are within the manuscript and available from the authors upon request.

Conflicts of Interest

The authors declare no conflicts of interest.

References

  1. Layer, G. Heme biosynthesis in prokaryotes. Biochim. Biophys. Acta Mol. Cell Res. 2021, 1868, 118861. [Google Scholar] [CrossRef] [PubMed]
  2. Hamza, I. Intracellular trafficking of porphyrins. ACS Chem. Biol. 2006, 1, 627–629. [Google Scholar] [CrossRef]
  3. Möbius, K.; Arias-Cartin, R.; Breckau, D.; Hännig, A.-L.; Riedmann, K.; Biedendieck, R.; Schröder, S.; Becher, D.; Magalon, A.; Moser, J. Heme biosynthesis is coupled to electron transport chains for energy generation. Proc. Natl. Acad. Sci. USA 2010, 107, 10436–10441. [Google Scholar] [CrossRef] [PubMed]
  4. Chen, M.; Wang, Z.H.; Shu, J.X.; Jiang, X.H.; Wang, W.; Shi, Z.H.; Lin, Y.W. Mimicking a natural enzyme system: Cytochrome c oxidase-like activity of Cu2O nanoparticles by receiving electrons from cytochrome c. Inorg. Chem. 2017, 56, 9400–9403. [Google Scholar] [CrossRef]
  5. Richtová, J.; Sheiner, L.; Gruber, A.; Yang, S.M.; Kořený, L.; Striepen, B.; Oborník, M. Using diatom and apicomplexan models to study the heme pathway of Chromera velia. Int. J. Mol. Sci. 2021, 22, 6495. [Google Scholar] [CrossRef] [PubMed]
  6. Su, H.F.; Chen, X.L.; Chen, S.J.; Guo, M.Z.; Liu, H.L. Applications of the whole-cell system in the efficient biosynthesis of heme. Int. J. Mol. Sci. 2023, 24, 8384. [Google Scholar] [CrossRef]
  7. Revel, M.; Dimitrov, J.D. Methods for Assessment of Interactions of Proteins with Heme: Application for Complement Proteins and Immunoglobulins. Methods Mol. Biol. 2021, 2227, 227–236. [Google Scholar] [CrossRef]
  8. Jarzębski, M.; Wieruszewski, M.; Kościński, M.; Rogoziński, T.; Kobus-Cisowska, J.; Szablewski, T.; Perła-Kaján, J.; Waszkowiak, K.; Jakubowicz, J. Heme iron as potential iron fortifier for food application—Characterization by material techniques. Rev. Adv. Mater. Sci. 2023, 62, 20230128. [Google Scholar] [CrossRef]
  9. Yu, F.; Wang, Z.W.; Zhang, Z.H.; Zhou, J.W.; Li, J.H.; Chen, J.; Du, G.C.; Zhao, X.R. Biosynthesis, acquisition, regulation, and upcycling of heme: Recent advances. Crit. Rev. Biotechnol. 2024, 44, 1422–1438. [Google Scholar] [CrossRef]
  10. Dailey, H.A.; Medlock, A.E. A primer on heme biosynthesis. Biol. Chem. 2022, 403, 985–1003. [Google Scholar] [CrossRef]
  11. Videira, M.A.M.; Lobo, S.A.L.; Silva, L.S.O.; Palmer, D.; Warren, M.J.; Prieto, M.; Coutinho, A.; Sousa, F.L.; Fernandes, F.; Saraiva, L.M. Staphylococcus aureus haem biosynthesis and acquisition pathways are linked through haem monooxygenase IsdG. Mol. Microbiol. 2018, 109, 385–400. [Google Scholar] [CrossRef] [PubMed]
  12. Hernández, J.A.; López-Gomollón, S.; Bes, M.T.; Fillat, M.F.; Pelrato, M.L. Three fur homologues from Anabaena sp. PCC7120: Exploring reciprocal protein-promoter recognition. FEMS Microbiol. Lett. 2004, 236, 275–282. [Google Scholar] [CrossRef] [PubMed]
  13. Qiu, D.; Xie, M.; Dai, J.; An, W.; Wei, H.; Tian, C.; Kempher, M.L.; Zhou, A.; He, Z.; Gu, B.; et al. Differential regulation of the two ferrochelatase paralogues in Shewanella loihica PV-4 in response to environmental stresses. Appl. Environ. Microbiol. 2016, 82, 5077–5088. [Google Scholar] [CrossRef]
  14. Dai, J.; Liu, Y.; Liu, S.; Li, S.; Gao, N.; Wang, J.; Zhou, J.; Qiu, D. Differential gene content and gene expression for bacterial evolution and speciation of Shewanella in terms of biosynthesis of heme and heme-requiring proteins. BMC Microbiol. 2019, 19, 173. [Google Scholar] [CrossRef]
  15. Schauder, A.; Avital, A.; Malik, Z. Regulation and gene expression of heme synthesis under heavy metal exposure- review. J. Environ. Pathol. Tox. 2010, 29, 137–158. [Google Scholar] [CrossRef]
  16. Dutt, S.; Hamza, I.; Bartnikas, T.B. Molecular mechanisms of iron and heme metabolism. Annu. Rev. Nutr. 2022, 42, 311–335. [Google Scholar] [CrossRef]
  17. Fillat, M.F. The FUR (ferric uptake regulator) superfamily: Diversity and versatility of key transcriptional regulators. Arch. Biochem. Biophys. 2014, 546, 41–52. [Google Scholar] [CrossRef]
  18. Sarvan, S.; Butcher, J.; Stintzi, A.; Couture, J.F. Variation on a theme: Investigating the structural repertoires used by ferric uptake regulators to control gene expression. Biometals 2018, 31, 681–704. Available online: https://link.springer.com/article/10.1007/s10534-018-0120-8 (accessed on 16 July 2018).
  19. Troxell, B.; Hassan, H.M. Transcriptional regulation by ferric uptake regulator (Fur) in pathogenic bacteria. Front. Cell. Infect. Microbiol. 2013, 3, 59. [Google Scholar] [CrossRef]
  20. Troxell, B.; Sikes, M.L.; Fink, R.C.; Vazquez-Torres, A.; Jones-Carson, J.; Hassan, H.M. Fur negatively regulates hns and is required for the expression of hilA and virulence in Salmonella enterica serovar typhimurium. J. Bacteriol. 2011, 193, 497–505. [Google Scholar] [CrossRef]
  21. Dutter, B.F.; Mike, L.A.; Reid, P.R.; Chong, K.M.; Ramos-Hunter, S.J.; Skaar, E.P.; Sulikowski, G.A. Decoupling Activation of Heme Biosynthesis from Anaerobic Toxicity in a Molecule Active in Staphylococcus aureus. ACS Chem. Biol. 2016, 11, 1354–1361. [Google Scholar] [CrossRef]
  22. Hansson, M.D.; Karlberg, T.; Soderberg, C.A.G.; Rajan, S.; Warren, M.J.; Al-Karadaghi, S.; Rigby, S.E.J.; Hansson, M. Bacterial ferrochelatase turns human: Tyr13 determines the apparent metal specificity of Bacillus subtilis ferrochelatase. J. Biol. Inorg. Chem. 2011, 16, 235–242. [Google Scholar] [CrossRef] [PubMed]
  23. Lecerof, D.; Fodje, M.N.; Alvarez Leon, R.; Olsson, U.; Hansson, A.; Sigfridsson, E.; Ryde, U.; Hansson, M.; Al-Karadaghi, S. Metal binding to Bacillus subtilis ferrochelatase and interaction between metal sites. J. Biol. Inorg. Chem. 2003, 8, 452–458. [Google Scholar] [CrossRef] [PubMed]
  24. Nihei, C.; Nakayashiki, T.; Nakamura, K.; Inokuchi, H.; Gennis, R.B.; Kojima, S.; Kita, K. Abortive assembly of succinate-ubiquinone reductase (complex II) in a ferrochelatase-deficient mutant of Escherichia coli. Mol. Genet. Genom. 2001, 265, 394–404. [Google Scholar] [CrossRef]
  25. Glanville, D.G.; Mullineaux-Sanders, C.; Corcoran, C.J.; Burger, B.T.; Imam, S.; Donohue, T.J.; Ulijasz, A.T. A high-throughput method for identifying novel genes that influence metabolic pathways reveals new iron and heme regulation in Pseudomonas aeruginosa. mSystems 2021, 6, e00933-20. [Google Scholar] [CrossRef]
  26. Wu, C.K.; Dailey, H.A.; Rose, J.P.; Burden, A.; Sellers, V.M.; Wang, B.C. The 2.0 angstrom structure of human ferrochelatase, the terminal enzyme of heme biosynthesis. Nat. Struct. Biol. 2001, 8, 156–160. [Google Scholar] [CrossRef]
  27. Hobbs, C.; Reid, J.D.; Shepherd, M. The coproporphyrin ferrochelatase of Staphylococcus aureus: Mechanistic insights into a regulatory iron-binding site. Biochem. J. 2017, 474, 3513–3522. [Google Scholar] [CrossRef] [PubMed]
  28. Lobo, S.A.L.; Scott, A.; Videira, M.A.M.; Winpenny, D.; Gardner, M.; Palmer, M.J.; Schroeder, S.; Lawrence, A.D.; Parkinson, T.; Warren, M. Staphylococcus Aureus haem biosynthesis: Characterisation of the enzymes involved in final steps of the pathway. Mol. Microbiol. 2015, 97, 472–487. [Google Scholar] [CrossRef]
  29. Dailey, H.A.; Gerdes, S.; Dailey, T.A.; Burch, J.S.; Phillips, J.D. Noncanonical Coproporphyrin-Dependent Bacterial Heme Biosynthesis Pathway That Does Not Use Protoporphyrin. Proc. Natl. Acad. Sci. USA 2015, 112, 2210–2215. [Google Scholar] [CrossRef]
  30. Schaible, U.E.; Kaufmann, S.H.E. Iron and Microbial Infection. Nat. Rev. Microbiol. 2004, 2, 946–953. [Google Scholar] [CrossRef]
  31. Meng, L.; Lei, T. The effect of Fur overexpression on heme synthesis in Escherichia coli. Food Ferment. Ind. 2019, 45, 18–25. [Google Scholar] [CrossRef]
  32. Porcheron, G.; Dozois, C.M. Interplay between Iron Homeostasis and Virulence: Fur and ryhB as major regulators of bacterial pathogenicity. Vet. Microbiol. 2015, 179, 2–14. [Google Scholar] [CrossRef]
  33. Llamas, M.A.; Sánchez-Jiménez, A. Iron homeostasis in Pseudomonas Aeruginosa: Targeting iron acquisition and storage as an antimicrobial strategy. In Pseudomonas aeruginosa: Biology, Pathogenesis and Control Strategies; Filloux, A., Ramos, J.-L., Eds.; Springer International Publishing: Cham, Switzerland, 2022; pp. 29–68. ISBN 978-3-031-08491-1. [Google Scholar]
  34. Kwon, S.J.; de Boer, A.L.; Petri, R.; Schmidt-Dannert, C. High-level production of porphyrins in metabolically engineered Escherichia Coli: Systematic extension of a pathway assembled from overexpressed genes involved in heme biosynthesis. Appl. Environ. Microbiol. 2003, 69, 4875–4883. [Google Scholar] [CrossRef] [PubMed]
  35. Franken, C.; Werner, R.; Haas, H.; Lokman, C.; Hondel, A.; Ram, F.; Weert, S.; Punt, J. The role of coproporphyrinogen III oxidase and ferrochelatase genes in heme biosynthesis and regulation in Aspergillus niger. Appl. Microbiol. Biotechnol. 2013, 97, 9773–9785. [Google Scholar] [CrossRef] [PubMed]
  36. Li, F.; Wang, Y.; Gong, K.; Wang, Q.; Liang, Q.; Qi, Q. Constitutive expression of RyhB regulates the heme biosynthesis pathway and increases the 5-aminolevulinic acid accumulation in Escherichia coli. FEMS Microbiol. Lett. 2014, 350, 209–215. [Google Scholar] [CrossRef]
  37. Wang, Y.; Yang, Y.; Liu, Q.; Tang, L. Effects of genetic recombination and exogenous iron on heme synthesis in Escherichia coli. Microbiol. China 2023, 50, 3382–3391. [Google Scholar] [CrossRef]
  38. Wang, M.; Liu, M.; Cheng, A. Functional identification of hemH and transcriptomic analysis of hemH mutant of Riemerella anatipestifer. Acta Microbiol. Sin. 2023, 63, 3083–3095. [Google Scholar] [CrossRef]
  39. Yu, C.; Wang, N.; Wu, M.; Tian, F.; Chen, H.; Yang, F.; Yuan, X.; Yang, C.H.; He, C. OxyR-regulated catalase CatB promotes the virulence in rice via detoxifying hydrogen peroxide in Xanthomonas oryzae pv. oryzae. BMC Microbiol. 2016, 16, 269. [Google Scholar] [CrossRef]
  40. Chung, W.-H. Unraveling new functions of superoxide dismutase using yeast model system: Beyond its conventional role in superoxide radical scavenging. J. Microbiol. 2017, 55, 409–416. [Google Scholar] [CrossRef]
  41. Miller, A.-F. Superoxide dismutases: Active sites that save, but a protein that kills. Curr. Opin. Chem. Biol. 2004, 8, 162–168. [Google Scholar] [CrossRef]
  42. Zhou, Y.; Lv, H.; Li, H.; Li, J.; Yan, Y.; Liu, F.; Hao, W.; Zhou, Z.; Wang, P.; Zhou, S. Nitroreductase increases menadione-mediated oxidative stress in Aspergillus nidulans. Appl. Environ. Microbiol. 2021, 87, e01758-21. [Google Scholar] [CrossRef]
  43. Ma, Y.; Song, N. Advances in research on a bacterial ferric uptake regulator. J. Pathog. Biol. 2021, 16, 117–121. Available online: https://www.cabidigitallibrary.org/doi/full/10.5555/20230424000 (accessed on 1 January 2021).
  44. Michener, J.K.; Nielsen, J.; Smolke, C.D. Identification and Treatment of Heme Depletion Attributed to Overexpression of a Lineage of Evolved P450 Monooxygenases. Proc. Natl. Acad. Sci. USA 2012, 109, 19504–19509. [Google Scholar] [CrossRef] [PubMed]
  45. Yu, C.; Lopez, C.A.; Hu, H.; Xia, Y.; Freedman, D.S.; Reddington, A.P.; Daaboul, G.G.; Unlü, M.S.; Genco, C.A. A high-throughput method to examine protein-nucleotide interactions identifies targets of the bacterial transcriptional regulatory protein Fur. PLoS ONE 2014, 9, e96832. [Google Scholar] [CrossRef]
  46. Baichoo, N.; Helmann, J.D. Recognition of DNA by Fur: A reinterpretation of the Fur box consensus sequence. J. Bacteriol. 2002, 184, 5826–5832. [Google Scholar] [CrossRef]
  47. Seo, S.W.; Kim, D.; Latif, H.; O’Brien, E.J.; Szubin, R.; Palsson, B.O. Deciphering Fur transcriptional regulatory network highlights its complex role beyond iron metabolism in Escherichia coli. Nat. Commun. 2014, 5, 4910. [Google Scholar] [CrossRef]
  48. Deng, Z.; Wang, Q.; Liu, Z.; Zhang, M.; Machado, A.C.D.; Chiu, T.-P.; Feng, C.; Zhang, Q.; Yu, L.; Qi, L.; et al. Mechanistic insights into metal ion activation and operator recognition by the ferric uptake regulator. Nat. Commun. 2015, 6, 7642. [Google Scholar] [CrossRef]
  49. Su, J.; Li, Z.; Liao, B. Microcalorimetric study of the effect of manganese on the growth and metabolism in a heterogeneously expressing manganese-dependent superoxide dismutase (Mn-SOD) strain. Therm. Anal. Calorim. 2017, 130, 1407–1416. [Google Scholar] [CrossRef]
  50. Su, J.; Bao, P.; Bai, T.; Deng, L.; Wu, H.; Liu, F.; He, J. CotA, a multicopper oxidase from Bacillus pumilus WH4, exhibits manganese-oxidase activity. PLoS ONE 2013, 8, e60573. [Google Scholar] [CrossRef]
  51. Su, J.; Deng, L.; Huang, L.; Guo, S.; Liu, F.; He, J. Catalytic oxidation of manganese(II) by multicopper oxidase CueO and characterization of the biogenic Mn oxide. Water Res. 2014, 56, 304–313. [Google Scholar] [CrossRef]
  52. Zheng, C.; Ma, Y.; Wang, X.; Xie, Y.; Ali, M.K.; He, J. Functional analysis of the sporulation-specific diadenylate cyclase cdaS in Bacillus thuringiensis. Front. Microbiol. 2015, 6, 908. [Google Scholar] [CrossRef] [PubMed]
  53. Janes, B.K.; Stibitz, S. Routine markerless gene replacement in Bacillus anthracis. Infect. Immun. 2006, 74, 1949–1953. [Google Scholar] [CrossRef]
  54. Wang, X.; Li, Z.; Li, X.; Qian, H.; Cai, X.; Li, X.; He, J. Poly-β-hydroxybutyrate metabolism is unrelated to the sporulation and parasporal crystal protein formation in Bacillus thuringiensis. Front. Microbiol. 2016, 7, 836. [Google Scholar] [CrossRef] [PubMed]
  55. Zhang, J.; Kang, Z.; Ding, W.; Chen, J.; Du, G. Integrated optimization of the in vivo heme biosynthesis pathway and the in vitro iron concentration for 5-Aminolevulinate production. Appl. Biochem. Biotechnol. 2016, 178, 1252–1262. [Google Scholar] [CrossRef] [PubMed]
  56. Qin, J.; Cao, Z.; Cai, X.; Fang, Y.; An, B.; Li, X.; Zhang, Y.; Tian, H.; Hu, W.; Yan, B.; et al. NupR responding to multiple signals is a nucleoside permease regulator in Bacillus thuringiensis BMB171. Microbiol. Spectr. 2022, 10, e0154322. [Google Scholar] [CrossRef]
  57. Tang, Q.; Li, X.; Zou, T.; Zhang, H.; Wang, Y.; Gao, R.; Li, Z.; He, J.; Feng, Y. Functional analysis of a c-di-AMP-specific phosphodiesterase mspde from Mycobacterium smegmatis. Int. J. Biol. Sci. 2015, 11, 813–824. [Google Scholar] [CrossRef]
  58. Peng, Q.; Kao, G.; Qu, N.; Zhang, J.; Li, J.; Song, F. The regulation of exosporium-related genes in Bacillus thuringiensis. Sci. Rep. 2016, 6, 19005. [Google Scholar] [CrossRef]
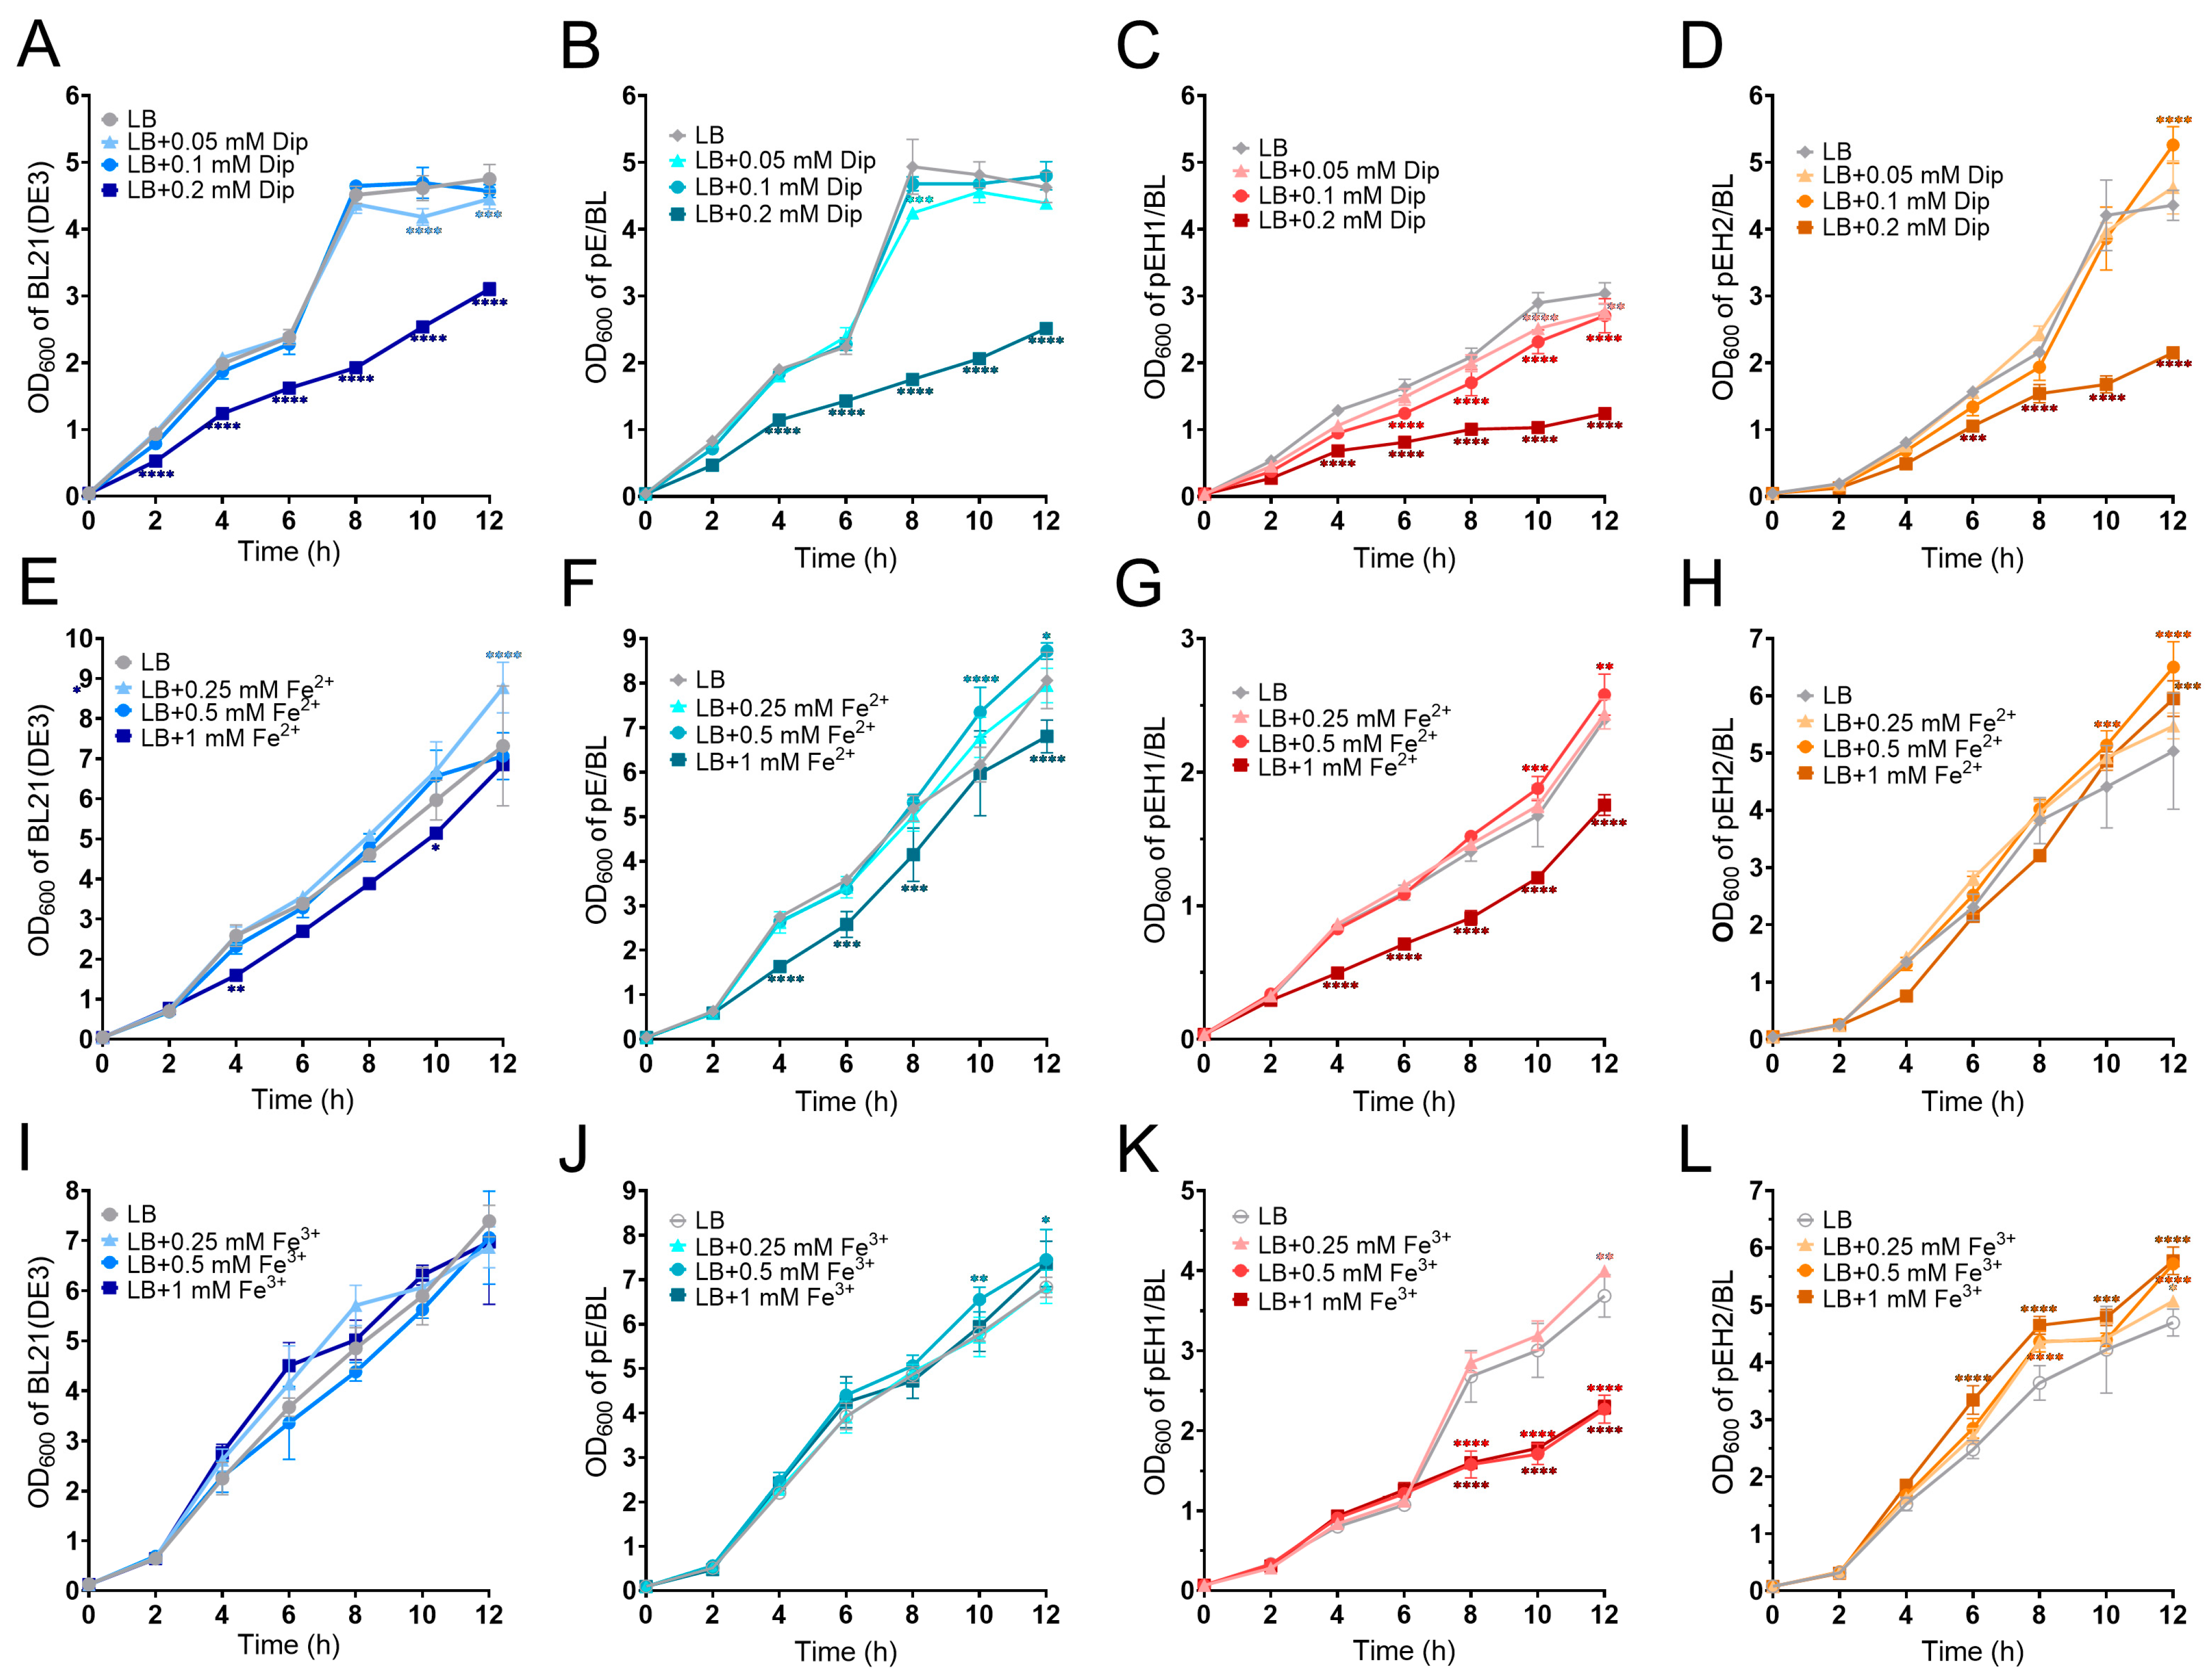
Figure 1. Growth curves of four E. coli strains under varying concentrations of Dip, Fe2+, and Fe3+. (AD) Growth curves of BL21(DE3), pE/BL, pEH1/BL, and pEH2/BL under different concentrations of Dip. (EH) Growth curves of BL21(DE3), pE/BL, pEH1/BL, and pEH2/BL under different concentrations of Fe2+. (IL) Growth curves of BL21(DE3), pE/BL, pEH1/BL, and pEH2/BL under different concentrations of Fe3+. Among them, p < 0.05 indicates a statistical difference. “*” indicates p < 0.05; “**” indicates p < 0.01; “***” indicates p < 0.001; “****” indicates p < 0.0001.
Ijms 26 02911 g001
Figure 2. Growth curves of six Bacillus thuringiensis (Bt) strains under varying concentrations of Dip. (A) Wild-type strain Bt 97-27. (B) Empty vector strain pH/Bt. (C) Knockout strain ΔhemH2. (D) Overexpression strain pHH2/Bt. (E) Complemented strain pHH1/Δh2. (F) Complemented strain pHH2/Δh2. Among them, p < 0.05 indicates a statistical difference. “*” indicates p < 0.05; “**” indicates p < 0.01; “****” indicates p < 0.0001.
Ijms 26 02911 g002
Figure 3. Sensitivity experiments of four E. coli and six Bt strains to different concentrations of H2O2. (A) E. coli strains BL21(DE3), pE/BL, pEH1/BL, and pEH2/BL grown on LB plates containing different concentrations of H2O2. (B) Wild-type strain Bt 97-27, knockout strain ΔhemH2, complemented strain pHH1/Δh2, and complemented strain pHH2/Δh2 grown on LB plates containing different concentrations of H2O2. (C) Wild-type strain Bt 97-27, empty vector strain pH/Bt and overexpression strain pHH2/Bt grown on LB plates containing different concentrations of H2O2.
Ijms 26 02911 g003
Figure 4. 5-ALA yield and OD600 values of four E. coli strains under LB and iron-limited LB conditions. (A) 5-ALA yield of the four strains cultivated in LB with 0 mM and 0.2 mM Dip. (B) OD600 of the four strains when sampling for 5-ALA measurement. Among them, “ns” indicates p > 0.05, no statistical difference; p < 0.05 indicates a statistical difference. “*” indicates p < 0.05; “**” indicates p < 0.01.
Ijms 26 02911 g004
Figure 5. Heme production of three E. coli strains under different cultivation conditions. (A) Bacterial heme productions in LB and LB containing 0.1 mM Fe2+ and 0.025 mM Fe3+, respectively. (B) Bacterial heme productions in LB and LB containing 0.2 mM Dip. Among them, “ns” indicates p > 0.05, no statistical difference; p < 0.05 indicates a statistical difference. “*” indicates p < 0.05; “**” indicates p < 0.01; “***” indicates p < 0.001; “****” indicates p < 0.0001.
Ijms 26 02911 g005
Figure 6. EMSA experiment. (A,B) Various concentrations of Fur or KatB binding with PhemH1 or PhemH2. (C,D) Effects of varying concentrations of Fe2+ or Fe3+ on the binding of Fur to PhemH1 or PhemH2. (E,F) Effects of varying concentrations of Mn2+ on the binding of Fur to PhemH1 or PhemH2.
Ijms 26 02911 g006
Figure 7. DNase I footprinting analysis. (A) DNase I footprinting sequence analysis before and after Fur protein binding to the PhemH1 promoter DNA. (B) DNase I footprinting sequence analysis before and after Fur protein binding to the PhemH2 promoter DNA. The regions marked with black boxes indicate the areas protected by the Fur protein, with the corresponding DNA sequences labeled below.
Ijms 26 02911 g007
Figure 8. Effects of 2.5 mM Fe3+ on the β-galactosidase activity of four Bt reporter strains. (A) Images of β-galactosidase activity of pHPh1/Bt and pHPh1fur strains in LB culture with or without Fe3+. (B) Images of β-galactosidase activity of pHPh2/Bt or pHPh2fur strains in LB culture with or without Fe3+. (C) Detection of β-galactosidase activity of four Bt strains in LB culture. (D) Detection of β-galactosidase activity of four Bt strains in LB culture with Fe3+. Among them, “ns” indicates p > 0.05, no statistical difference; p < 0.05 indicates a statistical difference. “**” indicates p < 0.01; “****” indicates p < 0.0001.
Ijms 26 02911 g008
Figure 9. Relative expression levels of genes in the ΔhemH2 strain compared with Bt 97-27. (A) Relative expression levels of heme-related genes. (B) Relative expression levels of genes in the fecoporphyrin heme synthesis pathway. (C) Relative expression levels of oxidative stress-related genes. (D) Relative expression levels of ferrous transport-related genes. Among them, p < 0.05 indicates a statistical difference. “*” indicates p < 0.05; “**” indicates p < 0.01; “***” indicates p < 0.001; “****” indicates p < 0.0001.
Ijms 26 02911 g009
Figure 10. The regulatory mechanisms of Fur on hemH1 and hemH2, and the functions of HemH1 and HemH2.
Ijms 26 02911 g010
Disclaimer/Publisher’s Note: The statements, opinions and data contained in all publications are solely those of the individual author(s) and contributor(s) and not of MDPI and/or the editor(s). MDPI and/or the editor(s) disclaim responsibility for any injury to people or property resulting from any ideas, methods, instructions or products referred to in the content.