
Integrated Analysis of Bulk and Single-Cell RNA Sequencing Data Reveal a Novel Prognostic Signature of Combining Cuproptosis- and Ferroptosis-Related Genes in Hepatocellular Carcinoma


Abstract
1. Introduction
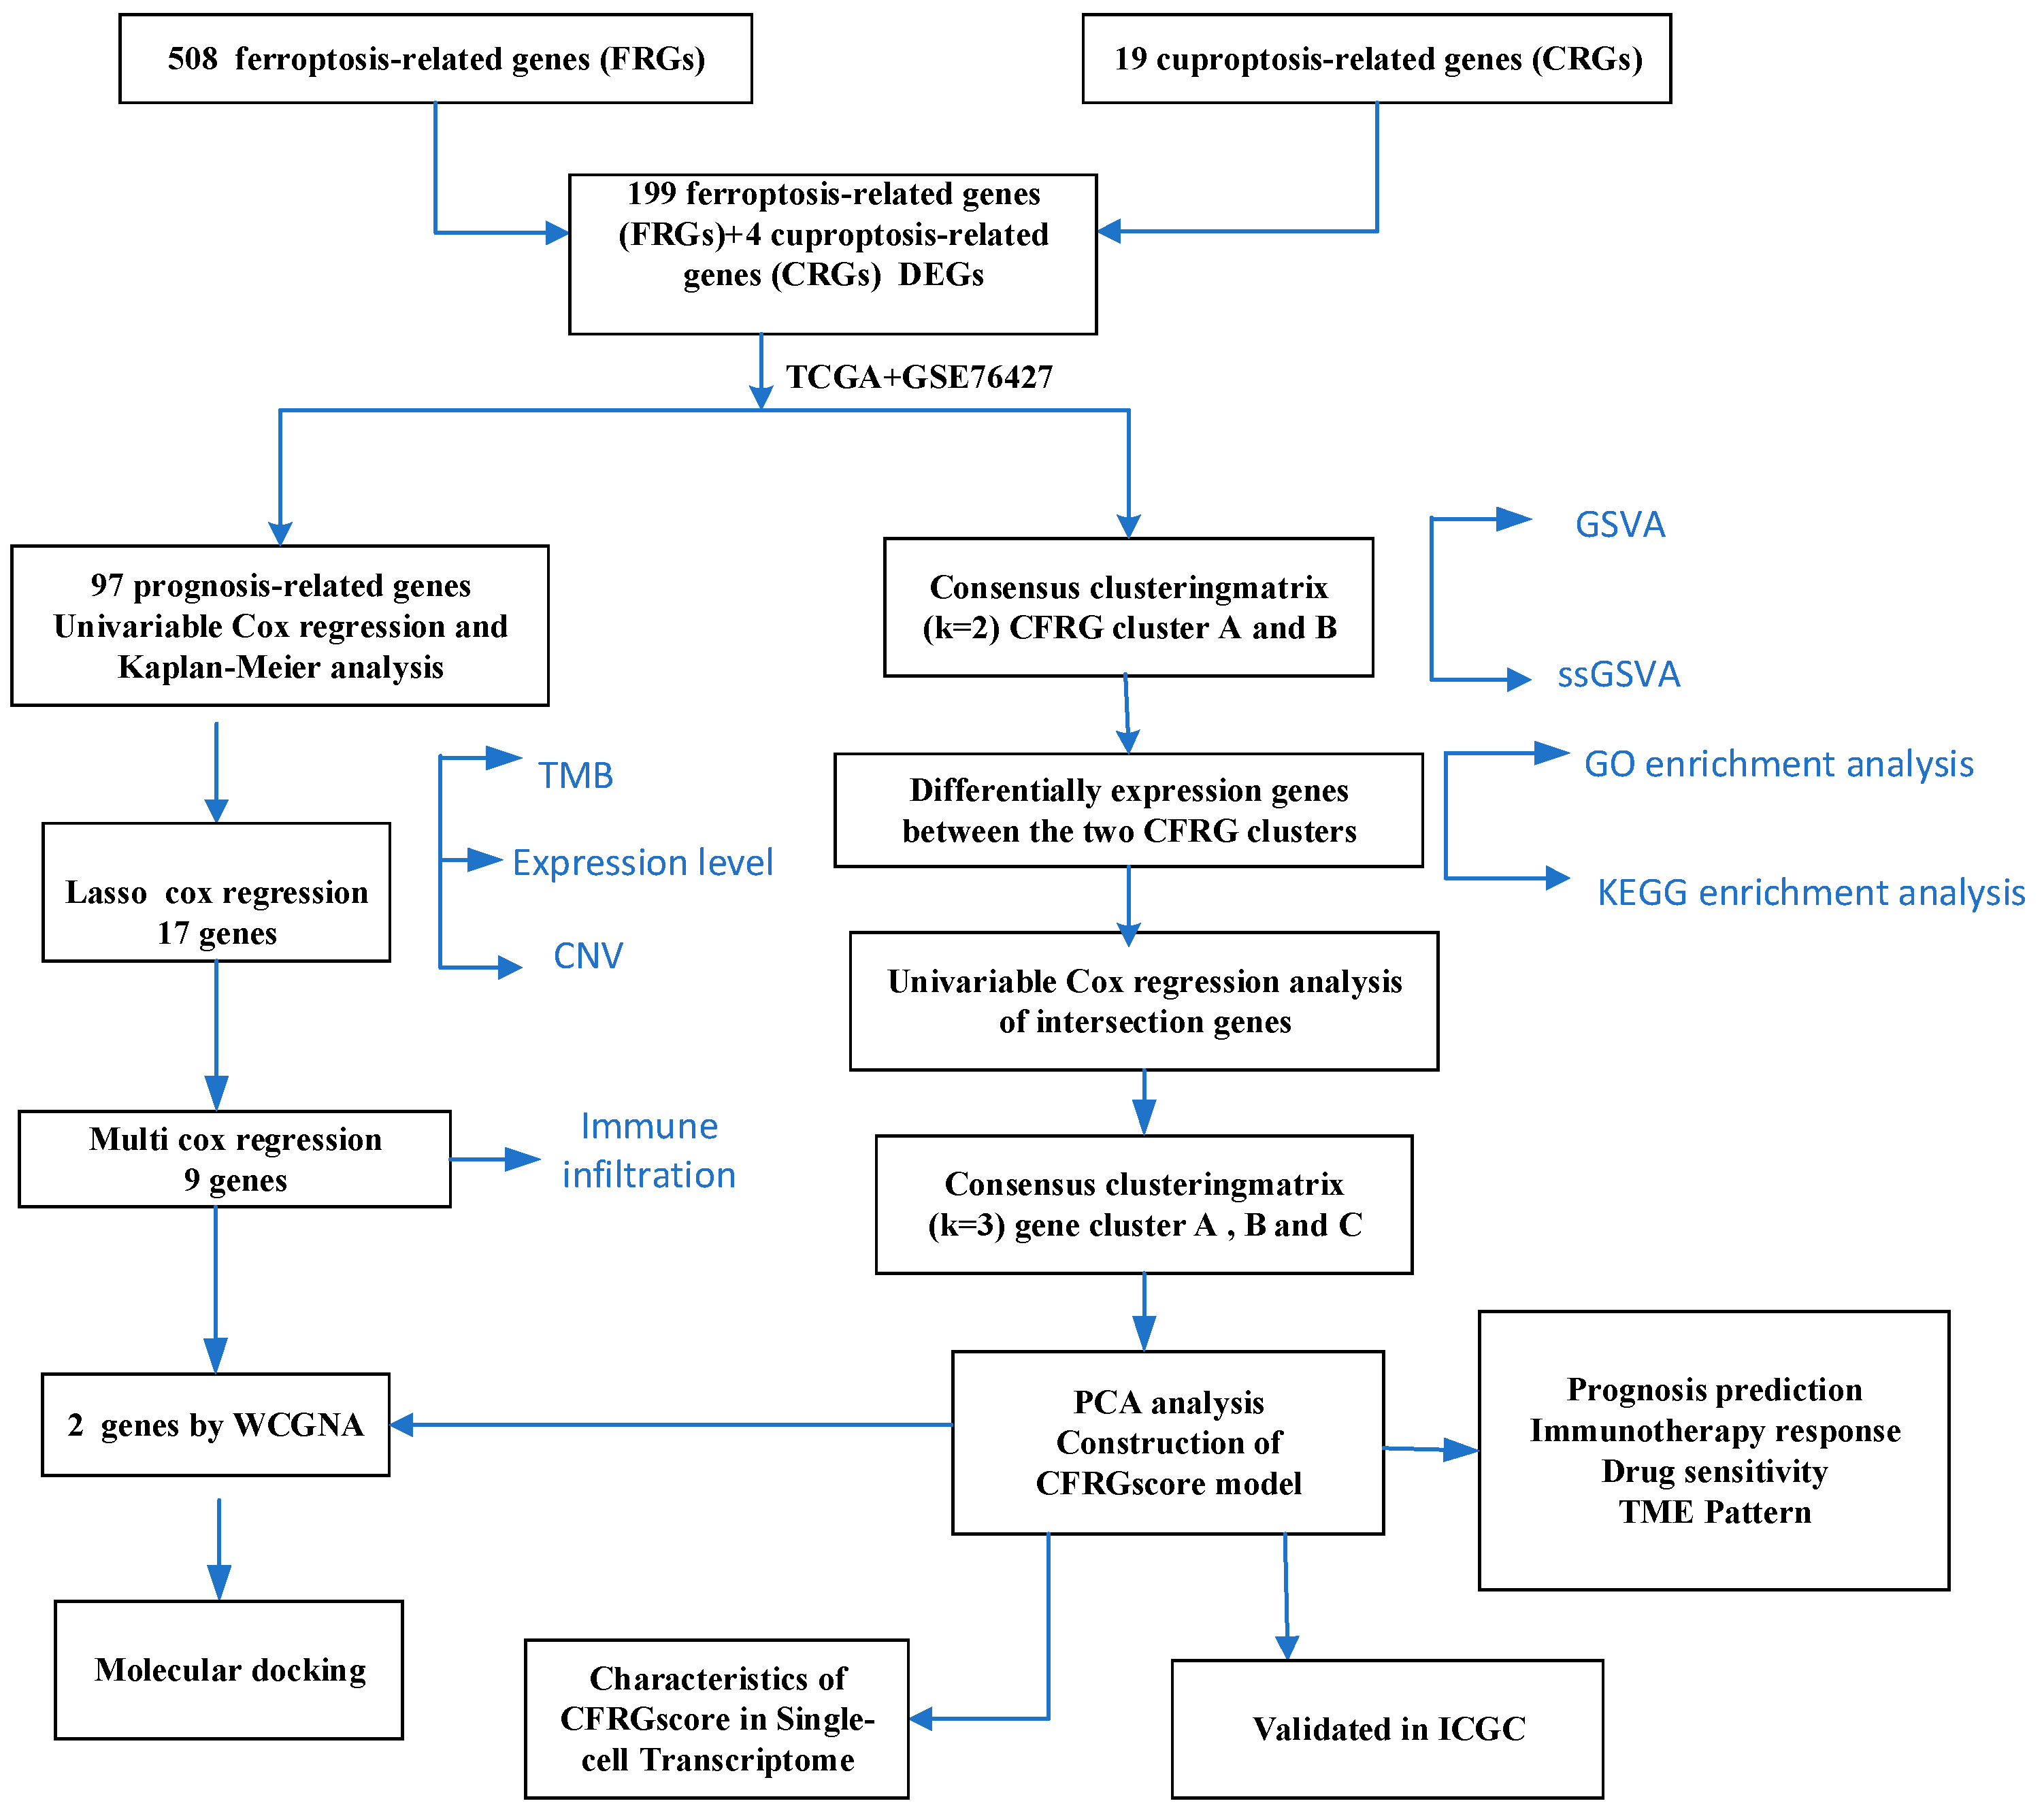
2. Results
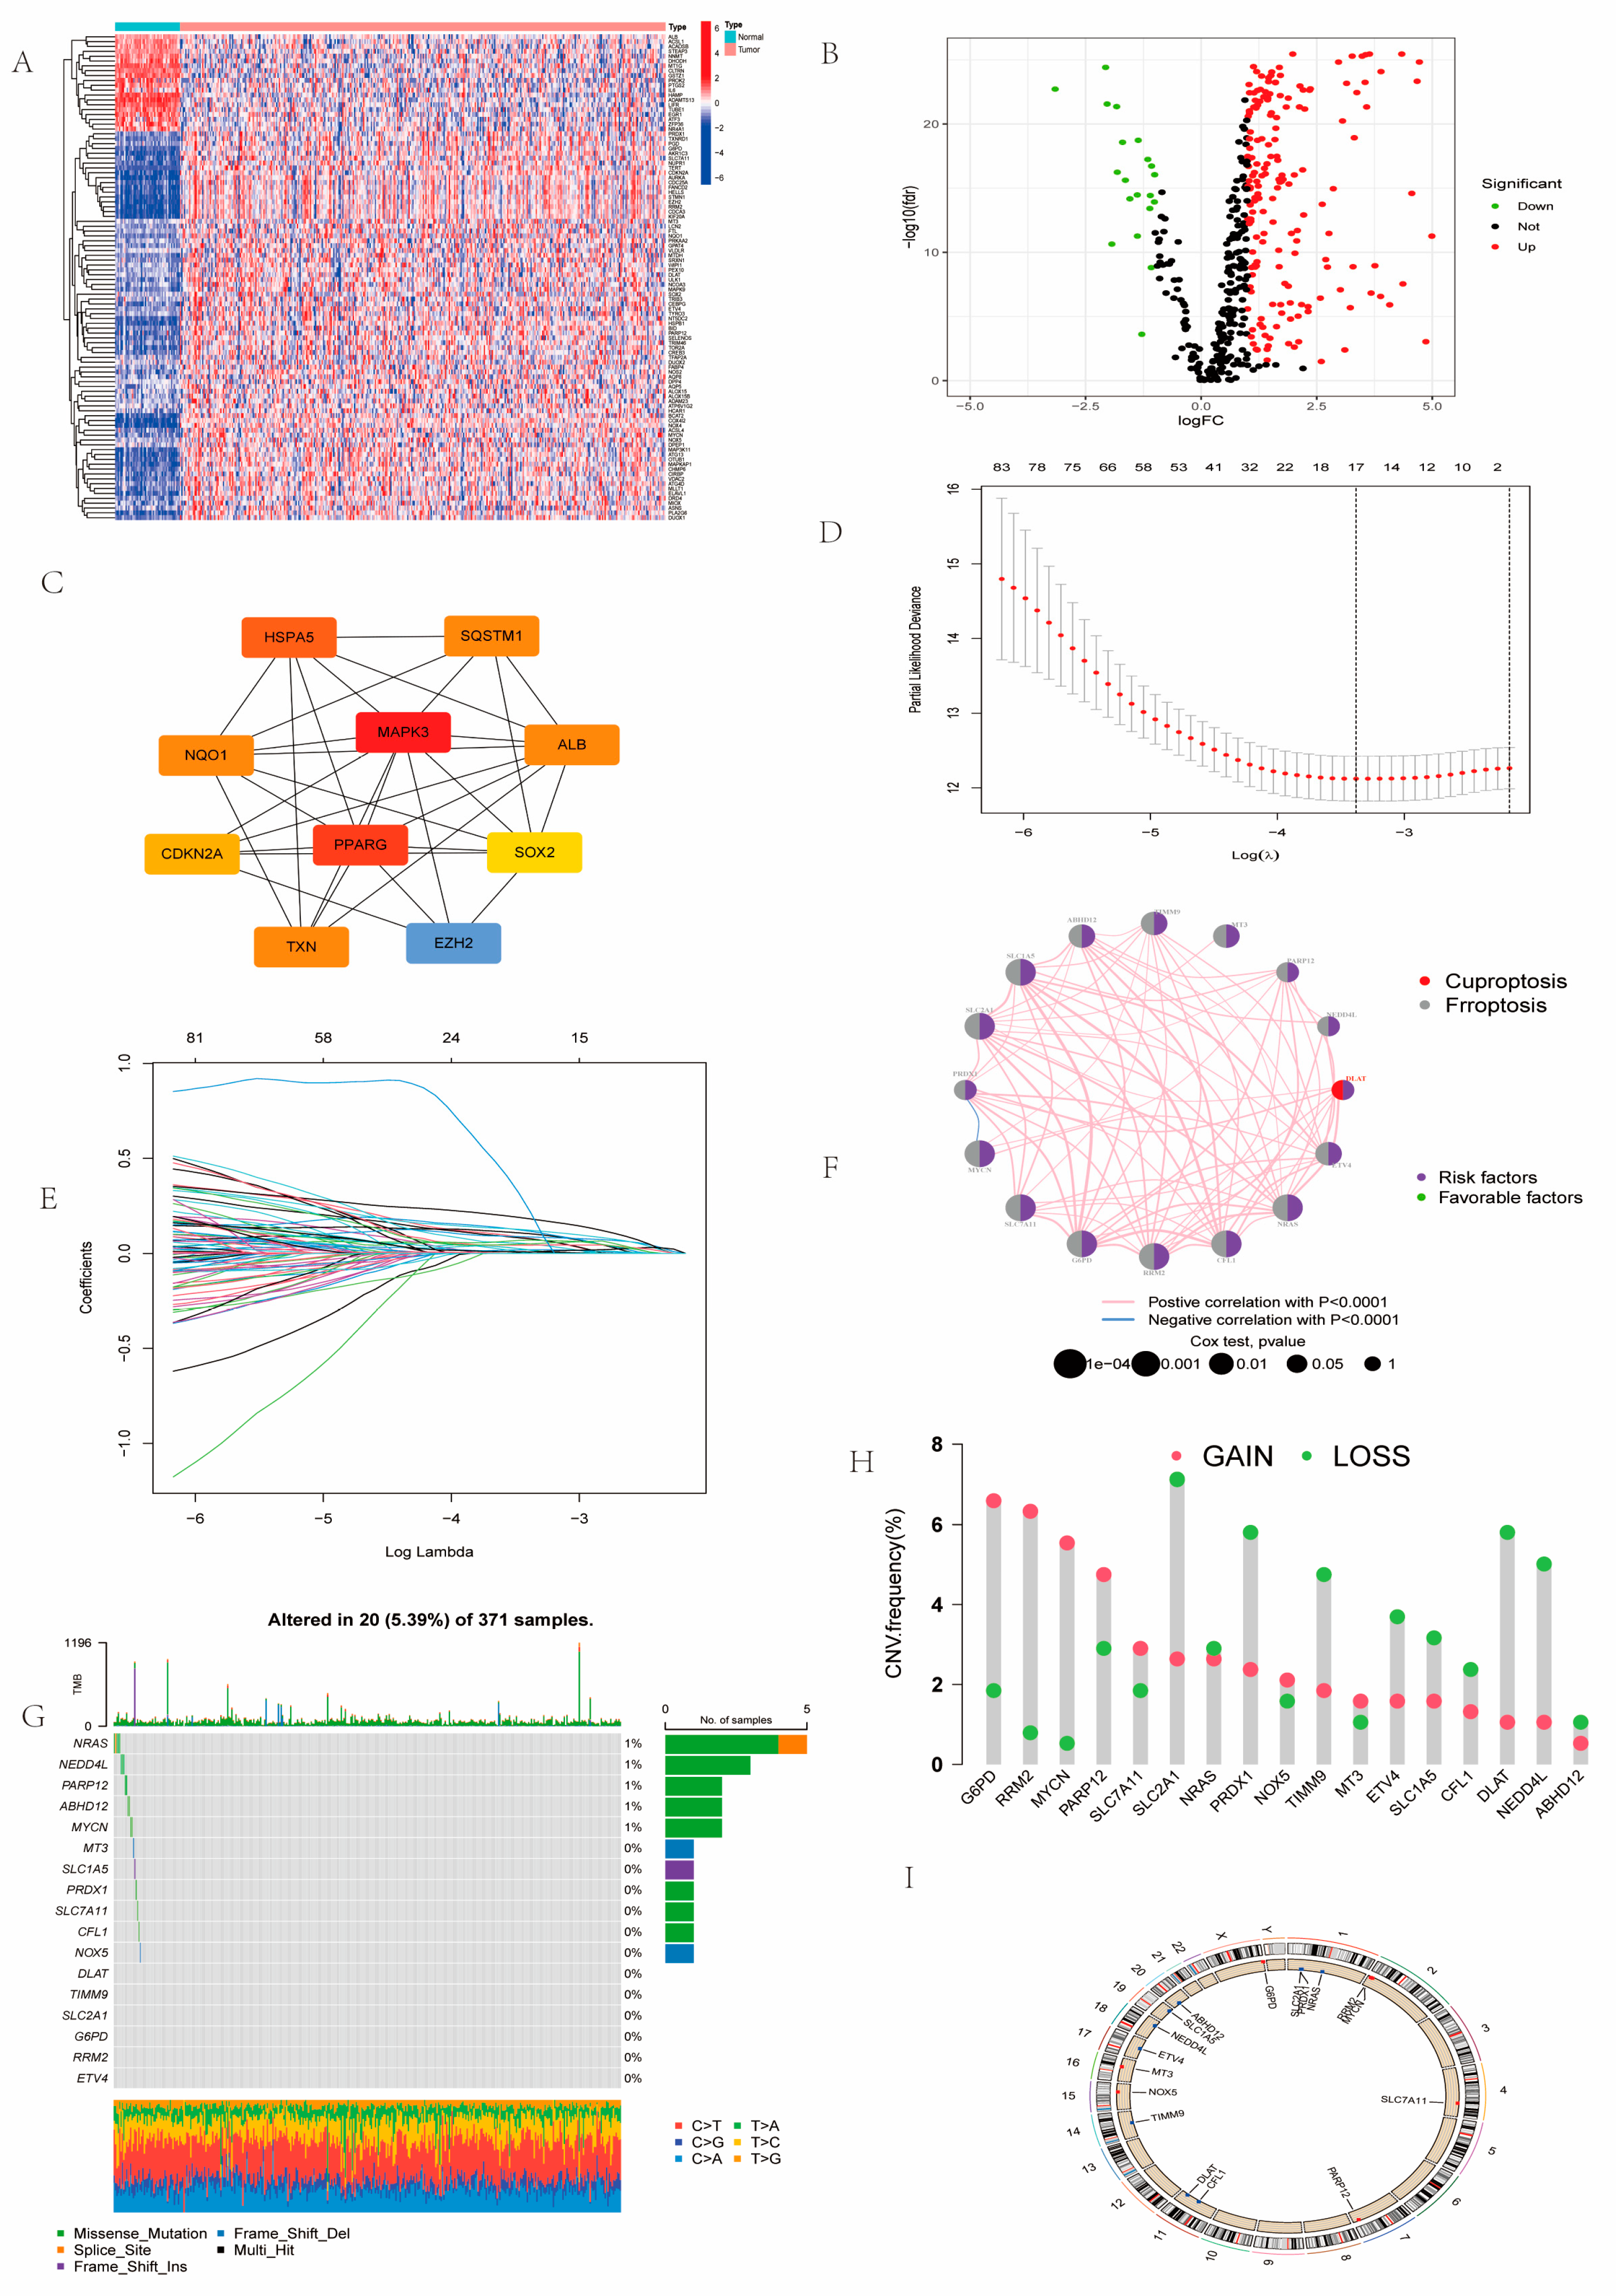
2.1. Landscape of Prognosis-Associated CFRGs
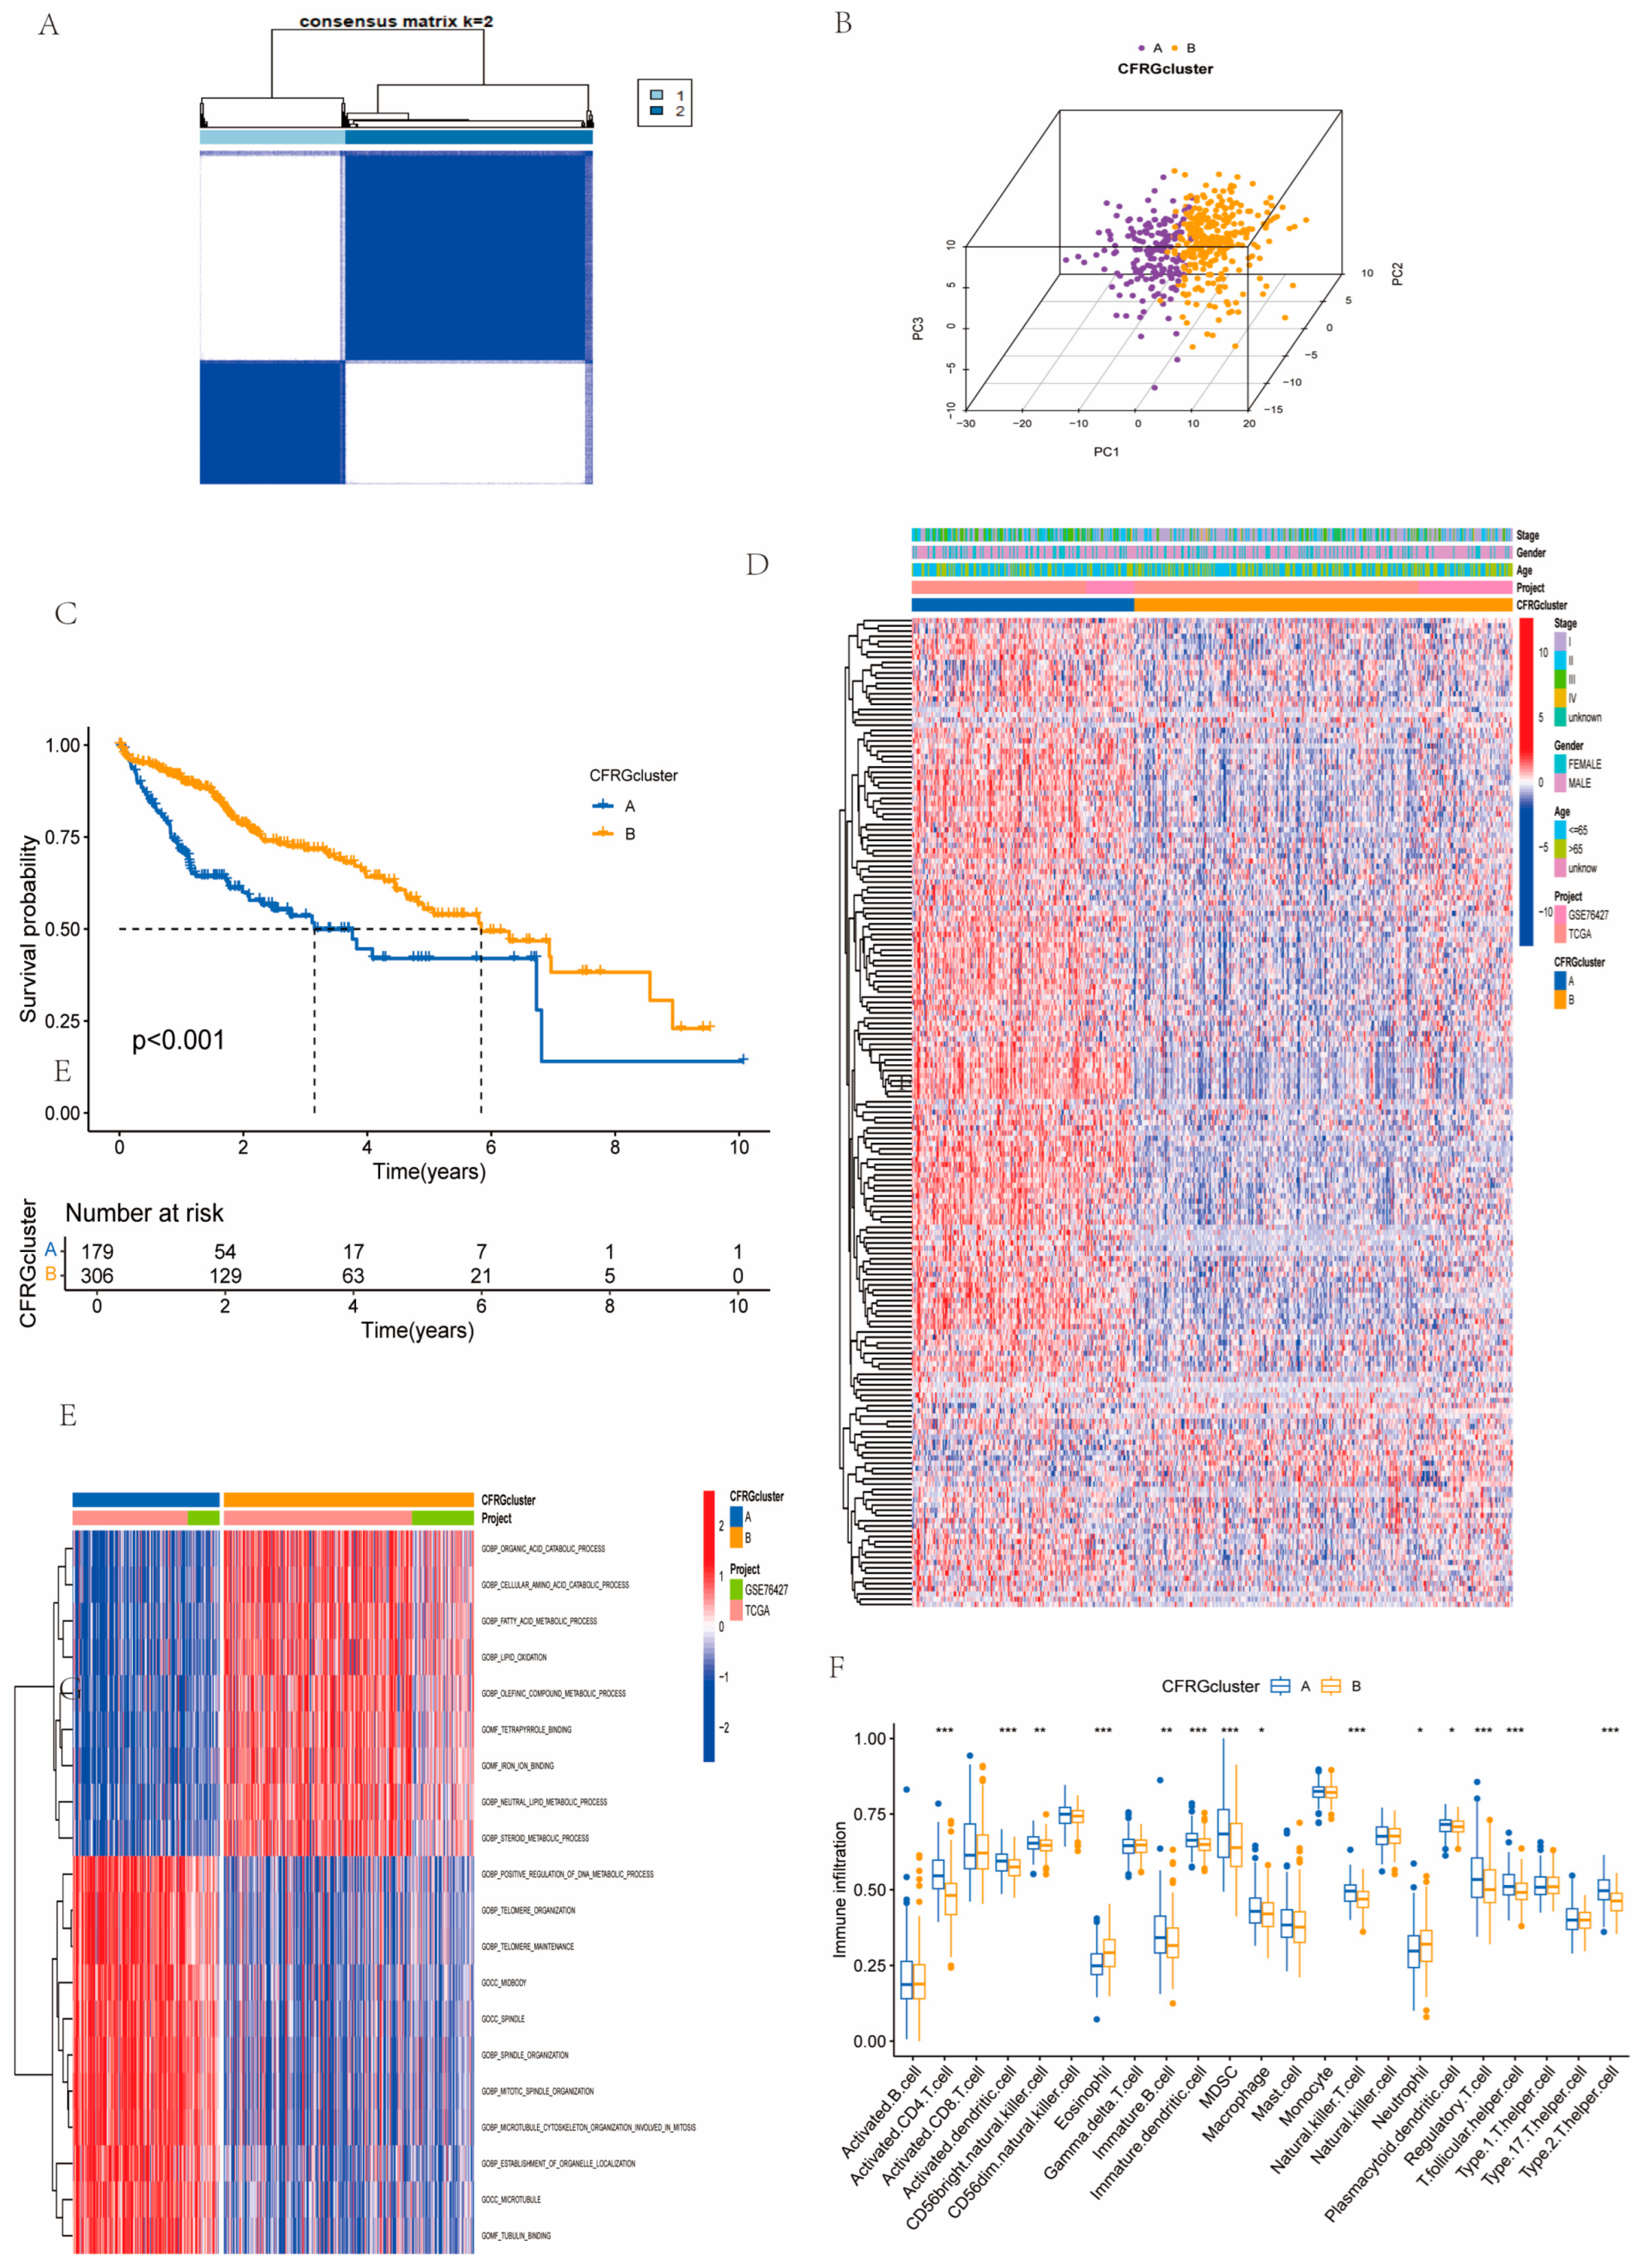
2.2. Identification of CFRG Subtypes, GSVA, ssGSEA, and Immune Score Analysis
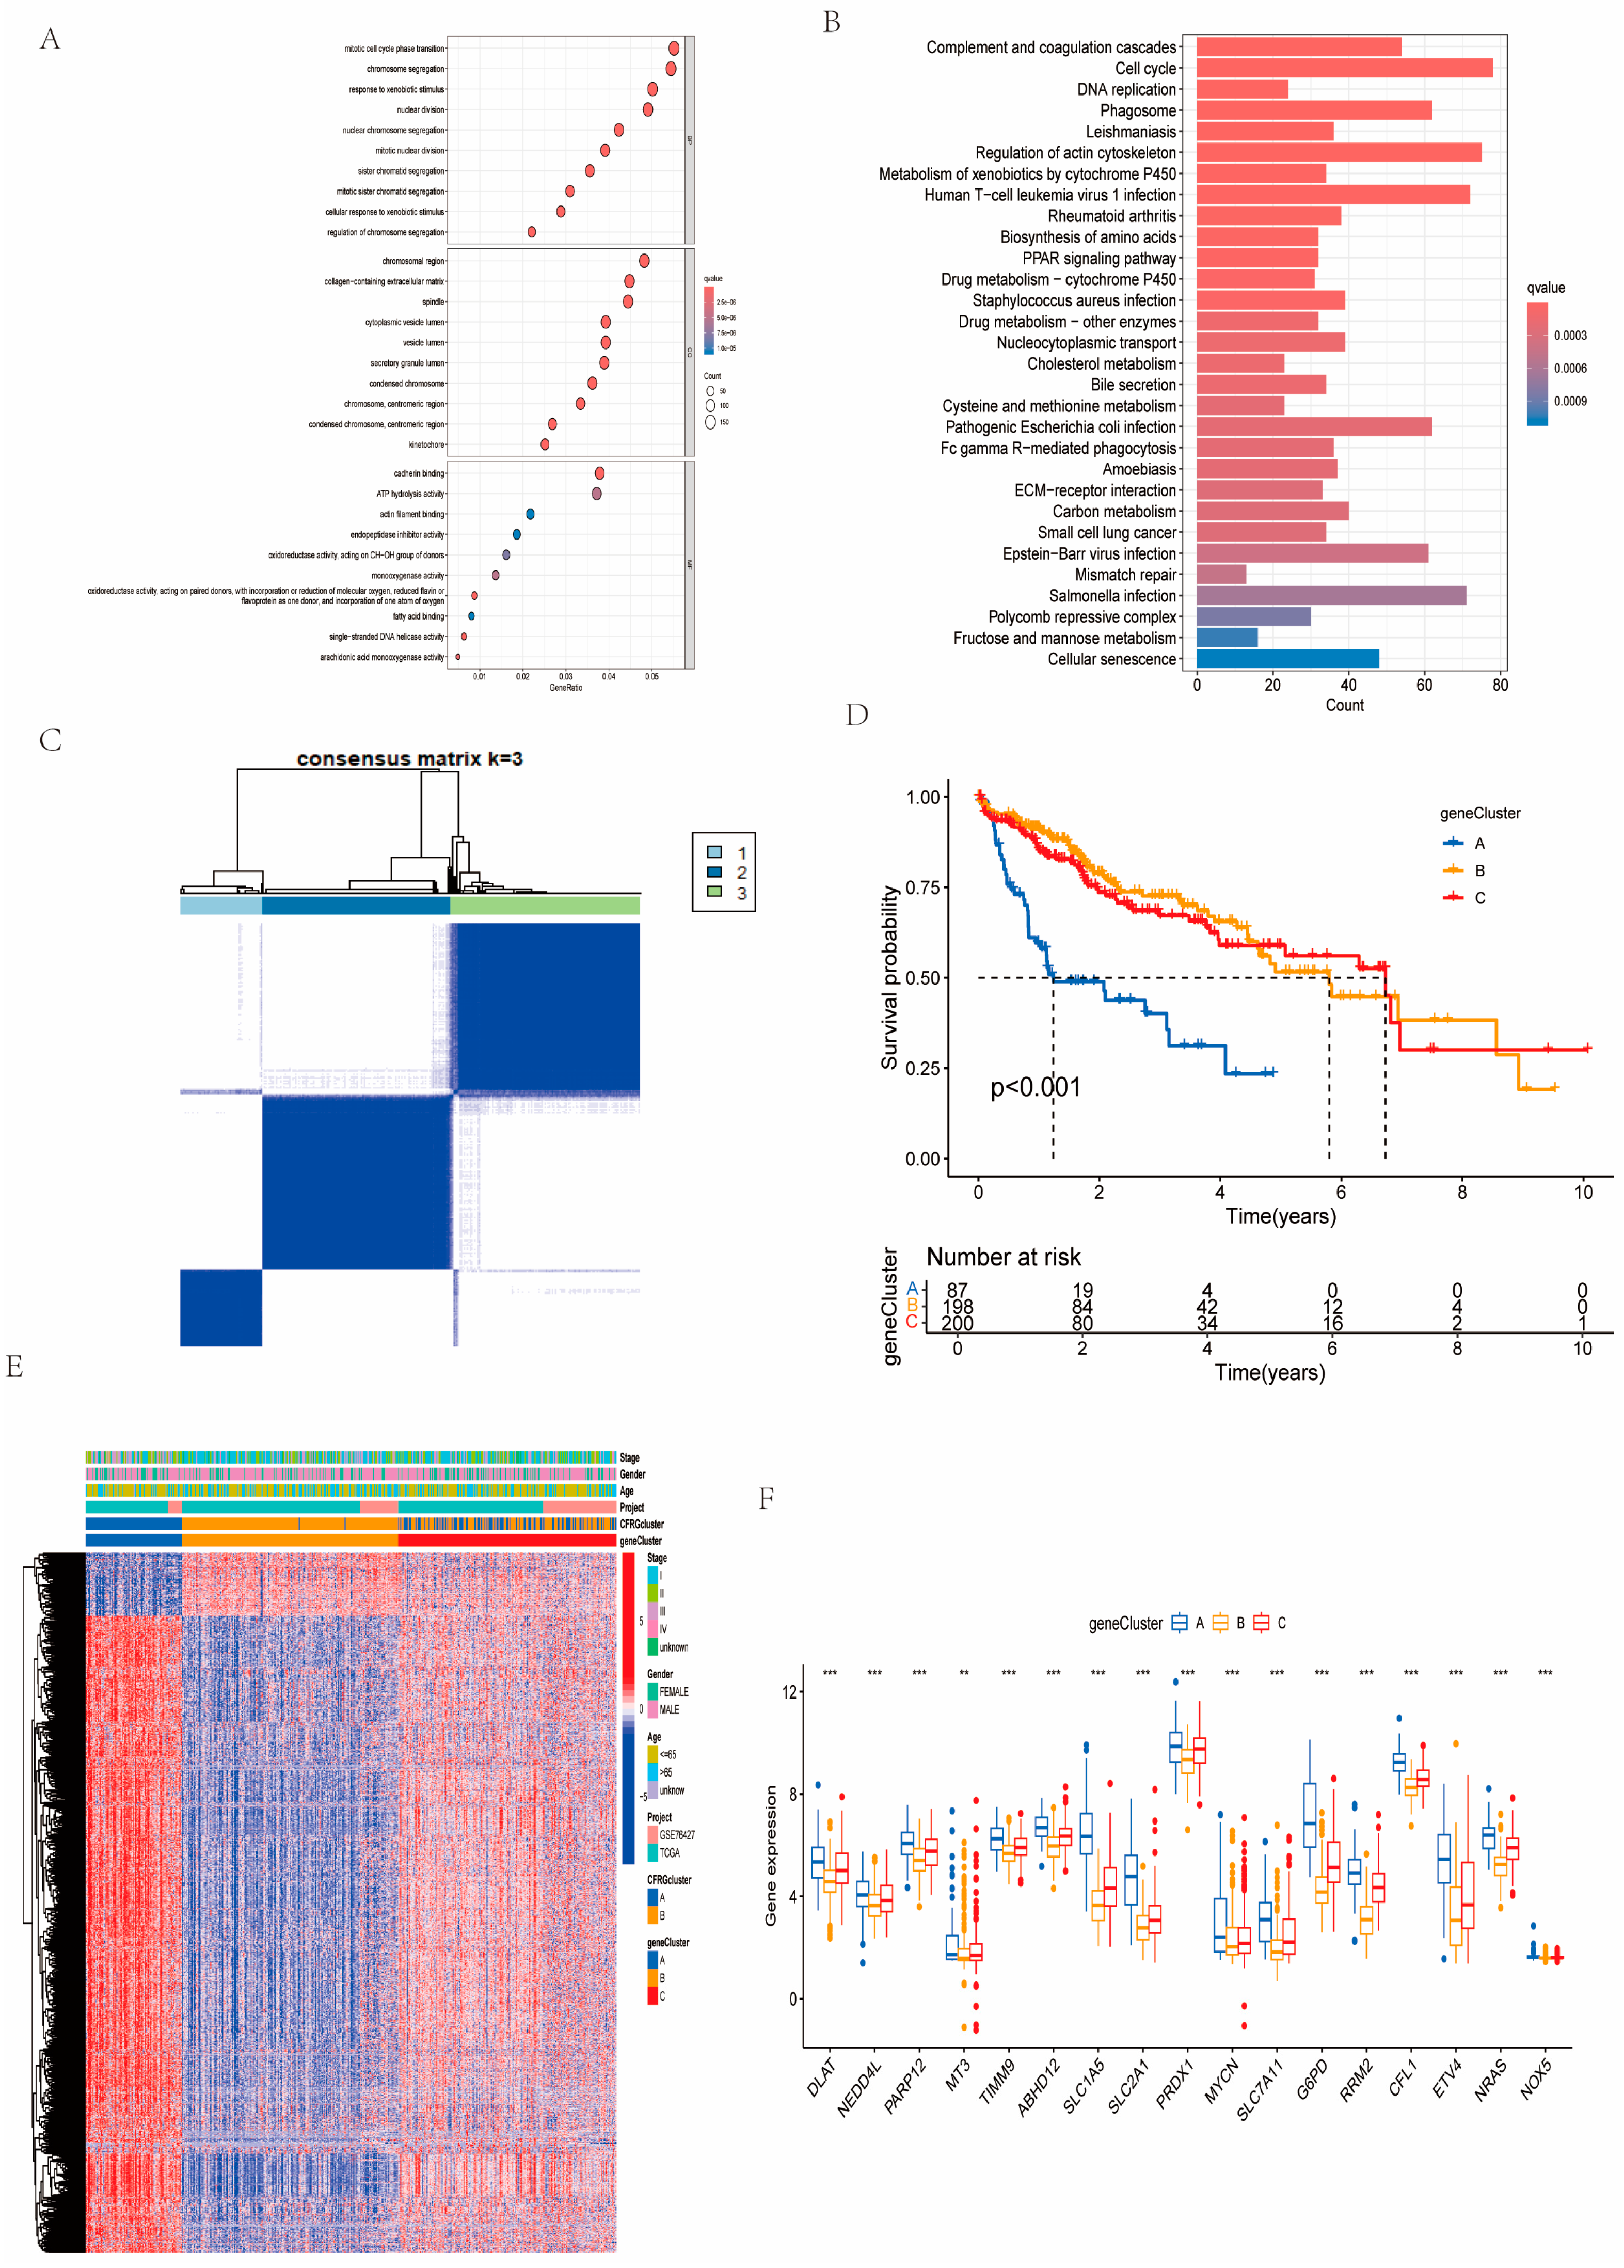
2.3. Identification of Gene Subtypes and GO and KEGG Pathway Analysis
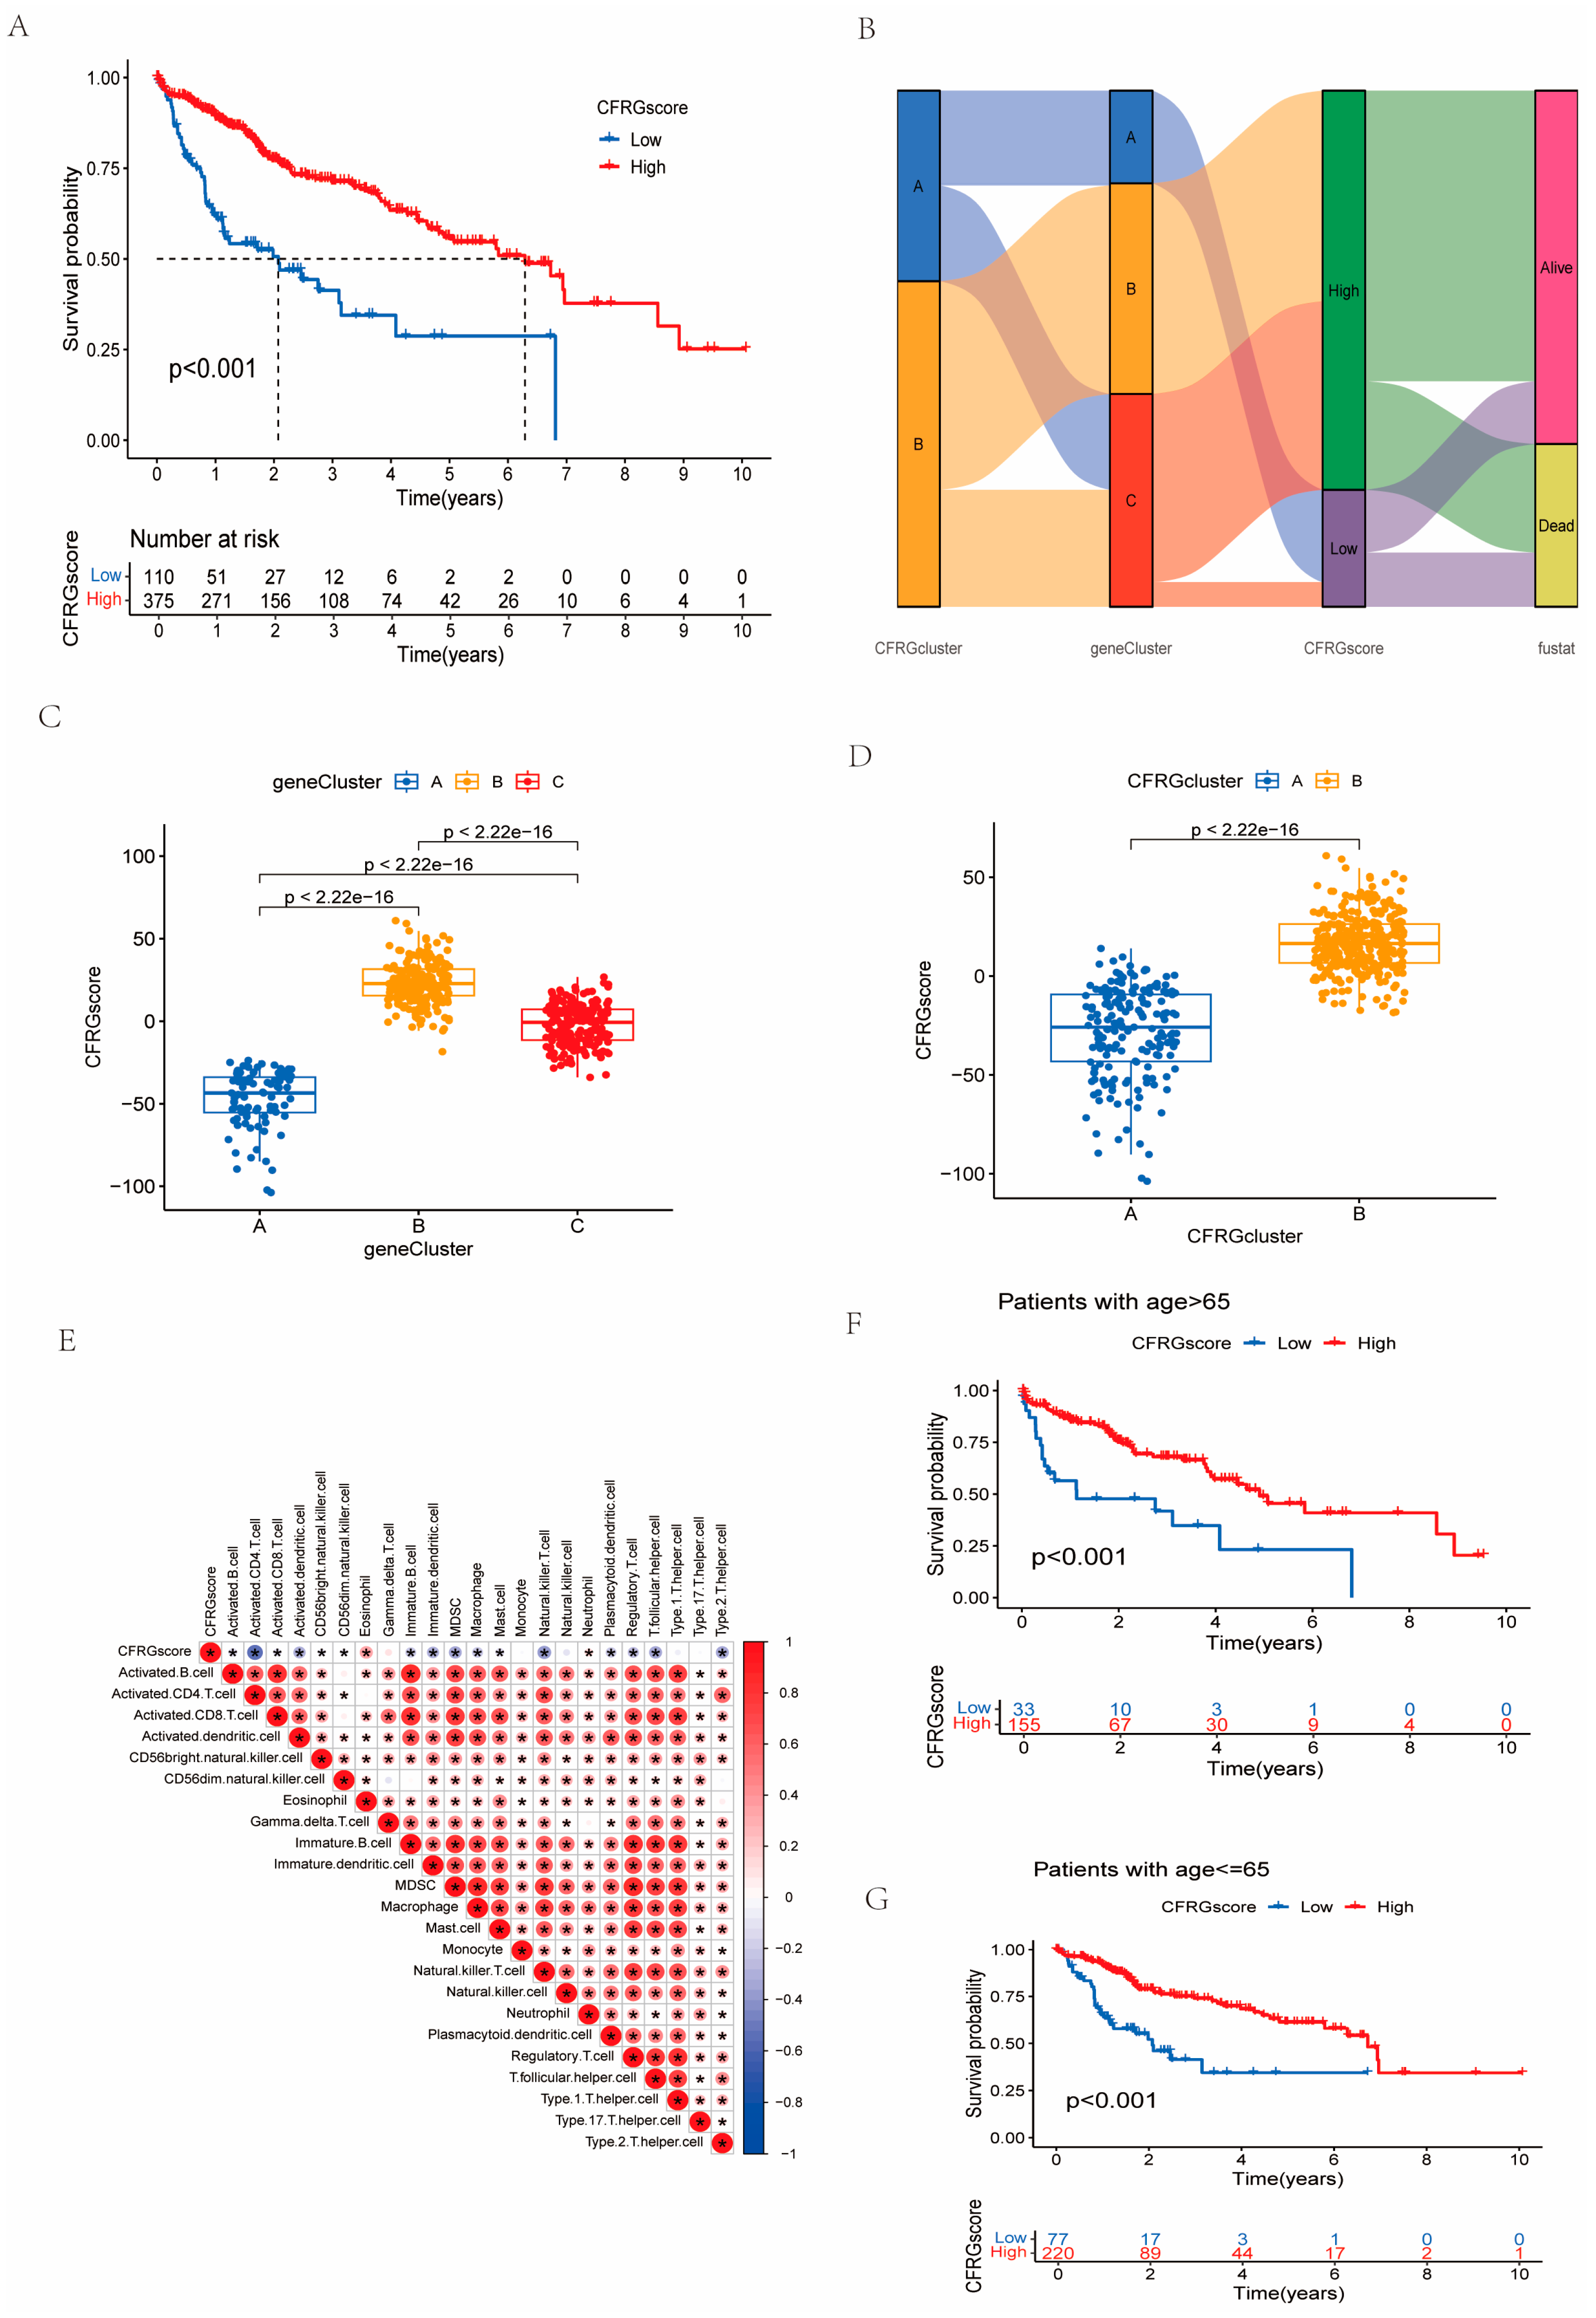
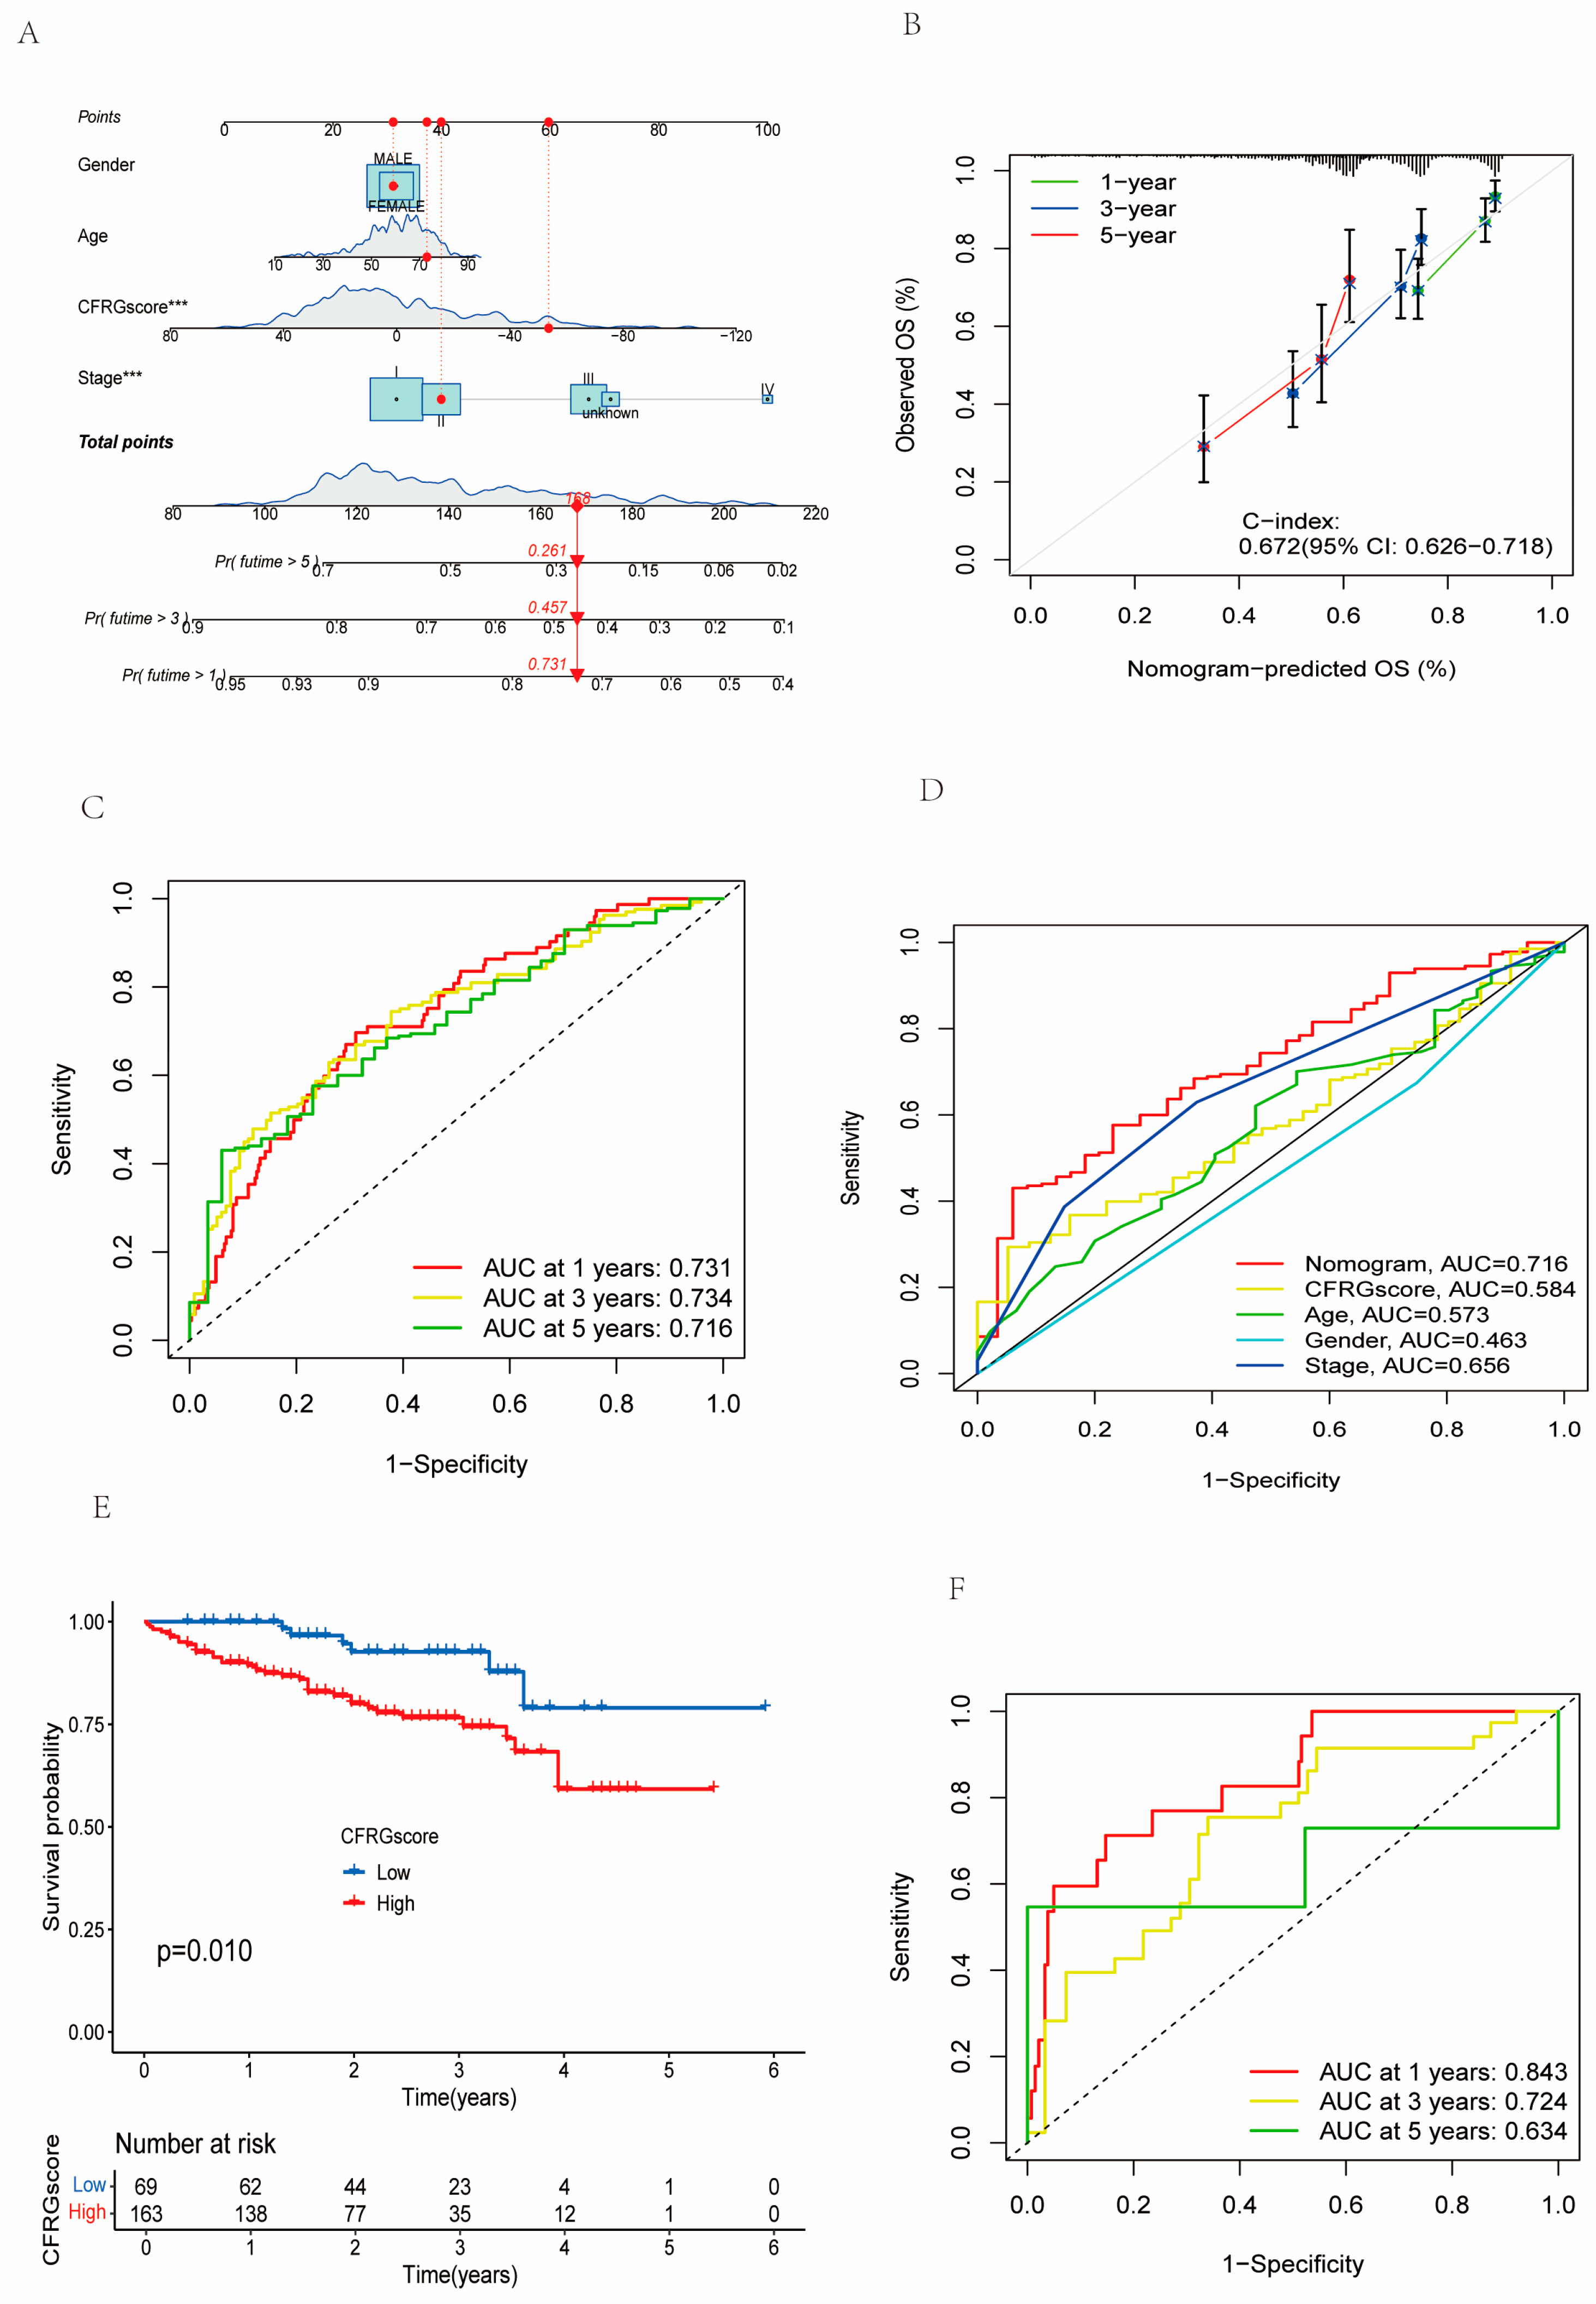
2.4. Construction of the CFRG Scoring Model
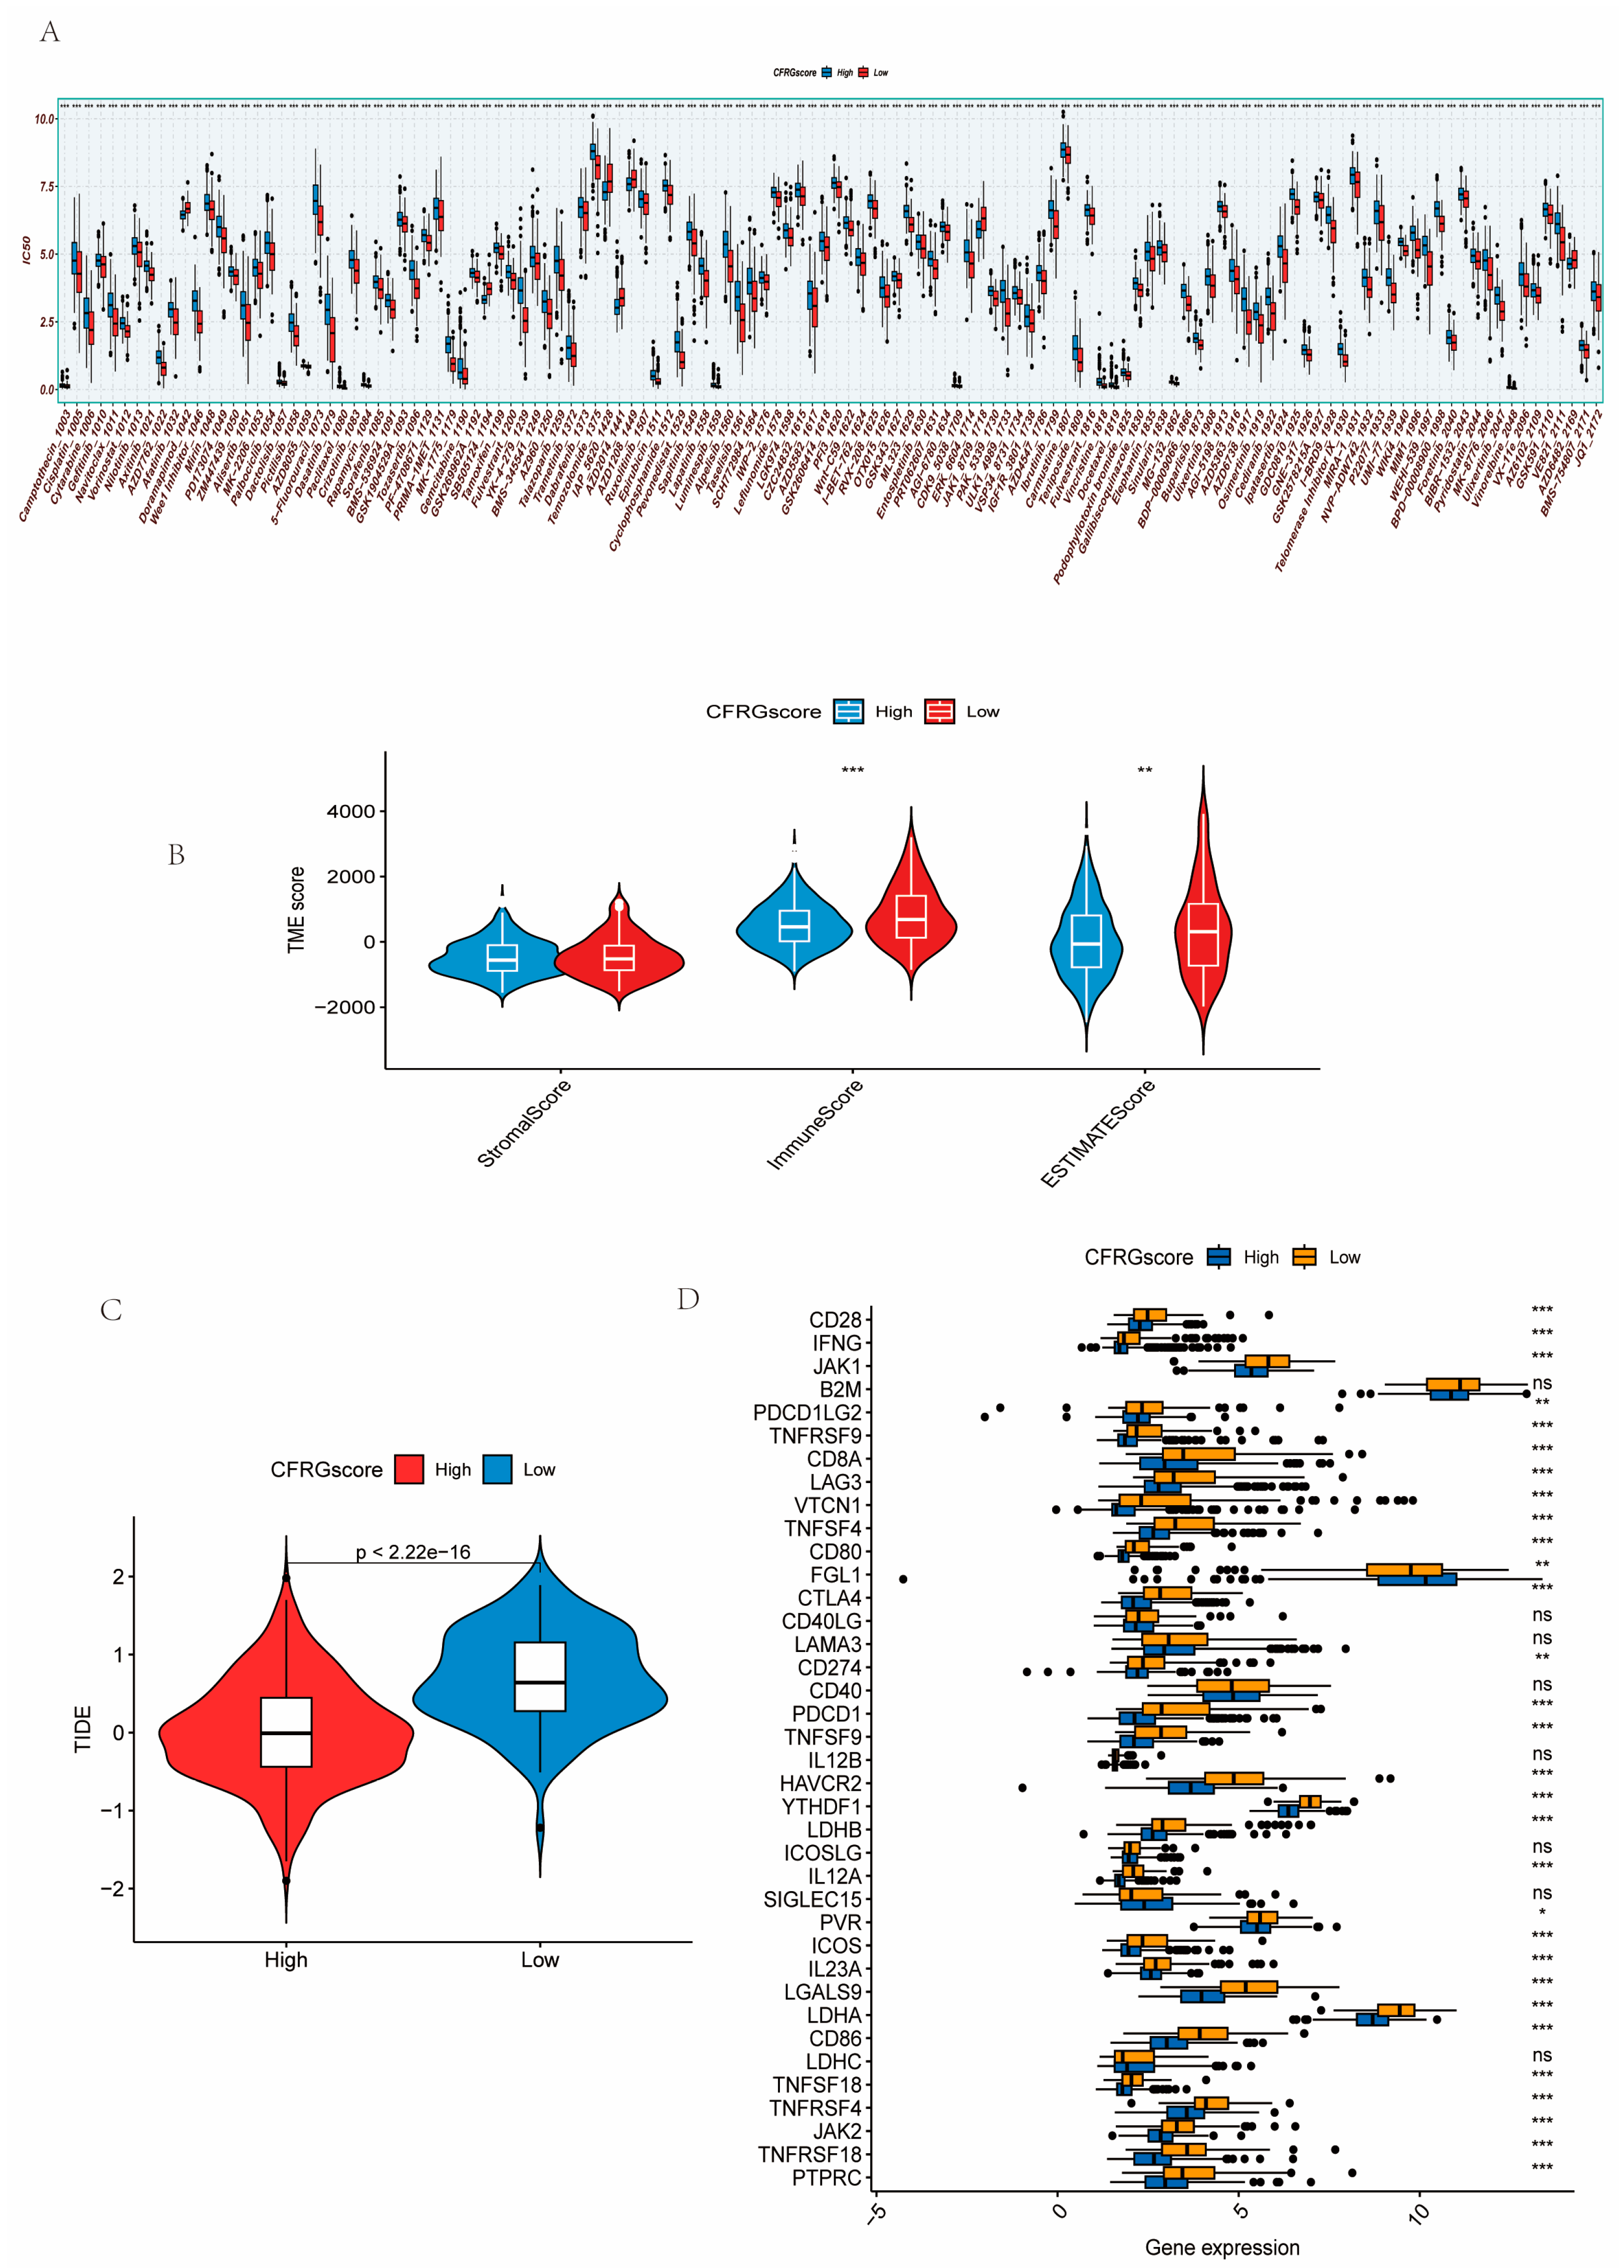
2.5. Difference Analysis of Drug Sensitivity, Immune State, Immune Checkpoint Inhibitors, and TIDE Score Between CFRG Score Groups
2.6. Verification of the CFRG Scoring Model
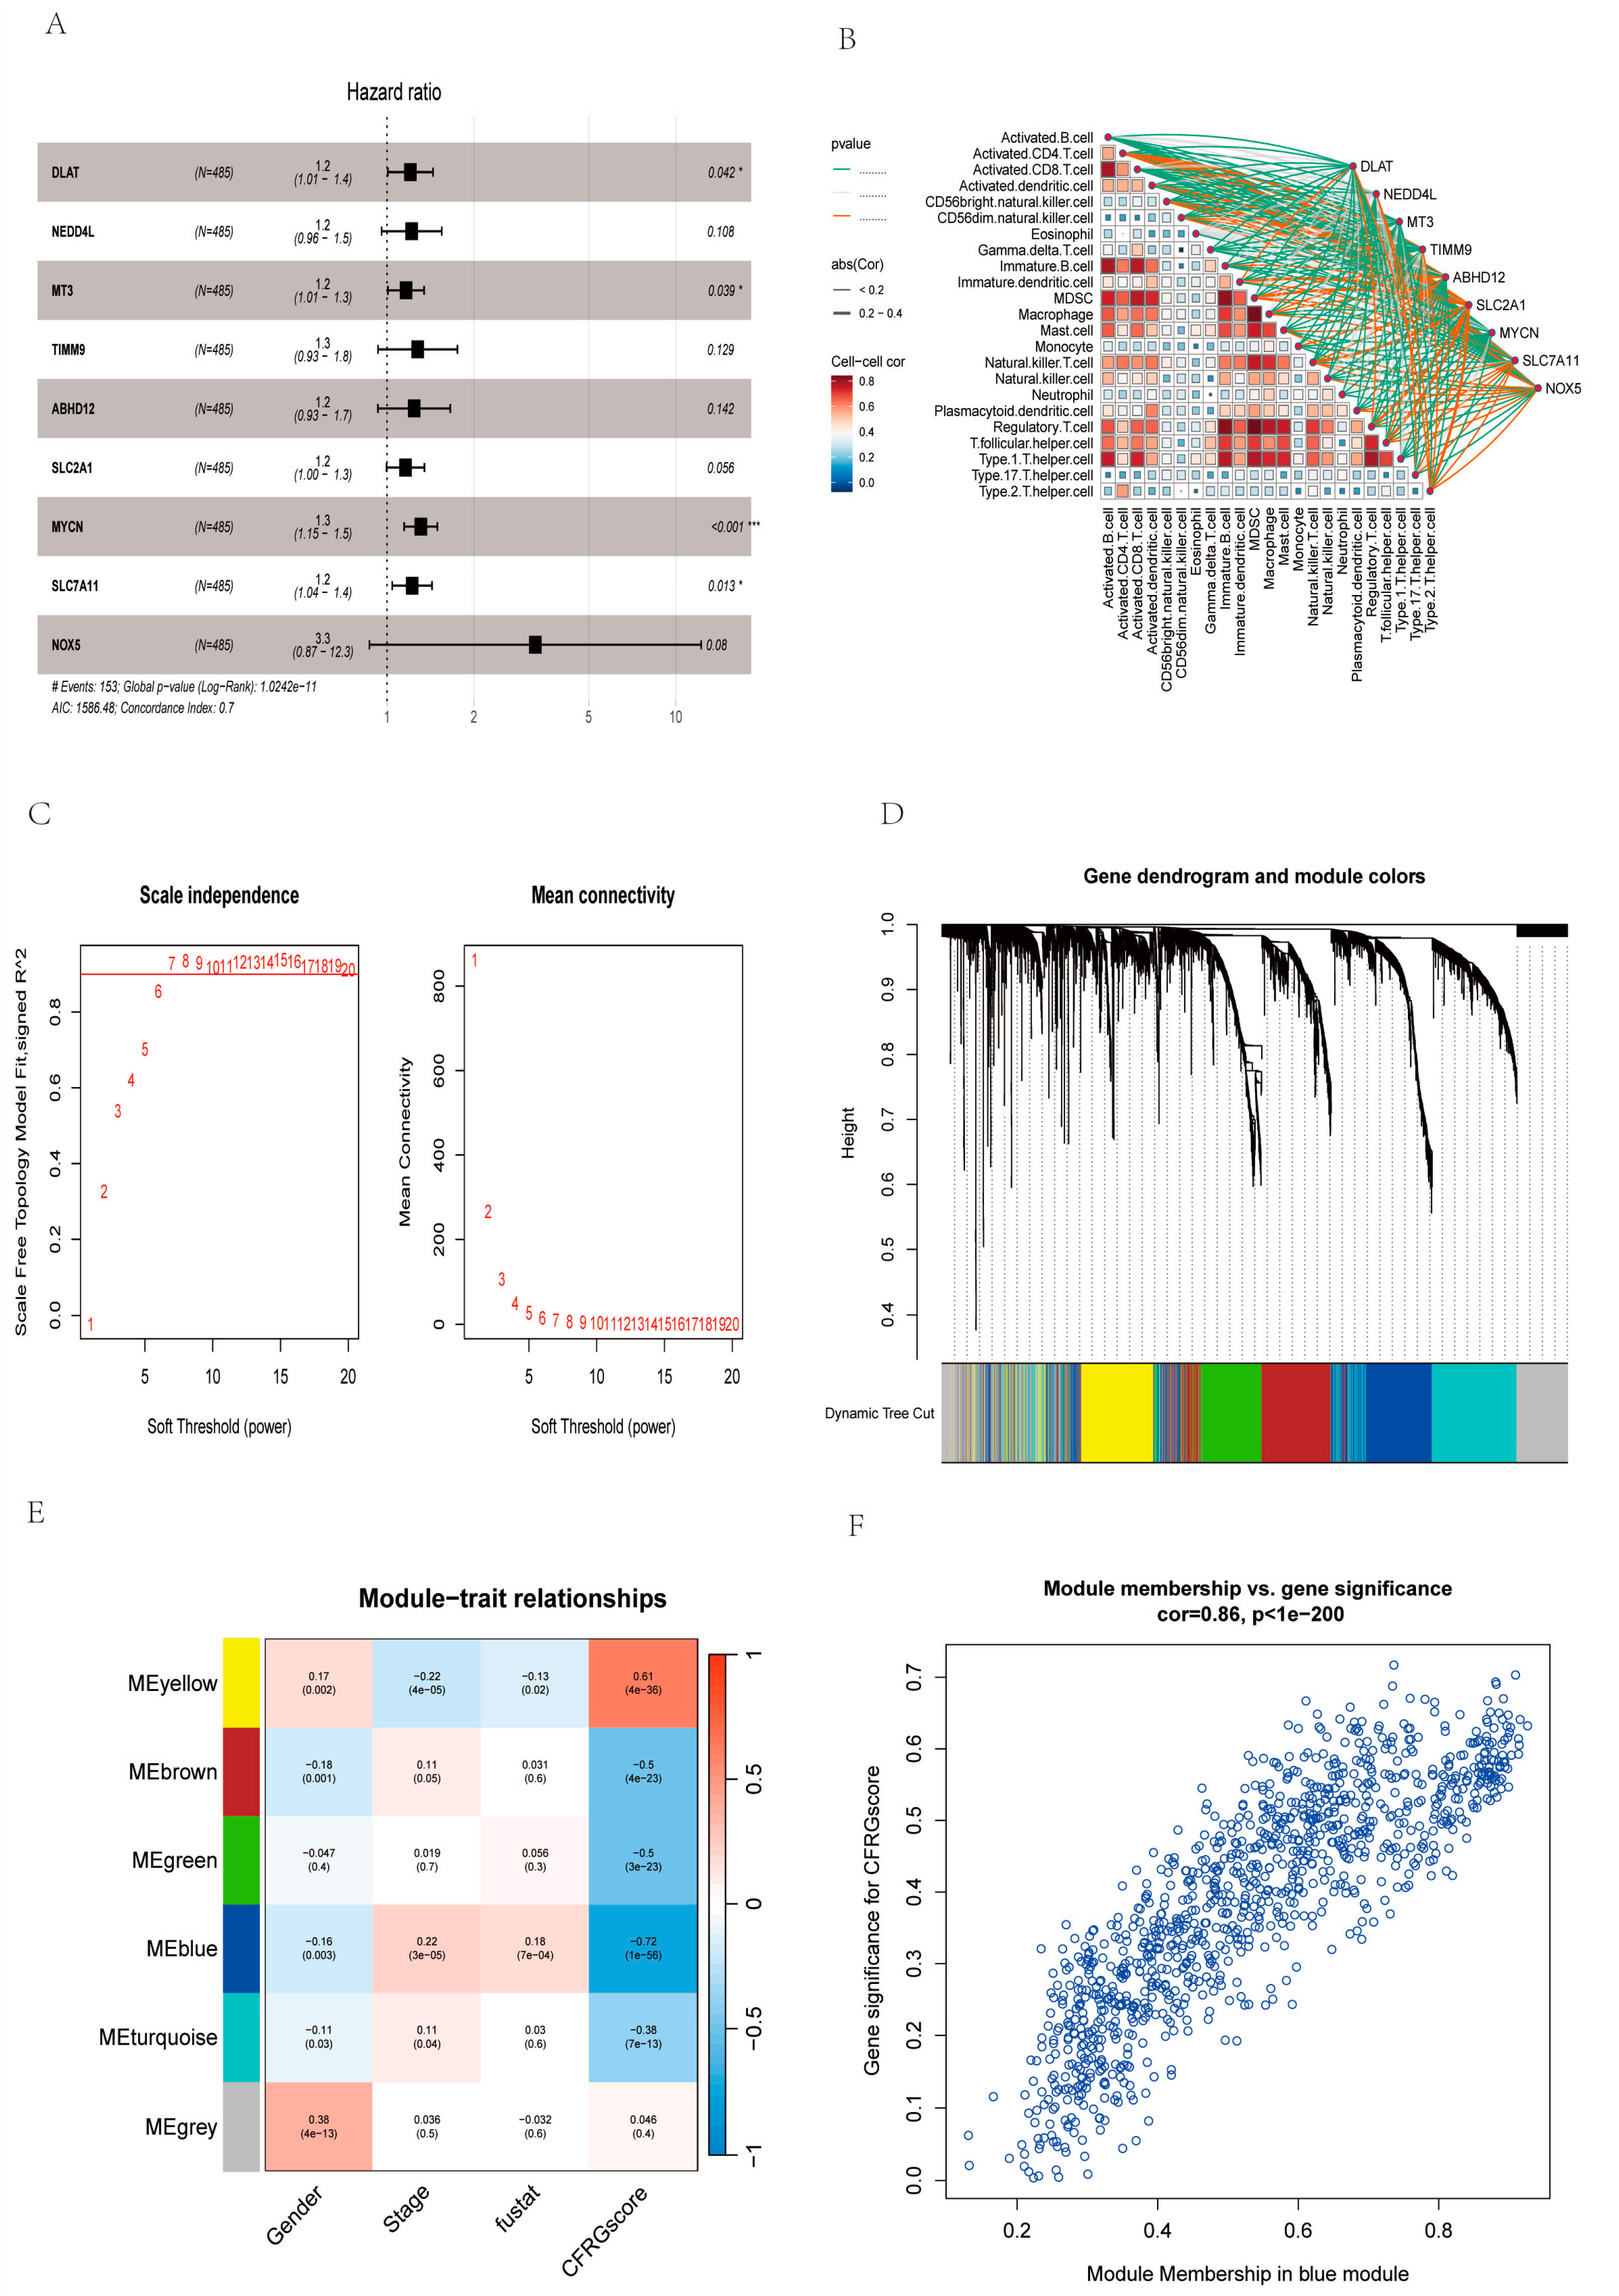
2.7. Identification of Signature Genes
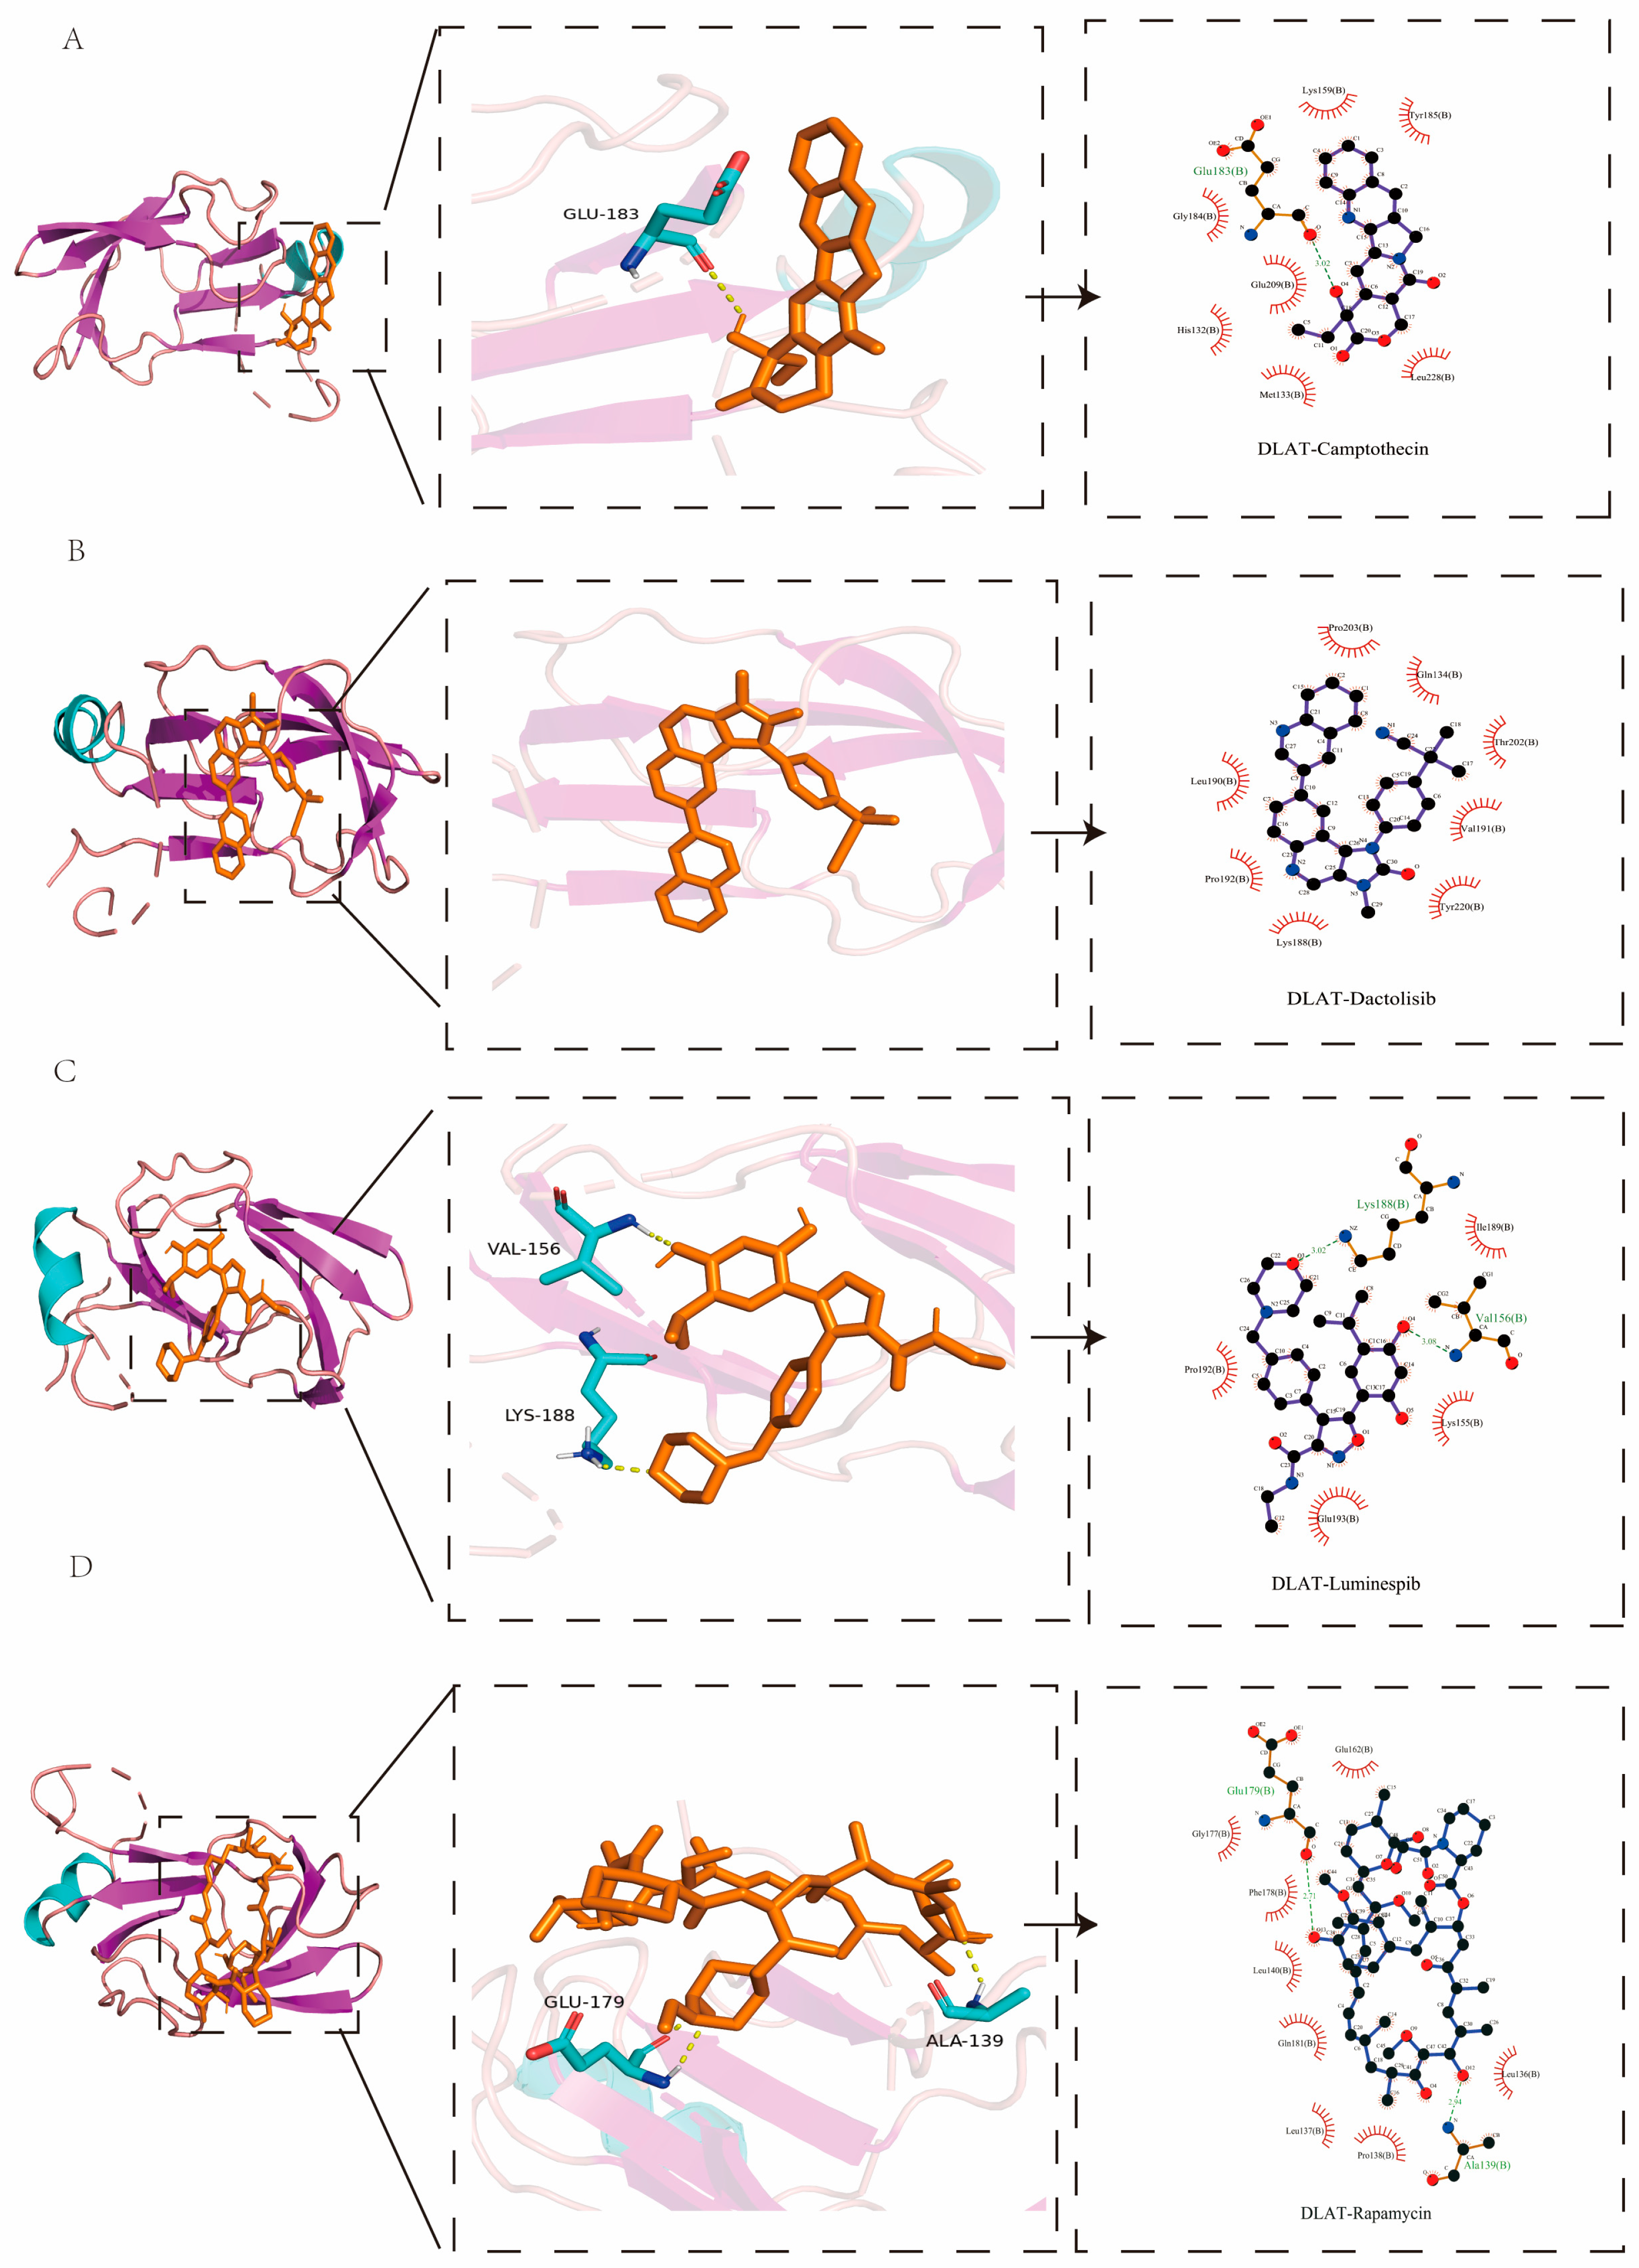
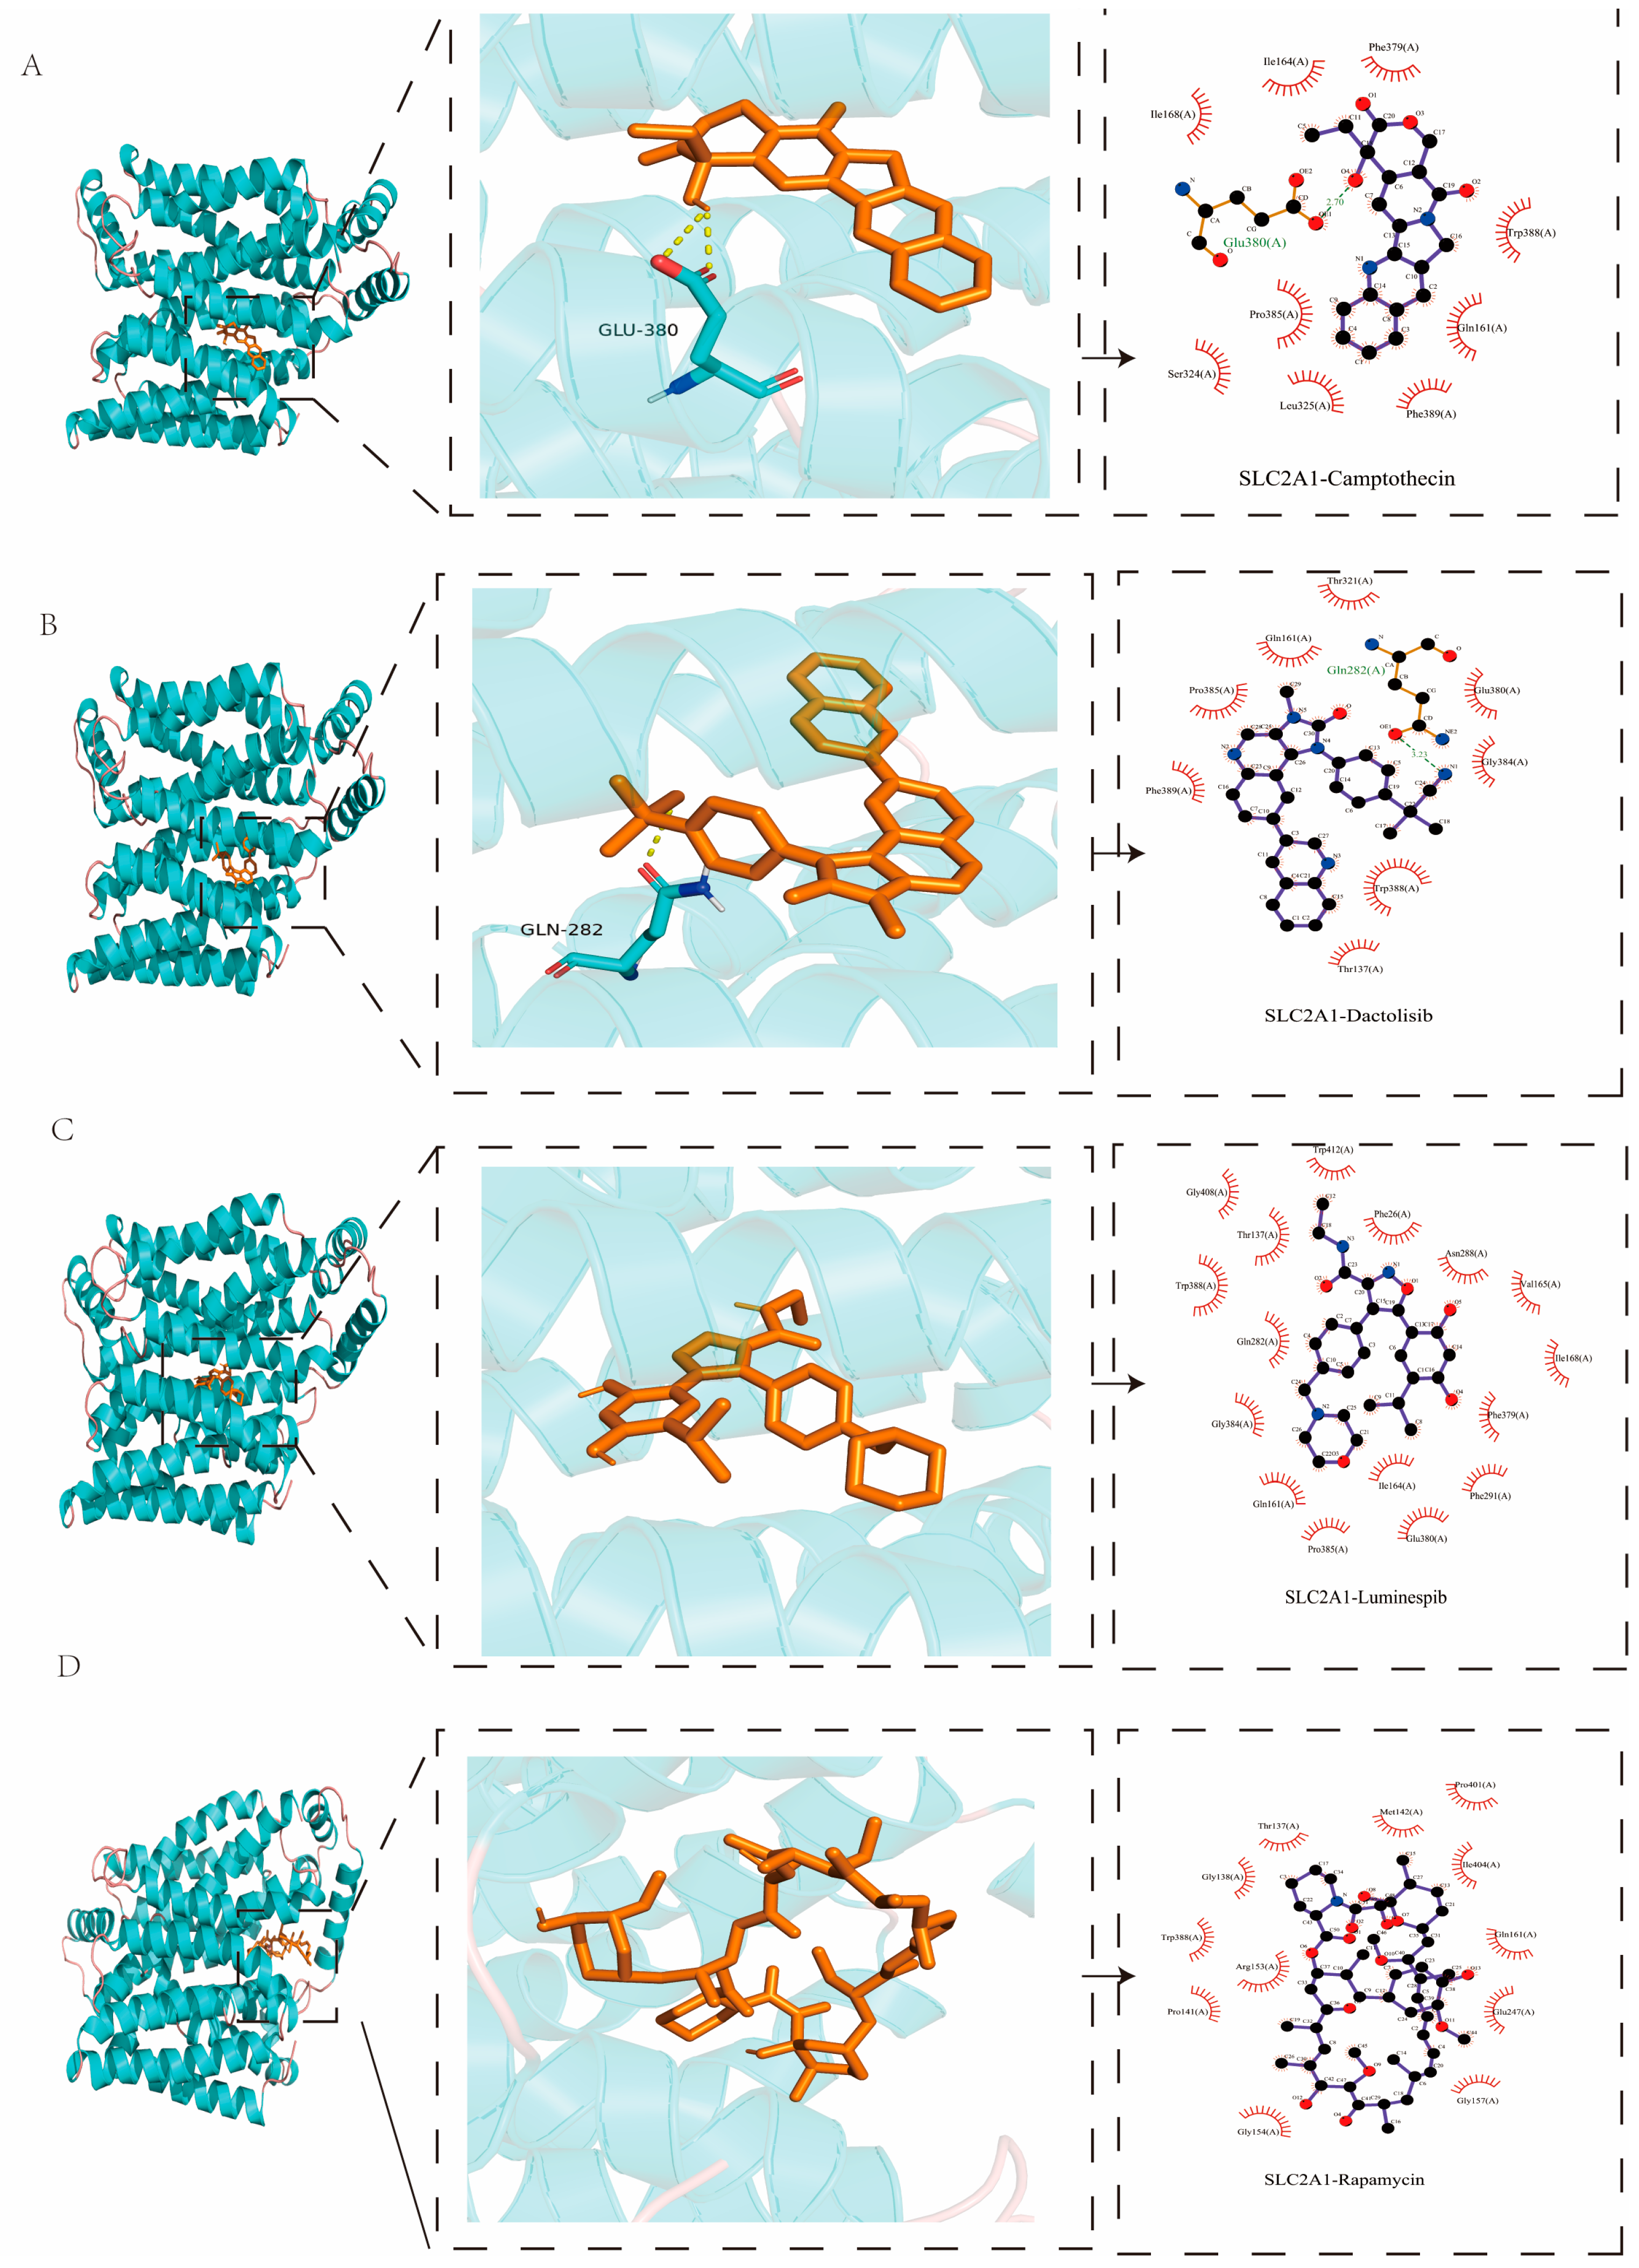
2.8. Molecular Docking Analysis
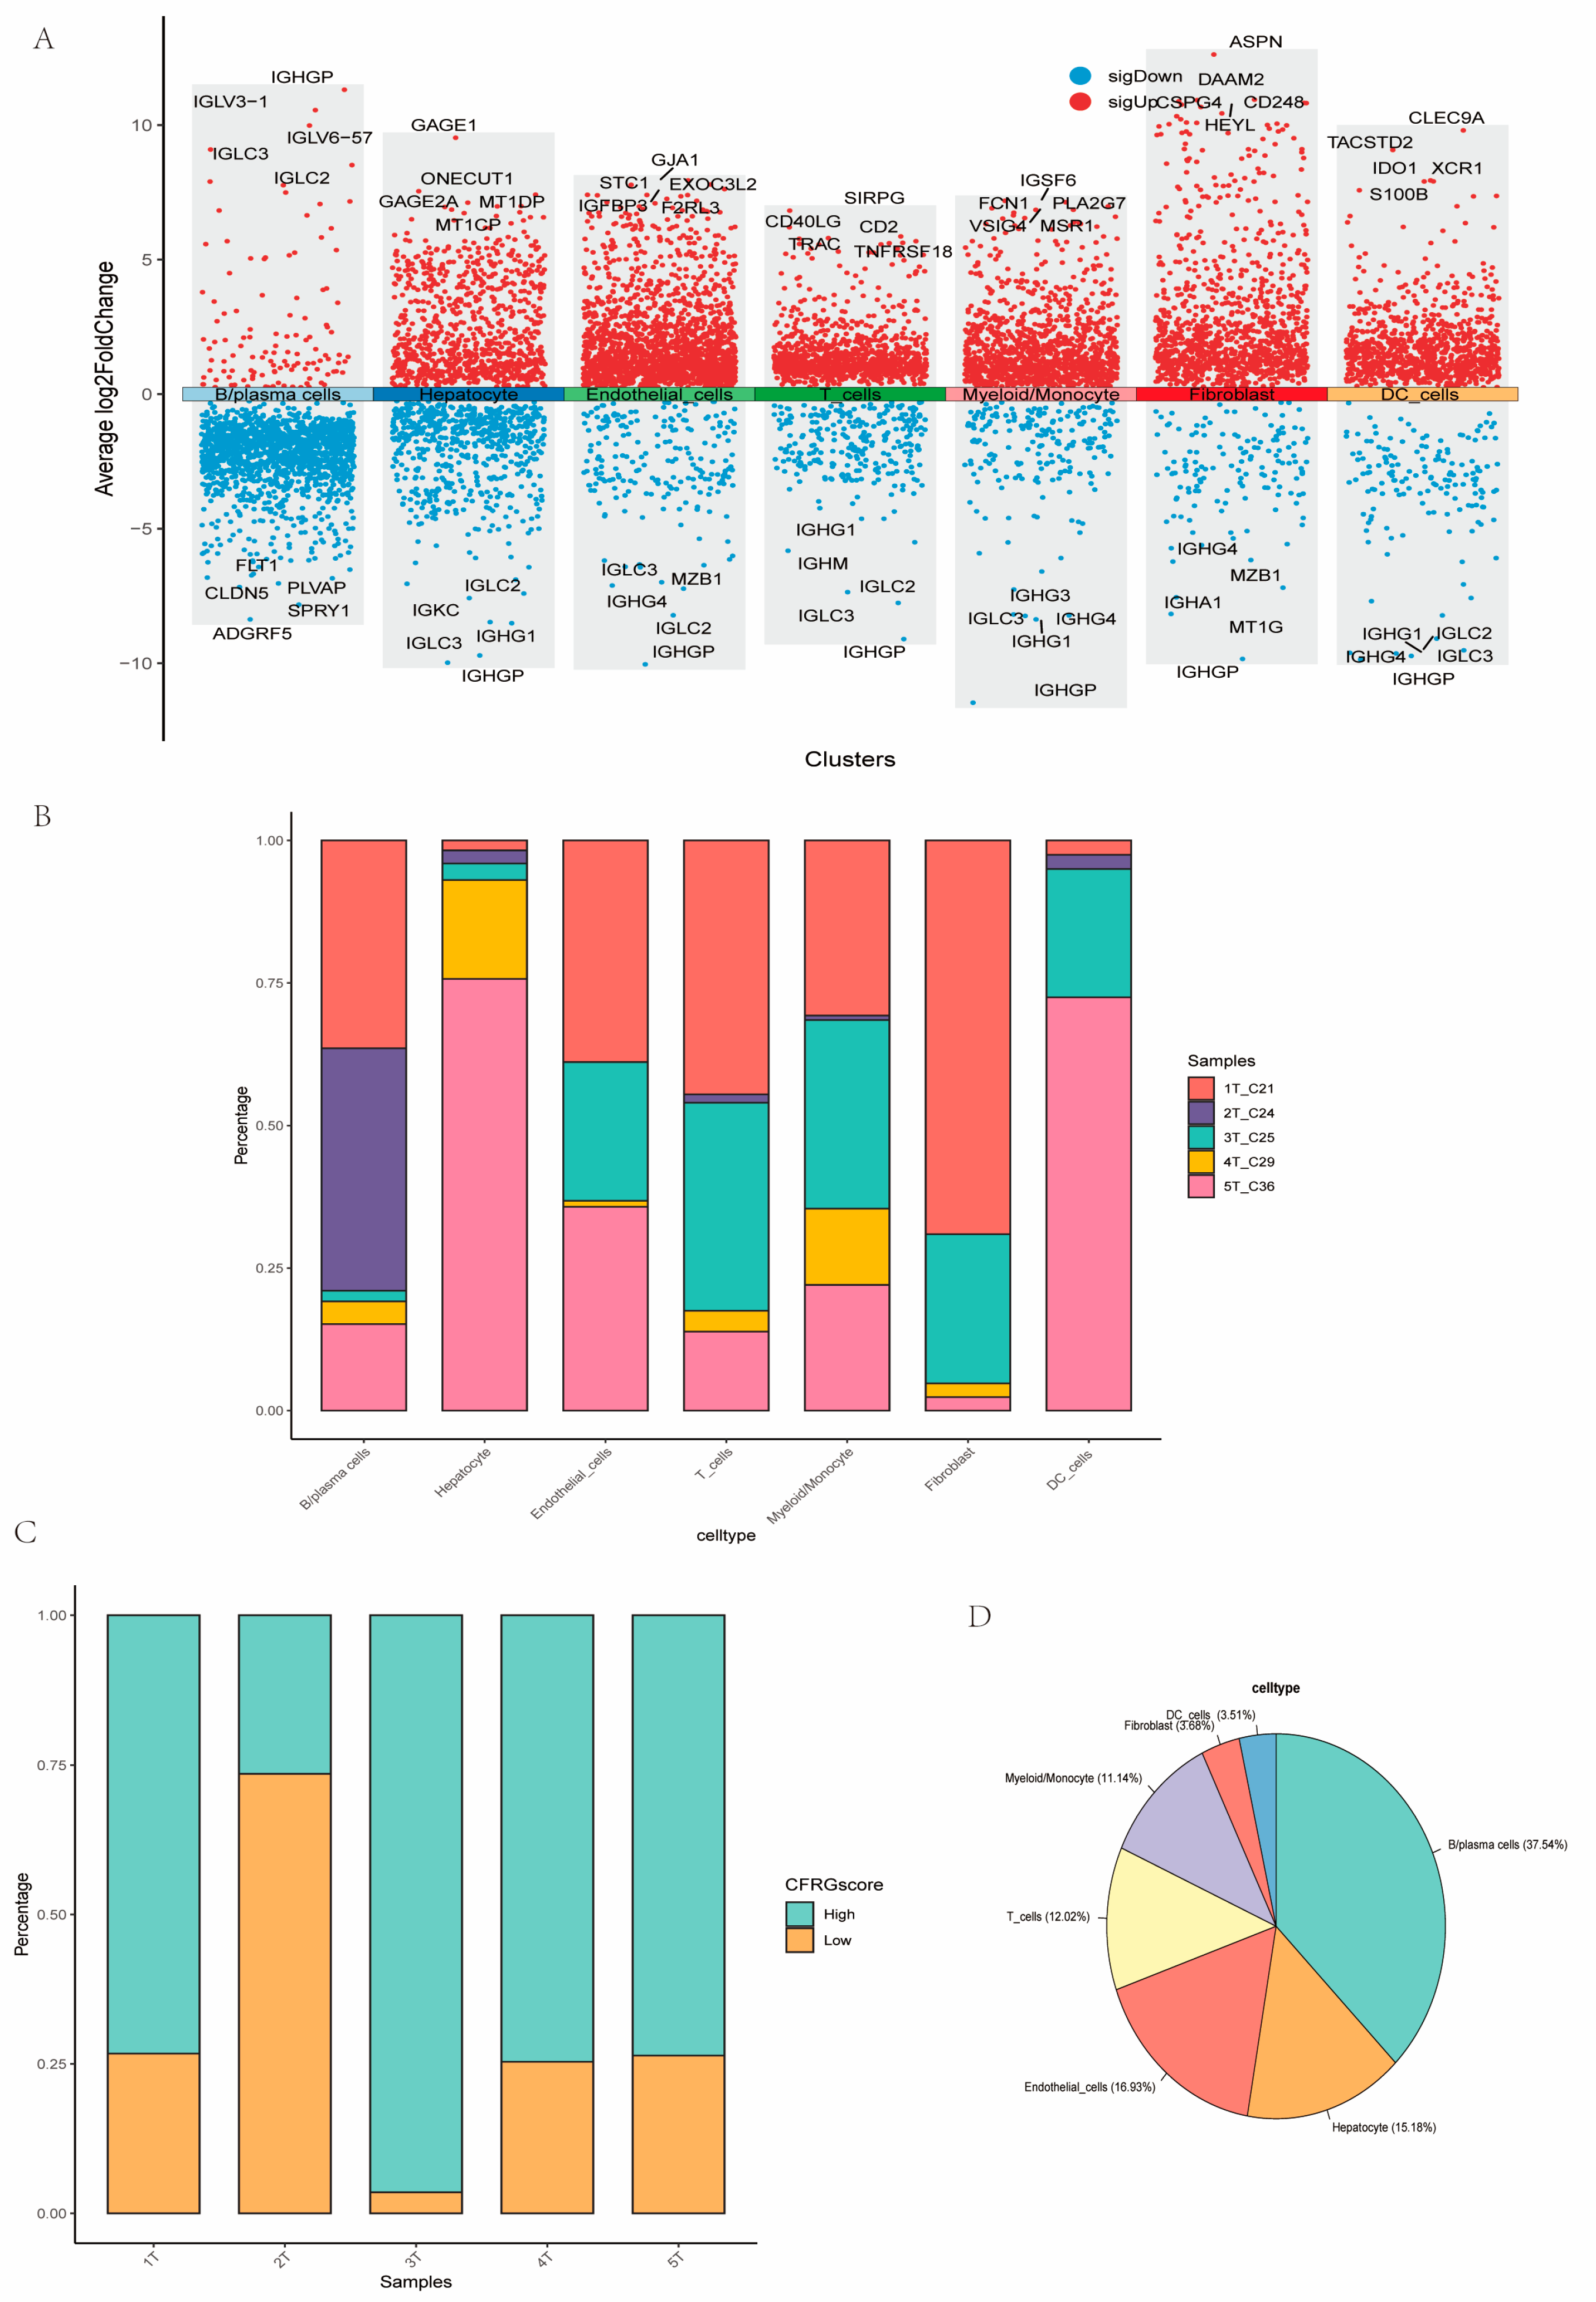
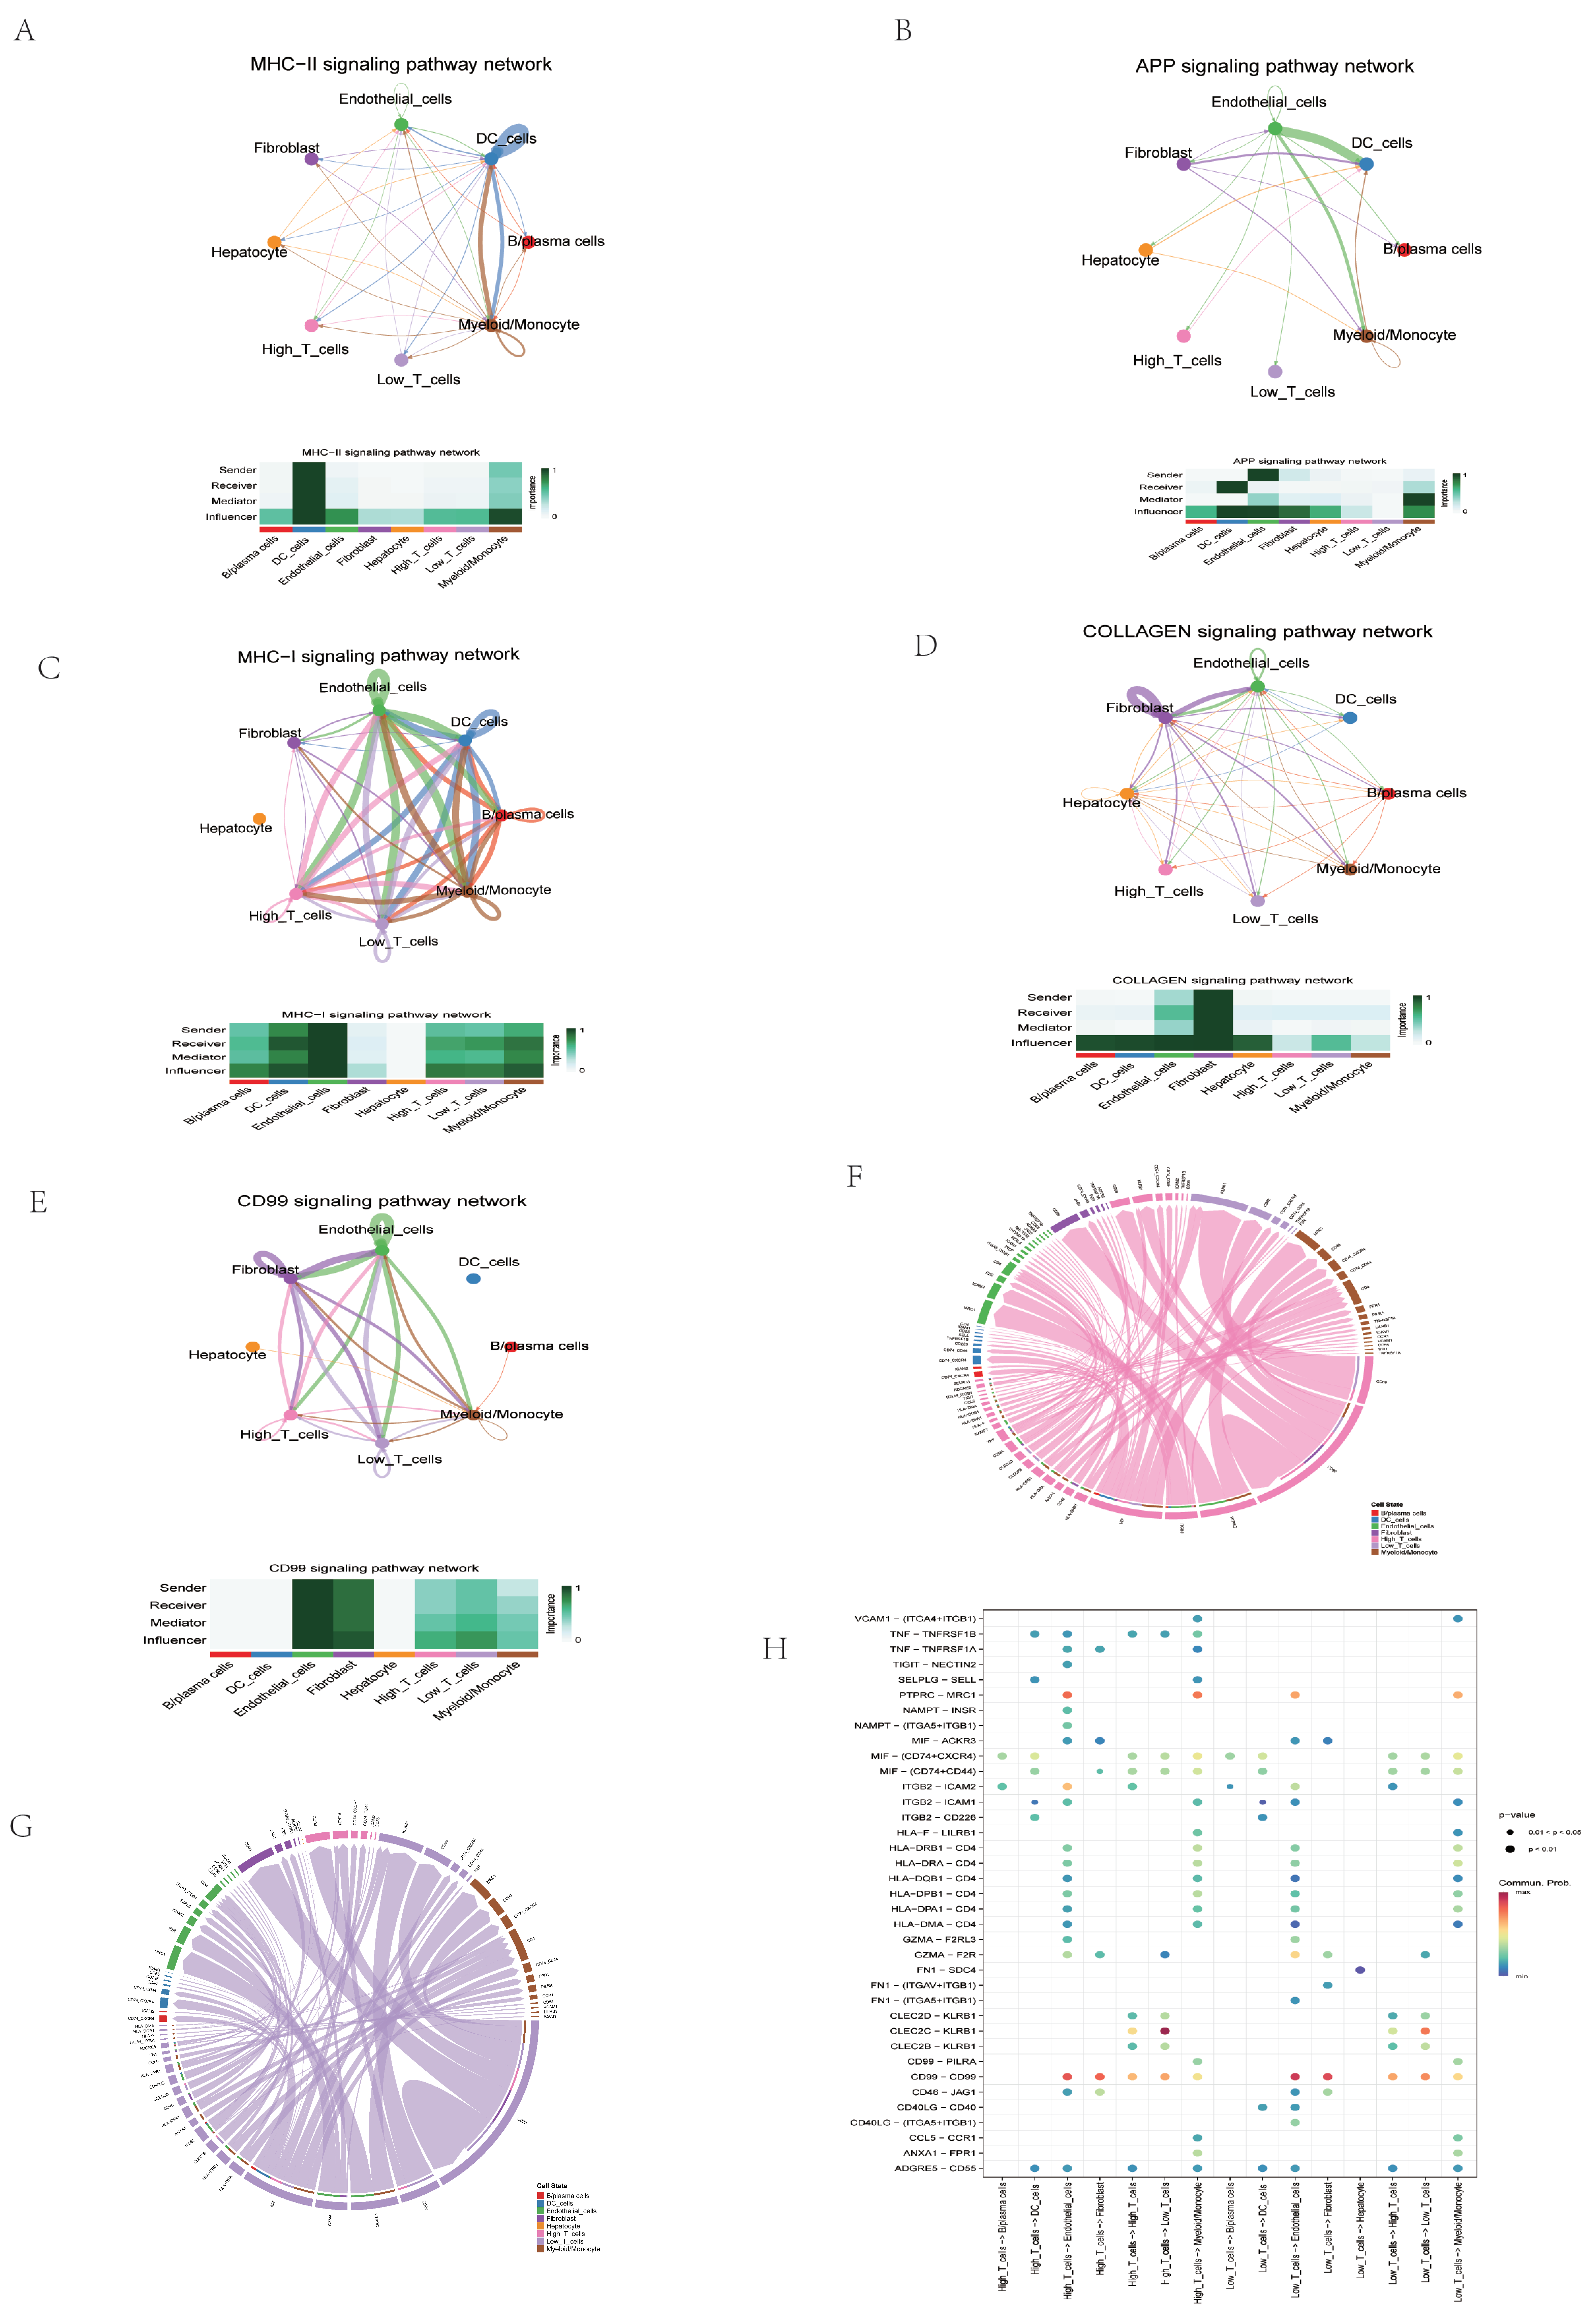
2.9. Assessment of CFRG Score in the Single Cell Dataset
3. Discussion
4. Materials and Methods
4.1. Data Acquisition
4.2. Gene Alterations and Expression Analysis and Prognostic-Related CFRGs
4.3. Consensus Clustering Analysis, GSVA, and ssGSEA
4.4. Establishment of CFRG Score Model
4.5. Assessment of Drug Sensitivity, Immunotherapy Efficacy, Stemness Scores, and Immune Checkpoint Expression Analysis
4.6. Signature Gene Identification Based on CFRG Score and WGCNA
4.7. Candidate Drug Prediction and Molecular Docking
4.8. scRNA-Seq Data Preprocessing and Evaluation of CFRG Score
4.9. Statistical Analysis
5. Conclusions
Supplementary Materials
Author Contributions
Funding
Institutional Review Board Statement
Informed Consent Statement
Data Availability Statement
Acknowledgments
Conflicts of Interest
Abbreviations
References
- Sung, H.; Ferlay, J.; Siegel, R.L.; Laversanne, M.; Soerjomataram, I.; Jemal, A.; Bray, F. Global cancer statistics 2020: GLOBOCAN estimates of incidence and mortality worldwide for 36 cancers in 185 countries. CA Cancer J. Clin. 2021, 71, 209–249. [Google Scholar] [CrossRef] [PubMed]
- Santagata, S.; Rea, G.; Castaldo, D.; Napolitano, M.; Capiluongo, A.; D’Alterio, C.; Trotta, A.M.; Ieranò, C.; Portella, L.; Di Maro, S.; et al. Hepatocellular carcinoma (HCC) tumor microenvironment is more suppressive than colorectal cancer liver metastasis (CRLM) tumor microenvironment. Hepatol. Int. 2024, 18, 568–581. [Google Scholar] [CrossRef] [PubMed]
- Sundi, P.R.I.O.; Thipe, V.C.; Omar, M.A.; Adelusi, T.I.; Gedefa, J.; Olaoba, O.T. Preclinical Human and Murine Models of Hepatocellular Carcinoma (HCC). Clin. Res. Hepatol. Gastroenterol. 2024, 48, 102418. [Google Scholar] [CrossRef]
- Dragani, T.A. Risk of HCC: Genetic heterogeneity and complex genetics. J. Hepatol. 2010, 52, 252–257. [Google Scholar] [CrossRef]
- Oh, J.H.; Jun, D.W. The latest global burden of liver cancer: A past and present threat. Clin. Mol. Hepatol. 2023, 29, 355–357. [Google Scholar] [CrossRef] [PubMed]
- Tadokoro, T.; Tani, J.; Morishita, A.; Fujita, K.; Masaki, T.; Kobara, H. The Treatment of Hepatocellular Carcinoma with Major Vascular Invasion. Cancers 2024, 16, 2534. [Google Scholar] [CrossRef]
- Pham, L.; Kyritsi, K.; Zhou, T.; Ceci, L.; Baiocchi, L.; Kennedy, L.; Chakraborty, S.; Glaser, S.; Francis, H.; Alpini, G.; et al. The functional roles of immune cells in primary liver cancer. Am. J. Pathol. 2022, 192, 826–836. [Google Scholar] [CrossRef]
- Sagnelli, E.; Macera, M.; Russo, A.; Coppola, N.; Sagnelli, C. Epidemiological and etiological variations in hepatocellular carcinoma. Infection 2020, 48, 7–17. [Google Scholar] [CrossRef]
- Barcena-Varela, M.; Lujambio, A. The endless sources of hepatocellular carcinoma heterogeneity. Cancers 2021, 13, 2621. [Google Scholar] [CrossRef]
- Llovet, J.M.; Ricci, S.; Mazzaferro, V.; Hilgard, P.; Gane, E.; Blanc, J.F.; De Oliveira, A.C.; Santoro, A.; Raoul, J.L.; Forner, A.; et al. Sorafenib in advanced hepatocellular carcinoma. N. Engl. J. Med. 2008, 359, 378–390. [Google Scholar] [CrossRef]
- Villanueva, A. Hepatocellular carcinoma. N. Engl. J. Med. 2019, 380, 1450–1462. [Google Scholar] [CrossRef] [PubMed]
- Pan, D.; Liu, H.N.; Qu, P.F.; Ma, X.; Ma, L.Y.; Chen, X.X.; Wang, Y.Q.; Qin, X.B.; Han, Z.X. Progress in the treatment of advanced hepatocellular carcinoma with immune combination therapy. World J. Gastrointest. Oncol. 2024, 16, 273. [Google Scholar] [CrossRef] [PubMed]
- Shi, X.; Shi, D.; Yin, Y.; Wu, Y.; Chen, W.; Yu, Y.; Wang, X. Cuproptosis-associated genes (CAGs) contribute to the prognosis prediction and potential therapeutic targets in hepatocellular carcinoma. Cell. Signal. 2024, 117, 111072. [Google Scholar] [CrossRef]
- Ladd, A.D.; Duarte, S.; Sahin, I.; Zarrinpar, A. Mechanisms of drug resistance in HCC. Hepatology 2024, 79, 926–940. [Google Scholar] [CrossRef]
- Yan, T.; Yu, L.; Zhang, N.; Peng, C.; Su, G.; Jing, Y.; Zhang, L.; Wu, T.; Cheng, J.; Guo, Q.; et al. The advanced development of molecular targeted therapy for hepatocellular carcinoma. Cancer Biol. Med. 2022, 19, 802. [Google Scholar] [CrossRef]
- Tsvetkov, P.; Coy, S.; Petrova, B.; Dreishpoon, M.; Verma, A.; Abdusamad, M.; Rossen, J.; Joesch-Cohen, L.; Humeidi, R.; Spangler, R.D.; et al. Copper induces cell death by targeting lipoylated TCA cycle proteins. Science 2022, 375, 1254–1261. [Google Scholar] [CrossRef] [PubMed]
- Li, S.R.; Bu, L.L.; Cai, L. Cuproptosis: Lipoylated TCA cycle proteins-mediated novel cell death pathway. Signal Transduct. Target. Ther. 2022, 7, 158. [Google Scholar] [CrossRef] [PubMed]
- Wang, X.; Zhou, M.; Liu, Y.; Si, Z. Cope with copper: From copper linked mechanisms to copper-based clinical cancer therapies. Cancer Lett. 2023, 561, 216157. [Google Scholar] [CrossRef]
- Aishajiang, R.; Liu, Z.; Wang, T.; Zhou, L.; Yu, D. Recent advances in cancer therapeutic copper-based nanomaterials for antitumor therapy. Molecules. 2023, 28, 2303. [Google Scholar] [CrossRef]
- Gao, M.; Yi, J.; Zhu, J.; Minikes, A.M.; Monian, P.; Thompson, C.B.; Jiang, X. Role of mitochondria in ferroptosis. Mol. Cell. 2019, 73, 354–363. [Google Scholar] [CrossRef]
- Ma, Y.; Han, F.; Min, J.; Lin, W. Energy metabolism as a regulator of ferroptosis. Cell Cycle 2020, 19, 2960–2962. [Google Scholar] [CrossRef] [PubMed]
- Qiu, Y.; Cao, Y.; Cao, W.; Jia, Y.; Lu, N. The application of ferroptosis in diseases. Pharmacol. Res. 2020, 159, 104919. [Google Scholar] [CrossRef] [PubMed]
- Xu, H.; Ye, D.; Ren, M.; Zhang, H.; Bi, F. Ferroptosis in the tumor microenvironment: Perspectives for immunotherapy. Trends Mol. Med. 2021, 27, 856–867. [Google Scholar] [CrossRef]
- Yang, S.; Hu, C.; Chen, X.; Tang, Y.; Li, J.; Yang, H.; Yang, Y.; Ying, B.; Xiao, X.; Li, S.Z.; et al. Crosstalk between metabolism and cell death in tumorigenesis. Mol. Cancer 2024, 23, 71. [Google Scholar] [CrossRef]
- Liu, N.; Chen, M. Crosstalk between ferroptosis and cuproptosis: From mechanism to potential clinical application. Biomed. Pharmacother. 2024, 171, 116115. [Google Scholar] [CrossRef]
- Tong, X.; Tang, R.; Xiao, M.; Xu, J.; Wang, W.; Zhang, B.; Liu, J.; Yu, X.; Shi, S. Targeting cell death pathways for cancer therapy: Recent developments in necroptosis, pyroptosis, ferroptosis, and cuproptosis research. J. Hematol. Oncol. 2022, 15, 174. [Google Scholar] [CrossRef]
- Zhao, C.; Zhang, Z.; Jing, T. A novel signature of combing cuproptosis-with ferroptosis-related genes for prediction of prognosis, immunologic therapy responses and drug sensitivity in hepatocellular carcinoma. Front. Oncol. 2022, 12, 1000993. [Google Scholar] [CrossRef] [PubMed]
- Wang, W.; Lu, K.; Jiang, X.; Wei, Q.; Zhu, L.; Wang, X.; Jin, H.; Feng, L. Ferroptosis inducers enhanced cuproptosis induced by copper ionophores in primary liver cancer. J. Exp. Clin. Cancer Res. 2023, 42, 142. [Google Scholar] [CrossRef]
- Shen, Y.; Li, D.; Liang, Q.; Yang, M.; Pan, Y.; Li, H. Cross-talk between cuproptosis and ferroptosis regulators defines the tumor microenvironment for the prediction of prognosis and therapies in lung adenocarcinoma. Front. Immunol. 2023, 13, 1029092. [Google Scholar] [CrossRef]
- Li, J.; Zhang, W.; Ma, X.; Wei, Y.; Zhou, F.; Li, J.; Zhang, C.; Yang, Z. Cuproptosis/ferroptosis-related gene signature is correlated with immune infiltration and predict the prognosis for patients with breast cancer. Front. Pharmacol. 2023, 14, 1192434. [Google Scholar] [CrossRef]
- Lin, D.C.; Mayakonda, A.; Dinh, H.Q.; Huang, P.; Lin, L.; Liu, X.; Ding, L.W.; Wang, J.; Berman, B.P.; Song, E.W.; et al. Genomic and epigenomic heterogeneity of hepatocellular carcinoma. Cancer Res. 2017, 77, 2255–2265. [Google Scholar] [CrossRef] [PubMed]
- Safri, F.; Nguyen, R.; Zerehpooshnesfchi, S.; George, J.; Qiao, L. Heterogeneity of hepatocellular carcinoma: From mechanisms to clinical implications. Cancer Gene Ther. 2024, 31, 1105–1112. [Google Scholar] [CrossRef]
- Cheng, F.; Peng, G.; Lu, Y.; Wang, K.; Ju, Q.; Ju, Y.; Ouyang, M. Relationship between copper and immunity: The potential role of copper in tumor immunity. Front. Oncol. 2022, 12, 1019153. [Google Scholar] [CrossRef] [PubMed]
- Wang, H.; Liu, C.; Zhao, Y.; Gao, G. Mitochondria regulation in ferroptosis. Eur. J. Cell Biol. 2020, 99, 151058. [Google Scholar] [CrossRef]
- Yu, H.; Guo, P.; Xie, X.; Wang, Y.; Chen, G. Ferroptosis, a new form of cell death, and its relationships with tumourous diseases. J. Cell. Mol. Med. 2017, 21, 648–657. [Google Scholar] [CrossRef] [PubMed]
- El-Khoueiry, A.B.; Sangro, B.; Yau, T.; Crocenzi, T.S.; Kudo, M.; Hsu, C.; Kim, T.Y.; Choo, S.P.; Trojan, J.; Welling, T.H.; et al. Nivolumab in patients with advanced hepatocellular carcinoma (CheckMate 040): An open-label, non-comparative, phase 1/2 dose escalation and expansion trial. Lancet 2017, 389, 2492–2502. [Google Scholar] [CrossRef]
- Roessler, S.; Jia, H.L.; Budhu, A.; Forgues, M.; Ye, Q.H.; Lee, J.S.; Thorgeirsson, S.S.; Sun, Z.; Tang, Z.Y.; Qin, L.X.; et al. A unique metastasis gene signature enables prediction of tumor relapse in early-stage hepatocellular carcinoma patients. Cancer Res. 2010, 70, 10202–10212. [Google Scholar] [CrossRef]
- Pinter, M.; Scheiner, B.; Peck-Radosavljevic, M. Immunotherapy for advanced hepatocellular carcinoma: A focus on special subgroups. Gut 2021, 70, 204–214. [Google Scholar] [CrossRef]
- Zhang, Y.; Zhang, Z. The history and advances in cancer immunotherapy: Understanding the characteristics of tumor-infiltrating immune cells and their therapeutic implications. Cell. Mol. Immunol. 2020, 17, 807–821. [Google Scholar] [CrossRef]
- Pérez-Ruiz, E.; Melero, I.; Kopecka, J.; Sarmento-Ribeiro, A.B.; García-Aranda, M.; De Las Rivas, J. Cancer immunotherapy resistance based on immune checkpoints inhibitors: Targets, biomarkers, and remedies. Drug Resist. Updates 2020, 53, 100718. [Google Scholar] [CrossRef]
- Fu, Y.; Liu, S.; Zeng, S.; Shen, H. From bench to bed: The tumor immune microenvironment and current immunotherapeutic strategies for hepatocellular carcinoma. J. Exp. Clin. Cancer Res. 2019, 38, 396. [Google Scholar] [CrossRef] [PubMed]
- Cheng, A.L.; Guan, Z.; Chen, Z.; Tsao, C.J.; Qin, S.; Kim, J.S.; Yang, T.S.; Tak, W.Y.; Pan, H.; Yu, S.; et al. Efficacy and safety of sorafenib in patients with advanced hepatocellular carcinoma according to baseline status: Subset analyses of the phase III Sorafenib Asia-Pacific trial. Eur. J. Cancer 2012, 48, 1452–1465. [Google Scholar] [CrossRef]
- Trevisani, F.; Brandi, G.; Garuti, F.; Barbera, M.A.; Tortora, R.; Casadei Gardini, A.; Granito, A.; Tovoli, F.; De Lorenzo, S.; Inghilesi, A.L.; et al. Metronomic capecitabine as second-line treatment for hepatocellular carcinoma after sorafenib discontinuation. J. Cancer Res. Clin. Oncol. 2018, 144, 403–414. [Google Scholar] [CrossRef] [PubMed]
- Stefanini, B.; Bucci, L.; Santi, V.; Reggidori, N.; Lani, L.; Granito, A.; Pelizzaro, F.; Cabibbo, G.; Di Marco, M.; Ghittoni, G.; et al. Sorafenib and Metronomic Capecitabine in Child-Pugh B patients with advanced HCC: A real-life comparison with best supportive care. Dig. Liver Dis. 2024, 56, 1582–1591. [Google Scholar] [CrossRef]
- Yano, S.; Kawaoka, T.; Yamasaki, S.; Johira, Y.; Kosaka, M.; Shirane, Y.; Miura, R.; Amioka, K.; Naruto, K.; Yamaoka, K.; et al. Therapeutic Efficacy and Safety of Lenvatinib after Atezolizumab Plus Bevacizumab for Unresectable Hepatocellular Carcinoma. Cancers 2023, 15, 5406. [Google Scholar] [CrossRef] [PubMed]
- Tella, S.H.; Kommalapati, A.; Mahipal, A.; Jin, Z. First-Line Targeted Therapy for Hepatocellular Carcinoma: Role of Atezolizumab/Bevacizumab Combination. Biomedicines 2022, 10, 1304. [Google Scholar] [CrossRef]
- Shang, R.; Song, X.; Wang, P.; Zhou, Y.; Lu, X.; Wang, J.; Xu, M.; Chen, X.; Utpatel, K.; Che, L.; et al. Cabozantinib-based combination therapy for the treatment of hepatocellular carcinoma. Gut 2021, 70, 1746–1757. [Google Scholar] [CrossRef]
- Bu, X.; Liu, S.; Wen, D.; Kan, A.; Xu, Y.; Lin, X.; Shi, M. Comprehensive characterization of enhancer RNA in hepatocellular carcinoma reveals three immune subtypes with implications for immunotherapy. Mol. Ther. Oncolyt. 2022, 26, 226–244. [Google Scholar] [CrossRef]
- Federico, P.; Petrillo, A.; Giordano, P.; Bosso, D.; Fabbrocini, A.; Ottaviano, M.; Rosanova, M.; Silvestri, A.; Tufo, A.; Cozzolino, A.; et al. Immune checkpoint inhibitors in hepatocellular carcinoma: Current status and novel perspectives. Cancers 2020, 12, 3025. [Google Scholar] [CrossRef]
- Wang, W.; Liu, Z.; Zhou, X.; Guo, Z.; Zhang, J.; Zhu, P.; Yao, S.; Zhu, M. Ferritin nanoparticle-based SpyTag/SpyCatcher-enabled click vaccine for tumor immunotherapy. Nanomedicine 2019, 16, 69–78. [Google Scholar] [CrossRef]
- Gao, W.; Wang, X.; Zhou, Y.; Wang, X.; Yu, Y. Autophagy, ferroptosis, pyroptosis, and necroptosis in tumor immunotherapy. Signal Transduct. Target Ther. 2022, 7, 196. [Google Scholar] [CrossRef] [PubMed]
- Bao, M.H.; Wong, C.C. Hypoxia, metabolic reprogramming, and drug resistance in liver cancer. Cells 2021, 10, 1715. [Google Scholar] [CrossRef] [PubMed]
- Gao, F.; Yuan, Y.; Ding, Y.; Li, P.Y.; Chang, Y.; He, X.X. DLAT as a cuproptosis promoter and a molecular target of elesclomol in hepatocellular carcinoma. Curr. Med. Sci. 2023, 43, 526–538. [Google Scholar] [CrossRef] [PubMed]
- Zhang, P.; Zhao, J.H.; Yuan, L.X.; Ju, L.L.; Wang, H.X.; Wang, F.; Chen, L.; Cai, W.H. DLAT is a promising prognostic marker and therapeutic target for hepatocellular carcinoma: A comprehensive study based on public databases. Sci. Rep. 2023, 13, 17295. [Google Scholar] [CrossRef]
- Li, Z.; Zhou, H.; Zhai, X.; Gao, L.; Yang, M.; An, B.; Xia, T.; Du, G.; Li, X.; Wang, W.; et al. MELK promotes HCC carcinogenesis through modulating cuproptosis-related gene DLAT-mediated mitochondrial function. Cell Death Dis. 2023, 14, 733. [Google Scholar] [CrossRef]
- Kim, Y.H.; Jeong, D.C.; Pak, K.; Han, M.E.; Kim, J.Y.; Liangwen, L.; Kim, H.J.; Kim, T.W.; Kim, T.H.; Hyun, D.W.; et al. SLC2A2 (GLUT2) as a novel prognostic factor for hepatocellular carcinoma. Oncotarget 2017, 8, 68381. [Google Scholar] [CrossRef]
- Peng, Q.; Hao, L.; Guo, Y.; Zhang, Z.; Ji, J.; Xue, Y.; Liu, Y.; Li, C.; Lu, J.; Shi, X. Dihydroartemisinin inhibited the Warburg effect through YAP1/SLC2A1 pathway in hepatocellular carcinoma. J. Nat. Med. 2023, 77, 28–40. [Google Scholar] [CrossRef]
- Wilkerson, M.D.; Hayes, D.N. ConsensusClusterPlus: A class discovery tool with confidence assessments and item tracking. Bioinformatics 2010, 26, 1572–1573. [Google Scholar] [CrossRef]


| Protein | PDB ID | Targets | Affinity (kcal/mol) |
|---|---|---|---|
| DLAT | 1Y8N | Camptothecin | −8.1 |
| Rapamycin | −7.6 | ||
| Dactolisib | −7.6 | ||
| Luminespib | −7.5 | ||
| SLC2A1 | 4PYP | Dactolisib | −12.6 |
| Luminespib | −12.5 | ||
| Camptothecin | −10.8 | ||
| Rapamycin | −9.9 |
Disclaimer/Publisher’s Note: The statements, opinions and data contained in all publications are solely those of the individual author(s) and contributor(s) and not of MDPI and/or the editor(s). MDPI and/or the editor(s) disclaim responsibility for any injury to people or property resulting from any ideas, methods, instructions or products referred to in the content. |
© 2025 by the authors. Licensee MDPI, Basel, Switzerland. This article is an open access article distributed under the terms and conditions of the Creative Commons Attribution (CC BY) license (https://creativecommons.org/licenses/by/4.0/).
Share and Cite
Wei, H.; Peng, J. Integrated Analysis of Bulk and Single-Cell RNA Sequencing Data Reveal a Novel Prognostic Signature of Combining Cuproptosis- and Ferroptosis-Related Genes in Hepatocellular Carcinoma. Int. J. Mol. Sci. 2025, 26, 2779. https://doi.org/10.3390/ijms26062779
Wei H, Peng J. Integrated Analysis of Bulk and Single-Cell RNA Sequencing Data Reveal a Novel Prognostic Signature of Combining Cuproptosis- and Ferroptosis-Related Genes in Hepatocellular Carcinoma. International Journal of Molecular Sciences. 2025; 26(6):2779. https://doi.org/10.3390/ijms26062779
Chicago/Turabian StyleWei, Hua, and Jiaxin Peng. 2025. "Integrated Analysis of Bulk and Single-Cell RNA Sequencing Data Reveal a Novel Prognostic Signature of Combining Cuproptosis- and Ferroptosis-Related Genes in Hepatocellular Carcinoma" International Journal of Molecular Sciences 26, no. 6: 2779. https://doi.org/10.3390/ijms26062779
APA StyleWei, H., & Peng, J. (2025). Integrated Analysis of Bulk and Single-Cell RNA Sequencing Data Reveal a Novel Prognostic Signature of Combining Cuproptosis- and Ferroptosis-Related Genes in Hepatocellular Carcinoma. International Journal of Molecular Sciences, 26(6), 2779. https://doi.org/10.3390/ijms26062779