Article

PAR2 Serves an Indispensable Role in Controlling PAR4 Oncogenicity: The β-Catenin–p53 Axis

Sharett Institute of Oncology, Hadassah-Hebrew University Medical Center, Jerusalem 91120, Israel
*
Author to whom correspondence should be addressed.
Int. J. Mol. Sci. 2025, 26(6), 2780; https://doi.org/10.3390/ijms26062780
Submission received: 12 February 2025 / Revised: 18 March 2025 / Accepted: 18 March 2025 / Published: 19 March 2025
(This article belongs to the Section Molecular Oncology)

Abstract

Although the role of G-protein-coupled receptors (GPCRs) in cancer is acknowledged, GPCR-based cancer therapy is rare. Mammalian protease-activated receptors (PARs), a sub-group of GPCRs, comprise four family members, termed PAR1–4. Here, we demonstrate that PAR2 is dominant over PAR4 oncogene in cancer. We performed a knockdown of Par2/f2rl1 and expressed C-terminally truncated PAR2 (TrPAR2), incapable of inducing signaling, to assess the impact of PAR2 on PAR4 oncogenic function by β-catenin stabilization assessment, immunoprecipitation, and xenograft tumor generation in Nude/Nude mice. PAR2 and PAR4 act together to promote tumor generation. Knockdown Par2 and TrPAR2 inhibited the PAR2 and PAR4-induced β-catenin levels, nuclear dishevelled 1(DVL1), and TOPflash reporter activity. Likewise, PAR2 and PAR4-induced invasion and migration were inhibited when Par2 was knocked down or in the presence of TrPAR2. PAR cyclic (4-4) [Pc(4-4)], a PAR-based compound directed toward the PAR pleckstrin homology (PH)-binding site, effectively inhibited PAR2 oncogenic activity. Pc(4-4) inhibition is mediated via the increase in p53 level and the up-regulation of p21 as caspase-3 as well. Overall, we showed that in the absence of PAR2 signaling, the PAR4 pro-tumor functions are significantly inhibited. Pc(4-4) inhibits PAR2 acting via the modification of wt p53, thus offering a powerful drug measure for fighting cancer.

Graphical Abstract

1. Introduction

Despite an increasing understanding of G-protein-coupled receptor (GPCR)-facilitated cancer pathogenesis, little is known about the role of GPCRs in epithelial malignancies. GPCRs comprise a diverse super-family of proteins, which serve as biological targets for pharmaceutical drug design. GPCR-targeted drugs presently represent nearly 30% of all therapeutics directed against a wide range of pathologies. Yet, nearly no GPCR-based drugs are clinically used in cancer [1,2,3].
In the United States (US) alone during 2024, over 2 million (e.g., 2,001,140) new cancer cases were diagnosed and over 600,000 (e.g., 611,720) cancer deaths were reported [4,5]. In fact, the 5-year survival rate for cancer in general has increased from 49% through the mid 1970s to 69% in 2013–2019. This achievement is mainly due to earlier detection, reduced smoking, and the advanced treatments, resulting in over 4 million deaths prevented since 1991.
Frizzled (FZD) receptors, a sub-group of GPCRs, are activated by Wnt ligands to initiate the canonical Wnt/β-catenin pathway. The Wnt/β-catenin signaling pathway regulates embryonic development, tissue homeostasis, and cancer [6]. Once bound to a complex comprising FZD and low-density lipoprotein receptor protein (LRP)5/6 coreceptors, Wnts initiate the β-catenin signaling pathway. This leads to the detachment of β-catenin from its cellular degradation complex, promoting β-catenin stabilization and nuclear translocation, where β-catenin acts as a transcription factor, inducing the level of a specific gene signature. As part of this process, Disheveled (DVL), a cytoplasmic adaptor protein that connects FZD to downstream components, enters the nucleus and becomes part of the transcription complex. A negative layer of regulation is provided by both RNF43 and ZNRF3, ubiquitin ligases that stimulate the degradation of FZD and LRP5/6 co-receptors. As a result of such degradation, membrane receptor availability and downstream β-catenin signaling are markedly reduced [7,8].
Mammalian protease-activated receptors (PARs) correspond to another sub-group of GPCRs and comprise four family members (PAR1–4), all of which are uniquely activated via proteases [9]. Proteases residing within the tumor microenvironment are either immobilized to the extracellular basement membranes as a depot storage site or, when found in a soluble form, are involved in the activation of PARs, contributing to the maintenance of tumor growth and progression. PAR1,3,4 are thrombin receptors and PAR2 is a trypsin receptor. Noticeably, PAR2 and PAR4 can be activated by the same protease. MAPkinase signaling is also involved in PAR-induced tumor growth and progression [9]. We have previously demonstrated that PAR members potently induce β-catenin stabilization, leading to β-catenin nuclear translocation and transcriptional activity [10,11,12,13]. In accordance, we have recently shown that the E3 ubiquitin ligase RNF43 negatively regulates PAR2 cell-surface levels and consequently, PAR2-induced β-catenin signaling, similar to the actions of RNF43 on FZDs. Likewise, PAR2 degradation is rescued by RSPO-LGR5 axis [14]. Hence, it is proposed that PARs GPCRs play a role in the β-catenin stabilization cell signaling.
Advanced bioinformatics tools and DNA sequencing have enabled the characterization of the tumor gene landscape. This has allowed for high-throughput RNA sequence analyses of selected GPCR transcriptional profiles, revealing the expression of 195 GPCRs upon cell reprogramming, leading to cancer-stem-cell (CSC) sphere formation. It was shown that PAR4 (f2rl3) and PAR2 (f2rl1) are considerably up-regulated upon CSC sphere formation [15]. In other studies, PAR4 has emerged as a potent oncogene that is over-expressed in cancer epithelial cells and capable of inducing tumors in vivo [16,17,18,19,20]. We have previously demonstrated that PAR4 is a potent oncogene capable of inducing tumors in a xenograft mouse model, in vivo [21]. In addition, we have shown earlier that Pc(4-4), a lead backbone cyclic peptide [22,23,24] selected out of a cyclic peptide library directed toward PAR2&4 pleckstrin homology (PH)- binding motifs [21,25,26], effectively inhibited tumor growth.
Hierarchy exists within the PAR family. We previously demonstrated that PAR1-promoted cancer processes require the presence of PAR2. This was shown using either a shPar2 knockdown of PAR2 expression or by the use of a truncated form of PAR2 lacking the entire cytoplasmic tail, a variant incapable of promoting cell signaling [27]. This concurs with studies by Sevigny et al. [28], demonstrating that PAR2 affects PAR1 function in neointimal arterial thickening of smooth muscle cell (SMC) growth. It also supports previous work from this group and others on PAR1 and PAR2 trans-activation [29,30]. We now ask what the inter-relations between PAR2 and PAR4 in cancer are.
Indications from various tumor models propose that the Wnt signaling and p53 pathways collaborate to promote tumor growth and progression [31,32]. Indeed, there is a cross-talk between β-catenin and p53 in cancer. Data based on genetic analysis of colorectal cancer (CRC) patients showed induced β-catenin stabilization as a result of mutated APC and β-catenin, together with a high incidence of p53 mutations [33]. In mice carrying mutant p53 (p53R270H), increased intestinal tumor growth and a rise in invasiveness were observed [34]. Moreover, the transformation of normal colonic stem cells via the accumulation of mutated APC, KRAS, and SMAD4 genes failed to metastasize in the presence of wt p53, as occurs in CRC [35,36]. At the same time, the full malignant repertoire of invasive CRC is obtained in the presence of mutated p53R270H [34]. In lung cancer, for example, p53 mutations impact personalized therapy toward epidermal growth factor receptor (EGFR) mutants [37,38].
Indeed, only upon the wt p53 pathway does de-regulated β-catenin fully manifest its oncogenic properties. This also occurs reciprocally, whereby increased levels of wt p53 inhibit de-regulated β-catenin in a variety of cell settings. Therefore, a negative feedback loop links wt p53 and β-catenin, with an interruption of this loop most likely affecting oncogenic β-catenin tumorigenesis [39].
In the present study, our overall aim was to examine functional interactions of PAR2 and PAR4 in colon cancer. This was assessed via PAR-induced β-catenin-signaling events, PAR-PH-Akt association, colony formation, Matrigel invasion in vitro, and tumor development in vivo. In the presence of either knockdown Par2 or truncated (Tr) PAR2 lacking the cytoplasmic tail, a marked inhibition of PAR2&4 signaling events was observed. This indicates the essential role of PAR2 signaling in PAR4-induced tumor growth. Furthermore, a Pc(4-4) compound directed toward the PAR PH-binding motif [21,25] was shown to act through an increase in the level of wt p53. This highlights Pc(4-4) as a promising anti-cancer drug.

2. Results

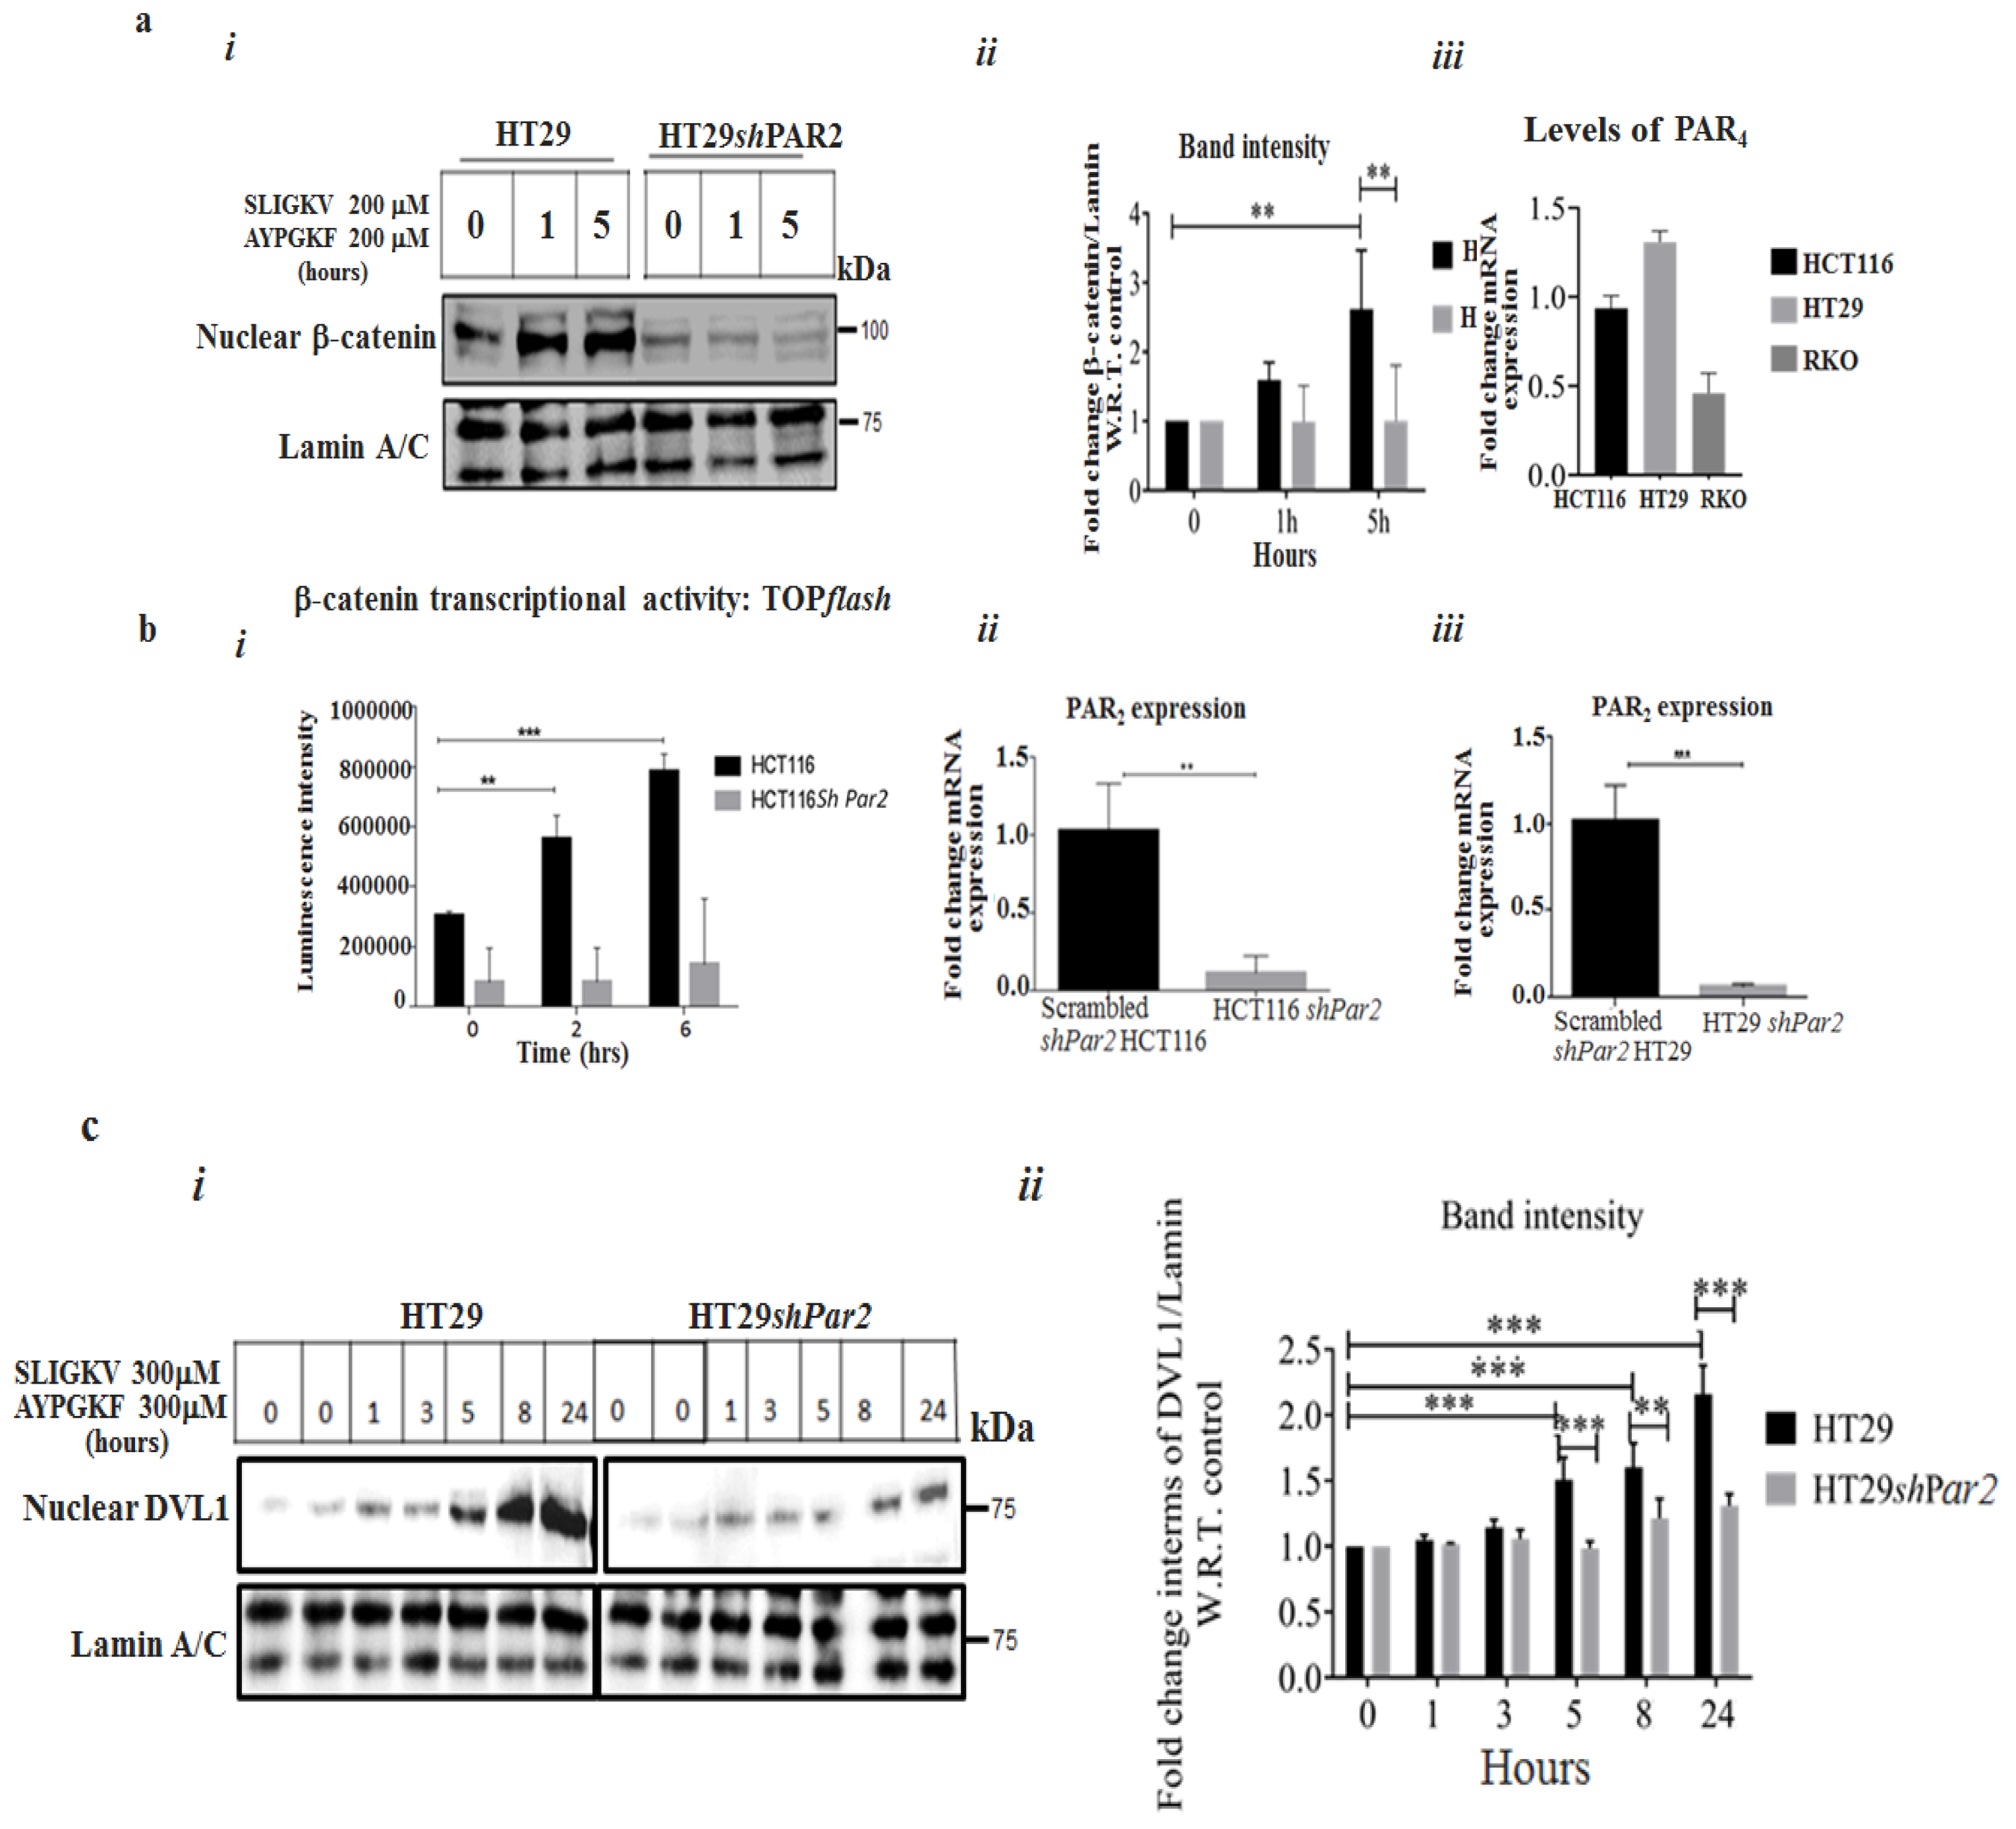
2.1. Knockdown of Par2/f2rl1 Inhibits Events in PAR2 and PAR4-Induced β-Catenin Stabilization and Cell Invasion

Upon the knockdown of Par2 alone, the inhibition of the induced β-catenin level signaling was obtained (Figure 1a(i),a(ii)). High expression levels of both Par2/f2rl1 and Par4/f2rl3 (in addition to other oncogenes) were observed in HCT116 and HT29 cells (Figure 1a(iii)). Significantly, while we previously demonstrated evidence of the potent individual activation of β-catenin stabilization [12,14,40] by PAR2 via the addition of SLIGKV peptide or by PAR4 via AYPGKF peptide, we now aimed to elucidate the relative impact of PAR2 on PAR2 and PAR4 function. For the assessment of the relative impact of Par2/f2rl1 on pro-tumor signaling, we knocked down Par2 using shRNA-Par2 in colon-cancer-cell lines (i.e., HCT116 and HT29). Decreased Par2 levels were observed, compared with those in scrambled shPar2-infected cells (Figure 1b(ii),b(iii)). When combined, the SLIGKV and AYPGKF peptides induced the activation of PAR2 [12] and PAR4, leading to induced β-catenin stabilization. Along this line, an increased TOPflash reporter activity of β-catenin transcription function was obtained following PAR2 and PAR4 activation. When Par2 was knocked down, a marked inhibition of PAR2 and PAR4-induced TOPflash activity was observed (Figure 1b). When levels of β-catenin were evaluated in HT29 cells, high β-catenin levels were seen following peptide SLIGKV- and AYPGKF-mediated PAR2 and PAR4 activation. Upon the silencing of Par2 RNA levels (it is assumed that under these conditions, levels of their respective protein levels are reduced accordingly, although not measured directly) in HT29 cells, a marked inhibition of β-catenin level was seen (Figure 1a(i)–(iii)). The activation of PAR2 induced DVL localization into the cell nucleus. Nuclear DVL now becomes part of a transcriptional complex composed, among others, of c-Jun, β-catenin, and Tcf [41]. While abundant nuclear DVL1 levels were observed following the activation of both PAR2 and PAR4, (Figure 1c(i),c(ii)), upon Par2 knockdown, a significant inhibition of nuclear DVL1 level was obtained. Overall, these results point to the essential requirement of PAR2 expression for PAR2 and PAR4-induced β-catenin stabilization events.
The activation of PAR4 and PAR2 enhanced the invasion of HCT116 cells through Matrigel-coated filter membranes. This stands in contrast to the marked inhibition of PAR2 and PAR4-induced invasion seen when Par2 was knocked down (Figure 2a). Similarly, PAR2 and PAR4 activation resulted in a covering of the space generated in a wound-scratch assay (Figure 2b). When Par2 was silenced, cell proliferation/migration in the assay was potently inhibited.

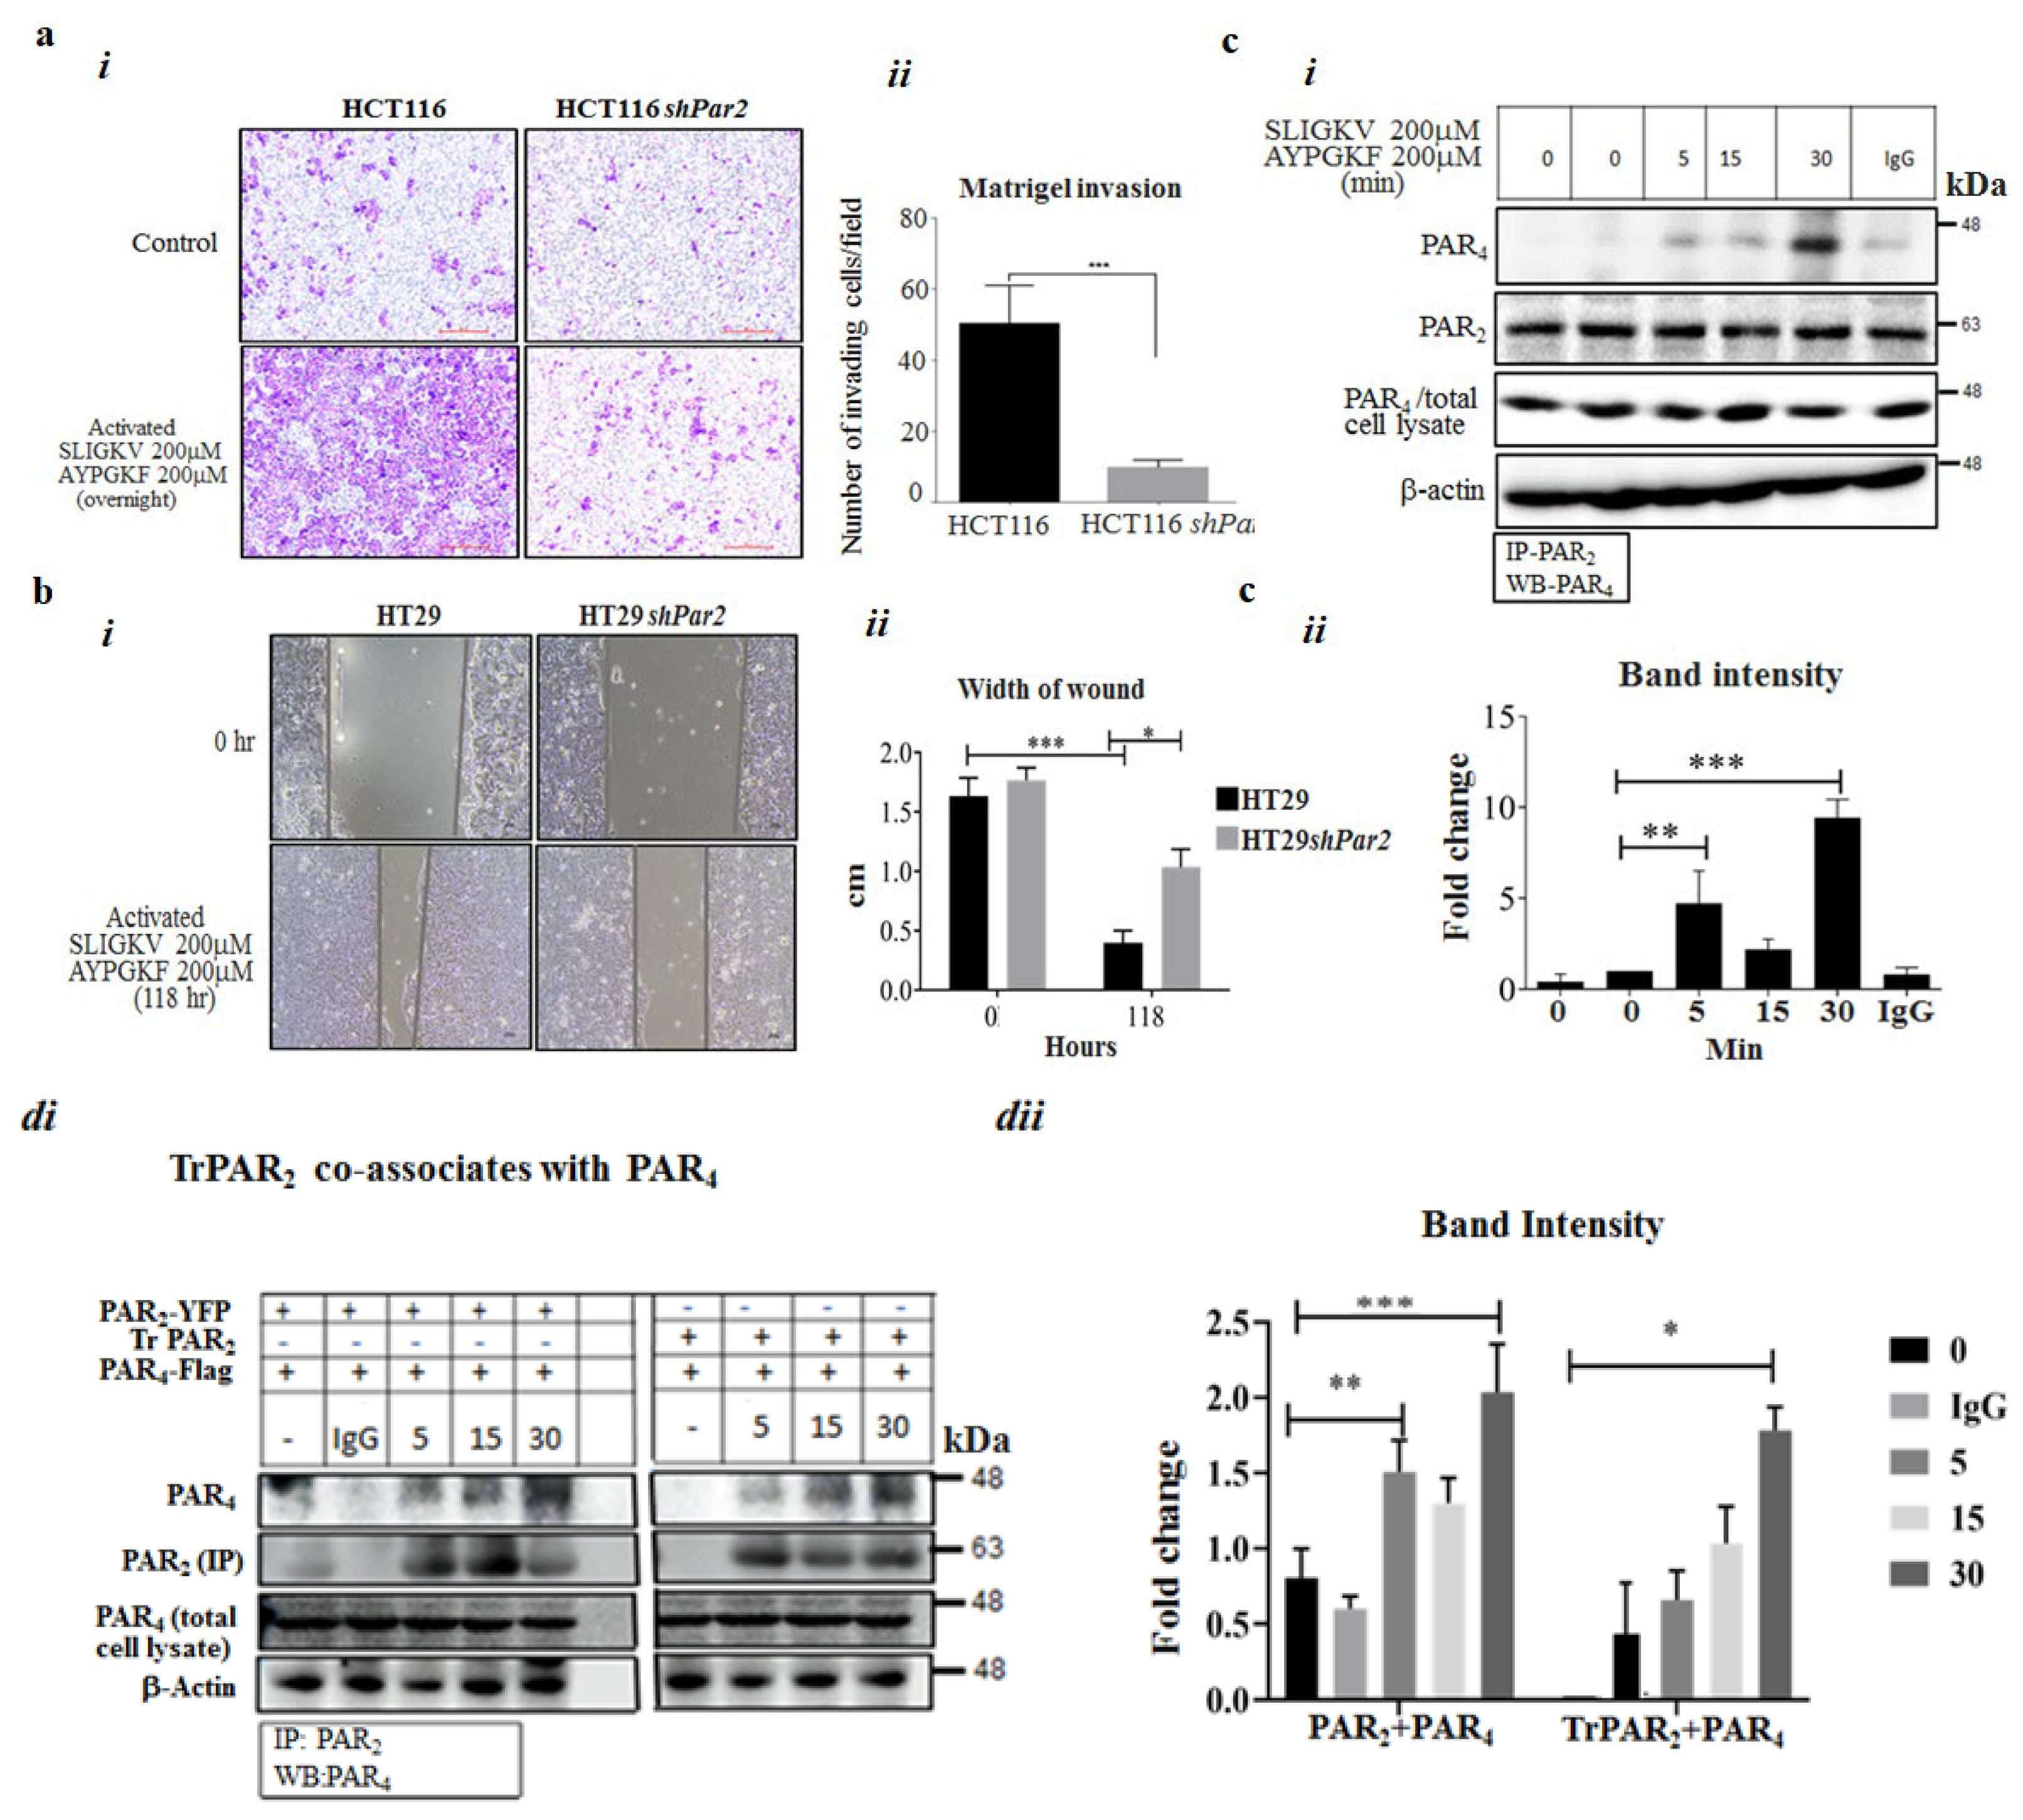
2.2. Co-Association of PAR2 and PAR4

It was suggested that PAR2 and PAR4 are localized in proximity, thereby enabling their action as a single functional unit upon activation. To obtain direct evidence for PAR2–PAR4 heterodimer formation, we performed co-immunoprecipitation (co-IP) analysis. For this purpose, wt Par2 and wt Par4 were ectopically over-expressed in HEK293 cells. The cells were treated with both the SLIGKV and AYPGKF peptides for various intervals and were further processed to obtain cell lysates. Next, IP was carried out using anti-PAR2 antibodies, with IgG serving as a control. As shown, co-association between PAR2 and PAR4 was observed after 5 and 10 min, reaching maximal association after 30 min of activation of both receptors (Figure 2c). This result supports our notion that PAR2 acts in conjunction with PAR4, forming a PAR2–PAR4 complex that can be observed as soon as 5 min after activation and for up to 30 min.
Similarly, a truncated form of PAR2, TrPAR2, lacking the cytoplasmic tail, is capable of co-associating with PAR4, as shown by the co-IP-based capture of PAR4 and TrPAR2 (Figure 2d(i),d(ii)). Co-association was obtained after the transient transfection of HEK293 cells with plasmids containing Par4/f2rl3 and TrPar2/f2rl1, as compared with transfection with plasmid containing both wt Par4/f2rl3 and wt Par2/f2rl1. Maximal co-association was seen after 30 min of activation of both PAR2&4 following activation induced by the AYPGKF and SLIGKV peptides.

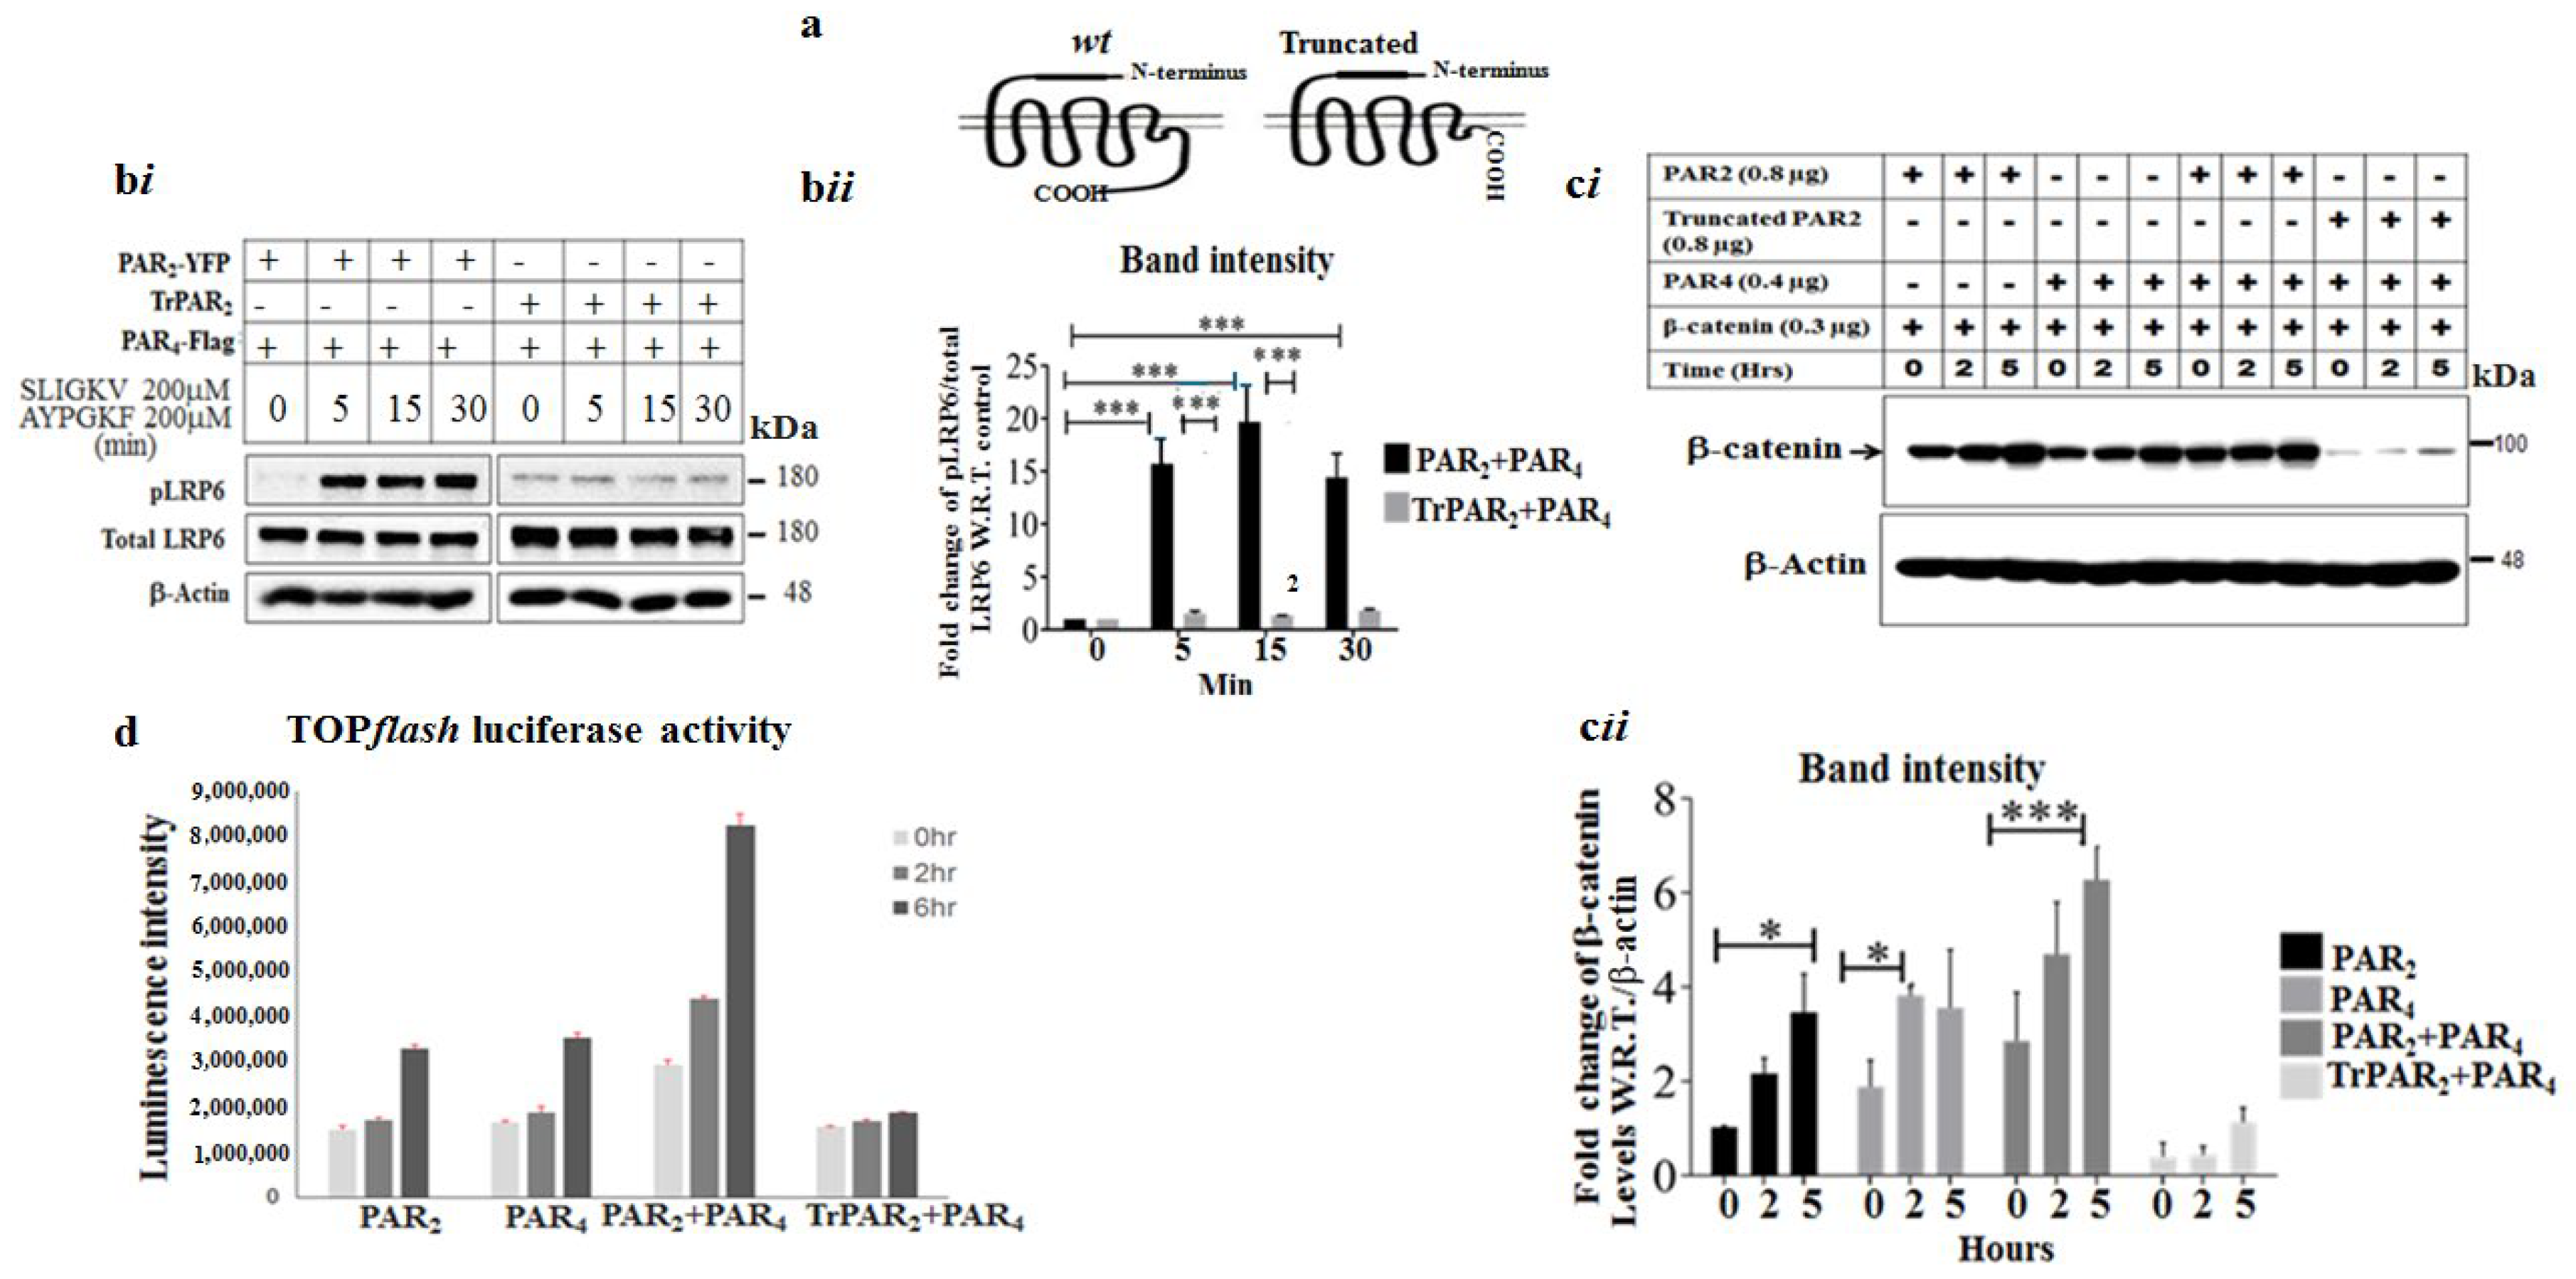
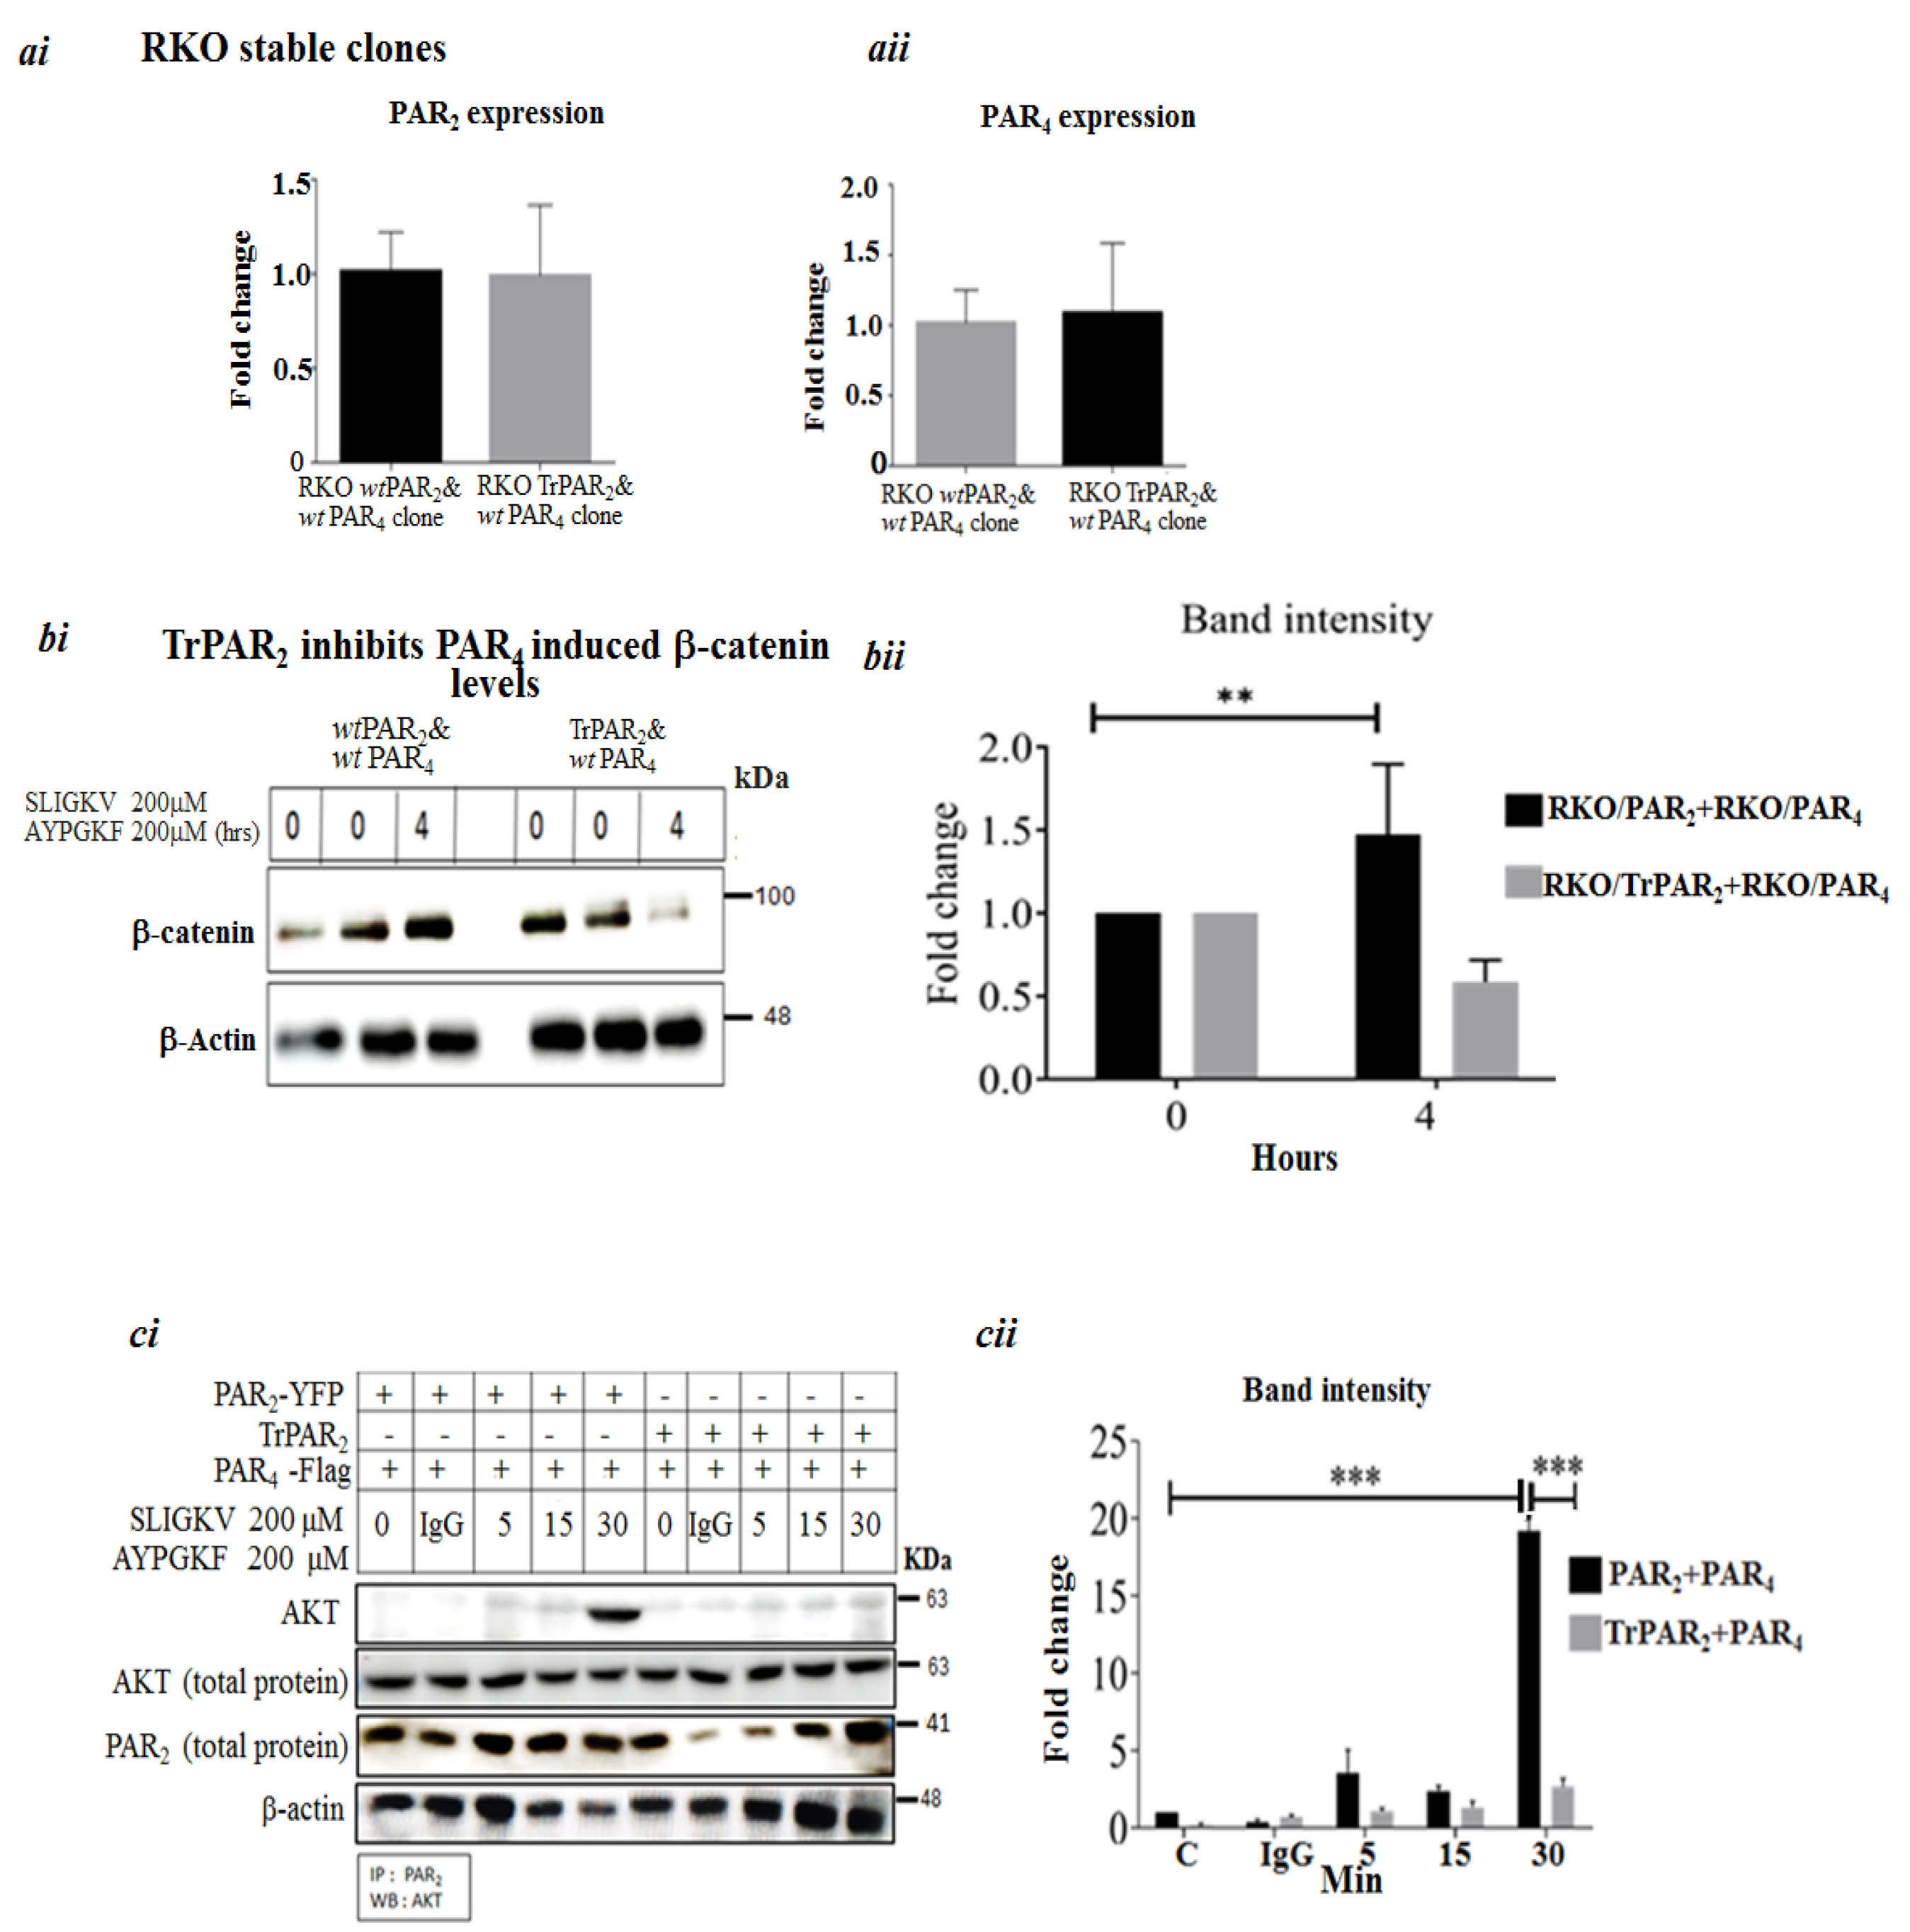
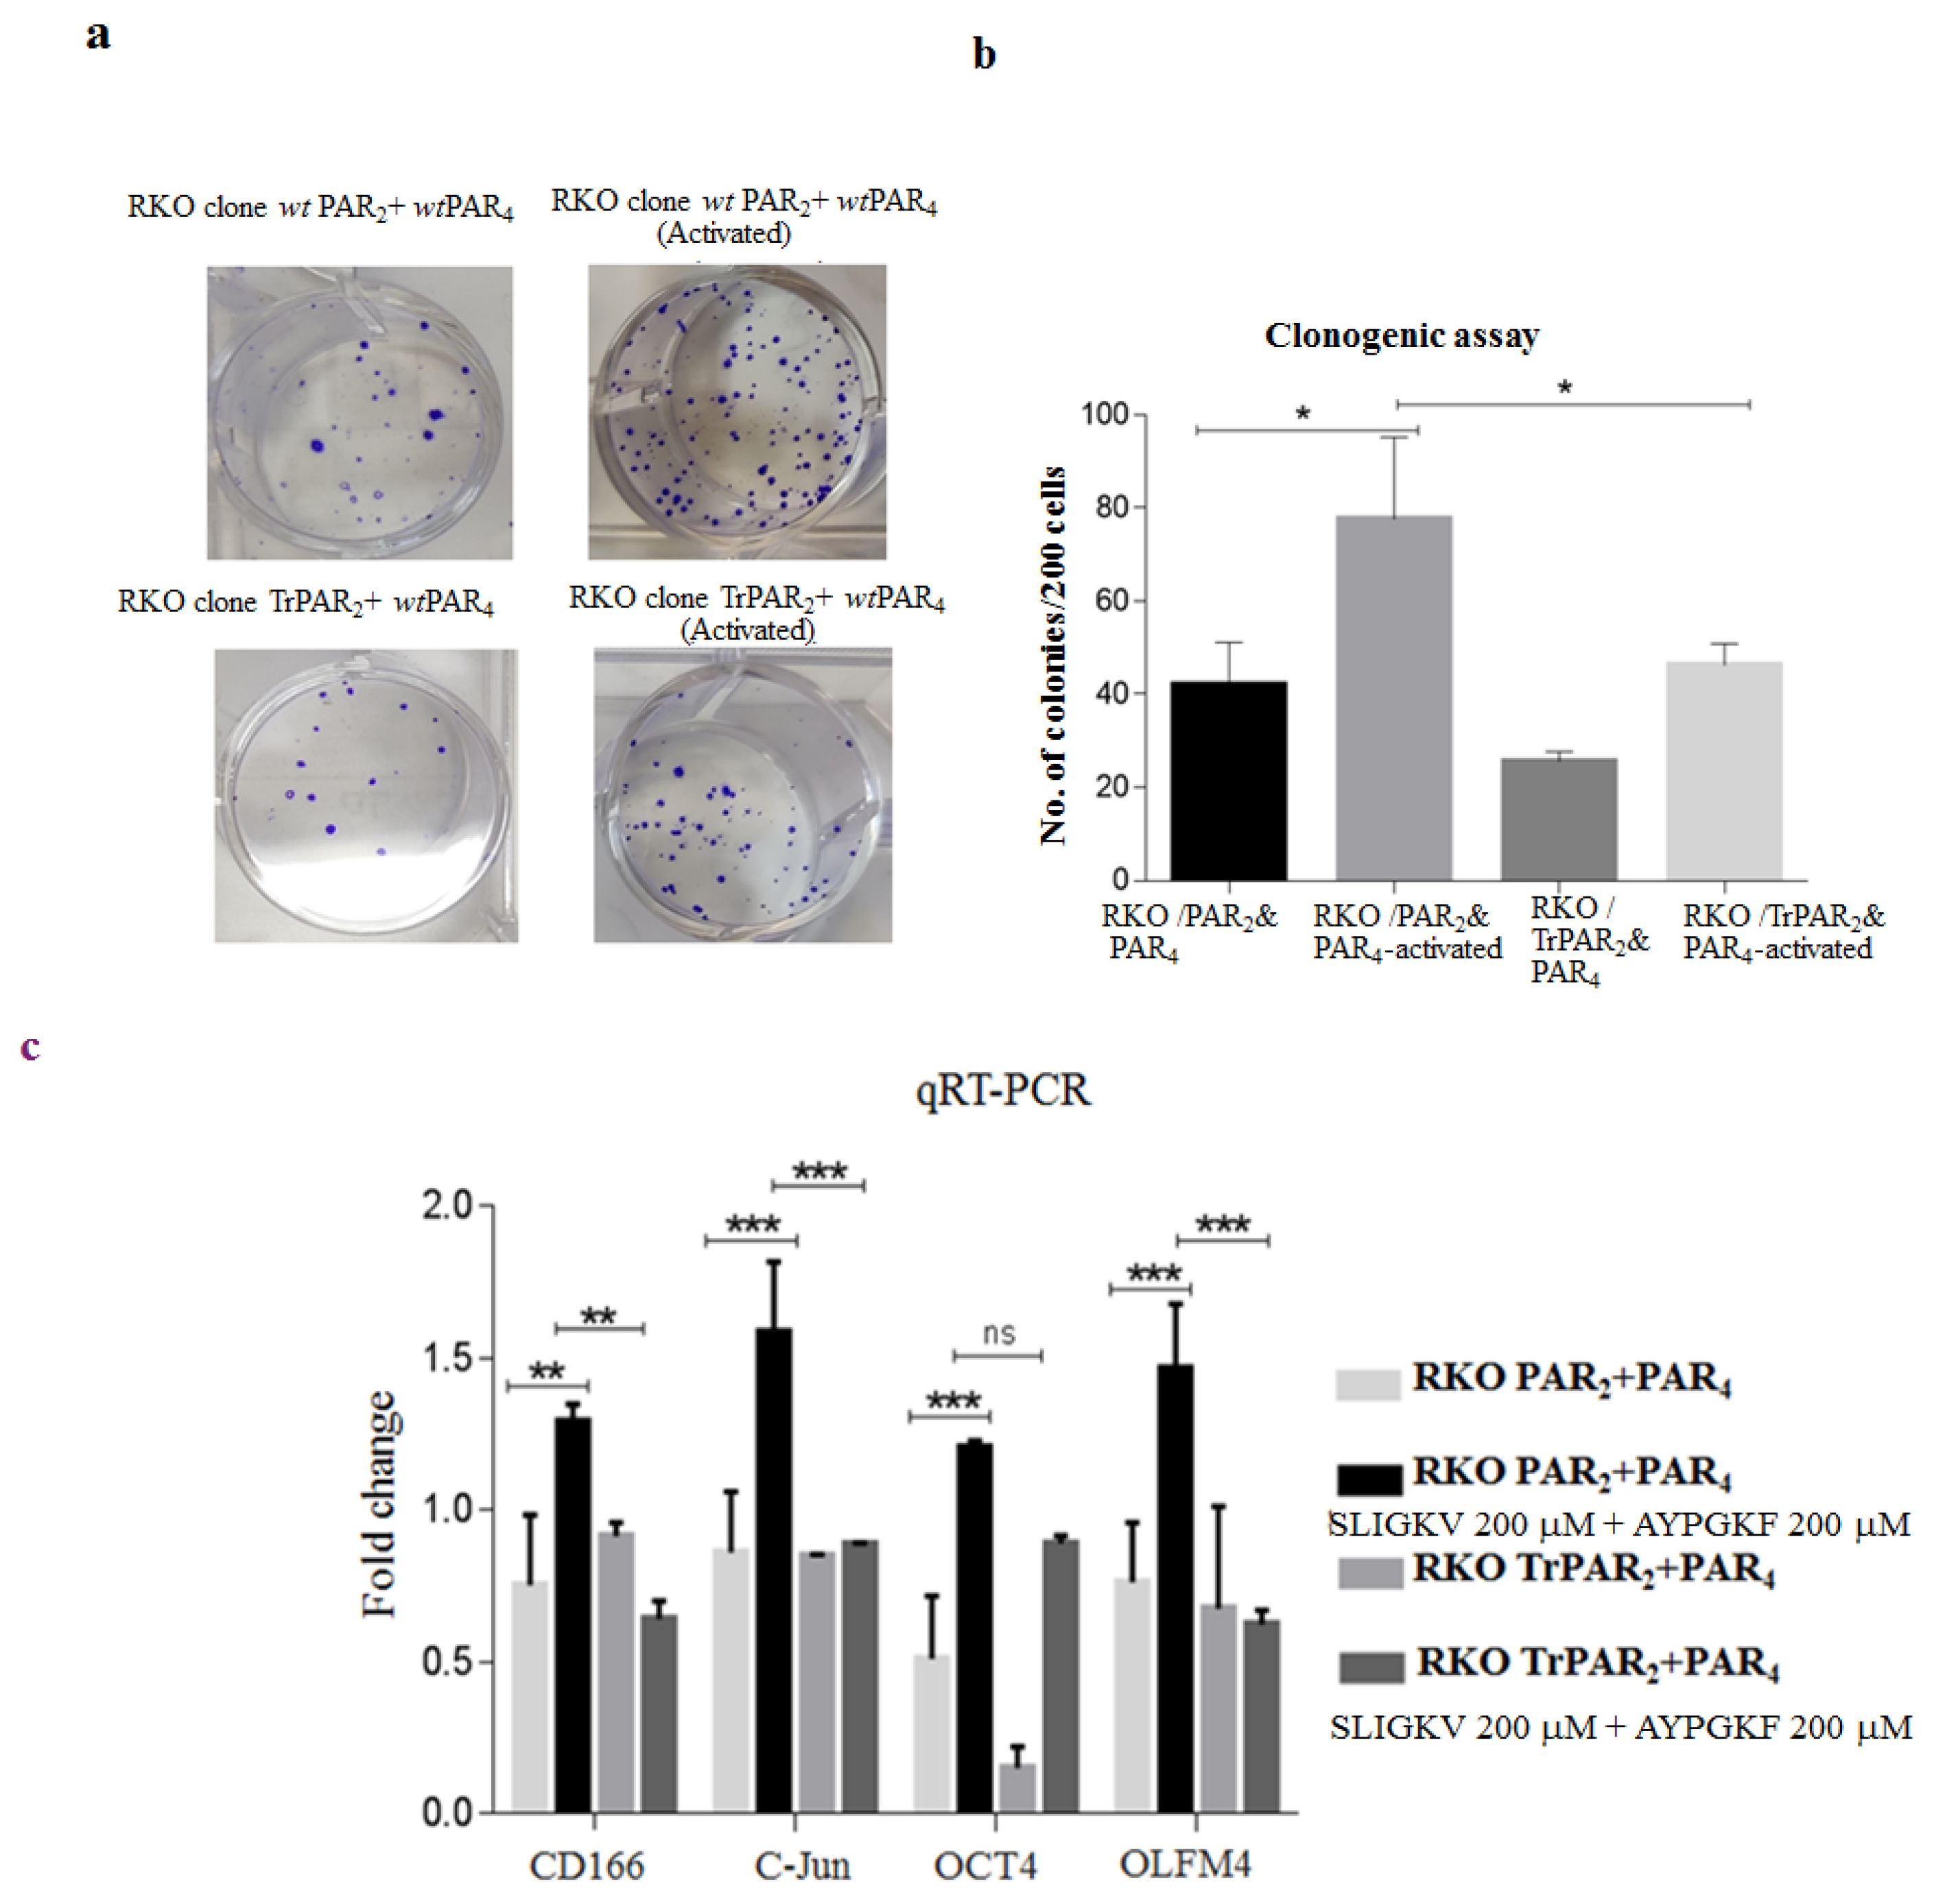
2.3. TrPAR2 Inhibits PAR2&4-Induced β-Catenin Stabilization, Transcriptional Activity, Colony Formation and Stem-Cell Marker Levels

We next considered the effect of TrPAR2 on PAR2 and PAR4-induced tumor events in vitro and in vivo. The presence of a TrPAR2 lacking the cytoplasmic tail (Figure 3a), and hence incapable of promoting signaling, stressed the significance of PAR2-induced signaling events in PAR4 and PAR2-mediated activities. We transfected HEK293 cells with the TrPar2/f2rl1 and wt Par4/f2rl3 plasmids, as well as flg-β-catenin constructs, and compared their functions with that of cells transfected with plasmids for wt Par2/f2rl1, Par4/f2rl3, and flg-β-catenin, whereas TrPAR2 was well expressed on the cell-surface membrane, as we previously reported [27], and a marked inhibition of LRP6 phosphorylation was seen. In contrast, robust LRP6 phosphorylation was observed following the activation of both PAR2 and PAR4 (Figure 3b(i),b(ii)). In addition to inhibiting pLRP6 levels, TrPAR2 also inhibited β-catenin levels. At the same time, a powerful enhancement of β-catenin levels was obtained following the transfection and activation of Par2/f2rl1 and/or Par4/f2rl3 either individually, or both. These enhanced β-catenin levels are potently inhibited in the presence of TrPAR2 (Figure 3c(i),c(ii)). Similarly, PAR-induced TOPflash β-catenin reporter activity observed following the activation of PAR2 and/or PAR4 is indicative of PAR-induced β-catenin transcriptional activity. In the presence of TrPAR2, the powerful inhibition of both PAR2- and PAR4-induced TOPflash activity was obtained (Figure 3d).
Next, we generated stable clones of RKO cells, a poorly differentiated colon-cancer-cell line, transformed on the background of mismatch repair. The clones generated over-expressed wt Par2/f2rl1 and wt Par4/f2rl3, separately and in combination of both PAR2 and PAR4, as well as TrPar2/f2rl1 and wt Par4/f2rl3 (Figure 4a). PAR-induced levels of β-catenin stabilization were then assessed in these clones.
While increased β-catenin levels were seen following SLIGKV and AYPGKF peptide-mediated activation of wt over-expressing clones, β-catenin levels were attenuated in clones over-expressing TrPAR2 and wt PAR4 (Figure 4b).
Previously, we identified PH-binding motifs within the PAR2 and PAR4 C-terminal tails that associate with PH-containing signal proteins, thus providing a powerful platform for drug design [21,25]. We now demonstrate that in the presence of TrPar2/f2rl1, the association between PAR and PH-Akt seen in both wt PAR2 and wt PAR4 was potently inhibited (Figure 4c). Such inhibition takes place despite TrPar2 being well expressed, as shown previously [27]. Together, these data support the conclusion that PAR2 signaling is required for PAR4 function.
A colony formation assay demonstrated the generation of abundant colonies upon activation of both PAR receptors. A marked inhibition of colony-forming ability was observed in the presence of the TrPAR2 variant and wt PAR4 (Figure 5a,b). Furthermore, elevated levels of stem-cell markers were seen upon activation of both PAR2 and PAR4 (Figure 5c). Reduced levels of these markers were obtained in the presence of TrPAR2 and wt PAR4 (Figure 5c). It is assumed that the levels of their proteins were inhibited accordingly, although not measured directly. Hence, the oncogenic activity of PAR4 is markedly inhibited when PAR2 is incapable of initiating cell signaling.

2.4. TrPAR2 Inhibits PAR2 and PAR4-Induced Tumor Growth In Vivo

To elucidate the dominant role of PAR2 over PAR4 in xenograft tumor growth in vivo, the following approach was taken. Stable RKO clones were inoculated subcutaneously into nude mice. The mice were monitored every other day for 35 days (or until the tumors became clearly noticeable), sacrificed, and the tumors were excised and embedded in paraffin. Whereas large tumors (e.g., ~1.2 cm) were observed in mice inoculated with the RKO clones over-expressing both wt PAR2 and wt PAR4, only a few to almost no tumors were seen following the injection of clones expressing TrPAR2 and wt PAR4. Likewise, only very small tumors were obtained when clones expressing either TrPar2 alone or wt RKO cells were inoculated into mice (Figure 6). The inhibition obtained was 4.5-fold higher for TrPAR2 and wt PAR4-generated tumors, as compared with wt PAR2&4-generated tumors. Together, both the in vitro and in vivo data obtained in the presence of a TrPAR2 indicated that TrPAR2 has a negative inhibitory effect on PAR4 and PAR2-induced tumor-promoting processes, similar to the inhibition seen following shRNA-mediated TrPar2/f2rl1 gene silencing.

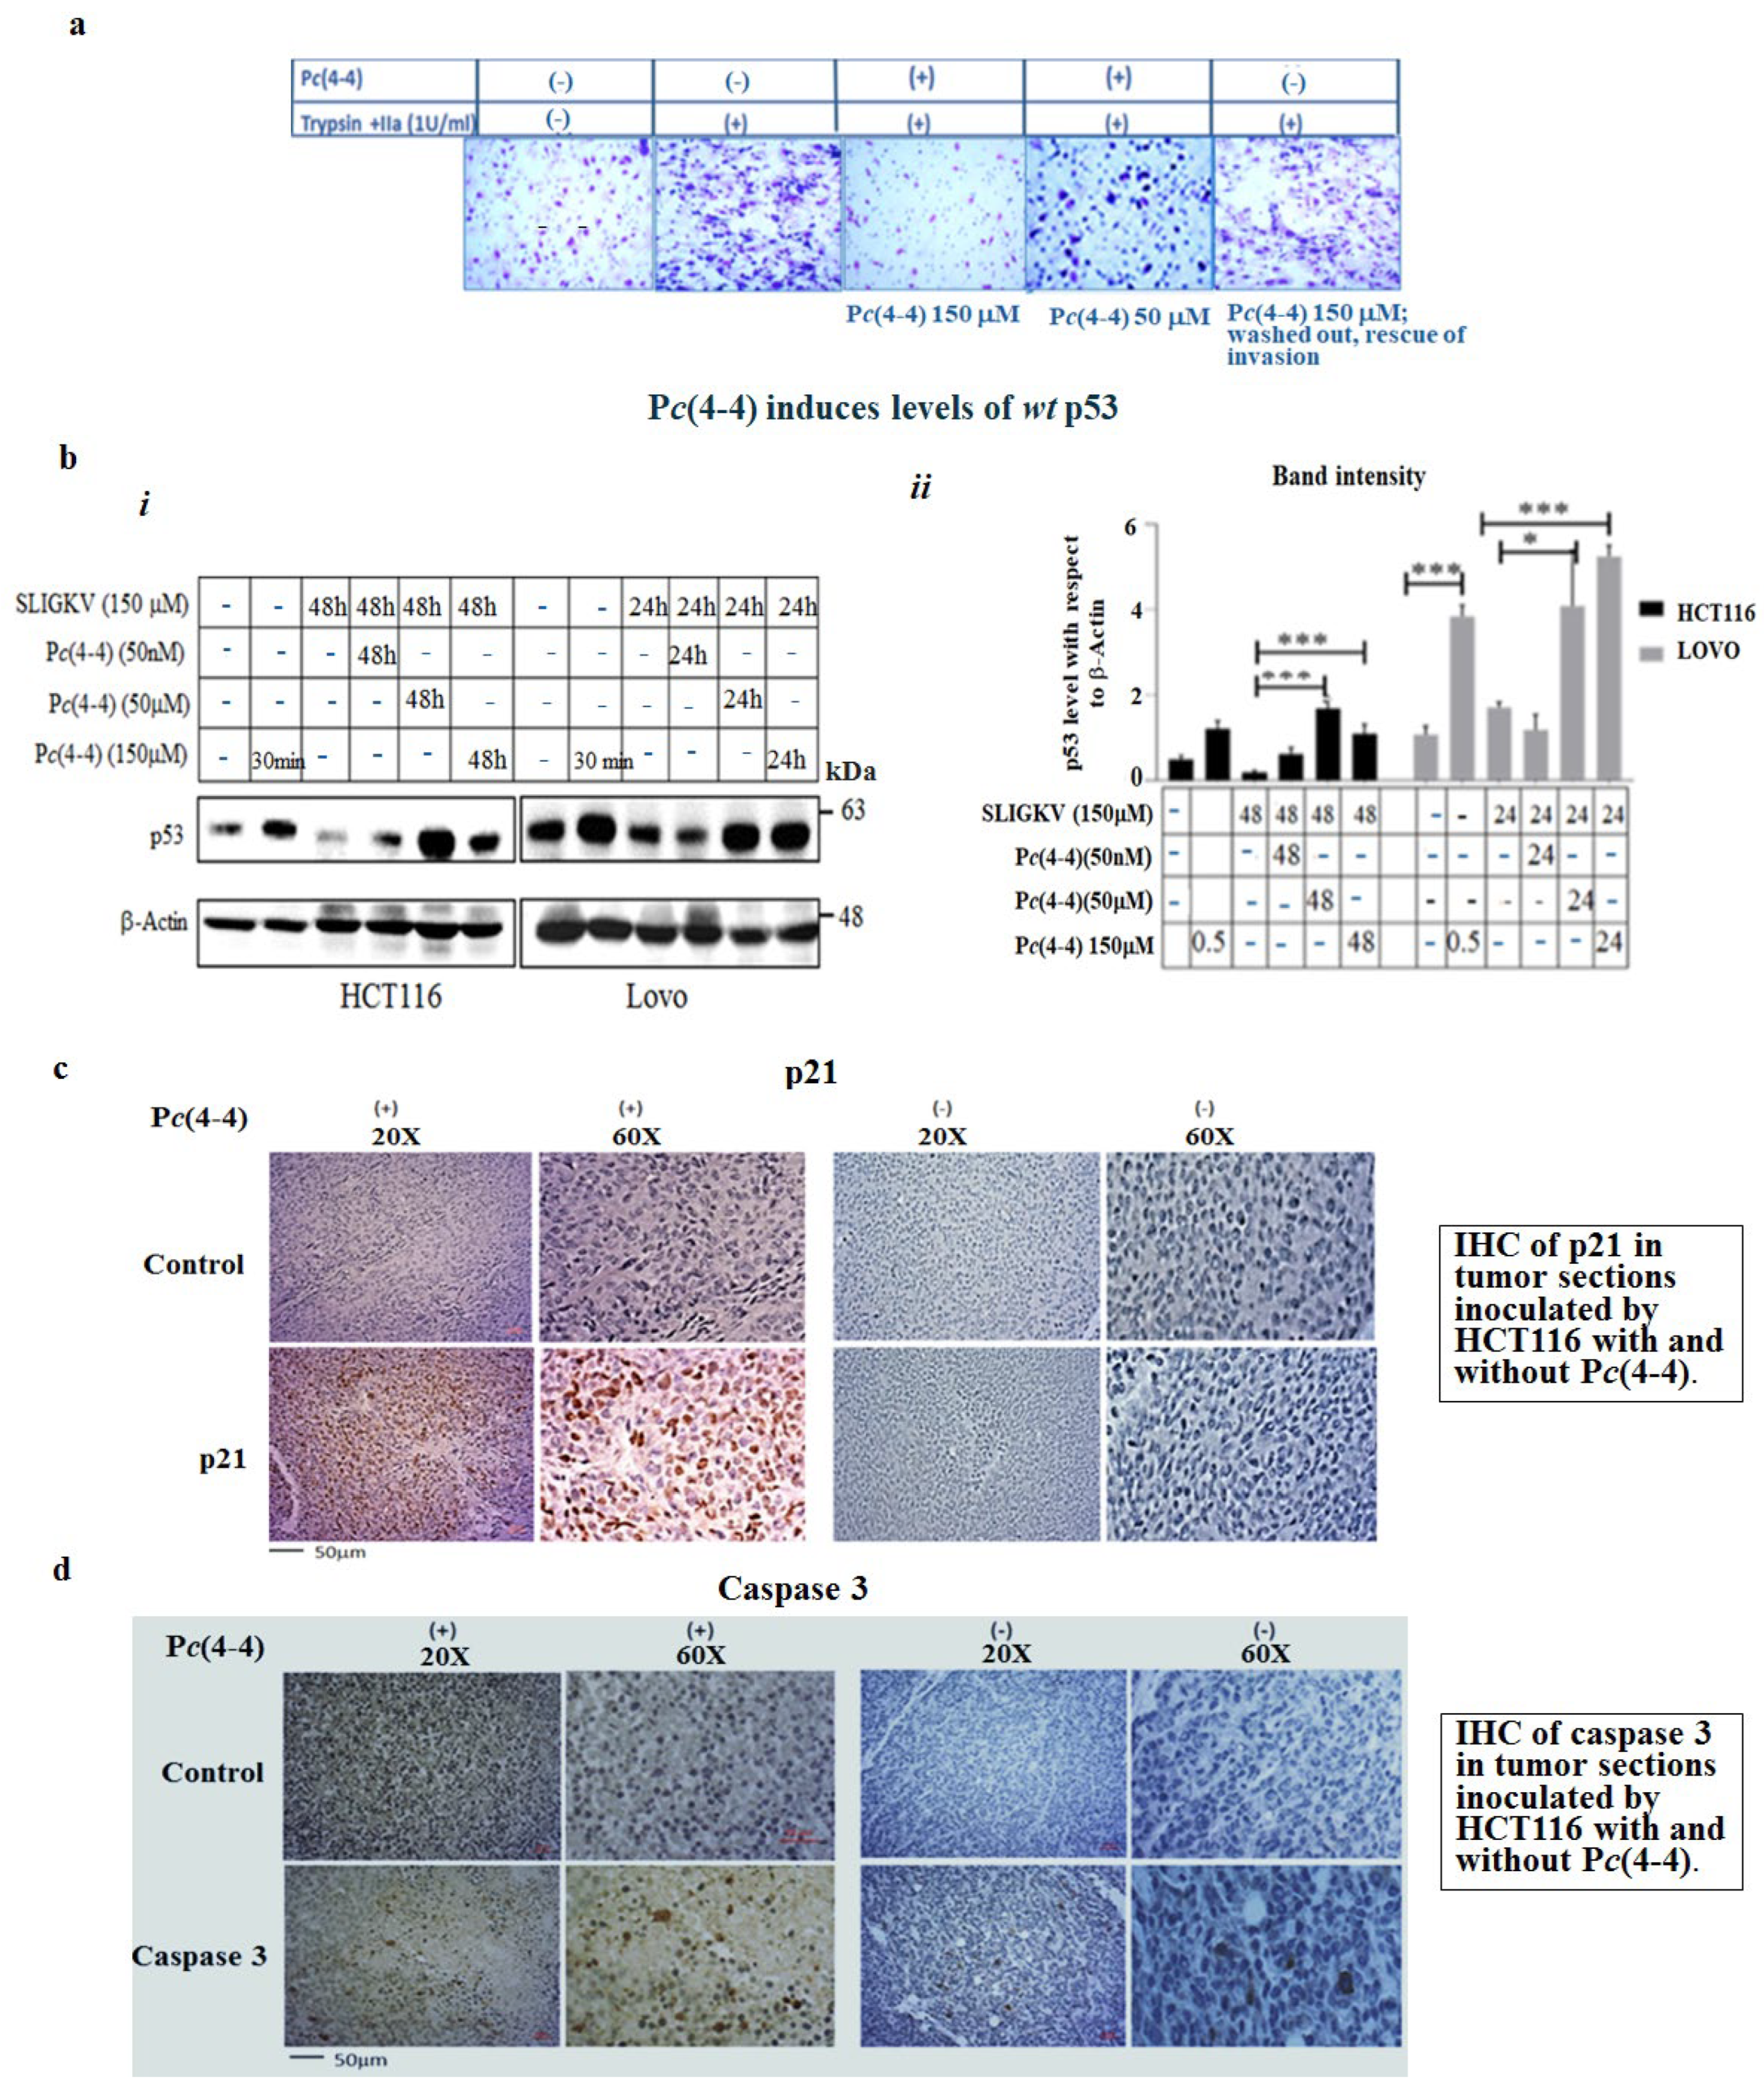
2.5. The Oncogenic Properties of PAR2 Are Significantly Inhibited in the Presence of Pc(4-4) via Induced wt p53 Levels

We previously selected a Pc(4-4) compound from a library of cyclic peptides directed against the PAR2/or PAR4 PH-binding motif [21]. As we have shown, Pc(4-4) potently inhibited PAR-induced Akt association, cell migration, and invasion in vitro, as well as tumor generation in vivo [21,25]. PAR2 activity is necessary for PAR4 function (and also for PAR1; 27).
Now, we continue our assessment of the molecular mechanism of PAR2 by using Pc(4-4) as a potent inhibitor.
In order to assess the impact of Pc(4-4) on PAR induced tumorigenity that mimics physiological conditions by proteases activation, we performed a Matrigel invasion assay. It is shown that Pc(4-4) potently inhibits the Matrigel invasion of trypsin and thrombin (e.g., IIa)-activated PAR2 and PAR4, in HCT116 colon cancer cells (expressing both PAR2 and PAR4). The inhibition is observed between 50 nM and 150 μM of Pc(4-4). This inhibition is reversible, since upon extensive wash-out, increased Matrigel invasion is seen (Figure 7a).
We found that in the presence of Pc(4-4), a significant increase in the level of wt p53 was observed. As shown in Figure 7b, the level of wt p53 in aggressive colon-cancer-cell lines (e.g., HCT116 and Lovo) were rapidly down-regulated following PAR2 activation. In contrast, in the presence of Pc(4-4), sustained high levels of wt p53 were seen. This was shown for the lowest concentration of Pc(4-4) tested (50 nM), with wt p53 levels remaining elevated for 24 and 48 h, compared to untreated cells.
Likewise, immunohistochemistry (IHC) analysis of tumor sections generated in HCT116 cells presenting high PAR2 and PAR4 levels showed increased expression of p21 upon Pc(4-4) treatment; this was not seen in non-treated tumor sections. Similarly, increased levels of caspase-3 were observed, indicative of small tumors, as compared to the low caspase-3 levels seen in non-treated large tumor-tissue sections (Figure 7c,d).

3. Discussion

In this study, we demonstrated that PAR2 affects PAR4 oncogenic function. PAR4 requires PAR2 signaling for its pro-tumor roles. We showed that PAR2 co-localizes with PAR4 and acts as a single functional unit in promoting events in the β-catenin stabilization pathway and PAR-PH-Akt association. When Par2/f2rl1 is knocked down, the potent inhibition of β-catenin levels, β-catenin transcriptional activity, as reported by TOPflash, and increased nuclear DVL1 levels were obtained. Likewise, when Par2/f2rl1 was silenced, a powerful inhibition of PAR2 and PAR4-induced Matrigel invasion and cell migration/proliferation were seen. These observations are in contrast to the increased pro-tumor events induced by high PAR2 and PAR4 levels outlined above. TrPAR2, which is incapable of initiating cell signaling, greatly inhibited PAR2 and PAR4-induced β-catenin stabilization, TOPflash-reported transcriptional activity, Akt-PAR4 association, colony formation, and PAR4-induced stem-cell marker levels. These changes took place under conditions in which TrPAR2 effectively co-localized with PAR4. The importance of PAR2-induced signaling for PAR4 function was demonstrated Via the inhibition of PAR2 and PAR4-induced tumor generation in vivo. In contrast, potent tumor growth were generated by the inoculation of clones expressing both PAR2 and PAR4. To further understand the oncogenic mechanism of action of PAR2, we studied the impact of Pc(4-4), a PAR2 inhibitor directed to PAR2 and PAR4 PH-binding motifs. We demonstrated that upon Pc(4-4) treatment, increased levels of p53 were observed. In parallel, Pc(4-4) was shown to inhibit PAR-induced tumors [21]. In fact, Pc(4-4) is intended to be a drug in the fight against cancer. We are now in the process of measuring its half-life in blood and its efficient concentration, as well as its effect on physiological protease-activated PAR2 and PAR4.
We previously demonstrated that PAR1 and PAR2 act together as a single functional unit while promoting breast cancer growth [27], as also shown by others in different settings [26,27,28]. Whether the exposed internal ligand of the PAR2 sequence transactivates PAR4 or whether the PAR2–PAR4 heterodimer is formed by another route remains to be determined. The bioinformatics assignment of PAR4 as an oncogene was previously reported [15]. Along with this line of evidence, we have recently shown that PAR4 is a potent oncogene capable of inducing tumors in vivo [21]. However, publications offering opposing roles for PAR4 in cancer biology exist. Some describe PAR4 as playing an inhibitory role in cancer [42,43,44,45]. Still, an increasing number of publications point to a role of PAR4 as an oncogene [17,46,47,48,49,50,51,52,53,54].
PAR4 associates with PAR1 to form heterodimers following thrombin activation. Mapping the PAR1–PAR4 heterodimer interface showed it involving four residues in the TM4 (transmembrane 4) of both PAR1 and PAR4 [55]. The mechanistic basis for PAR1–PAR4 heterodimer generation indicates that in human platelets, PAR1 functions as a co-factor for thrombin activation of PAR4. Consequently, thrombin acts as a bivalent agonist of both receptors [56,57]. Whereas PAR4 is required for later stages of platelet function, PAR1 is essential for early stages in platelet activation [58].
The fact that PAR family members work in concert and are inter-dependent is interesting but not unique. The EGF receptor (EGFR)/erbB family, comprising EGFR/erbB1/Her1, erbB2/Her2, erbB3/Her3, and erbB4/Her4, provides another such example. erbB3 lacks kinase activity; thus, it cannot induce cell proliferation. Moreover, cells expressing a mutant form of Her2 incapable of binding EGF ligand exhibit a low rate of cell proliferation. Only cells expressing both erbB3 and mutant Her2 receptors show strong kinase activity and robust cell proliferation upon addition of an EGF ligand [58,59,60,61]. With regard to the PAR family, PAR2–PAR4 heterodimers are functional, and as demonstrated here, PAR2 acts as a dominant receptor, relative to PAR4 and PAR1 [27].
In fact, PARs transactivate EGFR, in this respect we have previously demonstrated that activation of PAR4 for example, directly induces EGFR tyrosine (Y) phosphorylation. Application of Pc(4-4) potently inhibits PAR-induced pY-EGFR [21].
Our findings reported here agree with previous work, demonstrating that the activation of PAR2 leads to the up-regulation of Bcl2L12 and the inhibition of p53 in lung cancer [58,62]. It is well known that p53 is a common denominator in the etiology of different sub-types of human cancers. Studies of p53 have contributed to our understanding of the cancerous process and provided insight into the development of tumor growth. Yet, one should keep in mind that signaling pathways linking p53-like cellular pathways should not be evaluated as an isolated element [63,64,65]. It is necessary to consider the intertwined networks into which p53-associated signaling is tightly linked. Mutant p53 is a bona fide useful biomarker impacting therapy programs such as those for EGFR [e.g., TKI (tyrosine kinase inhibitor)-EGFR] [37], the clinical regimen [38], and a useful biomarker for glioma [66]. A specific stop point in the cell-division cycle corresponds to the earliest effects of p53 expression and is seen in all mammalian cells. This arrest was mediated Via p53-induced expression of p21WAF1/CIP1, an inhibitor of cyclin-dependent kinases. The pivotal canonical activation of p53 leads to cell apoptosis [67]. The transcription of Bax, an apoptosis gene mediator, is directly activated by p53-binding sites in the gene regulatory region [68]. The multistage apoptotic process includes the release of mitochondrial proteins, like cytochrome c, and the activation of a cascade of cysteine proteases, like pro-caspase-9, which cleaves procaspase-3, leading to committed cell death [69,70]. p53 activity is often inhibited by numerous antagonistic mechanisms, the most noticeable of which is the activation of the Mdm2 E3 ligase [63,64,65].
Proteomic and transcriptomic analyses have convincingly demonstrated that the combined gene regulation of the wt p53 tumor suppressor and c-Myc oncogene is key in eradicating cancer stem cells [71]. Notably, p53 and c-Myc appear in many cancer networks. The robust increase in wt p53 levels seen upon treatment with Pc(4-4) highlight this compound as a powerful therapeutic compound. Similarly, the activation of wt p53 can be achieved by inhibitors of CKIα [72,73]. Small molecules that co-target kinase inhibitors (e.g., CKIα) in acute myeloid leukemia have been shown to induce p53 levels and inhibit c-Myc oncogene concomitantly [74]. Likewise, Pc(4-4) was found to be a potent inducer of wt p53 levels and its downstream effector p21, as well as caspase-3. In summary, we have demonstrated that in the absence of PAR2 signaling, PAR4 pro-tumor functions are significantly inhibited and Pc(4-4) acts as a potent anti-tumor agent Via a significant increase in wt p53 levels.

4. Materials and Methods

4.1. Animal Models

Animals used in the experiments were handled in accordance with the guidelines of the Hebrew University ethics committee (AAALAC standard). The animal ethics certificate number is MD-17368-5.

4.2. Cell Culture

HCT-116, HT29, RKO, LOVO, and HEK293 cells were obtained from the American Type Culture Collection (Manassas, VA, USA) and grown in DMEM, supplemented with 1 mM L-glutamine, 50 µg/mL streptomycin, 50 U/mL penicillin (GIBCO-BRL, Gaithersburg, MD, USA) and 10% fetal calf serum (Biological Industries, Migdal HaEmek, Israel). These cell lines were checked for authentication by the service at the genomic center BCF biomedical core facilities, Haifa, Israel.

4.3. Matrigel Invasion

Blind-well chemotaxis chambers with 13 mm diameter filters were used. Matrigel (AcroBiosystems, Boston, Cambridge, MA, 02142, USA; AC-M082704) was applied per blind well (50 mg/filter) as described previously [24,26].

4.4. Scratch-Wound Healing

The scratch-wound healing assay was performed as described previously, with some modifications [75]. In brief, HT29 and HT29 shPar2 cells (3 × 10⁶/well) were seeded in 6-well plates. The cell medium was replaced with serum-free medium overnight, and equal wound areas were introduced into the monolayer. Cells were treated with 200 µM of the synthetic peptides SLIGKV or AYPGKF (GenScript; Piscataway, NJ, USA).

4.5. Clonogenic Assay

RKO (200) was seeded into 24-well plates, activated for both PAR2 and PAR4, and maintained until visible colonies were observed. The colonies were fixed with glutaraldehyde (6.0%, v/v; Sigma-Aldrich-Merck, Kiryat HaMada St 15, Jerusalem, Israel), stained with crystal violet (0.5%, w/v) and counted using a stereo microscope [76].

4.6. Plasmids and Reagents

pBJ-FLAG-Par4 (cat #53231), lrp6 (cat #27242), pCMV-VSV-G (cat #8454) and pCMV-dR8.2 dvpr (cat #8455) plasmids were purchased from Addgene (Watertown, MA, USA). Human PAR2 (Par2/f2rl1) plasmid was kindly provided by Dr. Morley D. Hollenberg (Faculty of Medicine, University of Calgary, Calgary, AB, Canada). flg-β-catenin was kindly provided by Dr. Ben-Neriah (Hebrew University, Jerusalem, Israel). Preparation of a TrPAR2 plasmid, encoding the protein lacking the cytoplasmic tail (i.e., lacking 150 residues) was carried out as previously described [25].

4.7. Cell Transfections and PAR Activation

Cells grown to 70–80% confluency were transfected with 0.5–1 μg of plasmid DNA using the PEI transfection reagent (Polysciences, Warrington, PA, USA). Cells were collected 48 h after transfection and protein lysates or RNA were prepared. Two hundred µM of the synthetic peptides SLIGKV or AYPGKF (GenScript; Piscataway, NJ, USA) were used to activate PAR2 and PAR4, respectively.

4.8. Small Hairpin (sh)-RNA Construct Preparation and Viral Particle Generation

To prepare sh-RNA of different genes and thereby knockdown gene expression, the desired sequence was successfully cloned into the plentilox3.7 (pLL3.7; #11795; Addgene, Watertown, MA, USA) lentiviral vector following the protocol provided by the Addgene website (cat #11795). The target sequences were sh-Par2i: 5′-GGAAGAAGCCTTATTGGTA-3′, sh-Par2ii: 5′-GCTCTTTGT AATGTGCTTA-3, scrambled sh-Par2i: AGAGAAGTTCGAAGGTATA-3′ and scrambled sh-Par2ii: 5′-TGCTGTGATAGTTAT TCGA-3′. For the generation of viral particles, HEK293 cells were transfected with three plasmid systems that encode packaging (CMVD R8.91), envelope (CMV-VSV-G) proteins, and cloned pLL3.7 vector using PEI as transfection reagent. The medium was replaced with fresh medium 24 h later. On day three after transfection, the medium was collected, and the viral particles were concentrated 10-fold by centrifuging for 2 h at 40,000 rpm.

4.9. Preparation of RKO Stable Clones Expressing wt PAR2/wtPAR4 and trPAR2/wtPAR4

RKO cells (0.5 × 10⁶) were infected with Par4 10 × viral particles along with Polybrene infection reagent. At 72 h post transduction, the cells were subjected to puromycin selection (0.5 µg/mL). While the control cells died, transduced cells with puromycin resistance grew and were collected. These cells were then infected with Par2 10 × virus particles along with Polybrene. Puromycin-resistant cells were collected and either used to isolate RNA or to prepare protein lysates.

4.10. Quantitative Real-Time (qRT) PCR and Reverse Transcriptase (RT) PCR

RNA was extracted from cells using the GenElute RNA kit (Sigma-Aldrich, St. Louis, MO, USA). To prepare cDNA, 1 µg of RNA was reverse-transcribed using reverse transcriptase (Promega, Madison, WI, USA (Quanta bio, Beverly, MA, USA)). qRT-PCR was performed using specific forward and reverse primers for each gene analyzed. In qRT-PCR amplifications, triplicates of the 6 ng cDNA template were used with 500 nM gene-specific primers and the 2 × PerfeCTa SYBR Green mix in an RG-3000A automated rotor-gene system (Corbett Research, Sydney, Australia).

4.11. Cell Lysate Preparations, Immunoprecipitation (IP), and Western Blot

To prepare protein-cell lysates for IP, cells were solubilized in CelLytic M buffer (Sigma-Aldrich, Saint Louis, MO, USA). Protein-cell lysates were prepared as previously described [12,14]. Western blot analysis was performed as in previous studies [10,11,12,13,14]. In this study, experimental cell-protein extraction and lysis were carried out using RIPA (Radio-Immunoprecipitation Assay) buffer supplemented with PMSF and a protein inhibitor. Subsequently, protein concentrations were determined, and the lysates were heated with a loading buffer at 100 °C for 10 min. Thirty micrograms of proteins from each sample were loaded onto 10%. SDS-PAGE gels, transferred to PVDF membranes, blocked with 5% BSA, and then exposed to the relevant antibody. Western blots (wet Western blots) were performed. Membranes (PVDF, Thermofisher, Waltham, MA, USA; TS-88518) were blocked and probed with the appropriate primary antibodies. These are anti-FLAG (F3165; Sigma-Aldrich, Saint Louis, MO, USA), anti-β-actin (A5441; Sigma-Aldrich, Saint Louis, MO, USA), anti-β-catenin (C2206), anti-PAR2 (AB180953; Abcam, Cambridge, UK and SC-13,504 Santa Cruz Biotechnology, Dallas, TX, USA), anti-PAR4 (AB5787; Abcam (Cambridge, UK): SC-13504 Santa Cruz Biotechnology (Dallas, TX, USA)), anti-HA (901503; Biolegend, San Diego, CA, USA), anti-LRP6 (BS-7007R, Bioss Antibodies, Woburn, MA, USA), anti-phospho-LRP6 (Cell Signaling Technology, Danvers, MA, USA), anti-AKT (AB8805; Abcam, Cambridge, UK), anti-p53 (AB17990; Abcam, Cambridge, UK), anti-p21 (AB109520; Abcam, Cambridge, UK), and anti-GAPDH (AB9485; Abcam, Cambridge, UK). These antibodies were suspended in 3% BSA (#A5611, Sigma-Aldrich, Head office Kanagawa, Japan) in 10 mM Tris-HCl (T1503; Sigma-Aldrich, Saint Louis, MO, USA), pH 7.5, 100 mM NaCl, and 0.1% Tween-20 (P9416; Sigma-Aldrich, Saint Louis, MO, USA). After extensive washes, blots were incubated with secondary antibodies conjugated to horseradish peroxidase (HRP) anti-mouse (#ab6728; Abcam, Cambridge, UK) or anti-Rabbit (Abcam, Cambridge, UK; #ab6721). Immunoreactive bands were detected by the enhanced chemiluminescence (ECL) reagent (Pierce, Rockford, IL, USA).

4.12. TOPflash Luciferase Reporter

HEK 293 cells (0.2 × 10⁶) were seeded in 6-well plates and incubated overnight at 37 °C. The cells were transfected with desired plasmids (wtPar2, trPar2 and wtPar4) and TOPflash components, as previously described [12].

4.13. Ectopic Tumor Xenograft Mouse Model

RKO cells (wt and stable clones of RKOtrPAR2, RKOwtPAR2 + wtPAR4 and RKOtrPAR2 + wtPAR4) were starved overnight, and treated the next day with the SLIGKV or AYPGKF peptides (200 µM each) for 4 h. The cells (1 × 10⁶) were injected subcutaneously into the right flank of groups of five six–eight-week-old Hsd: Athymic NudeFoxn1nu mice (nude mice). The mice were terminated when the tumor volumes reached the volume stipulated by the Animal Committee approval.

4.14. Immunohistochemistry (IHC)

Tumor tissue-derived paraffin-embedded slides were used for IHC, as previously described [23,25].

4.15. Pc(4-4)

Pc(4-4) is a cyclic peptide directed toward PAR2 and PAR4 PH-binding motifs. More detailed description appears in [21].

5. Conclusions

We have demonstrated that PAR2 is dominant over PAR4 in colon cancer development. The shRNA silencing of Par2/f2rl1inhibits PAR2 and PAR4-induced events in the β-catenin stabilization pathway, and inhibits invasion and migration. Similarly, truncated PAR2 (TrPAR2), devoid of the cytoplasmic tail of PAR2, inhibits PAR2 and PAR4-induced β-catenin stabilization, PAR4-Akt association, stem-cell marker expression and colony formation. TrPAR2 inhibits xenograft PAR2 and PAR4-induced tumor growth in vivo. Pc(4-4), a compound directed to the PAR2 PH-binding domain, inhibits PAR2 oncogenic activity Via an increase in p53 levels.

Author Contributions

P.A., J.K.N. and H.M. performed the experiments. P.A., J.K.N. and R.B.-S. designed the research and analyzed the data. P.A. and R.B.-S. wrote the manuscript. All authors have read and agreed to the published version of the manuscript.

Funding

This work was supported by the Israel Science Foundation grant number 1420 (to R. Bar-Shavit).

Institutional Review Board Statement

The animal ethics certificate number is MD-17368-5.

Informed Consent Statement

Not applicable.

Data Availability Statement

Data used in this study are available upon request by the corresponding author.

Acknowledgments

We thank members of the Bar-Shavit laboratory for fruitful discussions and support at various stages of this work.

Conflicts of Interest

The authors declare no competing interest.

References

  1. Dorsam, R.T.; Gutkind, J.S. G-protein-coupled receptors and cancer. Nat. Rev. Cancer 2007, 7, 79–94. [Google Scholar] [CrossRef] [PubMed]
  2. Feigin, M.E. Harnessing the genome for characterization of G-protein coupled receptors in cancer pathogenesis. FEBS J. 2013, 280, 4729–4738. [Google Scholar] [CrossRef] [PubMed]
  3. Lappano, R.; Maggiolini, M. G protein-coupled receptors: Novel targets for drug discovery in cancer. Nat. Rev. Drug Discov. 2011, 10, 47–60. [Google Scholar] [CrossRef] [PubMed]
  4. Siegel, R.L.; Giaquinto, A.N.; Jemal, A.C.A. Cancer statistics, 2024. Cancer J. Clin. 2024, 74, 12–49. [Google Scholar] [CrossRef] [PubMed]
  5. Sonkin, D.; Thomas, A.; Teicher, B.A. Cancer treatments: Past, present, and future. Cancer Genet. 2024, 286, 18–24. [Google Scholar] [CrossRef] [PubMed]
  6. Nusse, R.; Clevers, H. Wnt/β-Catenin Signaling, Disease, and Emerging Therapeutic Modalities. Cell 2017, 169, 985–999. [Google Scholar] [CrossRef] [PubMed]
  7. Koo, B.-K.; Spit, M.; Jordens, I.; Low, T.Y.; Stange, D.E.; Van De Wetering, M.; Van Es, J.H.; Mohammed, S.; Heck, A.J.R.; Maurice, M.M.; et al. Tumour suppressor RNF43 is a stem-cell E3 ligase that induces endocytosis of Wnt receptors. Nature 2012, 488, 665–669. [Google Scholar] [CrossRef] [PubMed]
  8. Hao, H.-X.; Xie, Y.; Zhang, Y.; Charlat, O.; Oster, E.; Avello, M.; Lei, H.; Mickanin, C.; Liu, D.; Ruffner, H.; et al. ZNRF3 promotes Wnt receptor turnover in an R-spondin-sensitive manner. Nature 2012, 485, 195–200. [Google Scholar] [CrossRef] [PubMed]
  9. Coughlin, S.R. Thrombin signaling and protease-activated receptors. Nature 2000, 407, 258–264. [Google Scholar] [CrossRef] [PubMed]
  10. Yin, Y.J.; Katz, V.; Salah, Z.; Maoz, M.; Cohen, I.; Uziely, B.; Turm, H.; Grisaru-Granovsky, S.; Suzuki, H.; Bar-Shavit, R. Mammary gland tissue targeted overexpression of human protease-activated receptor 1 reveals a novel link to beta-catenin stabilization. Cancer Res. 2006, 66, 5224–5233. [Google Scholar] [CrossRef] [PubMed]
  11. Turm, H.; Maoz, M.; Katz, V.; Yin, Y.J.; Offermanns, S.; Bar-Shavit, R. Protease-activated receptor-1 (PAR1) acts via a novel Galpha13-dishevelled axis to stabilize beta-catenin levels. J. Biol. Chem. 2010, 285, 15137–15148. [Google Scholar] [CrossRef] [PubMed]
  12. Nag, J.K.; Kancharla, A.; Maoz, M.; Turm, H.; Agranovich, D.; Gupta, C.L.; Uziely, B.; Bar-Shavit, R. Low-density lipoprotein receptor-related protein 6 is a novel coreceptor of protease-activated receptor-2 in the dynamics of cancer-associated β-catenin stabilization. Oncotarget 2017, 8, 38650–38667. [Google Scholar] [CrossRef] [PubMed]
  13. Grisaru-Granovsky, S.; Kumar Nag, J.; Zakar, L.; Rudina, T.; Lal Gupta, C.; Maoz, M.; Kozlova, D.; Bar-Shavit, R. PAR1&2 driven placenta EVT invasion act via LRP5/6 as coreceptors. FASEB J. 2020, 34, 15701–15717. [Google Scholar] [PubMed]
  14. Nag, J.K.; Appasamy, P.; Sedley, S.; Malka, H.; Rudina, T.; Bar-Shavit, R. RNF43 induces the turnover of protease-activated receptor 2 in colon cancer. FASEB J. 2023, 37, e22675. [Google Scholar] [CrossRef] [PubMed]
  15. Choi, H.Y.; Saha, S.K.; Kim, K.; Kim, S.; Yang, G.-M.; Kim, B.; Kim, J.-H.; Cho, S.-G. G protein-coupled receptors in stem cell maintenance and somatic reprogramming to pluripotent or cancer stem cells. BMB Rep. 2015, 48, 68–80. [Google Scholar] [CrossRef] [PubMed]
  16. Jiang, P.; Li, S.D.; Li, Z.G.; Zhu, Y.C.; Yi, X.J.; Li, S.M. The expression of protease-activated receptors in esophageal carcinoma cells: The relationship between changes in gene expression and cell proliferation, apoptosis in vitro and growing ability in vivo. Cancer Cell Int. 2018, 18, 81–88. [Google Scholar] [CrossRef] [PubMed]
  17. Yu, G.; Jiang, P.; Xiang, Y.; Zhang, Y.; Zhu, Z.; Zhang, C.; Lee, S.; Lee, W.; Zhang, Y. Increased expression of protease-activated receptor 4 and Trefoil factor 2 in human colorectal cancer. PLoS ONE 2015, 10, e0122678. [Google Scholar] [CrossRef] [PubMed]
  18. Wilson, S.R.; Gallagher, S.; Warpeha, K.; Hawthorne, S.J. Amplification of MMP-2 and MMP-9 production by prostate cancer cell lines via activation of protease activated receptors. Prostate 2004, 60, 168–174. [Google Scholar] [CrossRef] [PubMed]
  19. Mußbach, F.; Henklein, P.; Westermann, M.; Settmacher, U.; Böhmer, F.D.; Kaufmann, R. Proteinase-activated receptor 1- and 4-promoted migration of Hep3B hepatocellular carcinoma cells depends on ROS formation and RTK transactivation. J. Cancer Res. Clin. Oncol. 2015, 141, 813–825. [Google Scholar] [CrossRef] [PubMed]
  20. Elste, A.P.; Petersen, I. Expression of proteinase-activated receptor 1-4 (PAR 1-4) in human cancer. J. Mol. Histol. 2010, 41, 89–99. [Google Scholar] [CrossRef] [PubMed]
  21. Nag, J.K.; Malka, H.; Sedley, S.; Appasamy, P.; Rudina, T.; Levi, T.; Hoffman, A.; Gilon, C.; Uziely, B.; Bar-Shavit, R. PH-Binding Motif in PAR4 Oncogene: From Molecular Mechanism to Drug Design. Mol. Cancer Ther. 2022, 21, 1415–1429. [Google Scholar] [CrossRef] [PubMed]
  22. Hurevich, M.; Swed, A.; Joubran, S.; Cohen, S.; Freeman, N.S.; Britan-Rosich, E.; Briant-Longuet, L.; Bardy, M.; Devaux, C.; Kotler, M.; et al. Rational conversion of noncontinuous active region in proteins into a small orally bioavailable macrocyclic drug-like molecule: The HIV-1 CD4:Gp120 paradigm. Bioorg. Med. Chem. 2010, 18, 5754–5761. [Google Scholar] [CrossRef] [PubMed]
  23. Hess, S.; Linde, Y.; Ovadia, O.; Safrai, E.; Shalev, D.E.; Swed, A.; Halbfinger, E.; Lapidot, T.; Winkler, I.; Gabinet, Y.; et al. Backbone cyclic peptidomimetic melanocortin-4 receptor agonist as a novel orally administrated drug lead for treating obesity. J. Med. Chem. 2008, 51, 1026–1034. [Google Scholar] [CrossRef] [PubMed]
  24. Talhami, A.; Swed, A.; Hess, S.; Ovadia, O.; Greenberg, S.; Schumacher-Klinger, A.; Rosenthal, D.; Shalev, D.E.; Hurevich, M.; Lazarovici, P.; et al. Cyclizing painkillers: Development of backbone-cyclic TAPS analogs. Front. Chem. 2020, 8, 532577–532596. [Google Scholar] [CrossRef] [PubMed]
  25. Kancharla, A.; Maoz, M.; Jaber, M.; Agranovich, D.; Peretz, T.; Grisaru-Granovsky, S.; Uziely, B.; Bar-Shavit, R. PH motifs in PAR1&2 endow breast cancer growth. Nat. Commun. 2015, 6, 8853–8863. [Google Scholar] [PubMed]
  26. Even-Ram, S.; Uziely, B.; Cohen, P.; Grisaru-Granovsky, S.; Maoz, M.; Ginzburg, Y.; Reich, R.; Vlodavsky, I.; Bar-Shavit, R. Thrombin receptor overexpression in malignant and physiological invasion processes. Nat. Med. 1998, 4, 909–914. [Google Scholar] [CrossRef] [PubMed]
  27. Jaber, M.; Maoz, M.; Kancharla, A.; Agranovich, D.; Peretz, T.; Grisaru-Granovsky, S.; Uziely, B.; Bar-Shavit, R. Protease-activated-receptor-2 affects protease-activated-receptor-1-driven breast cancer. Cell. Mol. Life Sci. 2014, 71, 2517–2533. [Google Scholar] [CrossRef] [PubMed]
  28. Sevigny, L.M.; Austin, K.M.; Zhang, P.; Kasuda, S.; Koukos, G.; Sharifi, S.; Covic, L.; Kuliopulos, A. Protease-activated receptor-2 modulates protease-activated receptor-1-driven neointimal hyperplasia. Arterioscler. Thromb. Vasc. Biol. 2012, 31, e100–e106. [Google Scholar] [CrossRef] [PubMed]
  29. Nystedt, S.; Ramakrishnan, V.; Sundelin, J. The proteinase-activated receptor 2 is induced by inflammatory mediators in human endothelial cells. Comparison with the thrombin receptor. J. Biol. Chem. 1996, 271, 14910–14915. [Google Scholar] [CrossRef] [PubMed]
  30. Blackhart, B.D.; Emilsson, K.; Nguyen, D.; Teng, W.; Martelli, A.J.; Nystedt, S.; Sundelin, J.; Scarborough, R.M. Ligand cross-reactivity within the protease-activated receptor family. J. Biol. Chem. 1996, 271, 16466–16471. [Google Scholar] [CrossRef] [PubMed]
  31. Muller, P.A.J.; Vousden, K.H. P53 mutations in cancer. Nat. Cell Biol. 2013, 15, 2–8. [Google Scholar] [CrossRef] [PubMed]
  32. Bugter, J.M.; Fenderico, N.; Maurice, M.M. Mutations and mechanisms of WNT pathway tumour suppressors in cancer. Nat. Rev. Cancer 2021, 21, 5–21. [Google Scholar] [CrossRef] [PubMed]
  33. Kinzler, K.W.; Vogelstein, B. Lessons from hereditary colorectal cancer. Cell 1996, 87, 159–170. [Google Scholar] [CrossRef] [PubMed]
  34. Nakayama, M.; Sakai, E.; Echizen, K.; Yamada, Y.; Oshima, H.; Han, T.-S.; Ohki, R.; Fujii, S.; Ochiai, A.; Robine, S.; et al. Intestinal cancer progression by mutant p53 through the acquisition of invasiveness associated with complex glandular formation. Oncogene 2017, 36, 5885–5896. [Google Scholar] [CrossRef] [PubMed]
  35. Matano, M.; Date, S.; Shimokawa, M.; Takano, A.; Fujii, M.; Ohta, Y.; Watanabe, T.; Kanai, T.; Sato, T. Modeling colorectal cancer using CRISPR-Cas9-mediated engineering of human intestinal organoids. Nat. Med. 2015, 21, 256–262. [Google Scholar] [CrossRef] [PubMed]
  36. Drost, J.; Van Jaarsveld, R.H.; Ponsioen, B.; Zimberlin, C.; Van Boxtel, R.; Buijs, A.; Sachs, N.; Overmeer, R.M.; Offerhaus, G.J.; Begthel, H.; et al. Sequential cancer mutations in cultured human intestinal stem cells. Nature 2015, 521, 43–47. [Google Scholar] [CrossRef] [PubMed]
  37. Qian, H.; Hou, C.; Zhang, Z.; Ji, S.; Zhong, C.; Li, J.; Zhang, Q.; Huang, J.C.; Cheng, J.C. Effects of concurrent TP53 mutations on the efficacy and prognosis of targeted therapy for advanced EGFR mutant lung adenocarcinoma. Cancer Genet. 2023, 278, 62–70. [Google Scholar] [CrossRef] [PubMed]
  38. Ward, A.; Farengo-Clark, D.; McKenna, D.B.; Safonov, A.; Good, M.; Le, A.; Kessler, L.; Shah, P.D.; Bradbury, A.R.; Domchek, S.M.; et al. Clinical management of TP53 mosaic variants found on germline genetic testing. Cancer Genet. 2024, 284, 43–47. [Google Scholar] [CrossRef] [PubMed]
  39. Sadot, E.; Geiger, B.; Oren, M.; Ben-Ze’ev, A. Down-regulation of beta-catenin by activated p53. Mol. Cell. Biol. 2001, 36, 6768–6781. [Google Scholar] [CrossRef] [PubMed]
  40. Sedley, S.; Nag, J.K.; Rudina, T.; Bar-Shavit, R. PAR-Induced Harnessing of EZH2 to β-Catenin: Implications for Colorectal Cancer. Int. J. Mol. Sci. 2022, 23, 8758. [Google Scholar] [CrossRef] [PubMed]
  41. Gan, X.Q.; Wang, J.Y.; Xi, Y.; Wu, Z.L.; Li, Y.P.; Li, L. Nuclear Dvl, c-Jun, b-catenin, and TCF form a complex leading to stabilization of b -catenin—TCF interaction. J. Cell Biol. 2008, 180, 1087–1100. [Google Scholar] [CrossRef] [PubMed]
  42. Wang, M.; An, S.; Wang, D.; Ji, H.; Guo, X.; Wang, Z. Activation of PAR4 Upregulates p16 through Inhibition of DNMT1 and HDAC2 Expression via MAPK Signals in Esophageal Squamous Cell Carcinoma. Cells J. Immunol. Res. 2018, 2018, 4735752–4735762. [Google Scholar] [CrossRef] [PubMed]
  43. Jiang, P.; Yu, G.Y.; Zhang, Y.; Xiang, Y.; Hua, H.R.; Bian, L.; Wang, C.Y.; Lee, W.H.; Zhang, Y. Down-regulation of protease-activated receptor 4 in lung adenocarcinoma is associated with a more aggressive phenotype. Asian Pac. J. Cancer Prev. 2013, 14, 3793–3798. [Google Scholar] [CrossRef] [PubMed]
  44. Zhang, Y.; Yu, G.; Jiang, P.; Xiang, Y.; Li, W.; Lee, W.; Zhang, Y. Decreased expression of protease-activated receptor 4 in human gastric cancer. Int. J. Biochem. Cell Biol. 2011, 43, 1277–1283. [Google Scholar] [CrossRef] [PubMed]
  45. Lee, S.; Jiang, P.; Wang, W.; Feng, W.; Yu, G. The decreased expression of protease-activated receptor 4 in esophageal squamous carcinoma. Neoplasma 2014, 61, 546–552. [Google Scholar] [CrossRef] [PubMed]
  46. Bao, Y.; Hou, W.; Yang, L.; Liu, R.; Gao, Y.; Kong, X.; Shi, Z.; Li, W.; Zheng, H.; Jiang, S.; et al. Increased expression of protease-activated receptor 2 and 4 within dorsal root ganglia in a rat model of bone cancer pain. J. Mol. Neurosci. 2015, 55, 706–714. [Google Scholar] [CrossRef] [PubMed]
  47. Inaba, H.; Amano, A.; Lamont, R.J.; Murakami, Y. Involvement of protease-activated receptor 4 in over-expression of matrix metalloproteinase 9 induced by Porphyromonas gingivalis. Med. Microbiol. Immunol. 2015, 204, 605–612. [Google Scholar] [CrossRef] [PubMed]
  48. Black, P.C.; Mize, G.J.; Karlin, P.; Greenberg, D.L.; Hawley, S.J.; True, L.D.; Vessella, R.L.; Takayama, T.K. Overexpression of protease-activated receptors-1,-2, and-4 (PAR-1, -2, and -4) in prostate cancer. Prostate 2007, 67, 743–756. [Google Scholar] [CrossRef] [PubMed]
  49. Gratio, V.; Walker, F.; Lehy, T.; Laburthe, M.; Darmoul, D. Aberrant expression of proteinase-activated receptor 4 promotes colon cancer cell proliferation through a persistent signaling that involves Src and ErbB-2 kinase. Int. J. Cancer 2009, 124, 1517–1525. [Google Scholar] [CrossRef] [PubMed]
  50. Ando, S.; Otani, H.; Yagi, Y.; Kawai, K.; Araki, H.; Fukuhara, S.; Inagaki, C. Proteinase-activated receptor 4 stimulation-induced epithelial-mesenchymal transition in alveolar epithelial cells. Respir. Res. 2007, 8, 31–45. [Google Scholar] [CrossRef] [PubMed]
  51. Kaufmann, R.; Rahn, S.; Pollrich, K.; Hertel, J.; Dittmar, Y.; Hommann, M.; Henklein, P.; Biskup, C.; Westermann, M.; Hollenberg, M.D.; et al. Thrombin-mediated hepatocellular carcinoma cell migration: Cooperative action via proteinase-activated receptors 1 and 4. J. Cell Physiol. 2007, 211, 699–707. [Google Scholar] [CrossRef] [PubMed]
  52. Fu, Q.; Cheng, J.; Gao, Y.; Zhang, Y.; Chen, X.; Xie, J. Protease-activated receptor 4: A critical participator in inflammatory response. Inflammation 2015, 38, 886–895. [Google Scholar] [CrossRef] [PubMed]
  53. Zhang, H.; Jiang, P.; Zhang, C.; Lee, S.; Wang, W.; Zou, H. PAR4 overexpression promotes colorectal cancer cell proliferation and migration. Oncol. Lett. 2018, 16, 5745–5752. [Google Scholar] [CrossRef] [PubMed]
  54. Zhang, Y.; Schöttker, B.; Ordóñez-Mena, J.; Holleczek, B.; Yang, R.; Burwinkel, B.; Butterbach, K.; Brenner, H. F2RL3 methylation, lung cancer incidence and mortality. Int. J. Cancer 2015, 137, 1739–1748. [Google Scholar] [CrossRef] [PubMed]
  55. Arachiche, A.; Mumaw, M.M.; de la Fuente, M.; Nieman, M.T. Protease-activated Receptor 1 (PAR1) and PAR4 Heterodimers Are Required for PAR1-enhanced Cleavage of PAR4 by α-Thrombin. J. Biol. Chem. 2013, 288, 32553–32562. [Google Scholar] [CrossRef] [PubMed]
  56. Leger, A.J.; Jacques, S.L.; Badar, J.; Kaneider, N.C.; Derian, C.K.; Andrade-Gordon, P.; Covic, L.; Kuliopulos, A. Blocking the Protease-Activated Receptor 1-4 Heterodimer in Platelet-Mediated Thrombosis. Circulation 2006, 113, 1244–1254. [Google Scholar] [CrossRef] [PubMed]
  57. Sveshnikova, A.N.; Balatskiy, A.V.; Demianova, A.S.; Shepelyuk, T.O.; Shakhidzhanov, S.S.; Balatskaya, M.N.; Pichugin, A.V.; Ataullakhanov, F.I.; Panteleev, M.A. Systems biology insights into the meaning of the platelet’s dual-receptor thrombin signaling. J. Thromb. Haemost. 2016, 14, 2045–2057. [Google Scholar] [CrossRef] [PubMed]
  58. Kahn, M.L.; Zheng, Y.W.; Huang, W.; Bigornia, V.; Zeng, D.; Moff, S.; Farese, R.V., Jr.; Tam, C.; Coughlin, S.R. A dual thrombin receptor system for platelet activation. Nature 1998, 394, 690–694. [Google Scholar] [CrossRef] [PubMed]
  59. Zhang, Q.; Park, E.; Kan, K.; Landgraf, R. Functional isolation of activated and unilaterally phosphorylated heterodimers of ERBB2 and ERBB3 as scaffolds in ligand-dependent signaling. Proc. Natl. Acad. Sci. USA 2012, 109, 13237–13242. [Google Scholar] [CrossRef] [PubMed]
  60. Hanker, A.B.; Brown, B.P.; Meiler, J.; Marín, A.; Jayanthan, H.S.; Ye, D.; Lin, C.C.; Akamatsu, H.; Lee, K.M.; Chatterjee, S.; et al. Co-occurring gain-of-function mutations in HER2 and HER3 modulate HER2/HER3 activation, oncogenesis, and HER2 inhibitor sensitivity. Cancer Cell 2021, 39, 1099–1114. [Google Scholar] [CrossRef] [PubMed]
  61. Roskoski, R., Jr. Small molecule inhibitors targeting the EGFR/ErbB family of protein-tyrosine kinases in human cancers. Pharmacol. Res. 2019, 139, 341–395. [Google Scholar] [CrossRef] [PubMed]
  62. Ma, G.; Wang, C.; Lv, B.; Jiang, Y.; Wang, L. Proteinase-activated receptor-2 enhances Bcl2-like protein-12 expression in lung cancer cells to suppress p53 expression. Arch. Med. Sci. 2019, 15, 1147–1153. [Google Scholar] [CrossRef] [PubMed]
  63. Kojima, K.; Ishizawa, J.; Andreeff, M. Pharmacological activation of wild-type p53 in the therapy of leukemia. Exp. Hematol. 2016, 44, 791–798. [Google Scholar] [CrossRef] [PubMed]
  64. Vogelstein, B.; Lane, D.; Levine, A.J. Surfing the p53 network. Nature 2000, 408, 307–310. [Google Scholar] [CrossRef] [PubMed]
  65. Levine, A.J.; Oren, M. The first 30 years of p53: Growing ever more complex. Nat. Rev. Cancer. 2009, 9, 749–758. [Google Scholar] [CrossRef] [PubMed]
  66. Liu, H.; Wenng, J.; Huang, C.L.-H.; Jackson, A.P. Is the voltage-gated sodium channel β3 subunit (SCN3B) a biomarker for glioma? Funct. Integr. Genom. 2024, 24, 162–167. [Google Scholar] [CrossRef] [PubMed]
  67. Gottlieb, T.M.; Oren, M. p53 and apoptosis. Semin. Cancer Biol. 1998, 8, 359–368. [Google Scholar] [CrossRef] [PubMed]
  68. Reed, J.C. Dysregulation of apoptosis in cancer. J. Clin. Oncol. 1999, 17, 2941–2953. [Google Scholar] [CrossRef] [PubMed]
  69. Eskandari, E.; Eaves, C.J. Paradoxical roles of caspase 3 in regulating cell survival, proliferation, and tumorigenesis. J. Cell Biol. 2022, 221, e202201159–e202201172. [Google Scholar] [CrossRef] [PubMed]
  70. Joseph, B.; Ekedahl, J.; Lewensohn, R.; Marchetti, P.; Formstecher, P.; Zhivotovsky, B. Defective caspase-3 relocalization in non-small cell lung carcinoma. Oncogene 2001, 20, 2877–2888. [Google Scholar] [CrossRef] [PubMed]
  71. Abraham, S.A.; Hopcroft, L.E.M.; Carrick, E.; Drotar, M.E.; Dunn, K.; Williamson, A.J.K.; Korfi, K.; Baquero, P.; Park, L.E.; Scott, M.T.; et al. Dual targeting of p53 and c-MYC selectively eliminates leukaemic stem cells. Nature 2016, 534, 341–346. [Google Scholar] [CrossRef] [PubMed]
  72. Elyada, E.; Pribluda, A.; Goldstein, R.E.; Morgenstern, Y.; Brachya, G.; Cojocaru, G.; Snir-Alkalay, I.; Burstain, I.; Haffner-Kraus, R.; Jung, S.; et al. CKIα ablation highlights a critical role for p53 in invasiveness control. Nature 2011, 470, 409–413. [Google Scholar] [CrossRef] [PubMed]
  73. Chang, C.H.; Kuo, C.J.; Ito, T.; Su, Y.Y.; Jiang, S.T.; Chiu, M.H.; Lin, Y.H.; Nist, A.; Mernberger, M.; Stiewe, T.; et al. CK1α ablation in keratinocytes induces p53-dependent, sunburn-protective skin hyperpigmentation. Proc. Natl. Acad. Sci. USA 2017, 114, E8035–E8044. [Google Scholar] [CrossRef] [PubMed]
  74. Minzel, W.; Venkatachalam, A.; Fink, A.; Hung, E.; Brachya, G.; Burstain, I.; Shaham, M.; Rivlin, A.; Omer, I.; Zinger, A.; et al. Small Molecules Co-targeting CKIα and the Transcriptional Kinases CDK7/9 Control AML in Preclinical Models. Cell 2018, 175, 171–185. [Google Scholar] [CrossRef] [PubMed]
  75. Rodriguez, L.G.; Wu, X.; Guan, J.L. Wound-Healing Assay. Methods Mol. Biol. 2005, 294, 23–29. [Google Scholar] [PubMed]
  76. Franken, N.A.P.; Rodermond, H.M.; Stap, J.; Haveman, J.; van Bree, C. Clonogenic assay of cells in vitro. Nat. Protoc. 2006, 1, 2315–2319. [Google Scholar] [CrossRef] [PubMed]
Figure 1. The knockdown of Par2 inhibits PAR2 and PAR4-induced signaling. (a) (i) The knockdown of Par2 attenuates PAR2 and PAR4-induced nuclear β-catenin levels. Western blot analysis of HT29 and HT29 shPar2 cells. HT29 cells were infected with the lentiviral small hairpin RNA (shPar2) vector. The cells were activated by an addition of peptide SLIGKV and AYPGKF for the indicated intervals. Nuclear fractions were prepared and Western blot analysis was carried out for the detection of β-catenin levels in the cell nucleus. Lamin A/C served as a control for nuclear protein loading. (a) (ii) Band intensities of β-catenin/Lamin A/C. (a) (iii) qRT-PCR analyses showing levels of Par4 in colon-cancer-cell lines. (b) (iiii) TOPflash luciferase transcription activity in the presence of PAR2 and PAR4 HCT116 cells when shRNA Par2/f2RL1 is silenced. Lymphoid enhancer factor/t-cell factor (Lef/Tcf) reporter activity of PAR2 was markedly induced following SLIGKV and AYPGKF peptide-mediated PAR2 and PAR4 activation in HCT116 cells. Attenuated Lef/Tcf activity was obtained following PAR2 and PAR4 activation when Par2 was silenced. Data are expressed as means ± SD. *** p < 0.001,** p < 0.003. (c) (i) The knockdown of Par2 attenuates PAR2&4-induced nuclear levels of DVL1. Western blot analysis of HT29 and HT29 sh-Par2 cells. Cells were activated by an addition of the SLIGKV and AYPGKF peptides for the indicated intervals. Nuclear fractions were obtained and Western blot analysis was carried out for detection of DVL1 by anti-DVL-1 antibodies. Lamin A/C served as a control for nuclear protein loading. (c) (ii) Band intensities of DVL1/Lamin A/C. A representative of three independent experiments is shown.
Ijms 26 02780 g001
Figure 2. Silencing of Par2 in HCT116 cells inhibits PAR2 and PAR4 -induced invasion. (a) (i) Matrigel invasion of shRNA-Par2-infected HCT116 cells versus wt HCT116 cells. (a) (ii) Histograms represent the quantification of cell/HPF invasion of the Matrigel layer. Unpaired Student’s t test was used to assess the results. (b) (i) Silencing of Par2 in HT29 cells inhibits peptide SLIGKV- and AYPGKF-induced PAR2 and PAR4 cell migration/proliferation. A wound-scratch assay in HT29 shPar2-infected cells and HT29 cells. A cell monolayer grown to 90% confluency was “starved” for 16 h (h) prior to performing the scratch. Peptide SLIGKV- and AYPGKF-mediated activation of PAR2 and PAR4 was carried out for 118 h. (b) (ii) Histograms represent the quantification of the space measured (cm) after 118 h. Unpaired Student’s t test was used for data comparison. (c) (i) Co-association of PAR2 and PAR4 shown by co-immunoprecipitation. HEK293 cells were transiently transfected with the Par2/f2rl1 and Par4/f2rl3 plasmids and treated with the SLIGKV and AYPGKF peptides for the indicated intervals (min). Note that 0 indicates time prior to PARs activation for 15 and 30 min. Since the association between PAR2 and PAR4 is determined relative to the time prior to activation (e.g., 0), we performed it twice. Cell lysates were then prepared and immunoprecipitated using anti-PAR2 antibodies or IgG. (c) (ii) Evaluation of band intensities; PAR4 per PAR2 levels. A representative of the three independent experiments performed is shown. (d) (i) TrPAR2 is associated with PAR4 and co-immunoprecipitation. HEK293 cells were transiently transfected with the flag-Par4, tr-Par2, and wtYFP-Par2 plasmids. The activation of both PAR2 and PAR4 by the SLIGKV and AYPGKF peptides was carried out for the indicated intervals (min). Cell lysates were immunoprecipitated using anti-PAR2 antibodies or IgG, and the PAR4 level was detected by Western blot. The levels of PAR2 and PAR4 are shown as controls for the IP analysis. (d) (ii) The band intensity of immunoprecipitated PAR4/PAR2 is shown. These are representative of three independent experiments. *** p < 0.001; ** p < 0.01; * p < 0.05.
Ijms 26 02780 g002
Figure 3. TrPAR2 inhibits events in PAR2 and PAR4-induced β-catenin stabilization. (a) A schematic representation of PAR2 and TrPAR2. (b) (i) PAR2 and PAR4 -induced phospho (p)LRP6 in the presence or absence of TrPar2. HEK293 cells were transiently transfected with the Par2, Par4, and flag-β-catenin plasmids. The activation of both receptors by the SLIGKV and AYPGKF peptides was carried out for the indicated intervals (min). Western blot was carried out to detect pLRP6 and total LRP6. β-actin served as a control for protein loading. (b) (ii) The evaluation of band intensities; pLRP6 versus LRP6. A representative of three independent experiments performed is shown. (c) (i) PAR2 and PAR4-induced β-catenin stabilization in the presence or absence of TrPar2. Levels of β-catenin were increased following SLIGKV and AYPGKF peptide-mediated activation of PAR2 and/or PAR4. This was shown in HEK293 cells following transient transfection with the Par2, Par4, and flag-β-catenin plasmids. In contrast, no enhancement of PAR2 and PAR4-induced β-catenin stabilization was observed when TrPAR2 was present. β-actin served as a control for protein loading. (c) (ii) Evaluation of band intensities; β-catenin versus β-actin. (d) Lef/Tcf transcriptional activity by PAR2 and PAR4. The transiently transfected HEK293 cells as described for panel c were used. The activation of PAR2 and/or PAR4 induced Lef/Tcf Par2 and Par4 (TOPflash activity) transcriptional activity, in the presence of either wt PAR2 and PAR4 or TrPAR2 and PAR4. Data are expressed as means ± SD. *** p < 0.001, * p < 0.05. A representative of three independent experiments is shown. The figures shown are representative of three independent experiments.
Ijms 26 02780 g003
Figure 4. TrPAR2 inhibits PAR2 and PAR4-induced β-catenin protein and PAR2 and PAR4 -PH-Akt association. (a) (i) The characterization of RKO stable clones. qRT-PCR analysis. The level of PAR2 expression is shown. (a) (ii) RT-qPCR analysis. The level of PAR4 expression is shown. (b) (i) PAR2 and PAR4-induced β-catenin protein levels in the stable RKO clones. Levels of β-catenin following SLIGKV and AYPGKF peptide-mediated activation of PAR2 and PAR4 are shown. This was carried out in the presence of either wt PAR2 and PAR4 or TrPAR2 and PAR4. Note that 0 indicates the time prior to PAR activation, and 4 stands for 4 h activation. Since the increased level of β-catenin following activation is determined relative to the time prior to activation (e.g., zero time) we performed it twice. GAPDH serves as a control for protein loading. (b) (ii) The band intensity of the Western blot shown in bi is presented. (c) (i) TrPAR2 inhibits peptide SLIGKV- and AYPGKF-induced PAR2 and PAR4 -PH-Akt association. HEK 293 cells were transiently transfected with either plasmid pairs wtPar2 and wtPar4 or trPar2 and wtPar4. Peptide SLIGKV- and AYPGKF-mediated activation was performed for the indicated intervals (min). Cell lysates were immunoprecipitated with anti-PAR2 and anti-PAR4 antibodies and Western blotted for the detection of Akt. Levels of AKT, PAR2, and PAR4 in total cell lysates are shown as controls. (c) (ii) The evaluation of band intensities; Akt versus PAR2 levels. A representative of three independent experiments performed is shown. Data were expressed as mean ± SD. *** p < 0.001 (highest significance) or mean ± SD. ** p < 0.001. The figures shown are representative of three independent experiments.
Ijms 26 02780 g004
Figure 5. TrPAR2 inhibits PAR2 and PAR4-induced colony formation and expression of stem-cell markers. (a) Colony formation: The colony formation of wt PAR2 and wt PAR4 cells, as compared to tr PAR2 and wt PAR4 stable RKO clones. While abundant colonies were observed in wt PAR2&4-over-expressing clones, marked inhibition was seen when clones over-expressing TrPAR2 and wt PAR4 were evaluated. (b) Histograms representing the number of colonies shown in (a). The number of colonies shown in panel (a) is presented via histograms. Note that 0 indicates time prior to PAR activation, and 4 stands for 4 h activation. (c) Expression of the stem-cell markers CD166, cJUN, OCT4 and OLFM4 were measured by qRT-PCR. Data show means ± SD, * = p ≤ 0.05; ** = p ≤ 0.01; *** = p ≤ 0.001. The experiment was performed three times. ns: not significant.
Ijms 26 02780 g005
Figure 6. TrPAR2 inhibits PAR2 and PAR4-induced tumors. (a). Stable RKO clones: RKO/wt Par2 and wt Par4; trPar2 and wt Par4; trPar2 and wt RKO cells (1 × 10⁶ cells) were inoculated subcutaneously into nude mice. The mice were sacrificed after 35 days. (b). The tumor weight of each of the inoculated clones is shown. (c). Levels of PAR2 and PAR4 expression were determined by qRT-PCR in the mice inoculated with the clones. Data were expressed as mean ± SD. *** p < 0.001 (highest significance) or mean ± SD. ** p < 0.001. One of three independent experiments is shown. * p < 0.05.
Ijms 26 02780 g006
Figure 7. Application of Pc(4-4) to peptide SLIGKV-activated cancer-cell lines protects levels of wt p53. (a) Matrigel invasion of protease-activated PAR2 and PAR4. HCT116 colorectal cells were treated with both trypsin and IIa (thrombin) at 1 U/mL. Cells invading Matrigel layer were obtained in the presence and absence of Pc(4-4). Rescue of invasion was obtained following the wash out of the highest Pc(4-4) concentration. (b) (i) Western blots. Either HCT116 or Lovo cancer cells were PAR2-activated by the SLIGKV peptide for the indicated intervals. This was performed in the presence or absence of varying concentrations of Pc(4-4). Following PAR2 activation, wt p53 was degraded over time, and increased levels of wt p53 were seen upon application of Pc(4-4). β-actin served as a control. (b) (ii) An evaluation of the bands; levels of p53 versus β-actin. (c) IHC of tissue sections generated from inoculated HCT116 cells presenting high PAR2&4 levels [19], in the presence or absence of Pc(4-4) treatment. Levels of p21 in the presence and absence of Pc(4-4) in tumor-tissue sections are shown (d) Levels of active caspase-3 in sections of that were either treated with Pc(4-4) or not. The figures shown are representative of three independent experiments. *** p < 0.001; * p < 0.05.
Ijms 26 02780 g007
Disclaimer/Publisher’s Note: The statements, opinions and data contained in all publications are solely those of the individual author(s) and contributor(s) and not of MDPI and/or the editor(s). MDPI and/or the editor(s) disclaim responsibility for any injury to people or property resulting from any ideas, methods, instructions or products referred to in the content.

