2.1. Development of Regression Models for Predicting Tannin and Phenol Yields from Sargassum horneri
The objective was to optimize ultrasound-assisted extraction process parameters in order to maximize the extraction yield of tannins and phenols from SH. To optimize extraction process parameters, a model must be developed that can predict tannin and phenol extraction yields within designed extraction conditions. A regression model was developed to predict the extraction yield of tannin and phenol through extraction experiments designed by Design Expert (
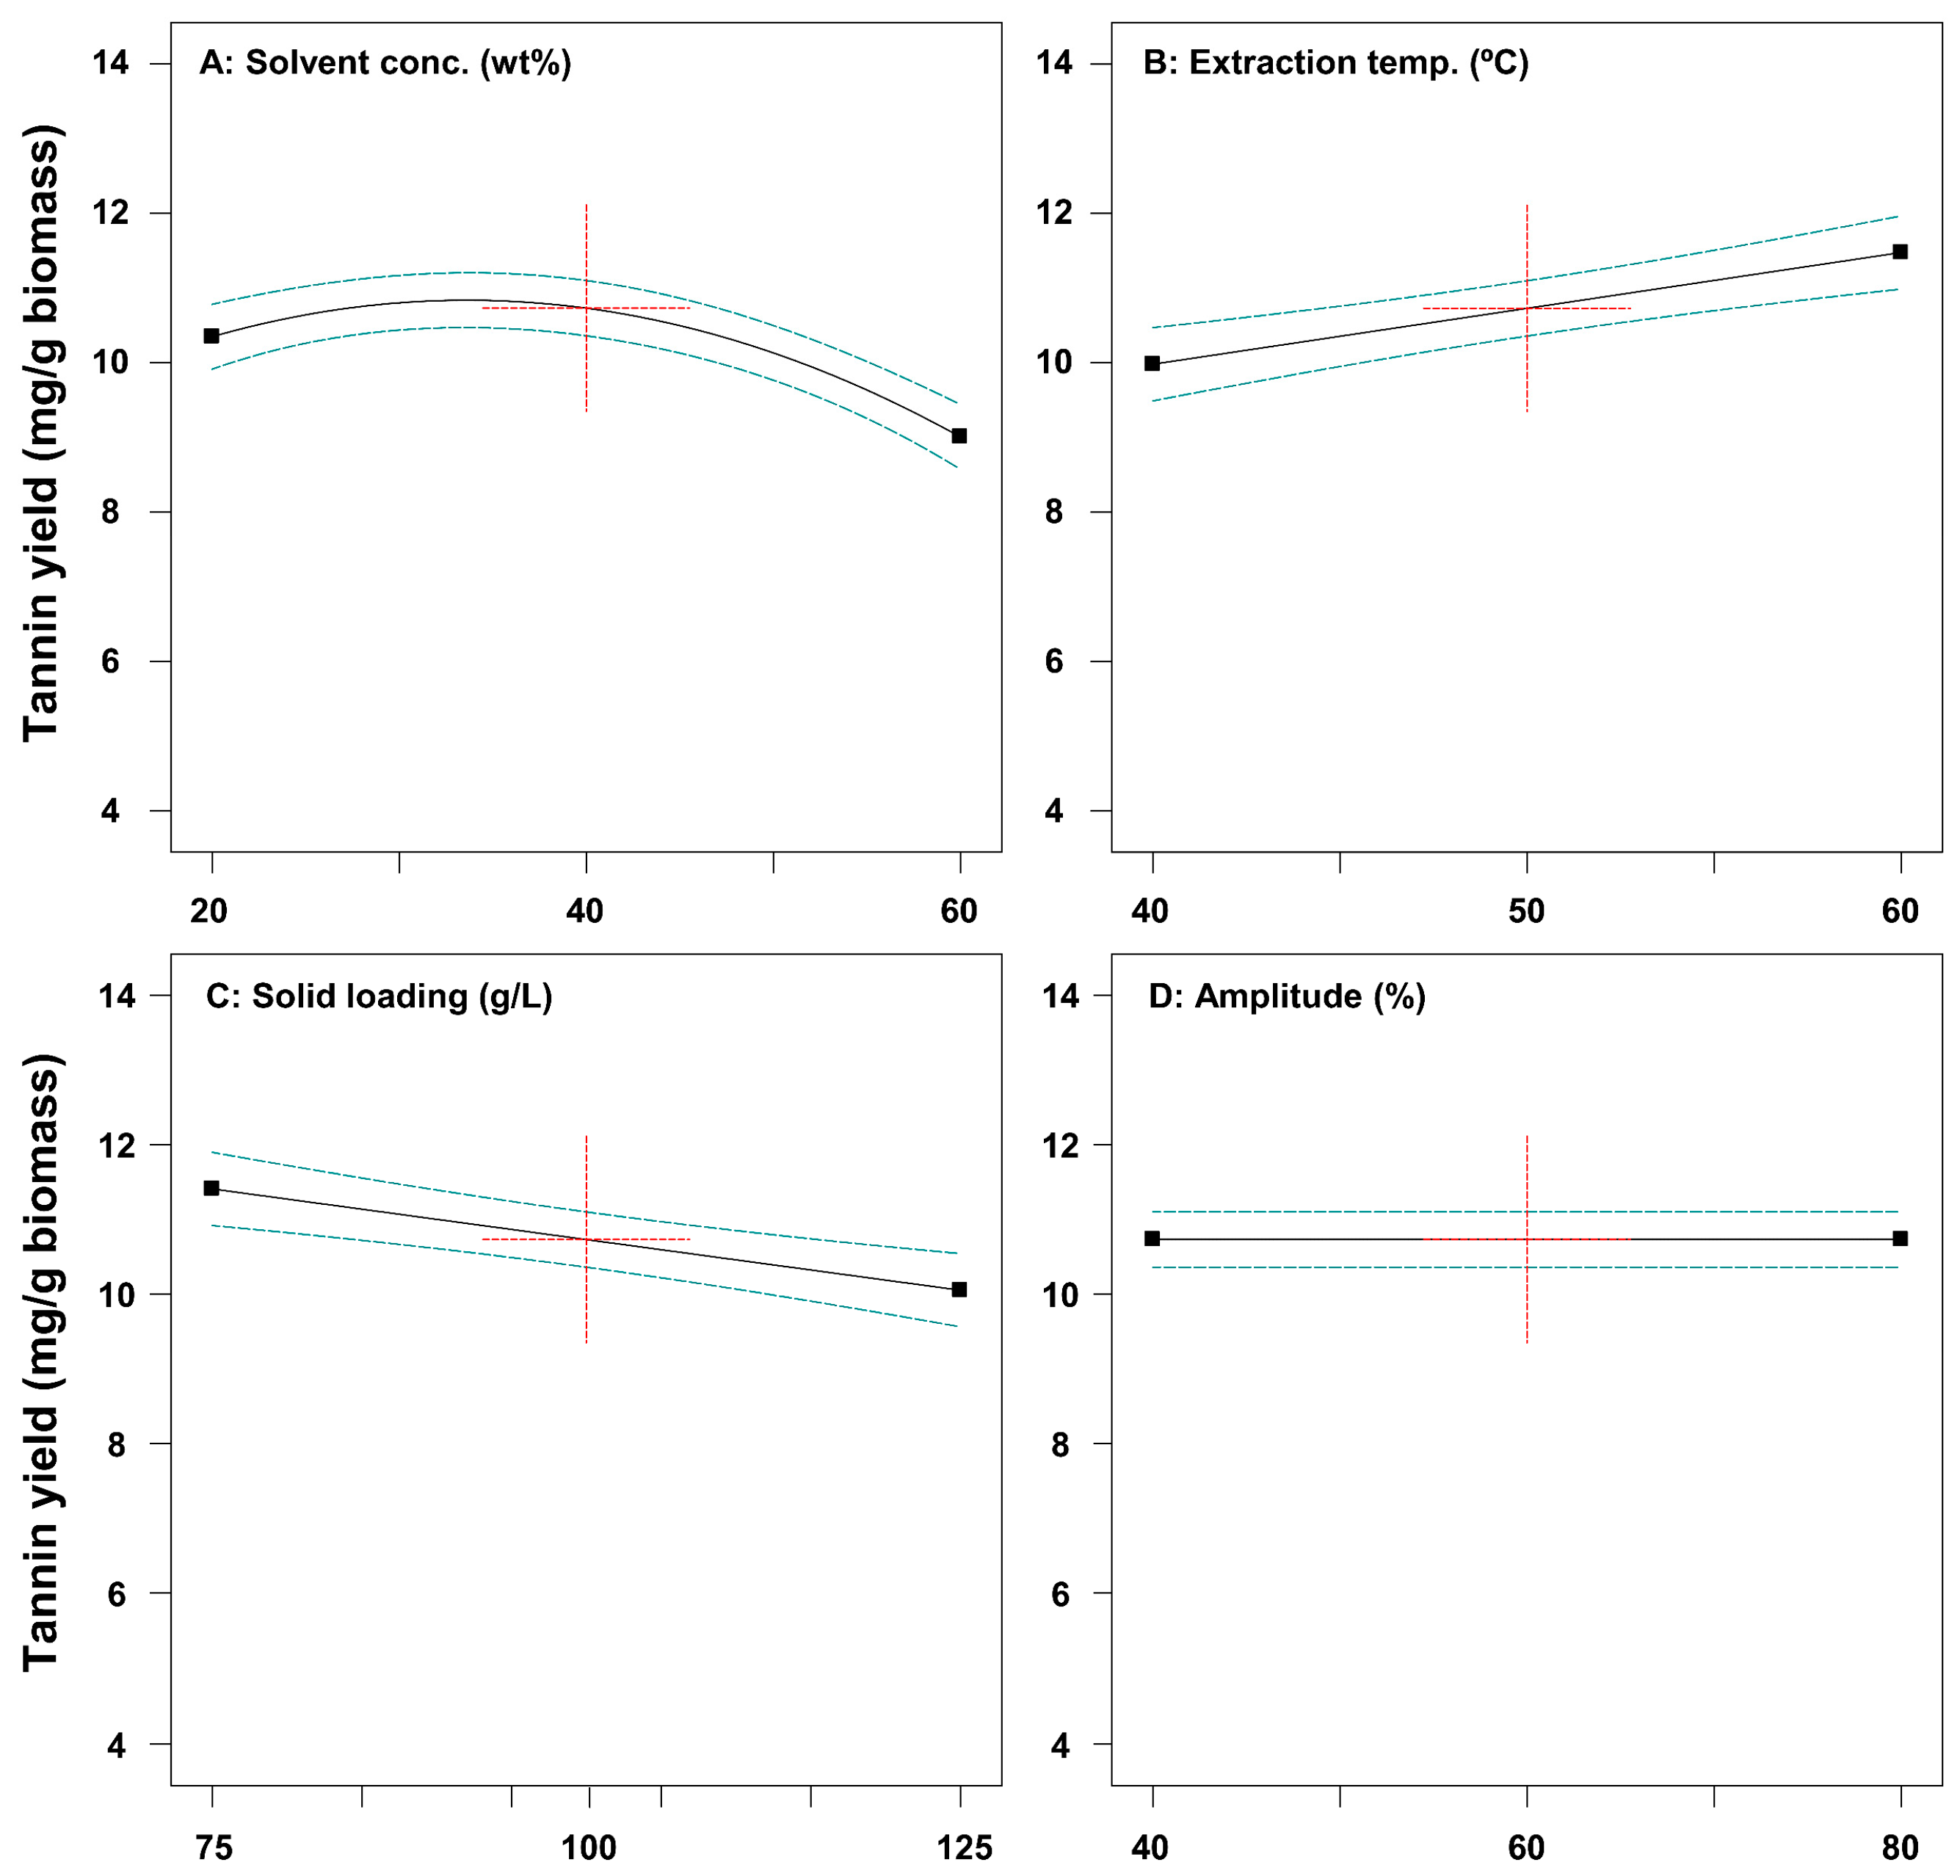
Table 1). Among the results of the extraction experiments, the highest tannin extraction yield (12.63 mg/g biomass) was observed under Std #20 (40% solvent, 70 °C, 100 g/L, and 60% amplitude). These results suggest that high temperatures are required for efficient tannin recovery from SH, but high concentrations of the solvent are not essential. The highest extraction yield of phenol (13.16 mg/g biomass) was observed under Std #4 (60% solvent, 60 °C, 75 g/L, and 40% amplitude). These results suggest that there is a partial difference, especially solvent concentration, between tannin and phenol recovery, requiring multi-objective optimization to produce bioactive extracts from SH.
Based on the results in
Table 2, a regression analysis was performed to predict tannin and phenol extraction yields, and the following Equations (1) and (2) were derived, respectively.
An analysis of variance (ANOVA) was performed to assess the statistical significance of regression model Equations (1) and (2) (
Table 2 and
Table 3). In general,
p-values less than 0.05 indicate that the prediction model and model terms are statistically significant. In the case of Equation (1), solvent conc. (A,
p-value = 0.001), extraction temp. (B,
p-value = 0.0004), and solid loading (C,
p-value = 0.0009) were significant parameters for tannin yield. On the contrary, it was confirmed that amplitude (D,
p-value = 0.8949) and all interaction effects did not have a significant effect (
p-value > 0.05) on tannin yield. Among the square terms, an indicator that evaluates the effect on tannin extraction yield when the value of each parameter increases to the limit, only A
2 (
p-value < 0.0001) was found to have a statistically significant effect. In the case of Equation (2), the single parameters extraction temp. (
p-value = 0.0399) and solid loading (
p-value = 0.0001), and the interaction effects AB (
p-value = 0.0225) and BC (
p-value = 0.0163) were confirmed as significant parameters for phenol yield. Single parameter A was confirmed to be not statistically significant, but the square term A
2 (
p-value = 0.0483) was found to have a significant impact, requiring reflection of parameter A into the model equation for numerical optimization [
4].
In the results of the ANOVA, the R
2 value is an indicator of the degree of agreement between predicted and observed values [
32]. As the R
2 value approaches 1, it can be judged that the prediction accuracy of the regression model is high. However, as the number of independent parameters increases, the R
2 value tends to increase regardless of the prediction accuracy. To prevent such overfitting errors, the adjusted R
2 value can be used as an indicator and was found to be 0.7692 for the tannin yield prediction model and 0.6040 for the phenol yield prediction model. To improve the prediction accuracy of the model, a model reduction was performed to remove model terms that did not have a statistically significant impact. As a result, the following reduced model Equations (3) and (4) were derived.
The results of the ANOVA on the improved model Equations (3) and (4) are summarized in
Table 4 and
Table 5. By removing statistically insignificant parameters (D, AB, AC, AD, BC, BD, CD, B
2, C
2, and D
2) from the initial model (1), the reduced model (3) was derived, and this model was selected as the final model to predict the tannin yield. An improved model (4) without the insignificant parameters (D, AC, AD, BD, CD, A
2, B
2, C
2, and D
2) of the initial model (2) was selected as the final model to predict the phenol yield.
2.3. Optimization of Extraction Parameters for Efficient Tannin and Phenol Recovery from Sargassum horneri
The developed models (3) and (4) can predict response values (i.e., tannin yield and phenol yield) within the designed range; thus, these were used in the numerical optimization. The targets were both maximizations of tannin yield and phenol yield from SH, and the results are shown in
Table 6. The optimal extraction conditions were derived as follows: solvent concentration, 39.1%; extraction temperature, 61.9 °C; solid loading, 52.0 g/L; and amplitude, 49.0%. Under these conditions, the tannin and phenol yields were predicted to be 12.95 and 13.37 mg/g biomass, respectively. To verify the prediction accuracy of the model, a verification experiment was conducted. As a result, the extraction yield of tannin and phenol was determined to be about 14.59 and 13.83 mg/g biomass, similar to the model-predicted values (
p-value > 0.05). Therefore, the prediction model is suitable for predicting tannin and phenol yields. This study is significant in that an optimization model was developed for the first time.
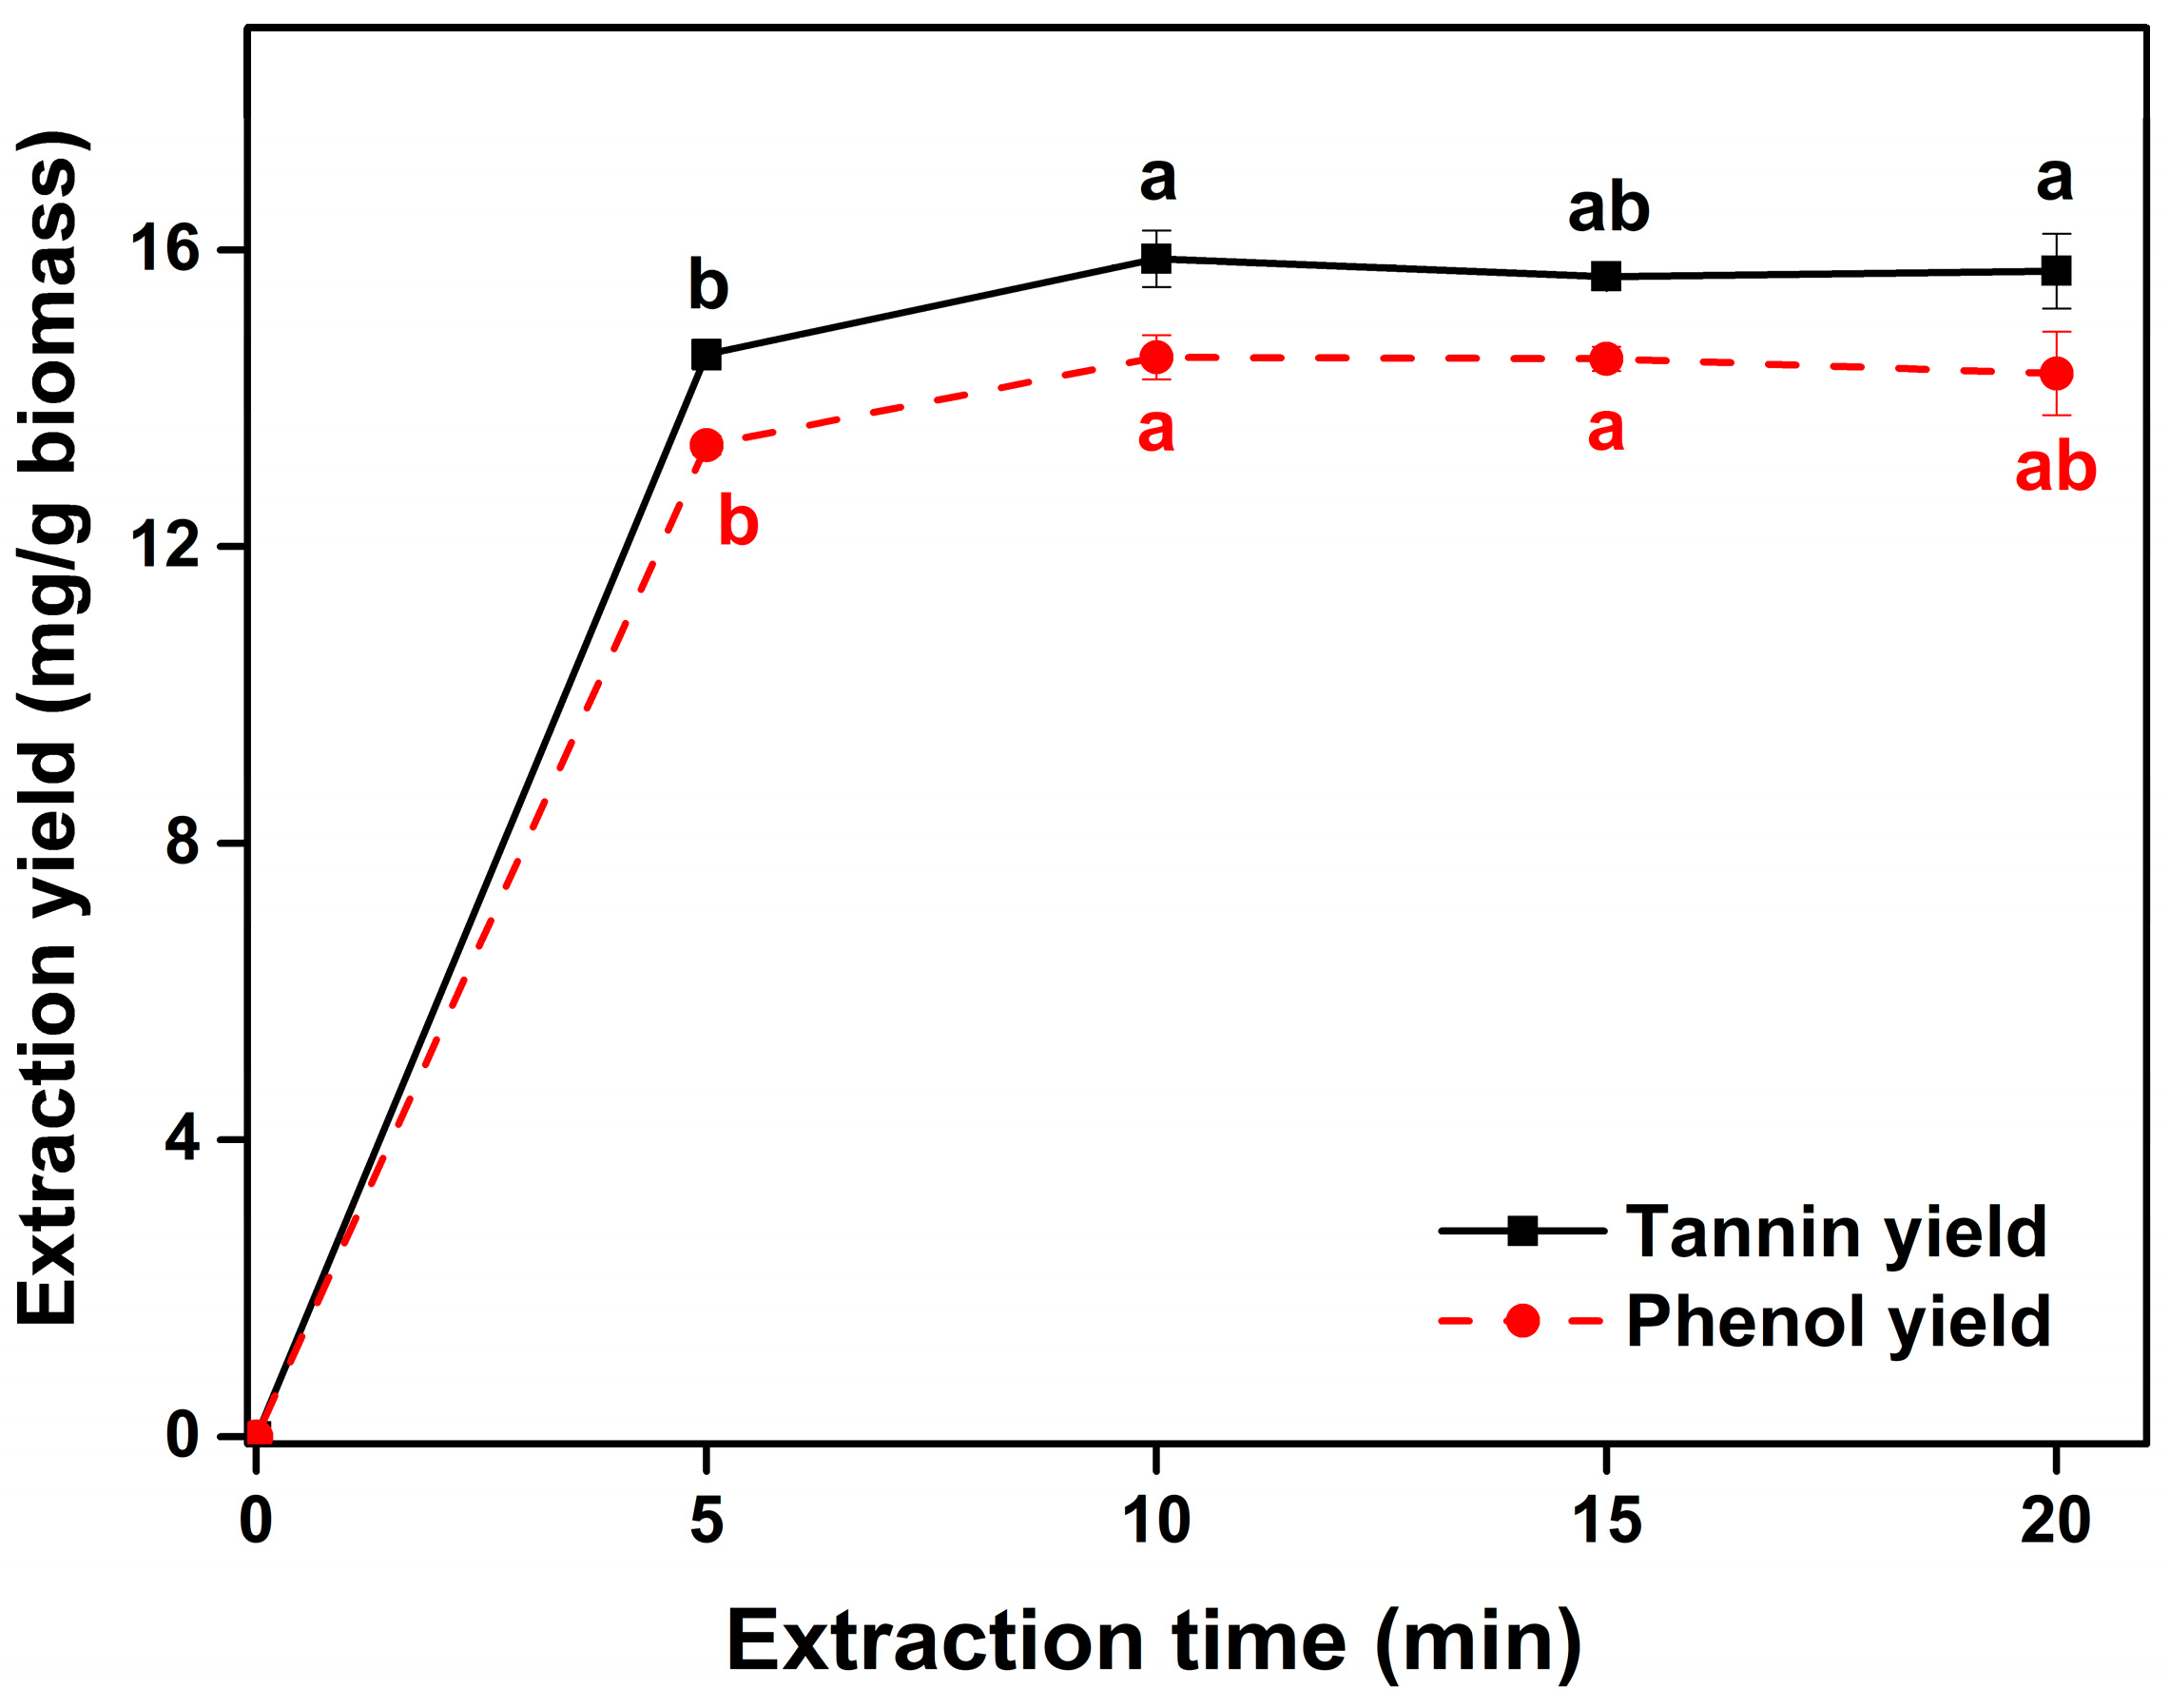
To further increase the tannin and phenol yields from SH, it is necessary to optimize the extraction time; thus, extraction profiling was performed for 20.0 min under the RSM-determined optimal conditions (
Figure 3). As a result, the extraction yields of tannin and phenol showed an increasing trend up to 10.0 min but did not significantly increase thereafter (
p < 0.05). Therefore, the optimal extraction time was determined to be 10.0 min. The extraction yield was determined to be about 15.88 ± 0.38 mg tannin and 14.55 ± 0.30 mg phenol per g biomass under the final conditions: solvent concentration, 39.1%; extraction temperature, 61.9 °C; solid loading, 52.0 g/L; amplitude, 49.0%; and extraction time, 10.0 min. Overall, this study designed an optimal ultrasound-assisted extraction process for producing bioactive compounds from SH with a high yield. The produced tannin and phenol contained in the SH extracts at 42.15 and 39.95 mg/g, respectively. Kim et al. [
17] produced SH extracts by immersing 10 g of dried SH in 500 mL of ethanol (70%) while stirring at room temperature for 12 h, and the total phenol content of the extracts was 8.52 ± 2.64 mg GAE/g. Therefore, the ultrasound-assisted extraction process is efficient for preparing phenol-rich SH extracts.
2.4. Antioxidant of Sargassum horneri Extracts
ABTS radical scavenging activity was determined to evaluate the antioxidant activity of the SH extracts (
Table 7). The results of the radical scavenging activity (%) of the extracts were represented as IC
50 values (μg/mL). The ABTS IC
50 value of the SH extracts was determined to be about 79.86 μg/mL, which was about 68% activity compared to that of ascorbic acid (ABTS IC
50: 54.37 μg/mL). This antioxidant activity may be attributed to compounds such as tannins and phenols. Dang et al. [
36] evaluated the ABTS radical scavenging activities of
Sargassum extracts such as
S. vestitum,
S. linearifolium, and
S. podocanthum extracts (at 0.06 mg/mL), and the activities were determined to be 31.71, 2.02, and 13.30 mg Trolox equivalent (TE)/g extract, respectively. These were 30.41%, 1.94%, and 12.76% activity compared to that of ascorbic acid (104.27 mg TE/g at 0.06 mg/mL) [
36]. In the case of
S. coriifolium extracts, the ABTS IC
50 value was determined to be 2.19 mg/mL, which was 7.31% activity of that of ascorbic acid (0.16 mg/mL) [
37]. Meanwhile, in addition to tannins and phenols, compounds that contribute to antioxidant activity may exist in SH extracts [
38,
39], requiring the further identification of bioactive molecules before practical applications. This study confirmed that the SH extracts are expected to have a high potential as a natural antioxidant among various
Sargassum extracts. The produced SH extracts with antioxidant activity can be applied to the development of antioxidant foods and antioxidant cosmetics. For instance, Park et al. [
40] developed a functional ingredient containing SH extracts for food applications, with antioxidant and anti-obesity effects. Choung et al. [
41] used SH extracts to develop a cosmetic with antioxidant and skin-whitening effects.
2.5. Effect of Sargassum horneri Extracts on the L929 Cell Viability
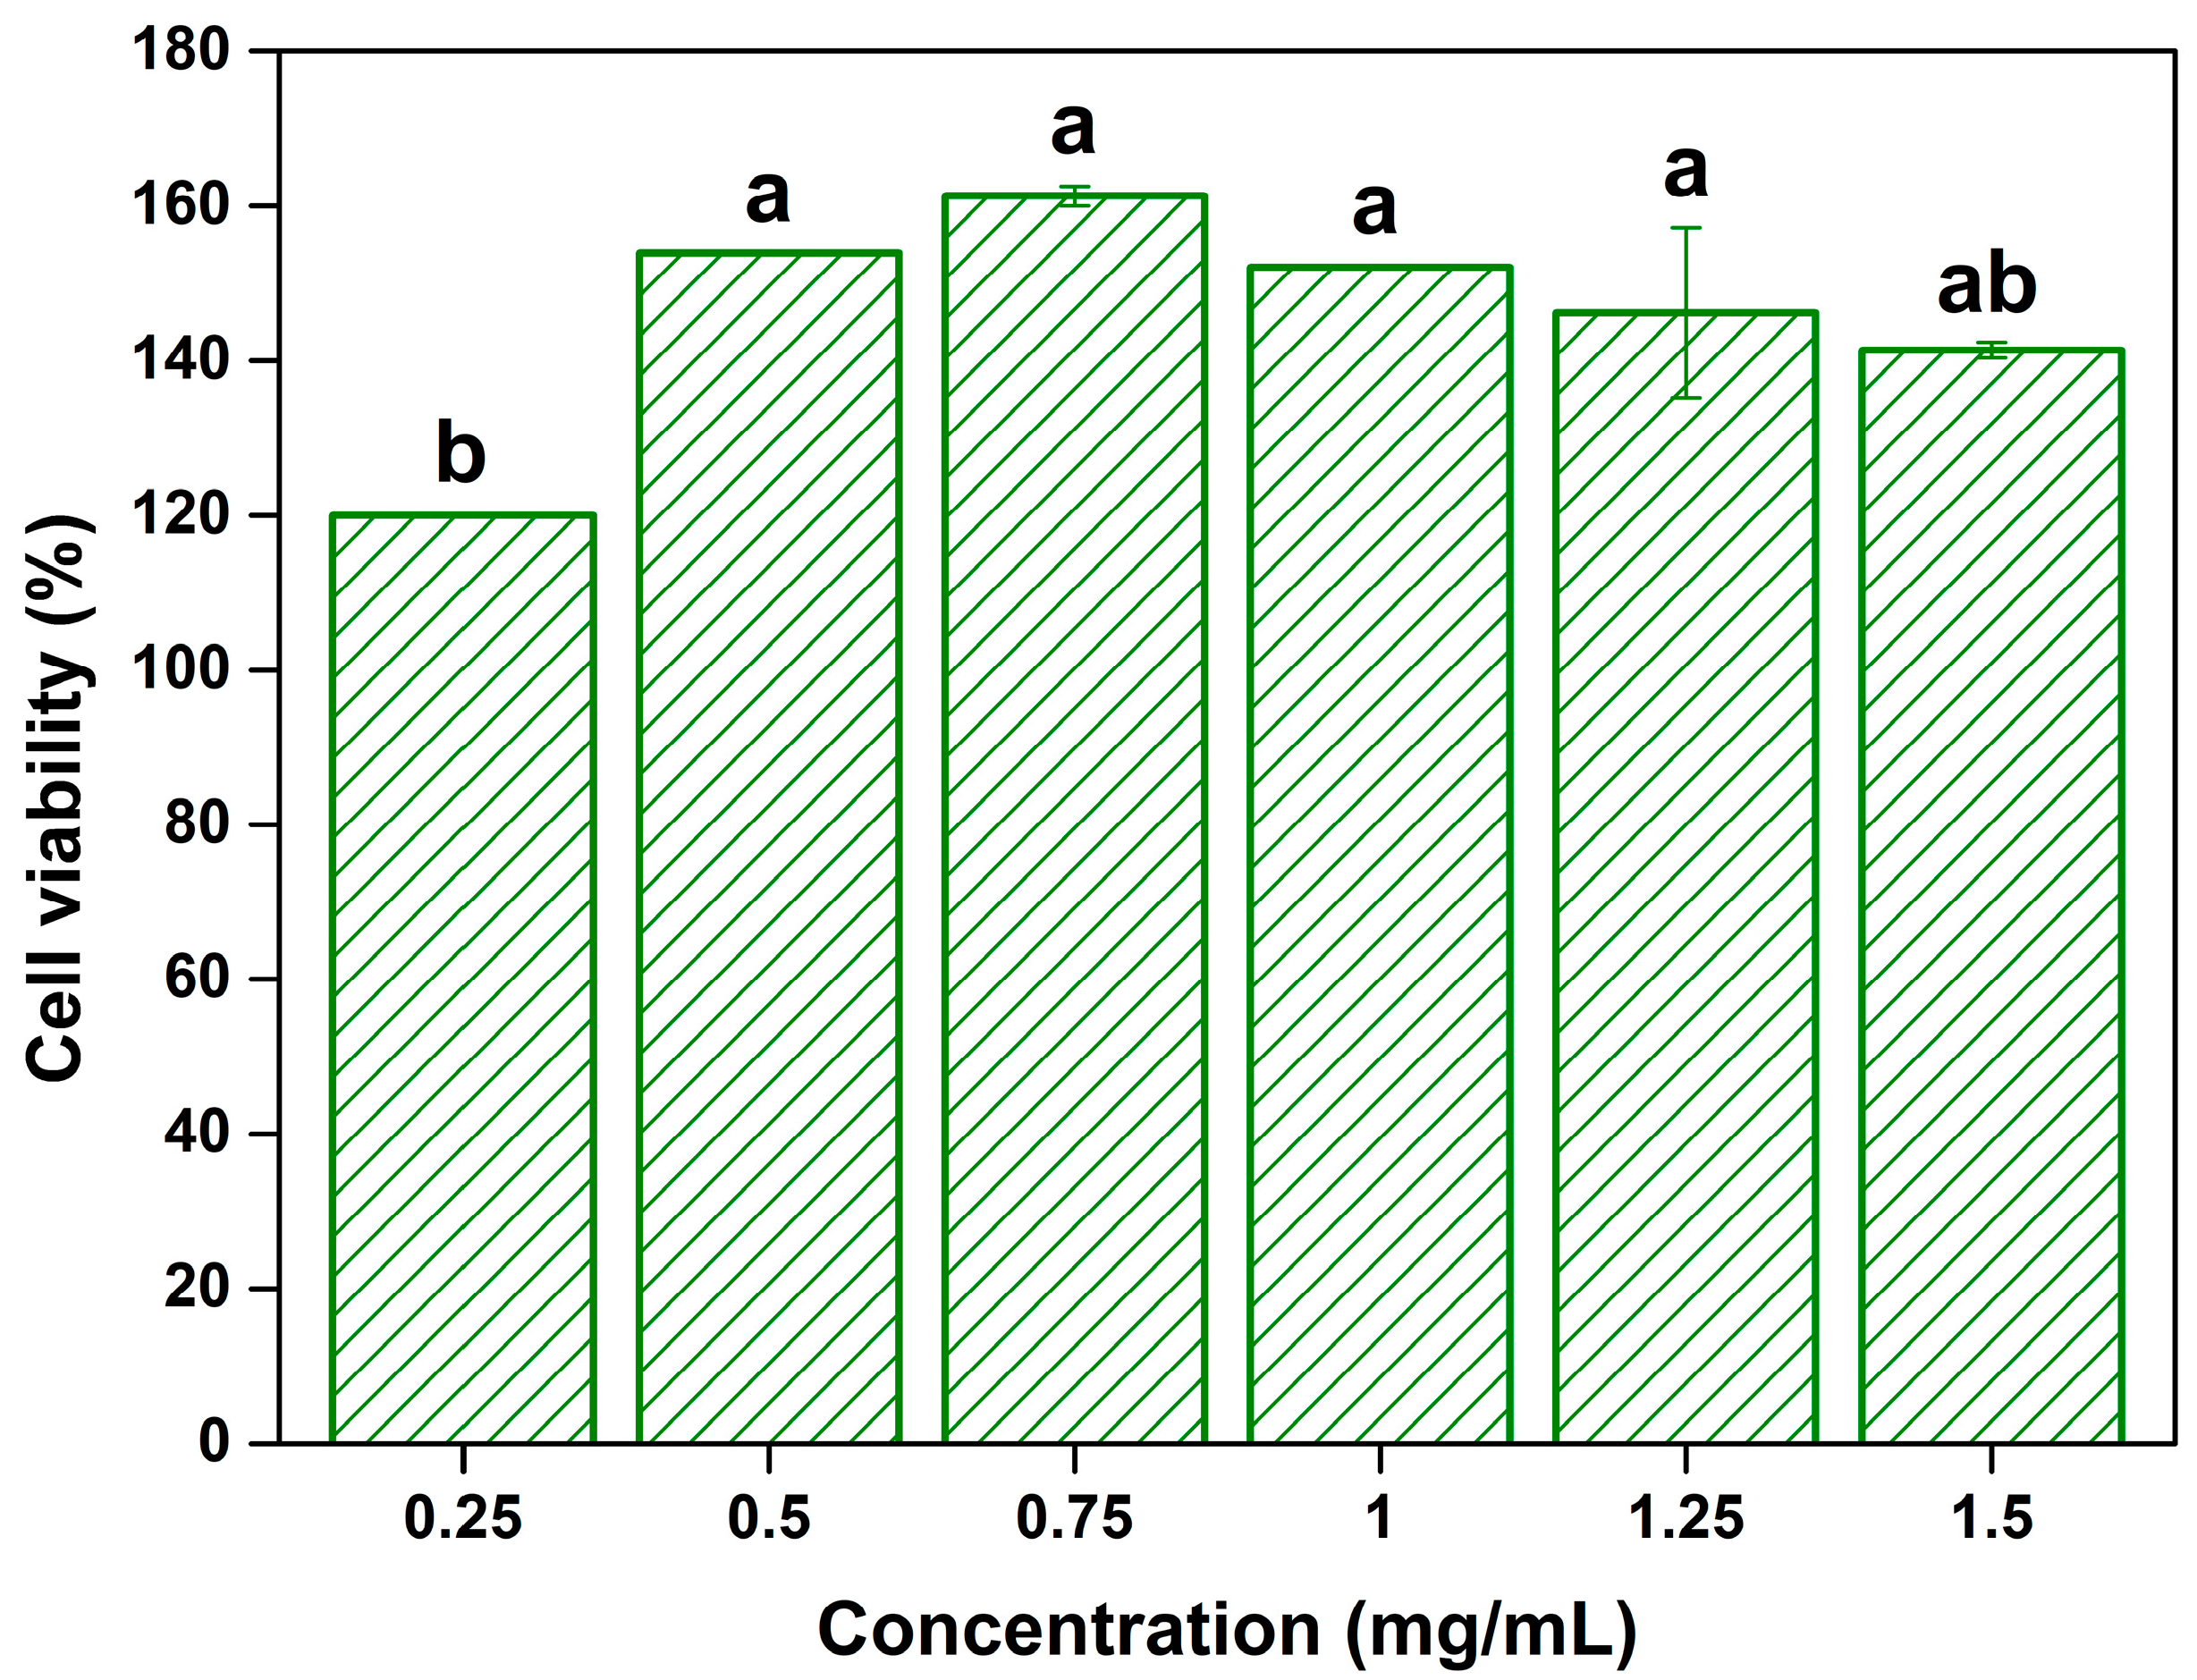
Figure 4 shows the cell viability of the SH extract-treated normal L929 fibroblast cells. Cell viability increased at all tested concentrations (0.25–1.5 mg/mL), with a maximum of 161.3% (at 0.75 mg/mL). In particular, cell viability in the extracts treatment group at concentrations of 0.5–1.25 mg/mL was significantly increased compared to that in the 0.25 mg/mL group (
p < 0.05). The improved cell viability due to the addition of SH extracts can be related to the antioxidant activity of SH extracts. According to Li et al. [
42], proteins secreted by the L929 cell lines are responsible for reactive oxygen species (ROS) production, and increased ROS levels have been reported to decrease cell viability. Turan et al. [
43] evaluated the cytotoxicity of curcumin-loaded nano-fibrous membranes, showing an increased L929 cell viability (at 24 h measurement), and they presumed that this increase could be related to the ability of curcumin to prevent the formation of ROS. Therefore, the increased cell viability in this study can be attributed to the antioxidant activity of the SH extracts, but the related mechanisms should be investigated in detail, considering the presence of other substances besides antioxidants such as tannins and phenols. The present study highlights the non-toxicity of the SH extracts, which indicates their potential safety for applications.


 ,
, 


