Article

Molecular Insights into Central Core Disease: Proteomic Signatures and Potential Therapeutic Biomarkers in RYR1 I4895T Mice

1
Functional Proteomics Lab., Department of Life Sciences, University of Siena, 53100 Siena, Italy
2
Department of Molecular and Developmental Medicine, University of Siena, 53100 Siena, Italy
3
Program of Molecular Diagnosis of Rare Genetic Diseases, Azienda Ospedaliera Universitaria Senese, 53100 Siena, Italy
*
Author to whom correspondence should be addressed.
Int. J. Mol. Sci. 2025, 26(23), 11451; https://doi.org/10.3390/ijms262311451
Submission received: 28 October 2025 / Revised: 18 November 2025 / Accepted: 24 November 2025 / Published: 26 November 2025
(This article belongs to the Section Molecular Biology)

Abstract

Central Core Disease (CCD) is a congenital myopathy predominantly caused by mutations in the gene encoding ryanodine receptor type-1 (RYR1), the intracellular Ca2+ release channel embedded in the skeletal muscle sarcoplasmic reticulum membrane. The I4898T mutation represents one of the most common RYR1 mutations associated with CCD. Unfortunately, there are no approved therapies for CCD or for other myopathies caused by mutations in this gene. This study aims to perform a top-down differential proteomic analysis on soleus muscle samples from wild-type mice (WT) and heterozygous knock-in mice carrying the I4895T (IT) mutation in RyR1, to investigate the pathogenic mechanisms and molecular pathways involved in this myopathy and to shed light on new potential biomarkers useful for future therapies. Proteomic analysis revealed 50 dysregulated protein species, and multivariate analysis showed that IT mice exhibit a distinct proteomic signature compared to WT mice, characterized by alterations in proteins associated with contractile and structural dysfunction, metabolism, and stress response. In particular, a significant increase in myosin fragments was observed in IT mice, likely due to muscle breakdown. In contrast, myotilin was downregulated, suggesting a weakening of the muscle cytoskeletal structure. There was a notable downregulation of proteins involved in glycolysis and the TCA cycle; conversely, there was an increase in proteins related to anaerobic glycolysis, suggesting a shift from aerobic to anaerobic glycolysis. Furthermore, proteins involved in fatty acid beta-oxidation and oxidative phosphorylation were also found to be upregulated in IT mice, indicating an attempt by the muscle to maximize energy production. Finally, we found a significant decrease in PGC1α, which could serve as potential therapy target and biomarker in CCD.

Graphical Abstract

1. Introduction

The RYR1 gene encodes the ryanodine receptor 1 (RYR1), a large tetrameric intracellular Ca2+ release channel of approximately 2.2 MDa, located on the sarcoplasmic reticulum (SR) of skeletal muscle. RYR1 channels play a pivotal role in excitation–contraction (EC) coupling, the process by which an action potential is transduced into Ca2+ release from the SR, resulting in physiological activation of muscle contraction [1,2,3].
From a genetic perspective, dominant mutations in RYR1 are the principal cause of malignant hyperthermia (MH), a potentially lethal reaction triggered by certain anesthetics or, less commonly, by extreme environmental heat and/or intense physical exertion [3,4,5,6]. In addition to causing MH, RYR1 mutations also cause congenital non-dystrophic muscle myopathies [1,2,3,4,7,8,9,10,11,12,13,14,15,16]. These myopathies, which may show dominant or recessive inheritance patterns, are collectively known as RYR1-related myopathies (RYR1-RM) [3,4]. Clinical presentation is highly variable, ranging from mild, non-progressive muscle weakness to severe forms requiring walking assistance or wheelchair use [4,8,13,14]. Feeding difficulties and respiratory involvement may also occur, potentially leading to the need for mechanical ventilation and reduced lifespan expectancy [7,10,11]. Central Core Disease (CCD) is the most frequent congenital myopathy and, in approximately 90% of cases, is caused by RYR1 mutations [12]. At the histopathological level, muscle biopsies from individuals with CCD show distinctive amorphous central regions, or cores, characterized by a conspicuous absence or depletion of mitochondrial and oxidative enzyme activity, increased internal and central nuclei, Z-line streaming, sarcomeric disorganization, and a predominance of type I muscle fibers [8,9]. Although it is widely accepted that all RYR1 mutations disrupt Ca2+ homeostasis, the mechanisms underlying muscle damage and hypotrophy remain poorly understood [7]. Currently, no specific treatment is available for CCD, and patient management is primarily supportive, employing a multidisciplinary approach such as daily physiotherapy [15].
The I4898T mutation in RYR1 is one of the most common mutations associated with CCD [4,9,11,12]. This I4898T mutation, localized in the pore region of the RYR1 channel, causes EC coupling disruption by abolishing or severely reducing Ca2+ release channel conductance [17,18,19]. Homozygous mice carrying the Ryr1 I4895T mutations (equivalent to I4898T in humans) show a severe phenotype, with paralysis at birth, inability to breathe, perinatal lethality, and delayed development of skeletal and cardiovascular systems [18,20]. Heterozygous Ryr1 I4895T mice (from now on referred to as IT mice) exhibit a mild myopathy characterized by diminished muscle performance and reduced Ca2+ transients amplitude in skeletal muscle fibers [17,19,21]. However, it is important to note that the phenotype of IT mice is relatively mild when compared with the clinical manifestations observed in humans [22]. Studies by Lee et al., 2017 [20] suggested that a persistent increase in ER stress/Unfolded Protein Response (UPR), increased in mitochondrial Ca2+ uptake, reactive oxygen species (ROSs) production, and induction of apoptosis may represent possible pathogenic mechanisms for CCD associated with the Ryr1 I4895T mutation.
To further investigate the pathogenic mechanisms and molecular pathways involved in this myopathy, and to shed light on new potential biomarkers useful for future therapeutic strategies or for delaying disease progression, we performed a top-down differential proteomic analysis on soleus muscles from wild-type mice and heterozygous IT knock-in mice.

2. Results and Discussion

The clinical course for the CCD patients is static or slowly progressive. While cardiac complications are uncommon, respiratory muscle involvement often has an insidious onset. Consequently, serial pulmonary function tests are necessary for lung function monitoring [11]. Furthermore, pediatric patients require surveillance for the development of scoliosis and other skeletal deformities [23]. Unfortunately, despite a medical necessity, there are currently no approved therapies for CCD [15]. Therapies currently under development include drugs targeting the RYR1 signaling axis, either by mitigating the cellular pathology arising from oxidative/nitrosative stress and subsequent RYR1 post-translational modification, or by direct modulating RYR1 activity or indirectly influencing its function through interaction with regulatory proteins. A top-down proteomic analysis can be valuable for enhancing knowledge of alterations in protein abundance or function, including different proteoforms, as well as changes in molecular mechanisms caused by pathology, aiding in the identification of novel therapeutic biomarkers for patient management.

2.1. WT and IT Mice Muscles Present a Differential Protein Pattern

To understand how mutations in the RYR1 gene affect cellular mechanisms in skeletal muscle tissues, we applied a top-down differential proteomic analysis between soleus samples from wild-type mice (WT) and heterozygous mice knock-in for RYR1 I4895T (IT). The use of a top-down proteomics approach has the advantage of considering both proteins and protein species, or proteoforms resulting from their post-translational modifications, thereby overcoming the dilemma of their quantification [24]. Based on our previous results and to increase the number of separated proteins, we used two different protein extraction methods [25]. About 2500 protein spots per gel were detected using image analysis software (Melanie 9.0), statistical analysis highlighted 50 differentially abundant spots (Table 1, Figure 1 and Figure S1), of which 43 were successfully identified using MALDI-ToF.
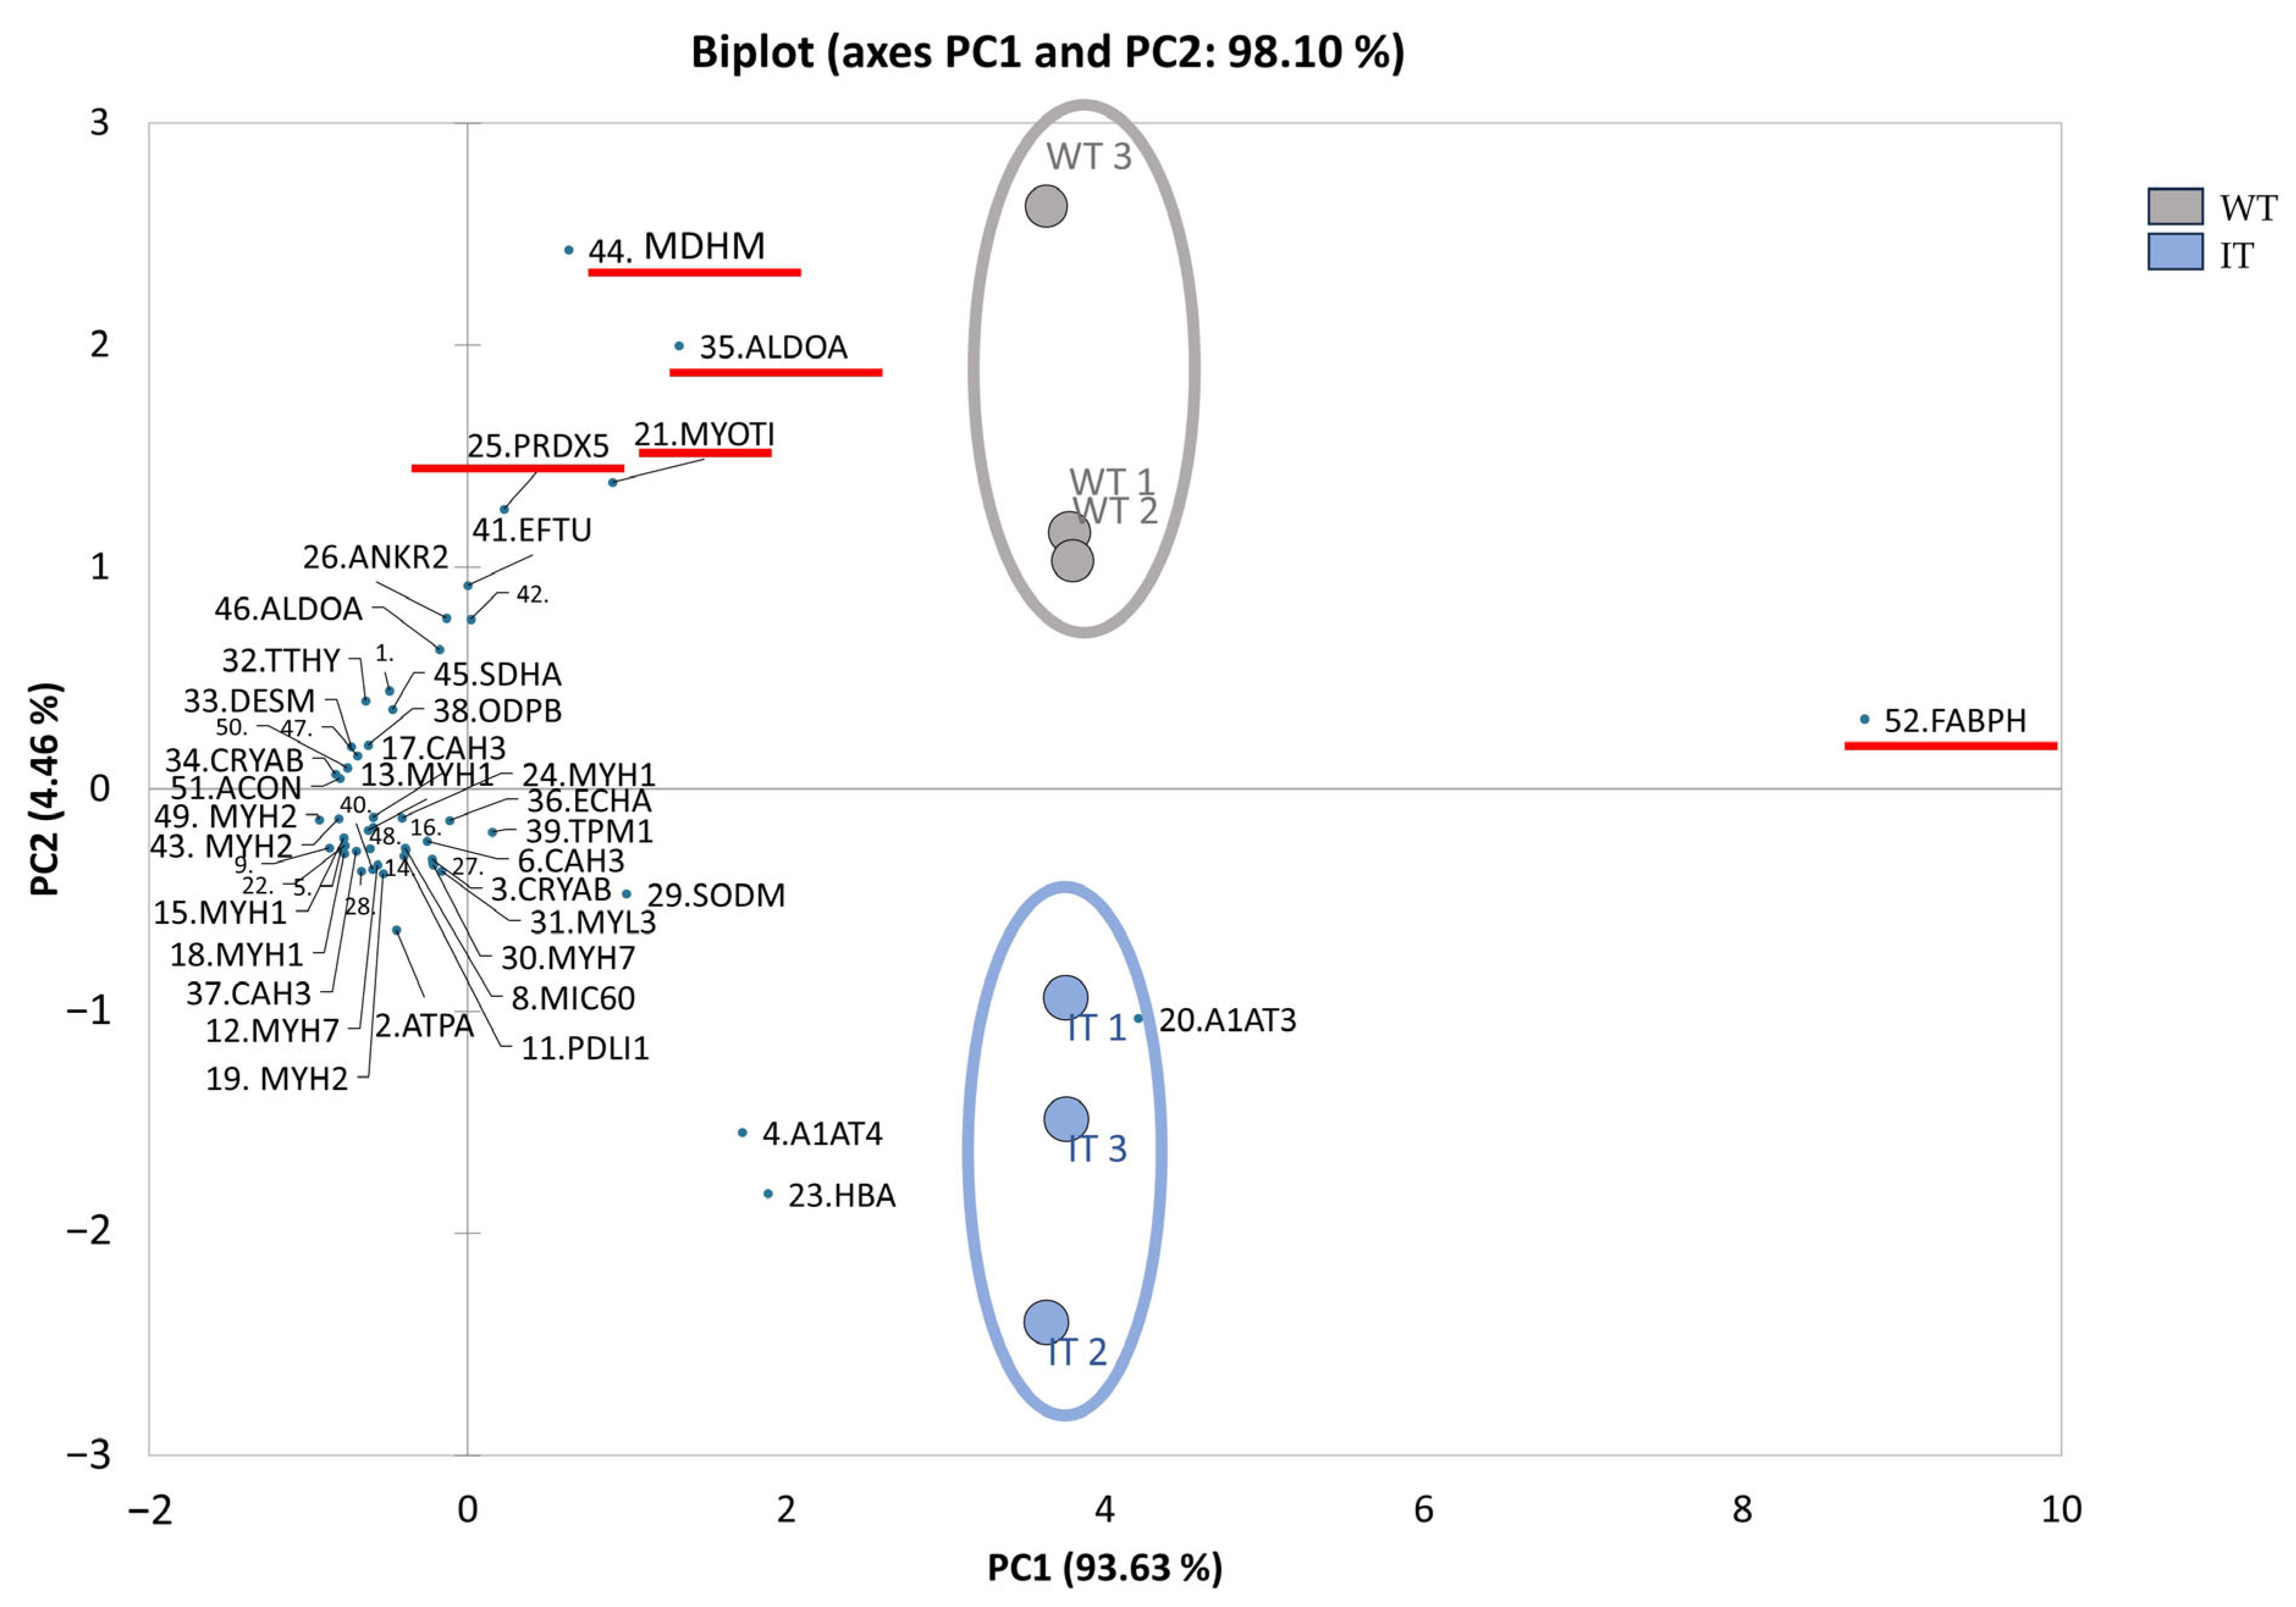
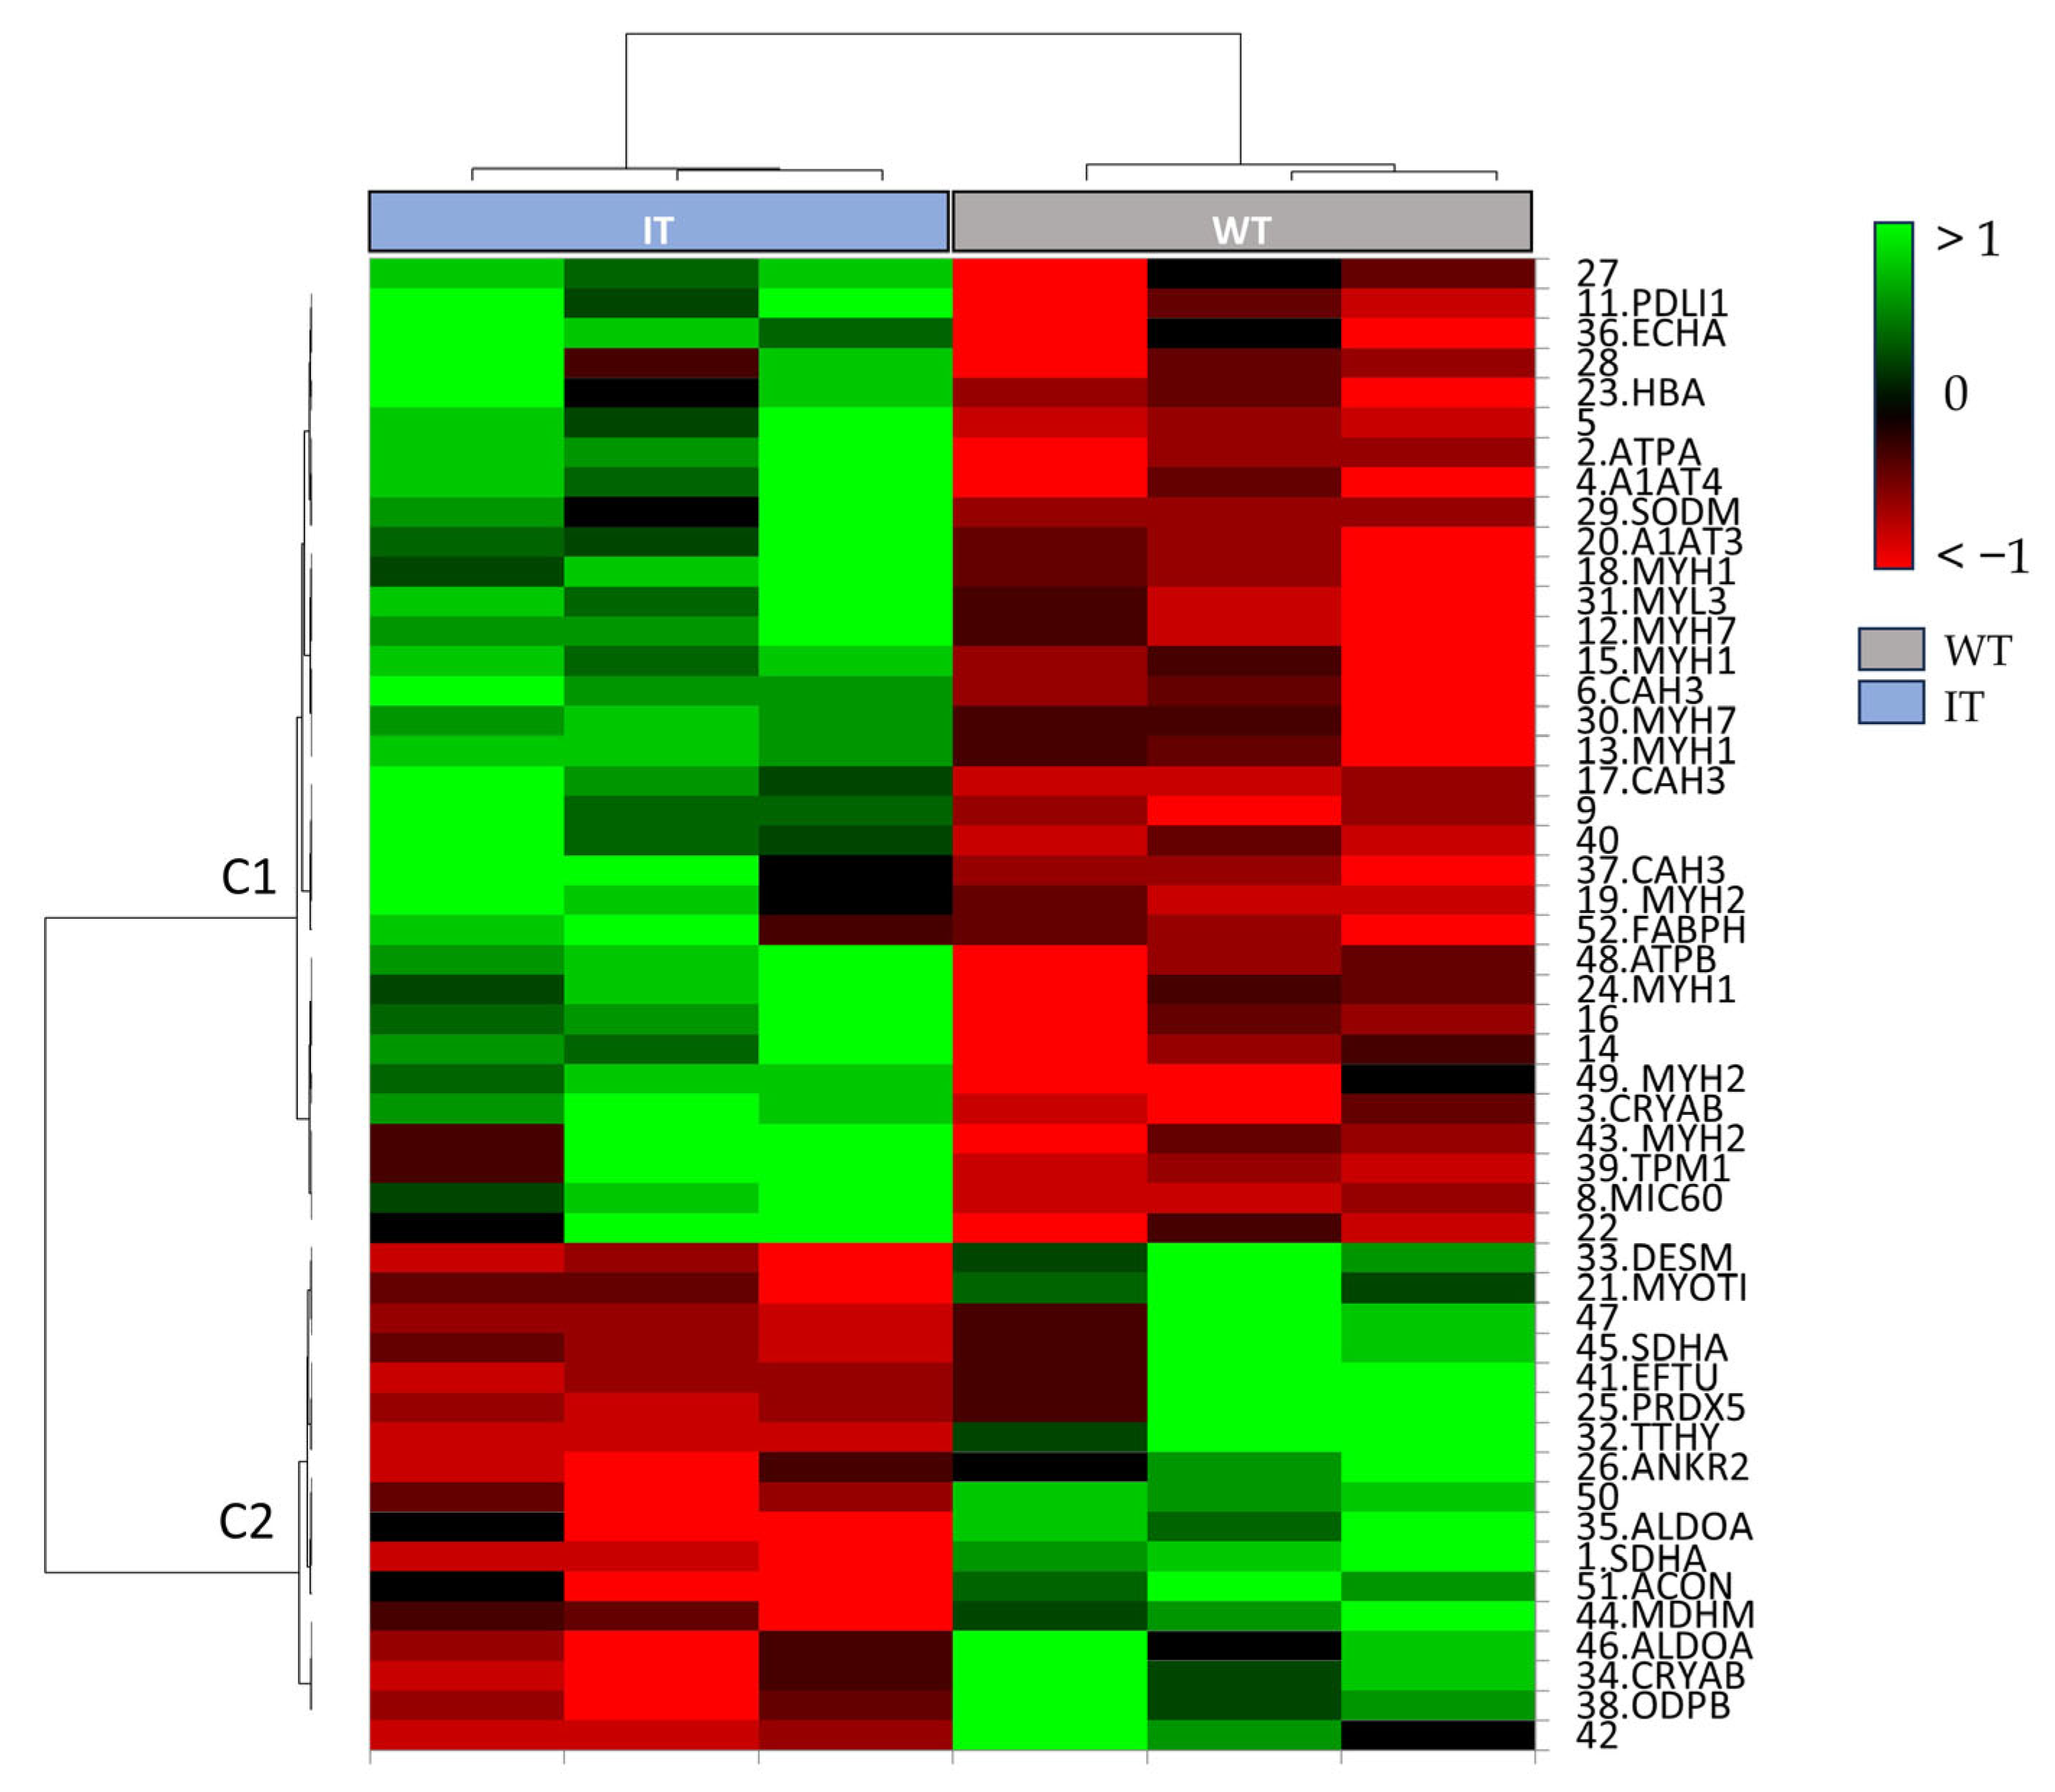
We conducted a supervised multivariate analysis using the 50 differentially abundant spots (DASs). Principal Component Analysis (PCA) and heatmap analysis are shown in Figure 2 and Figure 3, respectively. Multivariate analysis shows that IT mice exhibit a distinct proteomic profile. In particular, the integrated PCA and volcano plot chart show a total variance of 98.06% and clearly separates the two conditions along the second main component (PC2). Based on the PCA, decreased abundance of peroxiredoxin-5 (PRDX5), myotilin (MYOTI), and fructose-bisphosphate aldolase A (ALDOA), and the increased abundance of fatty acid-binding protein (FABPH), circled in red, have greater relevance in sample stratification. The heatmap distinguished IT from WT conditions, clustering the DASs into the following two clusters (C1 and C2): C1 highlights the highly abundant proteins in the IT condition and includes proteins involved in structural and contractile functions, while C2 contains proteins involved in the regulation of metabolic processes.

2.2. Enrichment Analysis of the Proteomic Data

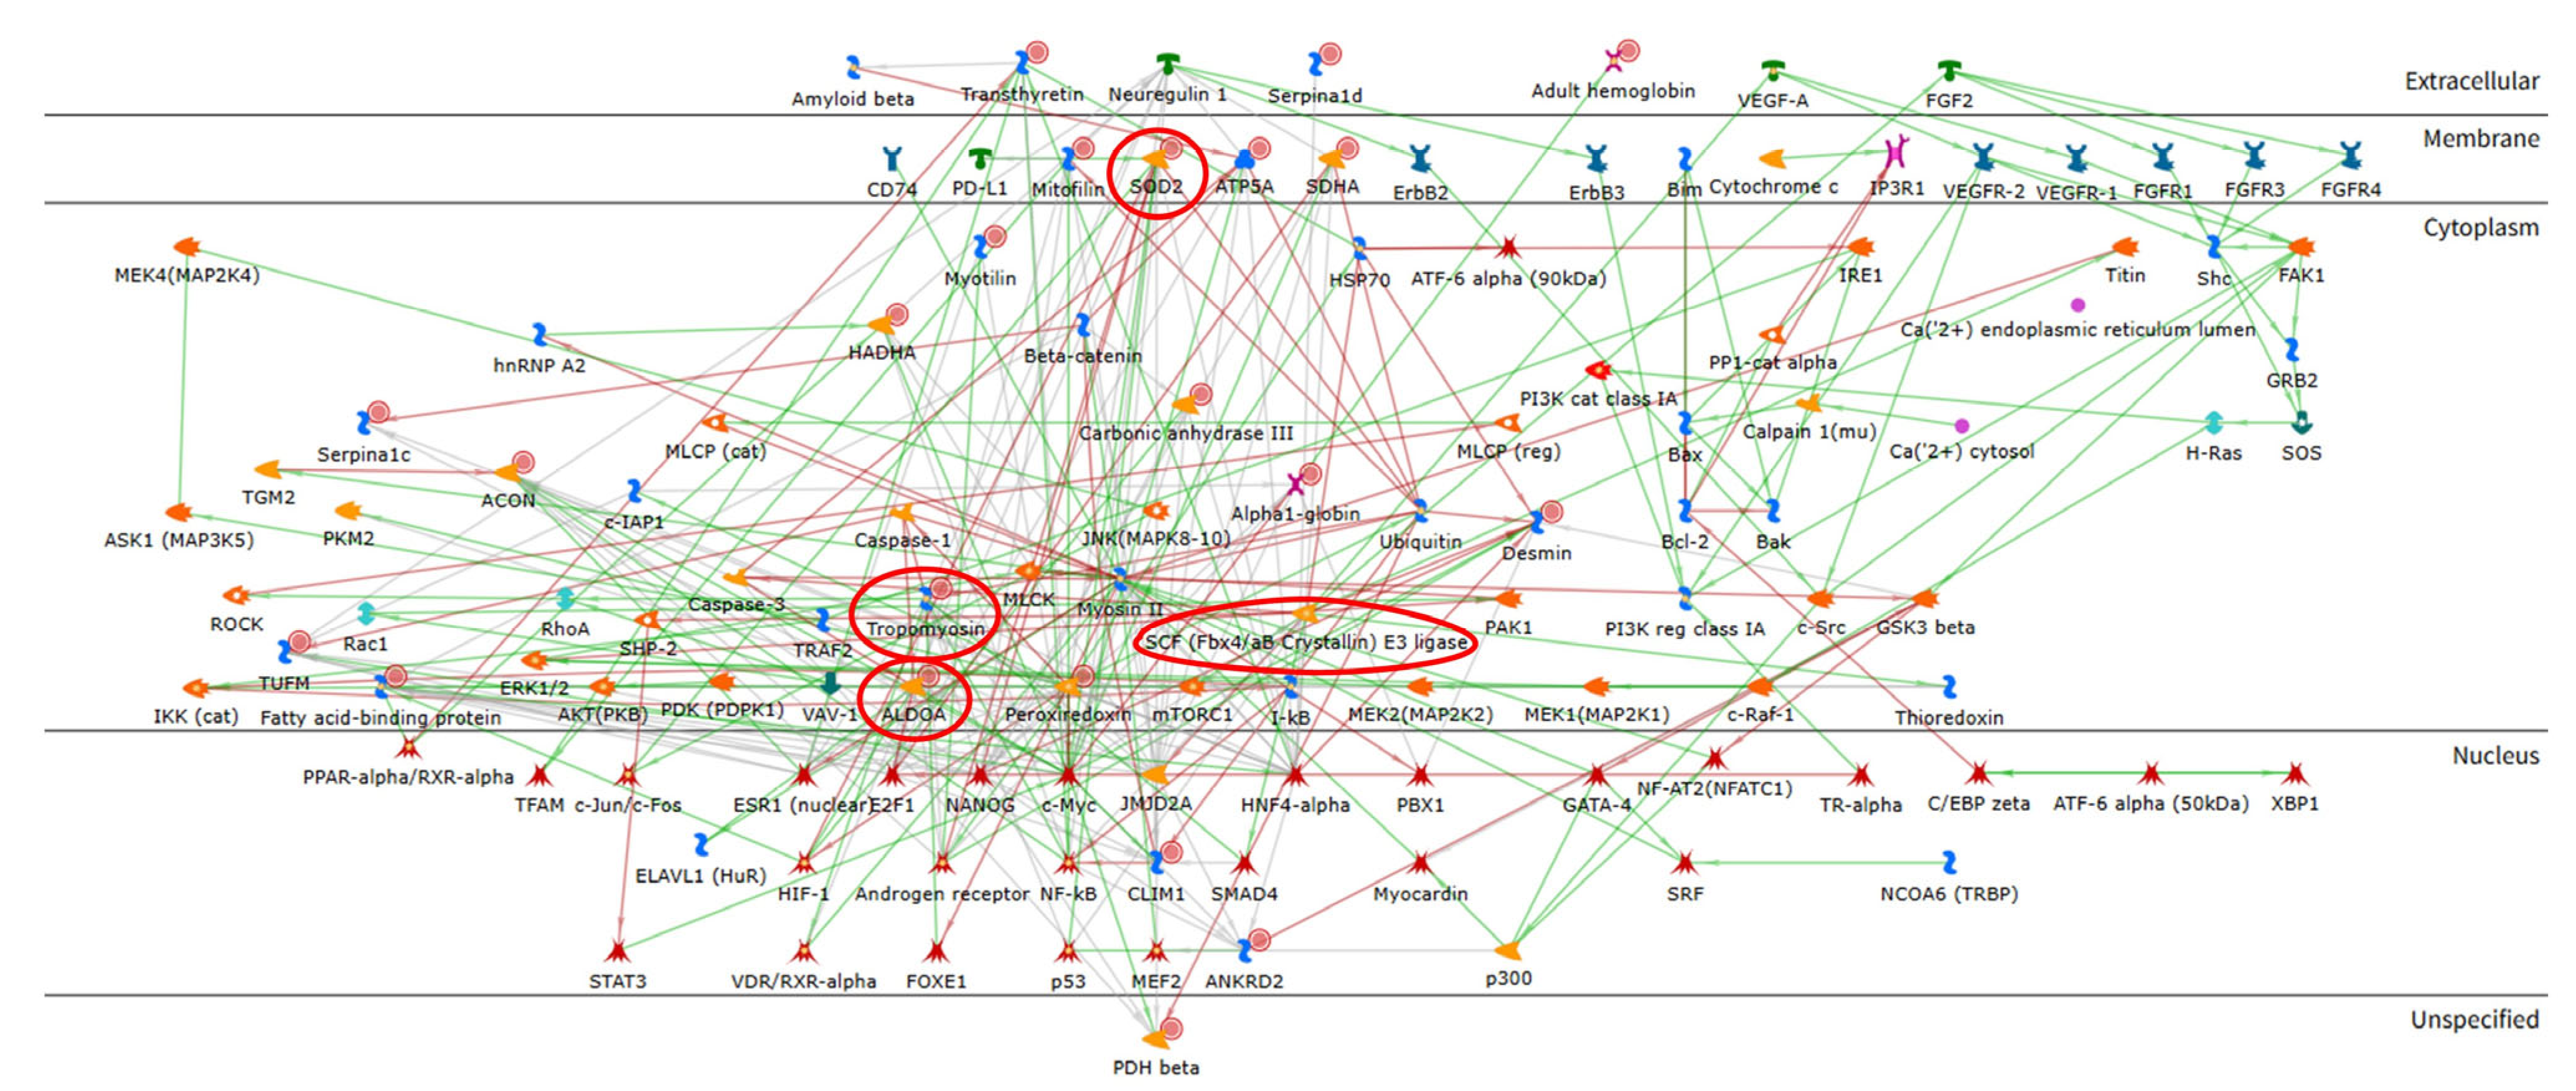
To explore the molecular functions, signaling mechanisms, and networks of the identified proteins, an enrichment analysis was performed. Figure 4 shows the network analysis, highlighting the possible interactions that can occur among the differentially expressed proteins. ALDOA, alpha-crystallin B, SOD2, and tropomyosin-1 are the central functional hubs of the network (red circles). In Figure 5, the pathway maps analysis suggests terms related to the skeletal muscle structure (blue box), several terms related to metabolism (green boxes), and some terms suggesting an alteration in the oxidative stress response (red boxes). Therefore, the enrichment analysis suggested that CCD induces a complex alteration of the proteome, including structural and metabolic proteins.

2.3. Structural, Contractile, and Cytoskeletal Stabilization Proteins Were Altered

Proteomic analysis identified significant changes in proteins involved in muscle structure and contraction. In particular, we detected an abnormal increase in several fragments of different proteoforms of myosin (MYH1, MYH2, MYH7), which could be a direct consequence of hypotonia and generalized muscle weakness [26]. These data agree with previous structural characterization of IT mice, where Z-line streaming and sarcomere damage were typically found in type I fibers [21,27]. On the other hand, myotilin (MYOTI), which we found to be downregulated in IT, is a structural protein of the Z-disk that acts as stabilizer and anchors actin filaments at the Z-disk [28,29]. Decreased levels of this protein suggest an instability of actin filaments in muscle affected by CCD. Interestingly, two proteoforms of the alpha-crystallin B chain (CRYAB) were detected as differently abundant, indicating a change in its post-translational modification. CRYAB is a major chaperone in muscle [30] and modulates filament assembly and network formation. Indeed, as shown by the protein network in Figure 4, CRYAB binds to desmin (DESM) during its assembly into intermediate filaments. Their binding depends on the topology and surface characteristics of the DESM filament. This allows CRYAB to sense abnormal filament structures, influencing the structure and stability of these filaments and preventing improper protein folding and aggregation [31].

2.4. RYR1-I4898T Mutation May Induce Alteration in Metabolism

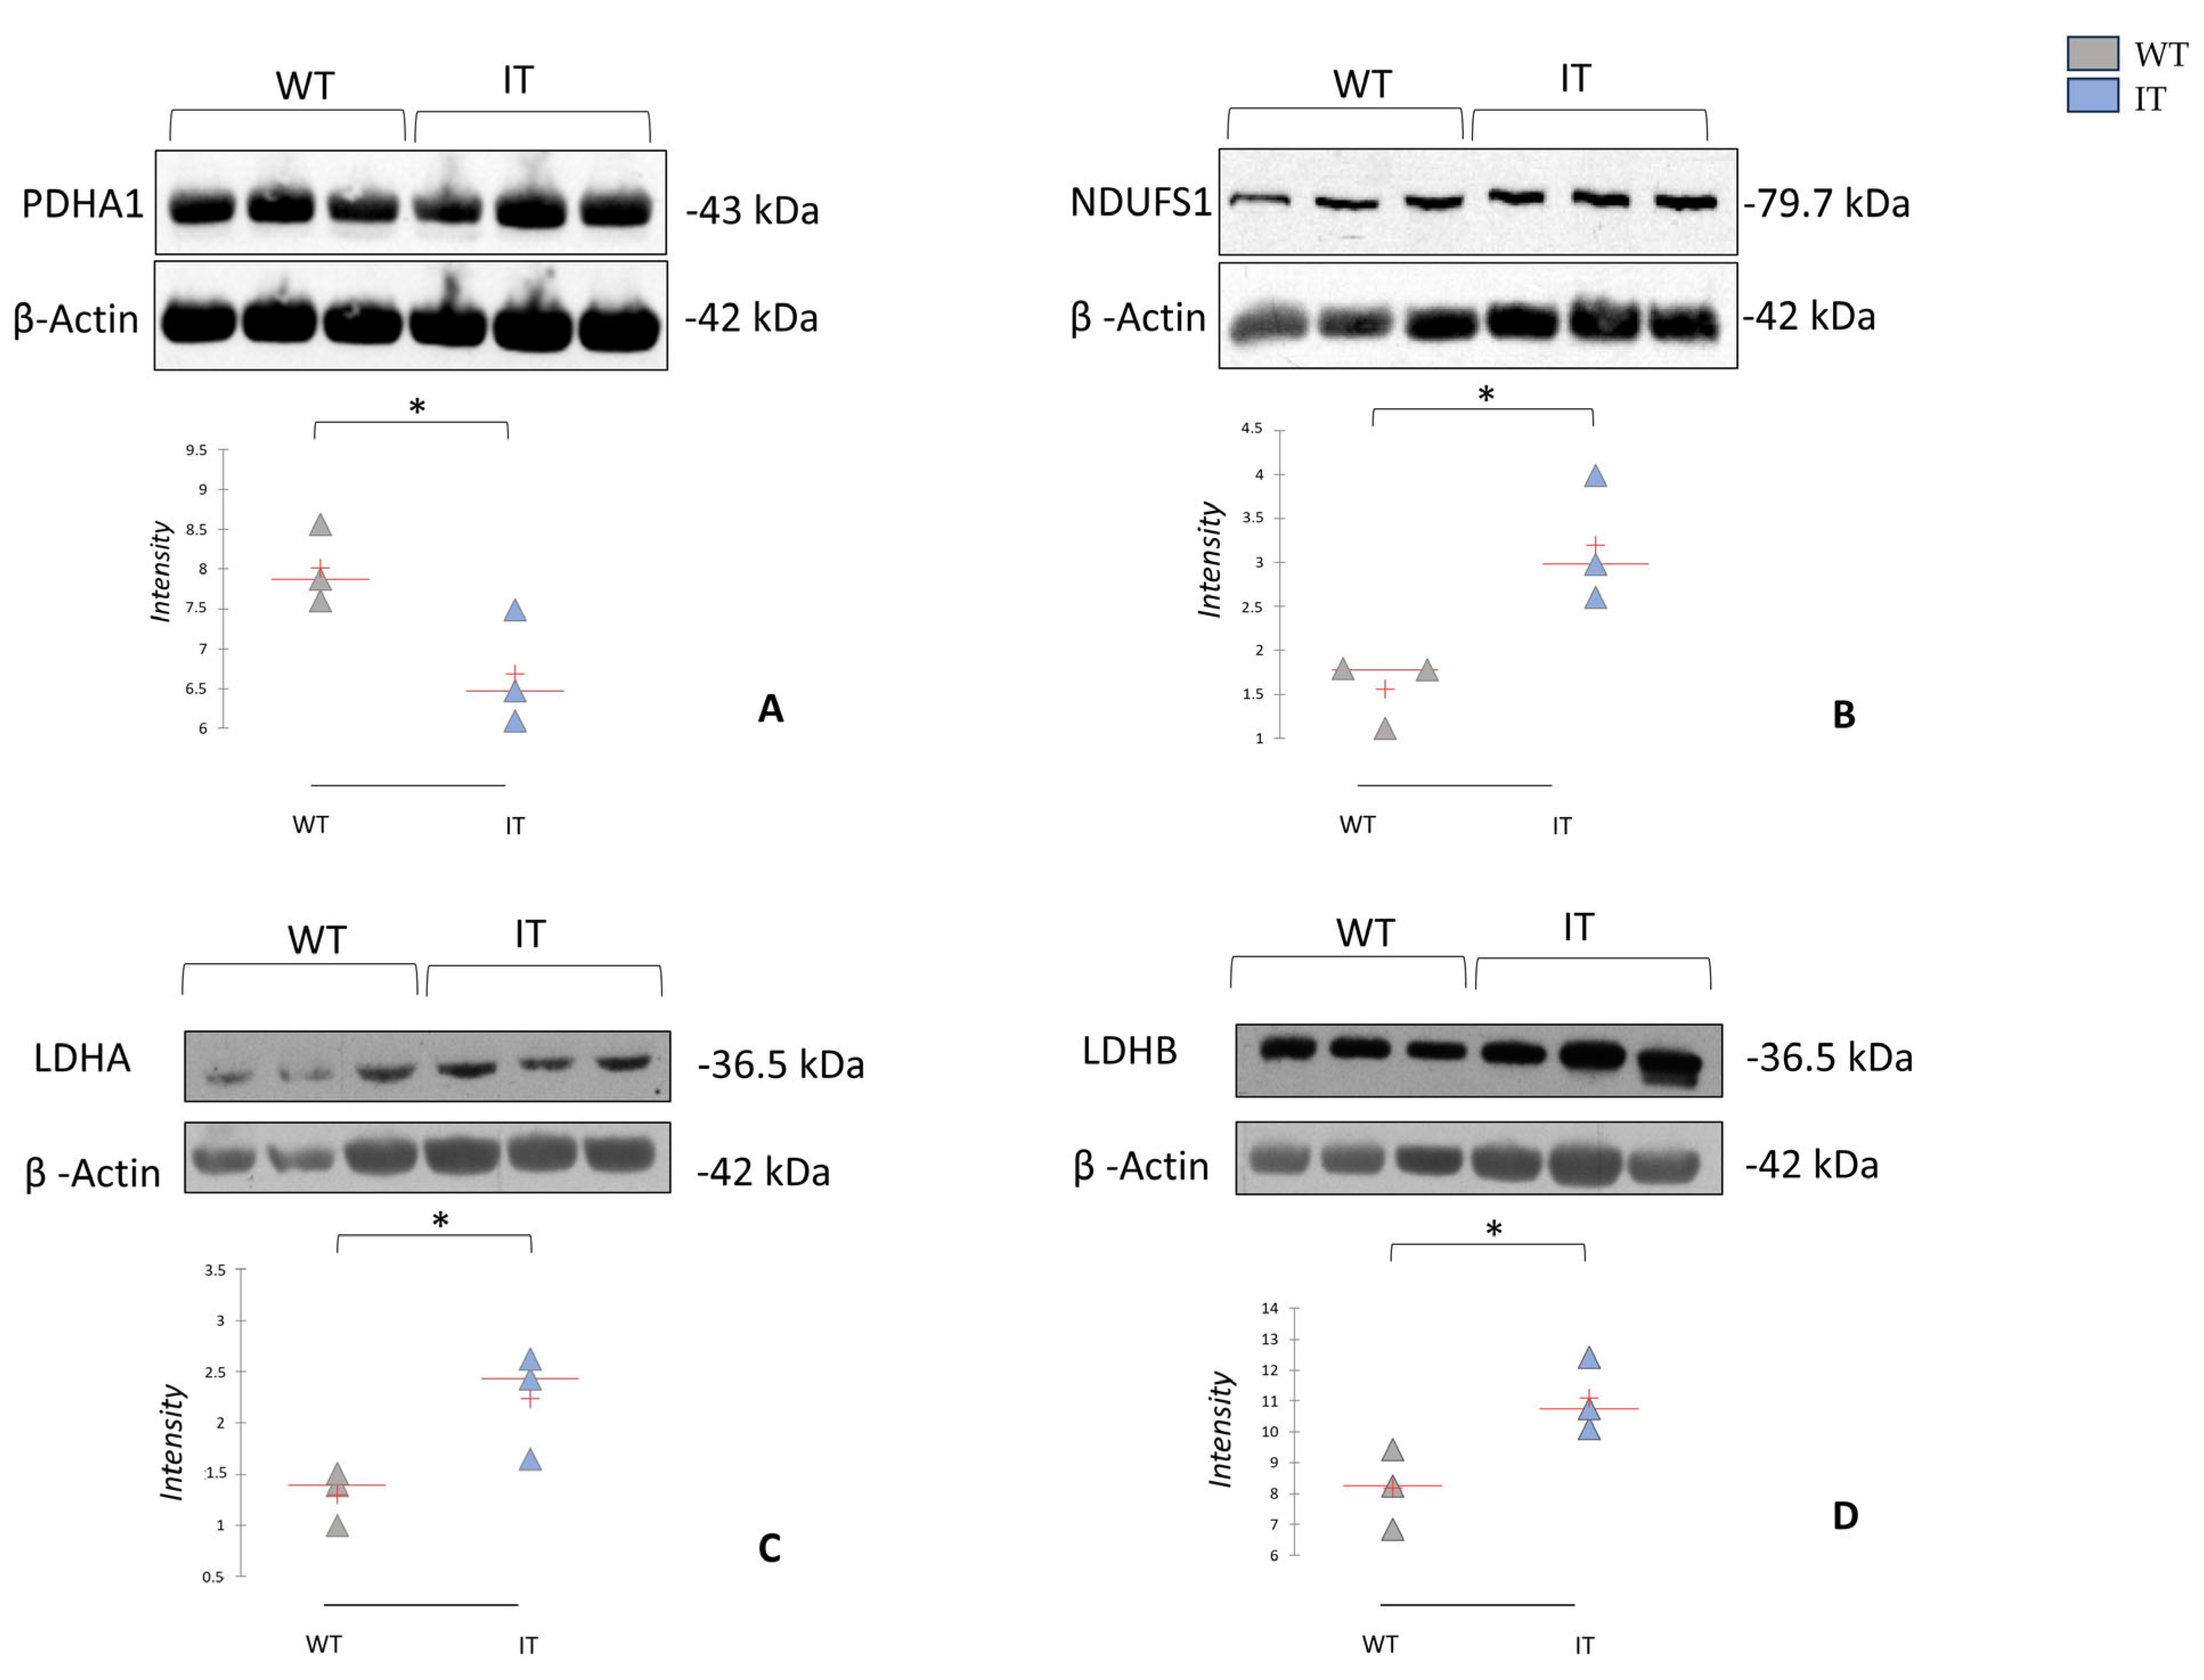
The enrichment analysis by pathways maps performed on DASs also suggested several terms related to different metabolic processes, mitochondrial dysfunction, and stress response. Many of the altered metabolic proteins identified through differential proteomic analysis are involved in the respiratory chain and energy transport, glycolysis, the tricarboxylic acid cycle (TCA), and mitochondrial beta-oxidation of long-chain saturated fatty acids (Figure 5). A notable finding was the downregulation of proteins involved in glycolysis pathways, the pyruvate dehydrogenase complex, and the TCA cycle, particularly two proteoforms of fructose-bisphosphate aldolase A (ALDOA), the pyruvate dehydrogenase E1 component subunit beta (PDHB), two proteoforms of succinate dehydrogenase [ubiquinone] flavoprotein subunit (SDHA), malate dehydrogenase (MDHM), and aconitate hydratase (ACON), all with significant correlations (Figure S2). To further investigate the metabolic process highlighted by our proteomic analysis, we decided to test some key regulatory proteins, different from our DASs, using Western blot analysis on a different cohort of three WT and three IT mice. The results showed a significant decrease in pyruvate dehydrogenase alpha (PDHA) (Figure 6A), a component of the PDH complex that links glycolysis to the TCA cycle and represents a key step in the aerobic glycolytic process [32]. In light with these results, we hypothesized a probable shift from aerobic to anaerobic glycolysis. To test this, we performed Western blot analysis to assess the levels of lactate dehydrogenase A and B (LDHA and LDHB), which form an enzyme that converts pyruvate to lactate under hypoxic conditions, thereby allowing the regeneration of NAD+ from NADH and permitting the continuation of glycolysis [33]. In agreement with our hypothesis, we found a significant increase in the two LDH proteoforms in IT mice (Figure 6C,D). To the best of our knowledge, this aspect has not yet been investigated for CCD; however, it has already been seen in other pathologies associated with RYR1 mutations, such as malignant hyperthermia [5].
Conversely, several mitochondrial proteins involved in the respiratory and energy transport chain (e.g., trifunctional enzyme subunit alpha, creatine kinase M-type, and ATP synthase subunit α and β) were increased in IT mice, as highlighted by our proteomic analysis. To validate the involvement of the respiratory chain and energy transport process, we also performed Western blot to assess NDUFS1 (Figure 6B), which is the largest subunit of mitochondrial complex I and transfers electrons from NADH to the respiratory chain, using ubiquinone as the immediate electron acceptor [34]. The increased NDUFS1 levels in IT mice could confirm the enhanced oxidative phosphorylation in the CCD muscle [35]. Interestingly, Mic60 was increased in IT, this protein, a central component of the mitochondrial contact site and cristae organizing system (MICOS), is essential for maintaining mitochondrial membrane architecture, dynamics, and transcription of oxidative phosphorylation proteins [36].
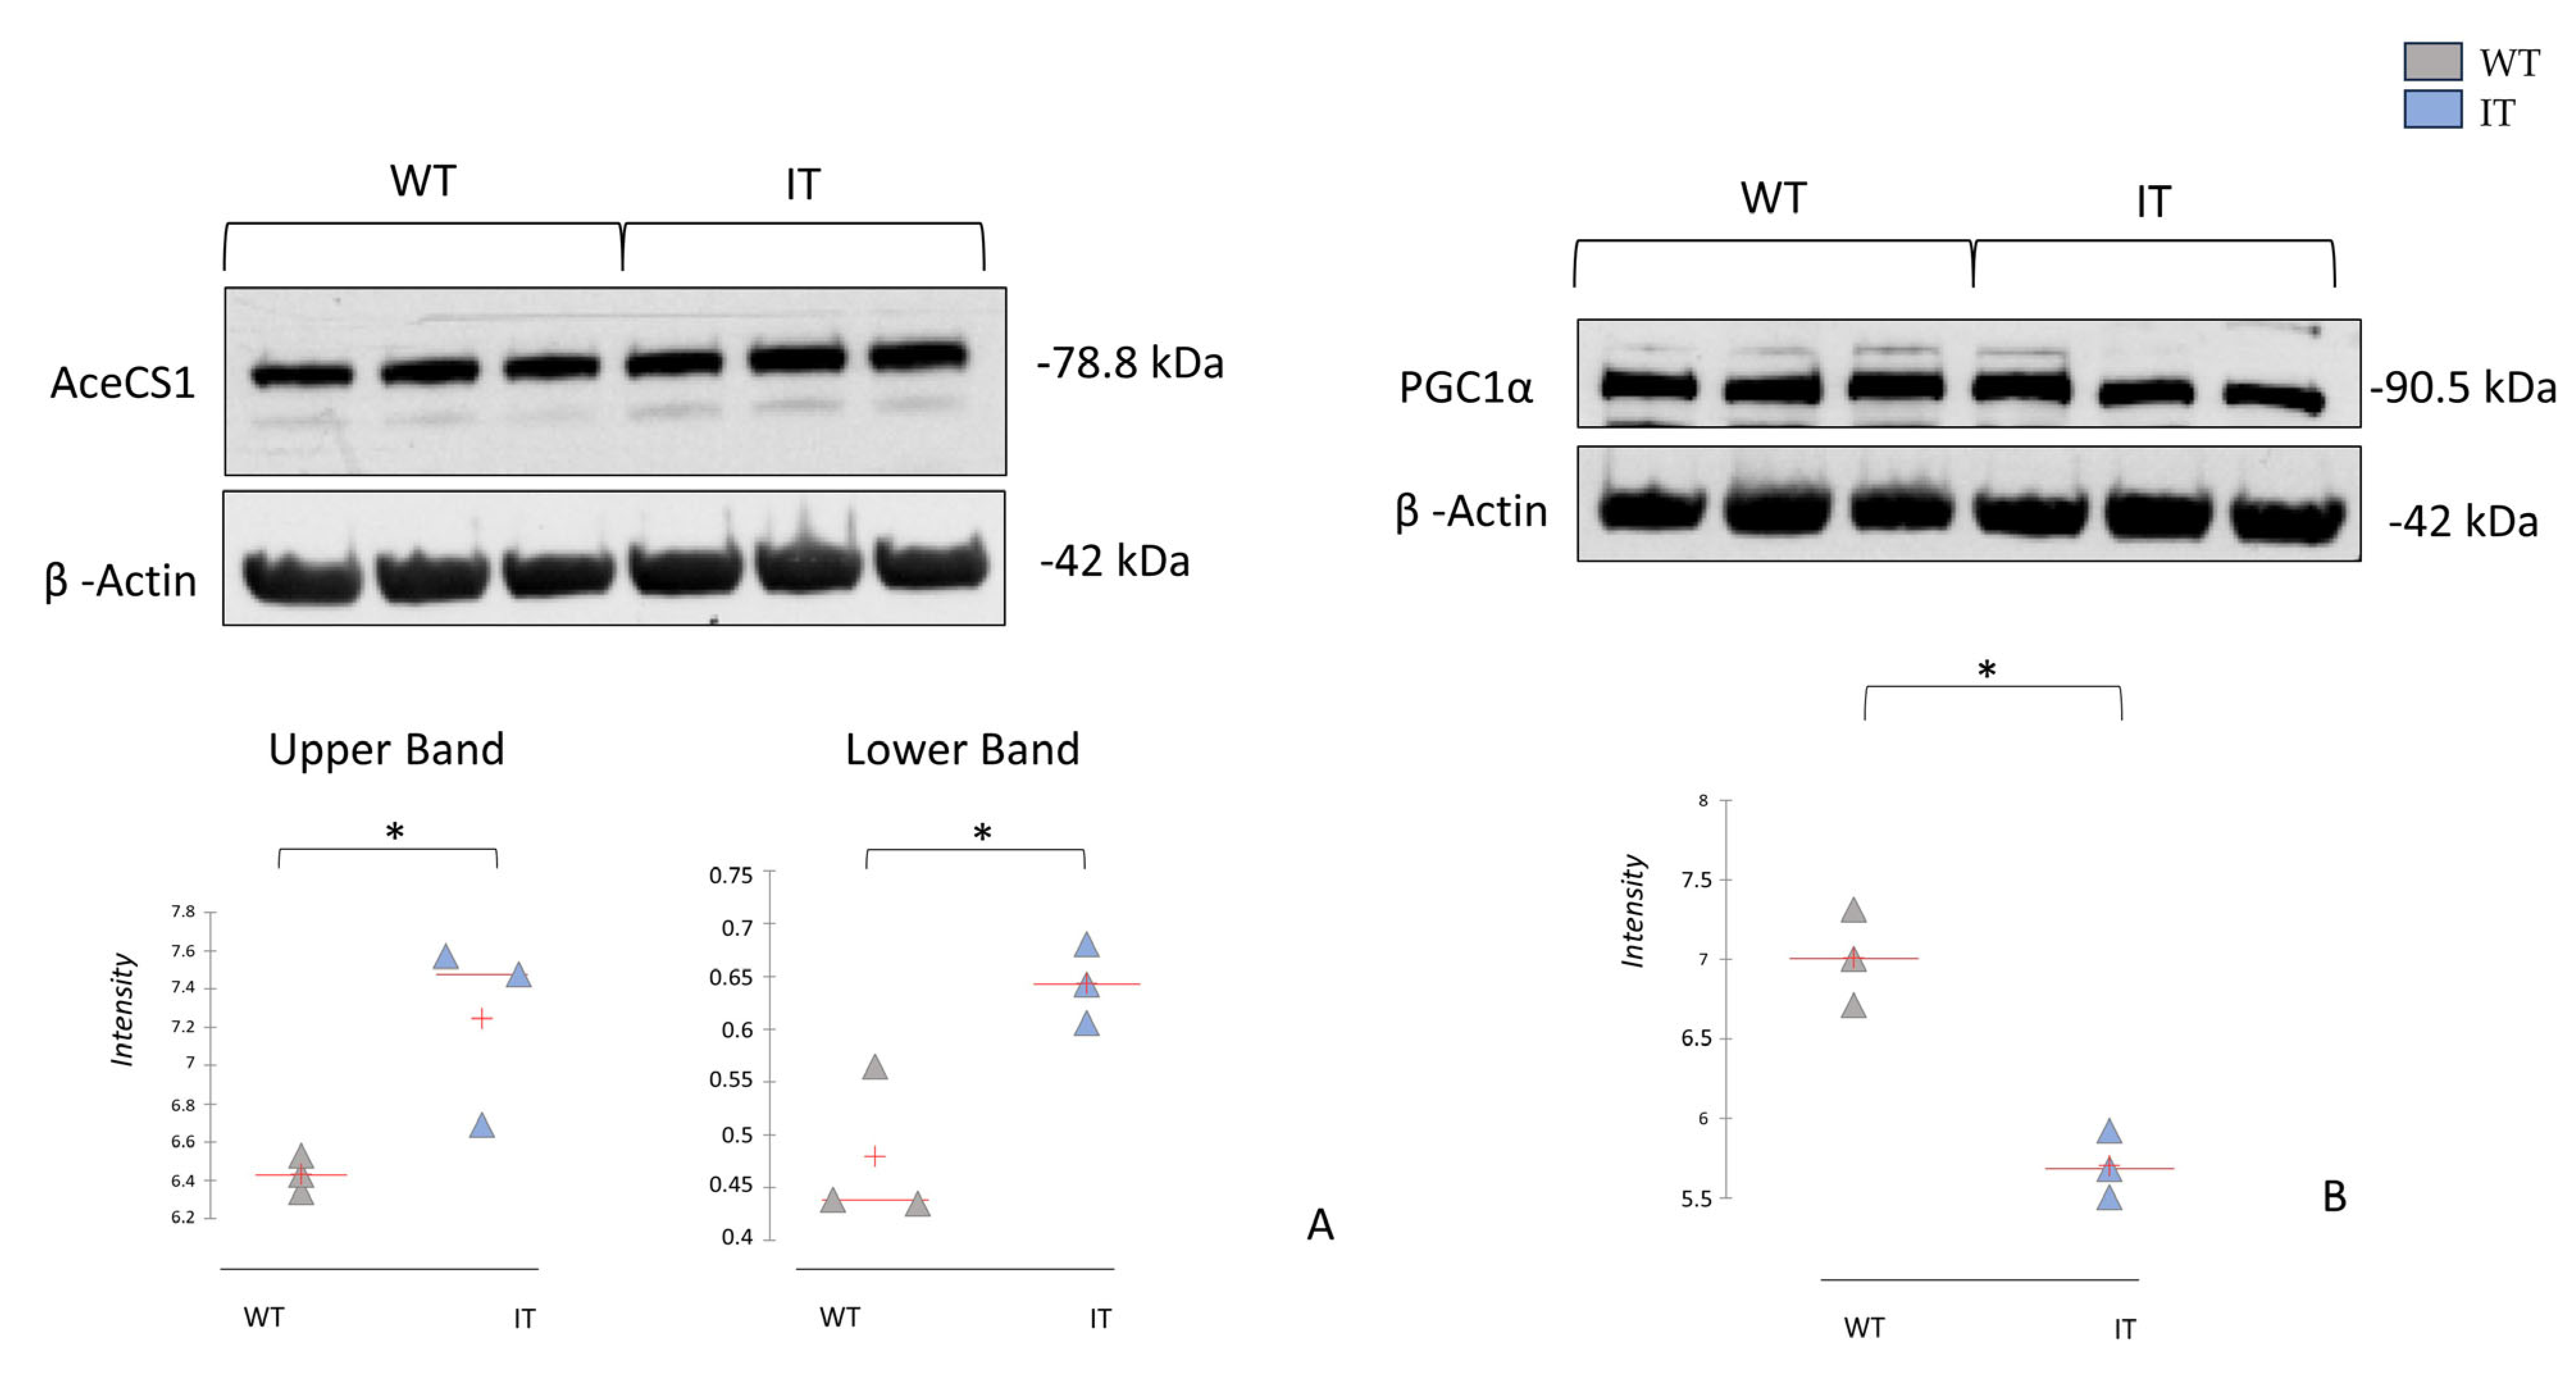
Furthermore, as suggested by proteomic and enrichment analyses, we found an increase in proteins involved in fatty acid beta-oxidation (e.g., fatty acid-binding protein). To validate the potential increase in beta-oxidation metabolism, we tested the levels of acetyl-CoA synthetase (AceCS1), which catalyzes the conversion of acetate and CoA to acetyl-CoA, a key step in metabolic pathways such as fatty acid metabolism, the TCA cycle, and oxidative phosphorylation [37,38]. Interestingly, we found two proteoforms of this protein, both increased in the muscles of IT mice (Figure 7A). The increase in this enzyme may suggest an attempt by the CCD muscle to maximize its energy production capacity. However, pathway maps analysis also indicates the involvement of PGC1α (peroxisome proliferator-activated receptor gamma coactivator 1-alpha) (Figure 5, red square), which is strongly regulated by calcium signaling [39]. Given the pivotal role of this protein, we assessed its abundance by Western blot, highlighting its downregulation in IT mice (Figure 7B). PGC1α is a well-known transcriptional coactivator crucial for skeletal muscle metabolism [40]. Previous research highlighted the involvement of PGC-1α in regulating muscle mass and protein turnover, and a decreased level of PGC-1α has been associated with a greater degree of atrophy [41,42]. In general, a reduction in PGC1α levels may be attributed to an imbalance of calcium flux resulting from the RYR1 gene mutation. Our results are consistent with those reported by Lee et al., 2017 [20], who found that low levels of PGC1α in IT mice may be associated with increased mitochondrial damage. Given its central role in regulating the structure and metabolism of muscle fibers, PGC1α could be considered for further studies as a potential biomarker of target therapy in CCD.

2.5. RYR1-I4898T Mutation May Induce an Alteration in Oxidative Stress Response

Oxidative stress is a pathophysiological mechanism recurring in CCD and other RYR1-related myopathies [15,43]. Indeed, our proteomic analysis reveals alterations in the abundance of many proteins involved in the oxidative stress response, such as PDZ and LIM domain protein, superoxide dismutase, MICOS complex subunit Mic60, elongation factor Tu, peroxiredoxin-5, and ankyrin repeat domain-containing protein 2. A state of oxidative stress, such as that recognized in CCD, may lead to a metabolic shift to anaerobic glycolysis. Indeed, a slight increase in IIb/x fibers was reported in IT mice compared to controls [20]. Moreover, it was also reported that the production of lactate, which we hypothesize based on the upregulation of LDH, can in turn increase oxidative stress [44]. Our results are in agreement with the findings reported by Lee et al., 2017 [20], who observed an increase in oxidized proteins in IT mice muscles, which was associated with increased ER stress and ROS production in FDB fibers in IT mice compared to controls. Lee et al. explained that persistent increases in mitochondrial Ca2+ uptake and ROS production could lead to mitochondrial damage. Indeed, they observed a decrease in mitochondrial protein content, along with an increase in cytosolic cytochrome c levels and an increase in apoptotic nuclei and elevated levels of cleaved caspases 3, 9, and 12, as well as significant increase in caspase-3 activity and the expression of the p53 pro-apoptotic protein. Among the altered proteins, we also found several proteoforms of carbonic anhydrase 3 (CAH3), which were upregulated in IT mice. CAH3, a metalloenzyme, regulates pH and catalyzes the reversible hydration of carbon dioxide (CO2) to bicarbonate (HCO3) and a proton (H+) for the CO2 transport into the blood. CAH3 also protects from free radical damage [45,46]. Given that an increase in CAH3 is an established biomarker for muscle tissue damage [47,48], it could be considered as a biomarker for monitoring disease progression and therapeutic impact [49].

3. Materials and Methods

3.1. Animals

All animal-related procedures were performed with the highest standard of care to minimize animal discomfort and suffering. Mice were anesthetized with isoflurane and humanely euthanized by cervical dislocation, in accordance with the protocols approved by the Animal Care Committee of the University of Siena and the Italian Ministry of Health (64/2020-PR). All experimental procedures complied with Directive 2010/63/EU of the European Parliament and the Council of 22 September 2010 on the protection of animals used for scientific purposes. Experiments were conducted on adult (4 months old) C57Bl/6J mice, including both wild-type (WT) and heterozygous knock-in for Ryr1I4895T (IT) mice. Animals had ad libitum access to food and water and were housed under controlled environmental conditions, with ambient temperature maintained between 21 and 25 °C, relative humidity at 50–60%, and a 12 h light/dark cycle. Soleus muscle samples were collected and immediately frozen at −80 °C until use.

3.2. Sample Preparation for Two-Dimensional Electrophoresis

Soleus sample preparation was performed as previously described [25]. Briefly, 10 mg of soleus muscle samples from three WT and three IT mice were divided into two sections using a scalpel and processed by two different extraction procedures, based on two different denaturing buffers. In particular, the protein extraction protocol using denaturation buffer A containing 2% w/v SDS and 1% w/v DTE (pH 6) and acetone precipitation provided a better extraction of high-MW proteins and sarcomere proteins. While denaturation buffer B, containing 8 M UREA, 4% w/v CHAPS, 1% w/v DTE, and 40 mM TRIS (pH 10) provided a better extraction of low-MW protein species, protein fragments, and mitochondria membrane proteins. Since the two procedures showed different patterns of extracted proteins, we performed two parallel differential proteomic analyses comparing the proteomic profile of the soleus tissues from WT and IT mice in order to acquire a thorough overview of the proteomic alterations induced by the pathology. Muscle samples were incubated with 40 µL of denaturation buffer A or B and homogenized using beads in a TissueLyser II (#85300 Qiagen, Venlo, PL, USA) at 2.5Hz for four 30 s cycle, with 1 min intervals. After bead removal, samples were centrifuged at 20,800× g for 15 min at 4 °C, and the supernatants were recovered. Protein concentrations were estimated by the Bradford protocol [50].

3.3. Two-Dimensional Electrophoresis

Protein extracts were resolved by two-dimensional electrophoresis (2DE) using the Immobiline–polyacrylamide system, as described by Vantaggiato et al. [51]. For analytical gels, 60 μg of protein were mixed with 0.2% (v/v) carrier ampholyte, whereas for protein identification, 600 µg of protein were combined with 2% (v/v) carrier ampholyte. Samples were diluted in 350 μL of lysis buffer (8 M UREA, 4% w/v CHAPS, 1% w/v DTE) with traces of bromophenol blue, and loaded onto 18 cm nonlinear pH 3-10 IPG strips (Cytiva, Marlborough, MA, USA) for isoelectric focusing (IEF). IEF was performed at 16 °C using the Ettan™ IPGphor™ Manifold system (Cytiva, Marlborough, MA, USA), under the following voltage program: 0 V for 1 h, 30 V for 7 h, 200 V for 1 h, 300 V for 30 min, a gradient until 3500 V in 2 h, 3500 V for 10 min, from 3500 V to 5000 V in 30 min, 5000 V for 30 min, from 5000 V to 8000 V in 1 h, and 8000 V for the rest of the run until reaching a total of 95,000 VhT. After focusing, strips were equilibrated in two steps: the first for 12 min in 6 M UREA, 2% w/v SDS, 2% w/v DTE, 30% v/v glycerol, and 0.05 M TRIS-HCL (pH 6.8), then for 5 min in 6 M UREA, 2% w/v SDS, 2.5% w/v iodoacetamide, 30% v/v glycerol, 0.05 M TRIS-HCL (pH 6.8), and a trace of bromophenol blue. Second-dimensional separation was performed on 9–16% SDS gradient polyacrylamide gels (18 cm × 20 cm × 1.5 mm) at 40 mA/gel and 9 °C until the dye front reached the bottom of the gel. Analytical gels were stained using ammoniacal silver staining [52], while MS-preparative gels were stained following an MS-compatible silver staining protocol [53]. All gels were digitalized using an Image Scanner III laser densitometer provided with LabScan 6.0 software (Cytiva).

3.4. Image and Statistical Analysis

Two-dimensional gel images were processed using the Melanie 9.0 software (Swiss Institute of Bioinformatics, Quartier Sorge, Batiment Amphipole 1015 Lausanne, Switzerland). Gels from the same condition were aligned to a high-resolution master reference gel, and inter-class comparison were subsequently performed. Statistical analysis was carried out using Melanie 9.0 and XLStat version 2021.2.2, which performed, respectively, an ANOVA test and Benjamini–Hochberg FDR on the percentage of relative volume (%V) (integration of optical density of a single spot (volume) divided by the total volume of spots and expressed as a percentage). Protein spots were considered differentially abundant when the fold-change in %V was ≥1.5-fold and p-value < 0.05. Supervised Principal Component Analysis (PCA) and heatmap analysis were performed by XLStat. Pearson’s correlation tests were applied to assess linear correlation relationships among DASs.

3.5. MALDI-TOF Identification by PMF

Differential protein spots were manually excised from gels and destained using a solution of 30 mM potassium ferricyanure and 100 mM sodium tiosulphate anhydrous, followed by incubation in 200 mM ammonium bicarbonate. Spots were dehydrated in 100% acetonitrile (ACN), rehydrated with trypsin solution, and digested overnight at 37 °C. Peptide extracts (0.75 µL) were spotted on an MALDI target, air-dried, and overlaid with 1 µL of matrix solution containing 5 mg/mL α-cyano-4-hydroxycinnamic acid (CHCA) dissolved in 50% v/v ACN and 5% v/v trifluoroacetic acid (TFA). Mass spectra were acquired using an UltrafleXtreme™ MALDI-ToF/ToF instrument (Bruker Corporation, Billerica, MA, USA), according to Landi C et al. [54]. Spectra were processed with FlexControl software version 3.0 (Bruker) and Flex Analysis software version 3.0 (Bruker). Trypsin autolysis peaks were used for internal calibration, and mass lists were filtered to remove contaminants such as keratin- and matrix-related ions. Peptide Mass Fingerprinting (PMF) searches were performed using the MASCOT (Matrix Science Ltd., London, UK, http://www.matrixscience.com, accessed on 23 April 2025) search engine with the following parameters: Swiss-Prot/TrEMBL and NCBInr as databases, Mus musclulus as taxonomy, 20 ppm mass tolerance, one missed cleavage, carbamidomethylation of cysteine as a fixed modification, and oxidation of methionine as a variable modification. Proteomic data were deposited in the ProteomeXchange Consortium via PRIDE [55] under dataset identifier PXD069980.

3.6. MetaCore Enrichment Analysis

Identified proteins were analyzed using MetaCore version 22.1 build (http://portal.genego.com, accessed on 23 April 2025, Clarivate Analytics, Philadelphia, PA, USA). The platform integrates curated database of protein–protein and protein–DNA interactions, transcription factors, and signaling pathways. Pathway enrichment was evaluated using canonical maps ranked by statistical significance (p ≤ 0.001) based on Gene Ontology annotations. Additionally, a shortest-path algorithm was applied to conduct interaction network analyses linking experimental proteins with MetaCore database entities.

3.7. Western Blot Analysis

Western blotting was performed on soleus muscles samples from an independent cohort of WT and IT mice (n = 3 per group). Protein extracts (40 μg) were diluted in Leamly buffer (2% w/v SDS, 100 mM Tris–HCl pH 6.8, 4% v/v β-mercaptoethanol, 20% v/v glycerol), boiled at 95 °C for 5 min, separated on 12% SDS-PAGE gels, and transferred onto nitrocellulose membranes (Cytiva). Membranes were blocked (3% skimmed milk, 0.1% Triton X-100 in PBS, pH 7.4), incubated overnight at 4 °C with primary antibodies, and then for 2 h with goat peroxidase-conjugated anti-rabbit immunoglobulin G (Sigma, St. Louis, MO, USA, working dilution 1:7000). After three washing steps in blotting solution, one washing step in Triton X100 0.5% v/v in PBS pH 7,4 and other two washing steps in 0.05 M Tris-HCl pH 6.8, bands were visualized using ECL chemiluminescence detection system (Cytiva) and exposing membranes to Hiyperfilm ECL X-ray films (Cytiva). Densitometric analysis was performed using the ImageMaster 2D Platinum v. 6.0 software. Immunoblot data were then exported into Excel (Microsoft Office) to perform Kruskal–Wallis two-tailed test statistical analysis and the post hoc Dunn’s test for multiple comparisons using XLStat version 2021.2.2. Samples were normalized to β-actin.

3.8. Antibodies

The primary antibodies used in this study were as follows: Anti-pyruvate dehydrogenase (PDH) (Cell Signaling, Danvers, MA, USA, Cat. #3205, WB 1:1000); Anti-LDHA (Cell Signaling, Cat. #3582, WB 1:1000); Anti-LDHB (Cell Signaling, Cat. #56298, WB 1:1000); Anti-AceCS1 (Cell Signaling, Cat. #3658, WB 1:1000); Anti-PGC1 alpha Antibody (Antibodies, Cat. #A8783, WB 1:1000); Anti-NDUFS1 (Cell Signaling, Cat. # 70264, WB 1:1000); according to the manufacturer’s instructions.

4. Conclusions

In conclusion, our proteomic analysis revealed alterations in muscle structural and contraction proteins, likely associated with pathology. In particular, the high presence of myosin fragments, the altered abundance of alpha-crystallin B chain proteoforms, and a decrease in desmin and myotilin suggest a condition of general structural instability in CCD-affected muscle. Furthermore, the data obtained from our study revealed a reduction in glycolytic and TCA cycle activity, accompanied by an increase in lactate dehydrogenase and proteins involved in fatty acid beta-oxidation and oxidative phosphorylation, as also proposed by bioinformatics analysis. This suggests a metabolic shift from aerobic to anaerobic glycolysis in CCD muscle and an attempt at lipid catabolism to maximize energy production. This would also lead to an increase in oxidative stress and the corresponding alteration of stress response proteins. Finally, future analysis could expand the number of samples and validate the lower levels of PGC1α in individuals affected by CCD.

Supplementary Materials

The following supporting information can be downloaded at: https://www.mdpi.com/article/10.3390/ijms262311451/s1.

Author Contributions

Conceptualization: L.B., V.S., D.R. and C.L.; data curation: L.V.; formal analysis, L.V., E.S. and F.F.; investigation, L.V. and E.S.; methodology, L.V. and E.S.; software, L.V.; writing—original draft, L.V. and C.L.; writing—review and editing, L.B., C.L., V.S. and D.R. All authors have read and agreed to the published version of the manuscript.

Funding

This work was supported by the Italian Ministry of Education, Universities and Research (MUR) within the Italian PNRR, Tuscany Health Ecosystem-THE CUP B63C22000680007 SPOKE 7. D.D. n. 1050 23/06/2022. This work was also supported in part by the European Union—Next Generation EU in the framework of the mRNA National Center for Gene Therapy and Drugs PNRR—M4C2–1.4 CN00000041—CUP: J33C22001140001. The funders had no role in the design or conduct of this study; the collection, analysis, or interpretation of the data; or in the preparation, review, or approval of the manuscript.

Institutional Review Board Statement

The animal study protocol was approved by the Animal Care Committee of the University of Siena and by the Italian Ministry of Health (64/2020-PR). [807_2023_PR date 18 September 2023 (prot. 7DF19.43) and 807_2023_PR (prot. 7DF19.43.EXT.27) date 14 March 2025)].

Informed Consent Statement

Not applicable.

Data Availability Statement

The mass spectrometry proteomics data have been deposited in the ProteomeXchange Consortium via the PRIDE partner repository. Project name: Molecular Insights into Central Core Disease: Proteomic Signatures and Potential Therapeutic Biomarkers in RYR1 I4895T Mice. Project accession: PXD069980. Access details: Log in to the PRIDE website using the following details: Project accession: PXD069980; Token: 43uJ3BIJiENf.

Acknowledgments

We thank Susan Hamilton, Baylor College of Medicine, Huston, Texas (USA) for providing the original Ryr1I4895T mice.

Conflicts of Interest

The authors declare that they have no competing interests.

References

  1. Franzini-Armstrong, C.; Protasi, F. Ryanodine Receptors of Striated Muscles: A Complex Channel Capable of Multiple Interactions. Physiol. Rev. 1997, 77, 699–729. [Google Scholar] [CrossRef]
  2. Schneider, M.F. Control of Calcium Release in Functioning Skeletal Muscle Fibers. Annu. Rev. Physiol. 1994, 56, 463–484. [Google Scholar] [CrossRef] [PubMed]
  3. Rossi, D.; Catallo, M.R.; Pierantozzi, E.; Sorrentino, V. Mutations in Proteins Involved in E-C Coupling and SOCE and Congenital Myopathies. J. Gen. Physiol. 2022, 154, e202213115. [Google Scholar] [CrossRef]
  4. Lawal, T.A.; Todd, J.J.; Witherspoon, J.W.; Bönnemann, C.G.; Dowling, J.J.; Hamilton, S.L.; Meilleur, K.G.; Dirksen, R.T. Ryanodine Receptor 1-Related Disorders: An Historical Perspective and Proposal for a Unified Nomenclature. Skelet. Muscle 2020, 10, 32. [Google Scholar] [CrossRef]
  5. Hopkins, P.M.; Gupta, P.K.; Bilmen, J.G. Malignant Hyperthermia. In Handbook of Clinical Neurology; Elsevier: Amsterdam, The Netherlands, 2018; Volume 157, pp. 645–661. [Google Scholar] [CrossRef]
  6. Galli, L.; Orrico, A.; Lorenzini, S.; Censini, S.; Falciani, M.; Covacci, A.; Tegazzin, V.; Sorrentino, V. Frequency and Localization of Mutations in the 106 Exons of the RYR1 Gene in 50 Individuals with Malignant Hyperthermia. Hum. Mutat. 2006, 27, 830. [Google Scholar] [CrossRef] [PubMed]
  7. Magee, K.R.; Shy, G.M. A New Congenital Non-Progressive Myopathy. Brain 1956, 79, 610–621. [Google Scholar] [CrossRef]
  8. Wu, S.; Ibarra, M.C.A.; Malicdan, M.C.V.; Murayama, K.; Ichihara, Y.; Kikuchi, H.; Nonaka, I.; Noguchi, S.; Hayashi, Y.K.; Nishino, I. Central Core Disease Is Due to RYR1 Mutations in More than 90% of Patients. Brain 2006, 129, 1470–1480. [Google Scholar] [CrossRef] [PubMed]
  9. Lawal, T.A.; Todd, J.J.; Meilleur, K.G. Ryanodine Receptor 1-Related Myopathies: Diagnostic and Therapeutic Approaches. Neurotherapeutics 2018, 15, 885–899. [Google Scholar] [CrossRef]
  10. MacLennan, D.H.; Zvaritch, E. Mechanistic Models for Muscle Diseases and Disorders Originating in the Sarcoplasmic Reticulum. Biochim. Biophys. Acta (BBA)-Mol. Cell Res. 2011, 1813, 948–964. [Google Scholar] [CrossRef]
  11. Jungbluth, H. Central Core Disease. Orphanet J. Rare Dis. 2007, 2, 25. [Google Scholar] [CrossRef]
  12. Topaloglu, H. Core Myopathies—A Short Review. Acta Myol. 2020, 39, 266–273. [Google Scholar] [CrossRef]
  13. Bharucha-Goebel, D.X.; Santi, M.; Medne, L.; Zukosky, K.; Dastgir, J.; Shieh, P.B.; Winder, T.; Tennekoon, G.; Finkel, R.S.; Dowling, J.J.; et al. Severe Congenital RYR1-Associated Myopathy: The Expanding Clinicopathologic and Genetic Spectrum. Neurology 2013, 80, 1584–1589. [Google Scholar] [CrossRef] [PubMed]
  14. Romero, N.B.; Monnier, N.; Viollet, L.; Cortey, A.; Chevallay, M.; Leroy, J.P.; Lunardi, J.; Fardeau, M. Dominant and Recessive Central Core Disease Associated with RYR1 Mutations and Fetal Akinesia. Brain 2003, 126, 2341–2349. [Google Scholar] [CrossRef]
  15. Iodice, P.; Boncompagni, S.; Pietrangelo, L.; Galli, L.; Pierantozzi, E.; Rossi, D.; Fusella, A.; Caulo, M.; Kern, H.; Sorrentino, V.; et al. Functional Electrical Stimulation: A Possible Strategy to Improve Muscle Function in Central Core Disease? Front. Neurol. 2019, 10, 479. [Google Scholar] [CrossRef]
  16. Vattemi, G.N.A.; Rossi, D.; Galli, L.; Catallo, M.R.; Pancheri, E.; Marchetto, G.; Cisterna, B.; Malatesta, M.; Pierantozzi, E.; Tonin, P.; et al. Ryanodine Receptor 1 (RYR1) Mutations in Two Patients with Tubular Aggregate Myopathy. Eur. J. Neurosci. 2022, 56, 4214–4223. [Google Scholar] [CrossRef]
  17. Loy, R.E.; Orynbayev, M.; Xu, L.; Andronache, Z.; Apostol, S.; Zvaritch, E.; MacLennan, D.H.; Meissner, G.; Melzer, W.; Dirksen, R.T. Muscle Weakness in Ryr1I4895T/WT Knock-in Mice as a Result of Reduced Ryanodine Receptor Ca2+ Ion Permeation and Release from the Sarcoplasmic Reticulum. J. Gen. Physiol. 2011, 137, 43–57. [Google Scholar] [CrossRef] [PubMed]
  18. Zvaritch, E.; Depreux, F.; Kraeva, N.; Loy, R.E.; Goonasekera, S.A.; Boncompagni, S.; Kraev, A.; Gramolini, A.O.; Dirksen, R.T.; Franzini-Armstrong, C.; et al. An Ryr1I4895T Mutation Abolishes Ca2+ Release Channel Function and Delays Development in Homozygous Offspring of a Mutant Mouse Line. Proc. Natl. Acad. Sci. USA 2007, 104, 18537–18542. [Google Scholar] [CrossRef] [PubMed]
  19. Zvaritch, E.; Kraeva, N.; Bombardier, E.; McCloy, R.A.; Depreux, F.; Holmyard, D.; Kraev, A.; Seidman, C.E.; Seidman, J.G.; Tupling, A.R.; et al. Ca2+ Dysregulation in Ryr1I4895T/Wt Mice Causes Congenital Myopathy with Progressive Formation of Minicores, Cores, and Nemaline Rods. Proc. Natl. Acad. Sci. USA 2009, 106, 21813–21818. [Google Scholar] [CrossRef]
  20. Lee, C.S.; Hanna, A.D.; Wang, H.; Dagnino-Acosta, A.; Joshi, A.D.; Knoblauch, M.; Xia, Y.; Georgiou, D.K.; Xu, J.; Long, C.; et al. A Chemical Chaperone Improves Muscle Function in Mice with a RyR1 Mutation. Nat. Commun. 2017, 8, 14659. [Google Scholar] [CrossRef]
  21. Boncompagni, S.; Loy, R.E.; Dirksen, R.T.; Franzini-Armstrong, C. The I4895T Mutation in the Type 1 Ryanodine Receptor Induces Fiber-Type Specific Alterations in Skeletal Muscle That Mimic Premature Aging. Aging Cell 2010, 9, 958–970. [Google Scholar] [CrossRef]
  22. Melka, M.; Rotard, L.; Benstaali, C.; Brocard, J.; Giannesini, B.; Jouve, F.; Pelletier, L.; Fauré, J.; Rendu, J.; Jacquemond, V.; et al. Limited Pre-Clinical Relevance of the Heterozygous RYR1-I4895T/+ Mouse Model Due to Its Mild Phenotype. J. Neuromuscul. Dis. 2025. [Google Scholar] [CrossRef]
  23. Wang, C.H.; Dowling, J.J.; North, K.; Schroth, M.K.; Sejersen, T.; Shapiro, F.; Bellini, J.; Weiss, H.; Guillet, M.; Amburgey, K.; et al. Consensus Statement on Standard of Care for Congenital Myopathies. J. Child Neurol. 2012, 27, 363–382. [Google Scholar] [CrossRef]
  24. Jungblut, P.R. The Proteomics Quantification Dilemma. J. Proteom. 2014, 107, 98–102. [Google Scholar] [CrossRef]
  25. Vantaggiato, L.; Landi, C.; Shaba, E.; Rossi, D.; Sorrentino, V.; Bini, L. Protein Extraction Methods Suitable for Muscle Tissue Proteomic Analysis. Proteomes 2024, 12, 27. [Google Scholar] [CrossRef]
  26. Plotkin, D.L.; Mattingly, M.L.; Anglin, D.A.; Michel, J.M.; Godwin, J.S.; McIntosh, M.C.; Bergamasco, J.G.A.; Scarpelli, M.C.; Angleri, V.; Taylor, L.W.; et al. Skeletal Muscle Myosin Heavy Chain Protein Fragmentation as a Potential Marker of Protein Degradation in Response to Resistance Training and Disuse Atrophy. bioRxiv 2024, 2024.05.24.595789. [Google Scholar] [CrossRef] [PubMed]
  27. Boncompagni, S.; Protasi, F.; Franzini-Armstrong, C. Sequential Stages in the Age-Dependent Gradual Formation and Accumulation of Tubular Aggregates in Fast Twitch Muscle Fibers: SERCA and Calsequestrin Involvement. Age 2012, 34, 27–41. [Google Scholar] [CrossRef]
  28. Wadmore, K.; Azad, A.J.; Gehmlich, K. The Role of Z-Disc Proteins in Myopathy and Cardiomyopathy. Int. J. Mol. Sci. 2021, 22, 3058. [Google Scholar] [CrossRef] [PubMed]
  29. Takada, F.; Vander Woude, D.L.; Tong, H.Q.; Thompson, T.G.; Watkins, S.C.; Kunkel, L.M.; Beggs, A.H. Myozenin: An α-Actinin- and γ-Filamin-Binding Protein of Skeletal Muscle Z Lines. Proc. Natl. Acad. Sci. USA 2001, 98, 1595–1600. [Google Scholar] [CrossRef] [PubMed]
  30. Kato, K.; Shinohara, H.; Kurobe, N.; Inaguma, Y.; Shimizu, K.; Ohshima, K. Tissue Distribution and Developmental Profiles of Immunoreactive αB Crystallin in the Rat Determined with a Sensitive Immunoassay System. Biochim. Biophys. Acta (BBA)-Gen. Subj. 1991, 1074, 201–208. [Google Scholar] [CrossRef]
  31. Der Perng, M.; Wen, S.F.; van den IJssel, P.; Prescott, A.R.; Quinlan, R.A. Desmin Aggregate Formation by R120G αB-Crystallin Is Caused by Altered Filament Interactions and Is Dependent upon Network Status in Cells. Mol. Biol. Cell 2004, 15, 2335–2346. [Google Scholar] [CrossRef]
  32. Spriet, L.L.; Heigenhauser, G.J.F. Regulation of Pyruvate Dehydrogenase (PDH) Activity in Human Skeletal Muscle During Exercise. Exerc. Sport Sci. Rev. 2002, 30, 91–95. [Google Scholar] [CrossRef]
  33. Adeva-Andany, M.; López-Ojén, M.; Funcasta-Calderón, R.; Ameneiros-Rodríguez, E.; Donapetry-García, C.; Vila-Altesor, M.; Rodríguez-Seijas, J. Comprehensive Review on Lactate Metabolism in Human Health. Mitochondrion 2014, 17, 76–100. [Google Scholar] [CrossRef] [PubMed]
  34. Ni, Y.; Hagras, M.A.; Konstantopoulou, V.; Mayr, J.A.; Stuchebrukhov, A.A.; Meierhofer, D. Mutations in NDUFS1 Cause Metabolic Reprogramming and Disruption of the Electron Transfer. Cells 2019, 8, 1149. [Google Scholar] [CrossRef]
  35. Qi, B.; Song, L.; Hu, L.; Guo, D.; Ren, G.; Peng, T.; Liu, M.; Fang, Y.; Li, C.; Zhang, M.; et al. Cardiac-Specific Overexpression of Ndufs1 Ameliorates Cardiac Dysfunction after Myocardial Infarction by Alleviating Mitochondrial Dysfunction and Apoptosis. Exp. Mol. Med. 2022, 54, 946–960. [Google Scholar] [CrossRef]
  36. Dong, T.; Zhang, Z.; Sun, L.; Zhang, W.; Zhu, Z.; Lin, L.; Yang, L.; Lv, A.; Liu, C.; Li, Q.; et al. Mic60 Is Essential to Maintain Mitochondrial Integrity and to Prevent Encephalomyopathy. Brain Pathol. 2023, 33, e13157. [Google Scholar] [CrossRef]
  37. Poppelreuther, M.; Lundsgaard, A.-M.; Mensberg, P.; Sjøberg, K.; Vilsbøll, T.; Kiens, B.; Füllekrug, J. Acyl-CoA Synthetase Expression in Human Skeletal Muscle Is Reduced in Obesity and Insulin Resistance. Physiol. Rep. 2023, 11, e15817. [Google Scholar] [CrossRef]
  38. Ling, R.; Chen, G.; Tang, X.; Liu, N.; Zhou, Y.; Chen, D. Acetyl-CoA Synthetase 2(ACSS2): A Review with a Focus on Metabolism and Tumor Development. Discov. Oncol. 2022, 13, 58. [Google Scholar] [CrossRef] [PubMed]
  39. Kusuhara, K.; Madsen, K.; Jensen, L.; Hellsten, Y.; Pilegaard, H. Calcium Signalling in the Regulation of PGC-1α, PDK4 and HKII mRNA Expression. Biol. Chem. 2007, 388, 481–488. [Google Scholar] [CrossRef] [PubMed]
  40. Roberts-Wilson, T.K.; Reddy, R.N.; Bailey, J.L.; Zheng, B.; Ordas, R.; Gooch, J.L.; Price, S.R. Calcineurin Signaling and PGC-1α Expression Are Suppressed during Muscle Atrophy Due to Diabetes. Biochim. Biophys. Acta (BBA)-Mol. Cell Res. 2010, 1803, 960–967. [Google Scholar] [CrossRef]
  41. Tiao, G.; Lieberman, M.; Fischer, J.E.; Hasselgren, P.O. Intracellular Regulation of Protein Degradation during Sepsis Is Different in Fast- and Slow-Twitch Muscle. Am. J. Physiol.-Regul. Integr. Comp. Physiol. 1997, 272, R849–R856. [Google Scholar] [CrossRef]
  42. Sacheck, J.M.; Hyatt, J.-P.K.; Raffaello, A.; Jagoe, R.T.; Roy, R.R.; Edgerton, V.R.; Lecker, S.H.; Goldberg, A.L. Rapid Disuse and Denervation Atrophy Involve Transcriptional Changes Similar to Those of Muscle Wasting During Systemic Diseases. FASEB J. 2007, 21, 140–155. [Google Scholar] [CrossRef] [PubMed]
  43. Durham, W.J.; Aracena-Parks, P.; Long, C.; Rossi, A.E.; Goonasekera, S.A.; Boncompagni, S.; Galvan, D.L.; Gilman, C.P.; Baker, M.; Shirokova, N.; et al. RyR1 S-Nitrosylation Underlies Environmental Heat Stroke and Sudden Death in Y522S RyR1 Knock-in Mice. Cell 2008, 133, 53–65. [Google Scholar] [CrossRef] [PubMed]
  44. Wu, S.-B.; Wei, Y.-H. AMPK-Mediated Increase of Glycolysis as an Adaptive Response to Oxidative Stress in Human Cells: Implication of the Cell Survival in Mitochondrial Diseases. Biochim. Biophys. Acta (BBA)-Mol. Basis Dis. 2012, 1822, 233–247. [Google Scholar] [CrossRef]
  45. de Sousa Neto, I.V.; Carvalho, M.M.; de Cassia Marqueti, R.; Almeida, J.A.; de Sousa Oliveira, K.; Barin, F.R.; Petriz, B.; de Araújo, H.S.S.; Franco, O.L.; Durigan, J.L.Q. Proteomic Changes in Skeletal Muscle of Aged Rats in Response to Resistance Training. Cell Biochem. Funct. 2020, 38, 500–509. [Google Scholar] [CrossRef] [PubMed]
  46. Di Fiore, A.; Monti, D.M.; Scaloni, A.; De Simone, G.; Monti, S.M. Protective Role of Carbonic Anhydrases III and VII in Cellular Defense Mechanisms upon Redox Unbalance. Oxidative Med. Cell Longev. 2018, 2018, 2018306. [Google Scholar] [CrossRef]
  47. Brancaccio, P.; Lippi, G.; Maffulli, N. Biochemical Markers of Muscular Damage. Clin. Chem. Lab. Med. 2010, 48, 757–767. [Google Scholar] [CrossRef]
  48. Carter, N.D.; Heath, R.; Jeffery, S.; Jackson, M.J.; Newham, D.J.; Edwards, R.H.T. Carbonic Anhydrase III in Duchenne Muscular Dystrophy. Clin. Chim. Acta 1983, 133, 201–208. [Google Scholar] [CrossRef]
  49. Dowling, P.; Gargan, S.; Zweyer, M.; Sabir, H.; Swandulla, D.; Ohlendieck, K. Proteomic Profiling of Carbonic Anhydrase CA3 in Skeletal Muscle. Expert Rev. Proteom. 2021, 18, 1073–1086. [Google Scholar] [CrossRef]
  50. Bradford, M.M. A Rapid and Sensitive Method for the Quantitation of Microgram Quantities of Protein Utilizing the Principle of Protein-Dye Binding. Anal. Biochem. 1976, 72, 248–254. [Google Scholar] [CrossRef]
  51. Vantaggiato, L.; Cameli, P.; Bergantini, L.; d’Alessandro, M.; Shaba, E.; Carleo, A.; Di Giuseppe, F.; Angelucci, S.; Sebastiani, G.; Dotta, F.; et al. Serum Proteomic Profile of Asthmatic Patients After Six Months of Benralizumab and Mepolizumab Treatment. Biomedicines 2022, 10, 761. [Google Scholar] [CrossRef]
  52. Oakley, B.R.; Kirsch, D.R.; Morris, N.R. A Simplified Ultrasensitive Silver Stain for Detecting Proteins in Polyacrylamide Gels. Anal. Biochem. 1980, 105, 361–363. [Google Scholar] [CrossRef]
  53. Gharahdaghi, F.; Weinberg, C.R.; Meagher, D.A.; Imai, B.S.; Mische, S.M. Mass Spectrometric Identification of Proteins from Silver-Stained Polyacrylamide Gel: A Method for the Removal of Silver Ions to Enhance Sensitivity. Electrophoresis 1999, 20, 601–605. [Google Scholar] [CrossRef]
  54. Landi, C.; Bargagli, E.; Carleo, A.; Refini, R.M.; Bennett, D.; Bianchi, L.; Cillis, G.; Prasse, A.; Bini, L.; Rottoli, P. Bronchoalveolar Lavage Proteomic Analysis in Pulmonary Fibrosis Associated with Systemic Sclerosis: S100A6 and 14-3-3ε as Potential Biomarkers. Rheumatology 2019, 58, 165–178. [Google Scholar] [CrossRef] [PubMed]
  55. Perez-Riverol, Y.; Bai, J.; Bandla, C.; García-Seisdedos, D.; Hewapathirana, S.; Kamatchinathan, S.; Kundu, D.J.; Prakash, A.; Frericks-Zipper, A.; Eisenacher, M.; et al. The PRIDE Database Resources in 2022: A Hub for Mass Spectrometry-Based Proteomics Evidences. Nucleic Acids Res. 2022, 50, D543–D552. [Google Scholar] [CrossRef] [PubMed]
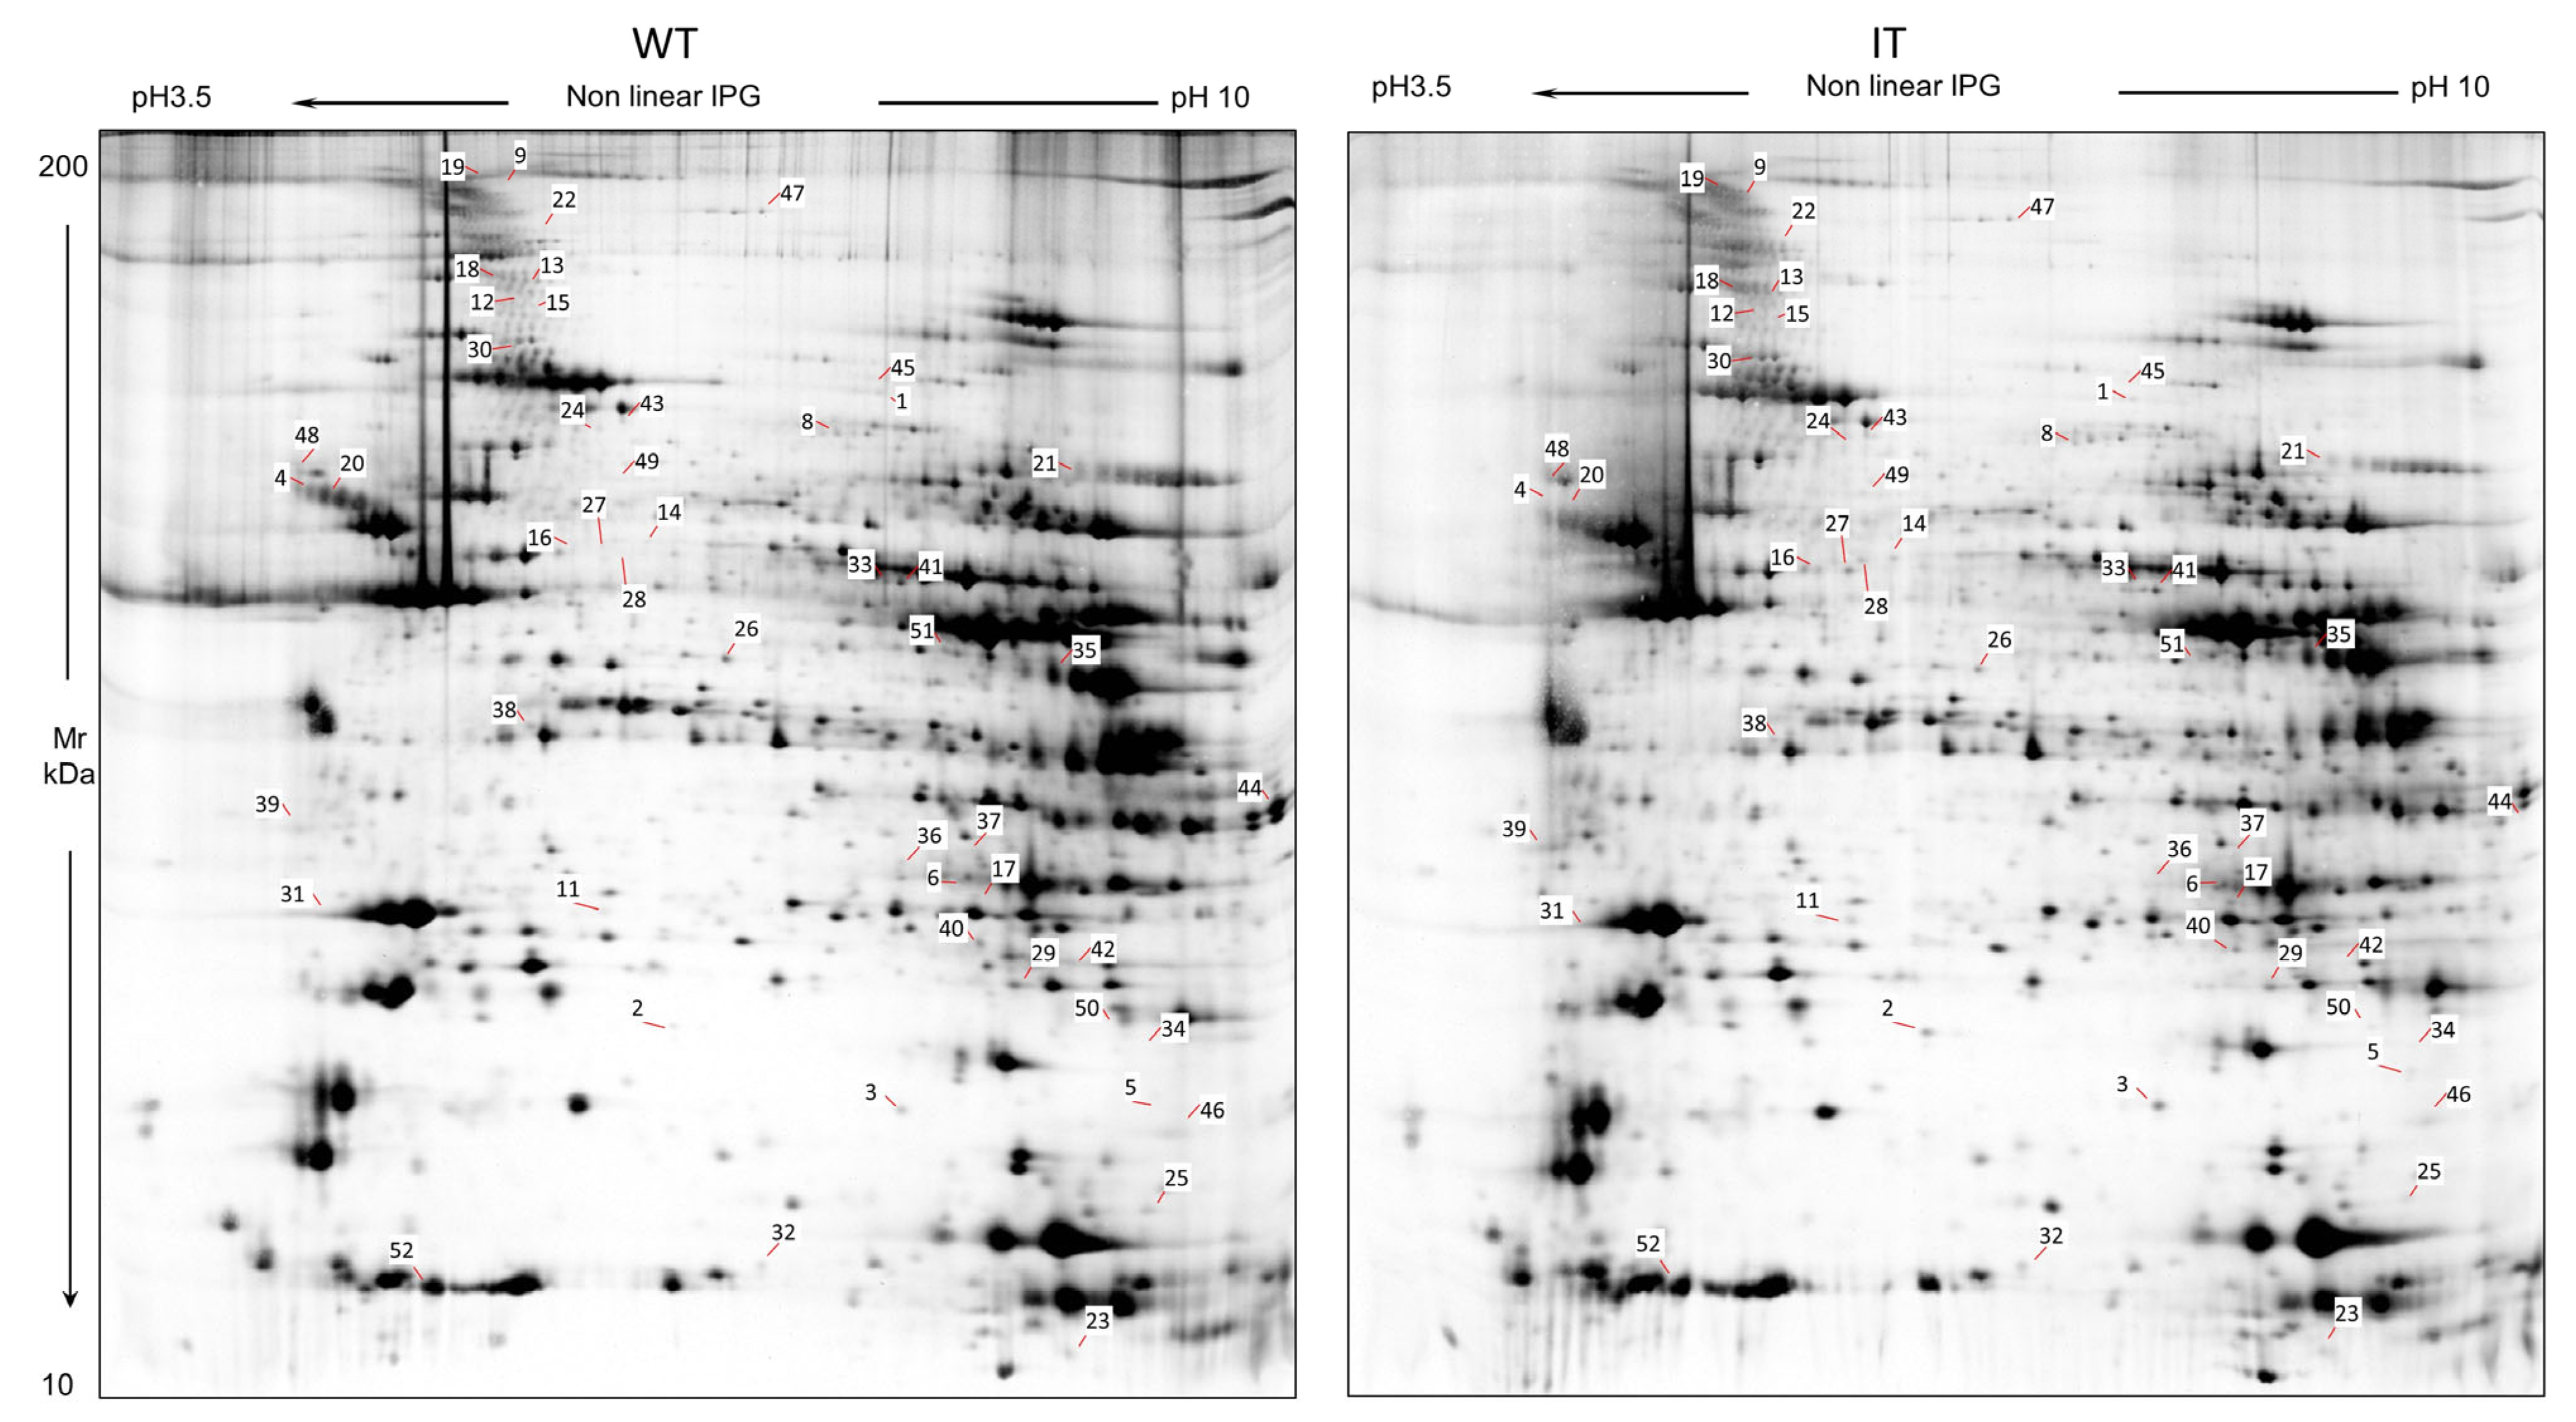
Figure 1. WT and IT soleus 2D gel master maps reporting differential abundant spots (p ≤ 0.05) with a fold-change ratio ≥ 1.5.
Ijms 26 11451 g001
Figure 2. Supervised integrated Principal Component Analysis (PCA) and volcano plot analysis performed on the DASs. Red lines mark the most influential spots in the sample distributions. PCA summarizes 98.1% of the variance (PC1: 93.63% and PC2: 4.46%). Black numbers and acronyms indicate differential spots, whereas WT soleus samples are shown in gray and IT soleus samples in blue.
Ijms 26 11451 g002
Figure 3. Heatmap analysis of the differential spots between WT vs. IT mouse soleus samples. Color changes from red to green indicate lower or higher protein abundance, respectively. Spot numbers and acronyms represent differential protein spots, while WT soleus samples are indicated in gray and IT soleus samples in blue. Unsuccessfully identified spots report only spot numbers.
Ijms 26 11451 g003
Figure 4. Network analysis performed using the MetaCore software (version 22.1 http://portal.genego.com, accessed on 23 April 2025, Clarivate Analytics, Philadelphia, PE, USA), to highlight characteristic protein interactions of differential abundant proteins. ALDOA, alpha-crystallin B, SOD2, and tropomyosin-1 are the central functional hubs of the net and are marked in red circles. (Symbol legend: https://portal.genego.com/legends/MetaCoreQuickReferenceGuide.pdf, accessed on 23 April 2025).
Ijms 26 11451 g004
Figure 5. Histograms reporting the pathway maps involving DASs. Black histograms represent the −log (p-value) related to differential proteins resulting from the comparison between WT and IT mouse soleus samples. Particularly, the pathway maps analysis suggests terms related to the skeletal muscle structure (blue box), several terms related to metabolism, including metabolic shift (green boxes), and some terms suggesting an alteration of the oxidative stress response (red boxes).
Ijms 26 11451 g005
Figure 6. One-dimensional Western blot analysis with anti-PDHA1 (A), anti-NDUFS1 (B), anti-LDHA (C), and anti-LDHB (D) on soleus samples from WT and IT mice. Kruskal–Wallis statistical analysis with Dunn correction was performed. * indicate significant levels p ≤ 0.05.
Ijms 26 11451 g006
Figure 7. One-dimensional Western blot analysis with anti-AceCS1 (A) and anti-PGC1α (B) on soleus samples from WT and IT mice. Kruskal–Wallis statistical analysis with Dunn correction was performed. * indicate significant levels p ≤ 0.05.
Ijms 26 11451 g007
Table 1. Protein identification by mass spectrometry, showing spot numbers corresponding to Figure 1 and Figure S1, protein names, UniProt names, accession numbers, and gene names. The table also reports the following statistical results: ANOVA p–value, adjusted p–value (Benjamini–Hochberg FDR), the V% mean for each condition, and fold-change. The most abundant values are marked in bold. The theoretical pI and MW of identified proteins and MASCOT search results (score, matched peptides, coverage%). Unsuccessfully identified spots report only proteomic and statistical data.
Spot N.Protein NameEntry NameGene NameACANOVA TestFCTheoretical pI–MWMASCOT Search Results
Anova (p)Adjusted (p)
(FDR)
WTITScoreNo. of Matched PeptidesSequence Coverage (%)
1Succinate dehydrogenase [ubiquinone] flavoprotein subunit. mitochondrialSDHA_MOUSESdhaQ8K2B30.00020.0110.02280.01132.017.06–73,62315012/1618
2ATP synthase subunit alpha. mitochondrial Fragment CATPA_MOUSEAtp5f1aQ032650.0020.03610.00960.03493.649.22–59,830656/1014
3Alpha-crystallin B chainCRYAB_MOUSECryabP239270.00350.03610.01910.03982.096.76–20,05618912/1862
4Alpha-1-antitrypsin 1–4A1AT4_MOUSESerpina1dQ008970.00420.03610.06190.14192.295.24–46,1401258/1224
5 0.00450.03610.00510.01242.43
6Carbonic anhydrase 3CAH3_MOUSECa3P160150.00730.03870.02140.03421.66.89–29,63320412/1769
8MICOS complex subunit Mic60MIC60_MOUSEImmtQ8CAQ80.00970.03870.01620.02991.856.18–84,247987/815
9 0.01020.03870.00270.00983.68
11PDZ and LIM domain protein 1PDLI1_MOUSEPdlim1O704000.01360.03870.01570.02991.96.38–36,2081019/1734
12Myosin-7 Fragment CMYH7_MOUSEMyh7Q91Z830.01540.03870.01140.022725.59–223,53912423/3813
13Myosin-1 Fragment CMYH1_MOUSEMyh1Q5SX400.01620.03870.01130.01761.555.60–224,11614821/2911
14Actin. alpha skeletal muscleACTS_MOUSEActa1P681340.01790.03870.00950.02072.185.23–42,36622117/2958
15Myosin-1 Fragment CMYH1_MOUSEMyh1Q5SX400.01910.03870.00650.01161.785.60–224,1167213/227
16Actin. alpha skeletal muscleACTS_MOUSEActa1P681340.01920.03870.01630.02991.835.23–42,366756/1419
17Carbonic anhydrase 3CAH3_MOUSECa3P160150.02130.04010.01210.0191.576.89–29,63318911/1561
18Myosin-1 Fragment CMYH1_MOUSEMyh1Q5SX400.02760.0470.00590.01312.215.60–224,11621026/3214
19Myosin-2MYH2_MOUSEMyh2G3UW820.03240.0490.01040.02742.635.61–224,05010514/1910
20Alpha-1-antitrypsin 1–3A1AT3_MOUSESerpina1cQ008960.03590.0490.1450.22921.585.25–45,96620214/1840
21MyotilinMYOTI_MOUSEMyotQ9JIF90.03720.0490.07650.05061.519.02–55,73820416/2236
22 0.03820.0490.0060.01312.2
23Hemoglobin subunit alphaHBA_MOUSEHbaP019420.03830.0490.06510.1512.327.96–15,1331047/1239
24Myosin-1 Fragment CMYH1_MOUSEMyh1Q5SX400.03840.0490.0170.02671.565.60–224,11610614/178
25Peroxiredoxin-5. mitochondrialPRDX5_MOUSEPrdx5P990290.03920.0490.05260.02681.969.10–222261166/740
26Ankyrin repeat domain–containing protein 2ANKR2_MOUSEAnkrd2Q9WV060.04150.04960.03630.02081.755.95–36,85527318/2367
27Actin. alpha skeletal muscleACTS_MOUSEActa1P681340.04440.04960.01960.03881.985.23–42,36613912/2335
28Actin. alpha skeletal muscleACTS_MOUSEActa1P681340.04730.04970.00730.01952.665.23–42,3661099/1528
29Superoxide dismutase [Mn]. mitochondrialSODM_MOUSESod2P096710.04970.04970.05430.09011.665.57–33,118947/1937
30Myosin-7 Fragment CMYH7_MOUSEMyh7Q91Z830.04970.04970.02230.03671.655.59–223,53919925/2914
31Myosin light chain 3MYL3_MOUSEMyl3P095420.00720.03870.02240.04031.85.03–22,52115410/1451
32TransthyretinTTHY_MOUSETtrP073090.00870.03870.01790.00583.075.77–15,880965/843
33DesminDESM_MOUSEDesP310010.01340.03870.01310.00572.295.21–53,46518013/1632
34Alpha–crystallin B chainCRYAB_MOUSECryabP239270.01390.03870.00850.0042.146.76–20,0561208/1349
35Fructose–bisphosphate aldolase AALDOA_MOUSEAldoaP050640.01730.03870.09450.05761.648.31–397871209/1130
36Trifunctional enzyme subunit alpha. mitochondrialECHA_MOUSEHadhaQ8BMS10.01680.03870.0260.0391.59.24–83,3021017/79
37Carbonic anhydrase 3CAH3_MOUSECa3P160150.01940.03870.00740.01722.336.89–29,63325514/1770
38Pyruvate dehydrogenase E1 component subunit beta. mitochondrialODPB_MOUSEPdhbQ9D0510.02160.04010.01630.00991.656.41–39,254565/916
39Tropomyosin alpha-1 chainTPM1_MOUSETpm1P587710.0280.0470.03280.05161.574.69–32,7181129/1419
40 0.03270.0490.00920.02332.53
41Elongation factor Tu. mitochondrialEFTU_MOUSETufmQ8BFR50.03660.0490.04210.02341.87.23–49,87623617/2137
42 0.03960.0490.04450.02311.92
43Myosin-2 Fragment CMYH2_MOUSEMyh2G3UW820.03860.0490.00620.00931.55.61–224,050829/126
44Malate dehydrogenase. mitochondrialMDHM_MOUSEMdh2P082490.0420.04960.07560.02652.868.93–36,0531047/1230
45Succinate dehydrogenase [ubiquinone] flavoprotein subunit. mitochondrialSDHA_MOUSESdhaQ8K2B30.04290.04960.02240.01361.647.06–73,6231148/914
46Fructose-bisphosphate aldolase AALDOA_MOUSEAldoaP050640.04570.04970.0350.01961.788.31–39,7871558/1024
47 0.04610.04970.01340.00851.57
48ATP synthase F(1) complex catalytic subunit beta. mitochondrialATPB_MOUSEAtp5f1bP564800.00490.03610.01150.01991.735.19–56,26521014/1739
49Myosin–2 Fragment CMYH2_MOUSEMyh2G3UW820.01390.03870.00260.00431.645.61– 22405011314/178
50 0.00320.03610.0110.00671.64
51Aconitate hydratase. mitochondrial Fragment CACON_MOUSEAco2Q99KI00.02740.0470.0090.00581.548.08–8615114512/1721
52Fatty acid-binding protein. heartFABPH_MOUSEFabp3P114040.04940.04970.27970.42051.56.11–1481018312/2373
Disclaimer/Publisher’s Note: The statements, opinions and data contained in all publications are solely those of the individual author(s) and contributor(s) and not of MDPI and/or the editor(s). MDPI and/or the editor(s) disclaim responsibility for any injury to people or property resulting from any ideas, methods, instructions or products referred to in the content.