Article

Integrative Epigenomic and Targeted Protein Analysis in MRONJ: Correlating DNA Methylation with Bone Biomarkers

1
Department of Pharmacotherapy and Translational Research and Center for Pharmacogenomics and Precision Medicine, College of Pharmacy, University of Florida, Gainesville, FL 32610, USA
2
Department of Clinical Pharmacy, College of Pharmacy, University of Ha’il, Ha’il 55473, Saudi Arabia
3
Miami Cancer Institute, Baptist Health South Florida, Miami, FL 33176, USA
4
Department of Oral Medicine, College of Dentistry, University of Florida, Gainesville, FL 32610, USA
5
Department of Orthodontics, College of Dentistry, University of Florida, Gainesville, FL 32610, USA
6
Cardio-Oncology Working Group, University of Florida Health Cancer Institute, Gainesville, FL 32610, USA
*
Author to whom correspondence should be addressed.
Int. J. Mol. Sci. 2025, 26(22), 11208; https://doi.org/10.3390/ijms262211208
Submission received: 17 September 2025 / Revised: 14 November 2025 / Accepted: 17 November 2025 / Published: 20 November 2025
(This article belongs to the Special Issue Genetic and Epigenetic Analyses in Cancer)

Abstract

Medication-related osteonecrosis of the jaw (MRONJ) is a severe adverse effect of antiresorptive agents, including bisphosphonates (BPs) and denosumab (DMB). We conducted a case–control epigenome-wide association study (EWAS) of 24 cancer patients treated with BPs or BPs + DMB using the Infinium® MethylationEPIC v2.0 to explore epigenetic differences associated with MRONJ. Differentially methylated positions (DMPs) and regions (DMRs) were assessed across three analyses: MRONJ vs. controls (main), BPs-MRONJ vs. BPs-controls, and BPs/DMB-MRONJ vs. BPs/DMB-controls. Eight plasma bone biomarkers were quantified by Luminex and correlated with top methylation sites. We identified 10 DMPs and 4 DMRs at suggestive significance (p < 1 × 10⁻⁵). cg1913766 in the NOP56 promoter was hypomethylated in the main analysis (p = 2.19 × 10⁻⁷) and in BPs-MRONJ (p = 4.80 × 10⁻⁶), correlating with osteocalcin (p = 0.02 and 0.03, respectively). TNXB cg21289669 was hypermethylated in the main analyses (p = 6.31 × 10⁻⁶), and TNXB locus formed a DMR (p = 3.30 × 10⁻¹⁰) in the main and BPs-MRONJ analyses (p = 2.76 × 10⁻⁷). cg11392877 in PDE8A was hypomethylated in BPs/DMB-MRONJ (p = 5.35 × 10⁻⁷). TRIM15 was a significant DMR in BPs-MRONJ and the main analysis (p = 3.30 × 10⁻¹⁰). TRIM15, TNXB, and PDE8A regulate collagen I, while NOP56 supports ribosome biogenesis, potentially contributing to MRONJ. Given the small sample size, these findings are preliminary and validation in larger studies is warranted.

1. Introduction

Medication-related osteonecrosis of the jaw (MRONJ) is a rare adverse drug reaction (ADR) associated with the use of antiresorptive medications such as bisphosphonates (BPs) and denosumab (DMB) that is characterized by an exposed unhealed jawbone that does not heal within eight weeks [1]. The incidence of MRONJ in patients with cancer is 2.4% with DMB and 1.7% with Zoledronic acid [2]. The common underlying mechanisms of MRONJ are believed to be inhibition of bone remodeling and angiogenesis, with proposed contributing factors including inflammation, infection, or immune dysfunction [1].
Numerous pharmacogenomic studies, including genome-wide association studies (GWAS) and candidate gene studies, have been conducted to identify genetic variants associated with MRONJ and to understand the pathophysiology of MRONJ. The majority of variants discovered in these studies are located in non-coding regions [3,4,5], consistent with the broader GWAS literature in which ~90% of associations map to non-coding regions [6]. However, germline variation accounts for only the inherited part of MRONJ risk, whereas epigenetic, particularly DNA methylation, may reflect treatment-related exposure. In bone, DNA methylation at the promoters of osteoprotegerin (OPG) and RANKL has been found to modulate osteoclastogenesis [7].
Epigenetics is the study of heritable changes in gene expression without altering the DNA sequence [8]. There are three main epigenetic mechanisms through which gene expression can be altered: histone modifications, non-coding RNA, and DNA methylation [8]. DNA methylation is a process catalyzed by DNA methyltransferases (Dnmts) enzymes which add a methyl group to 5-cytosine rings that follow guanine. It serves as a key epigenetic mechanism that can either silence or activate gene expression, without altering the DNA sequence. Therefore, epigenome-wide association study (EWAS) could provide an additional layer of insight into the mechanism of MRONJ.
In this study, we conducted a case–control EWAS to identify DNA methylation differences between MRONJ cases and controls by investigating differentially methylated positions (DMPs) and regions (DMRs) in cancer patients treated with BPs and sequential BPs/DMB therapy. Additionally, we performed targeted protein analysis in the plasma samples of the same patients to quantify the level of several bone protein biomarkers, including osteocalcin (OC), osteoprotegerin (OPG), osteopontin (OPN), sclerostin (SOST), interleukin-6 (IL-6), interleukin 1β (IL-1B), tumor necrosis factor α (TNF-α), and receptor activator of nuclear factor kappa B-ligand (RANKL). We then evaluated the correlation of these protein markers with the top DMPs.
EWAS approaches have been applied in bone-related conditions such as osteoporosis and osteoarthritis. However, to the best of our knowledge, there are no existing studies that examine EWAS aspects of MRONJ, which is a major gap in our understanding of the condition. By integrating targeted protein analysis with DNA methylation, we aim to fill this knowledge gap by studying differential DNA methylations that affect bone biomarker expression, thereby improving our understanding of the molecular mechanisms of MRONJ.

2. Results

In this study, we included 24 patients with cancer who were treated with either BPs or DMB. Among these, 12 were MRONJ cases and 12 were controls. Among the 15 patients treated with BPs, seven had MRONJ and eight were controls. Among the nine patients treated with BPs and DMB sequentially, five had MRONJ, and four were controls.
There were no significant differences in the demographic characteristics, such as age, sex, BMI, race, or smoking status, between MRONJ and controls (Table 1). In the MRONJ group, 58.3% of patients were White, and 33.3% were Black, while the control group included 83.3% White and 8.3% Black individuals. Among the 12 MRONJ cases, 58.3% were in stage 1 and 25% in stage 2 based on the American Association of Oral and Maxillofacial Surgeons (AAOMS) staging system, with stages 3 and 4 unrepresented. Staging information was not available for 2 patients (16.7%). Lesion locations were predominantly in the mandible (58.3%), with 16.7% in the maxilla, and 8.3% in the posterior. Lesion locations were not documented for 2 patients (16.7%). Bassline characteristics of participants for the subgroup analyses are provided in the Supplementary Data (Tables S1 and S2).
The EWAS quality control (QC) steps and analysis workflow are summarized in Figure 1. After the QC steps, a total of 846,315 CpG probes remained for differential methylation analyses. As shown in the method, we performed three analyses in this study. The main analysis (MRONJ vs. controls) and two subgroup analyses: first, (BPs-MRONJ vs. BPs controls), and second, (BPs/DMB-MRONJ vs. BPs/DMB controls) were performed. DMPs and DMRs were analyzed for all three analyses.

2.1. Differentially Methylated Probes

2.1.1. Main Analysis: MRONJ vs. Controls

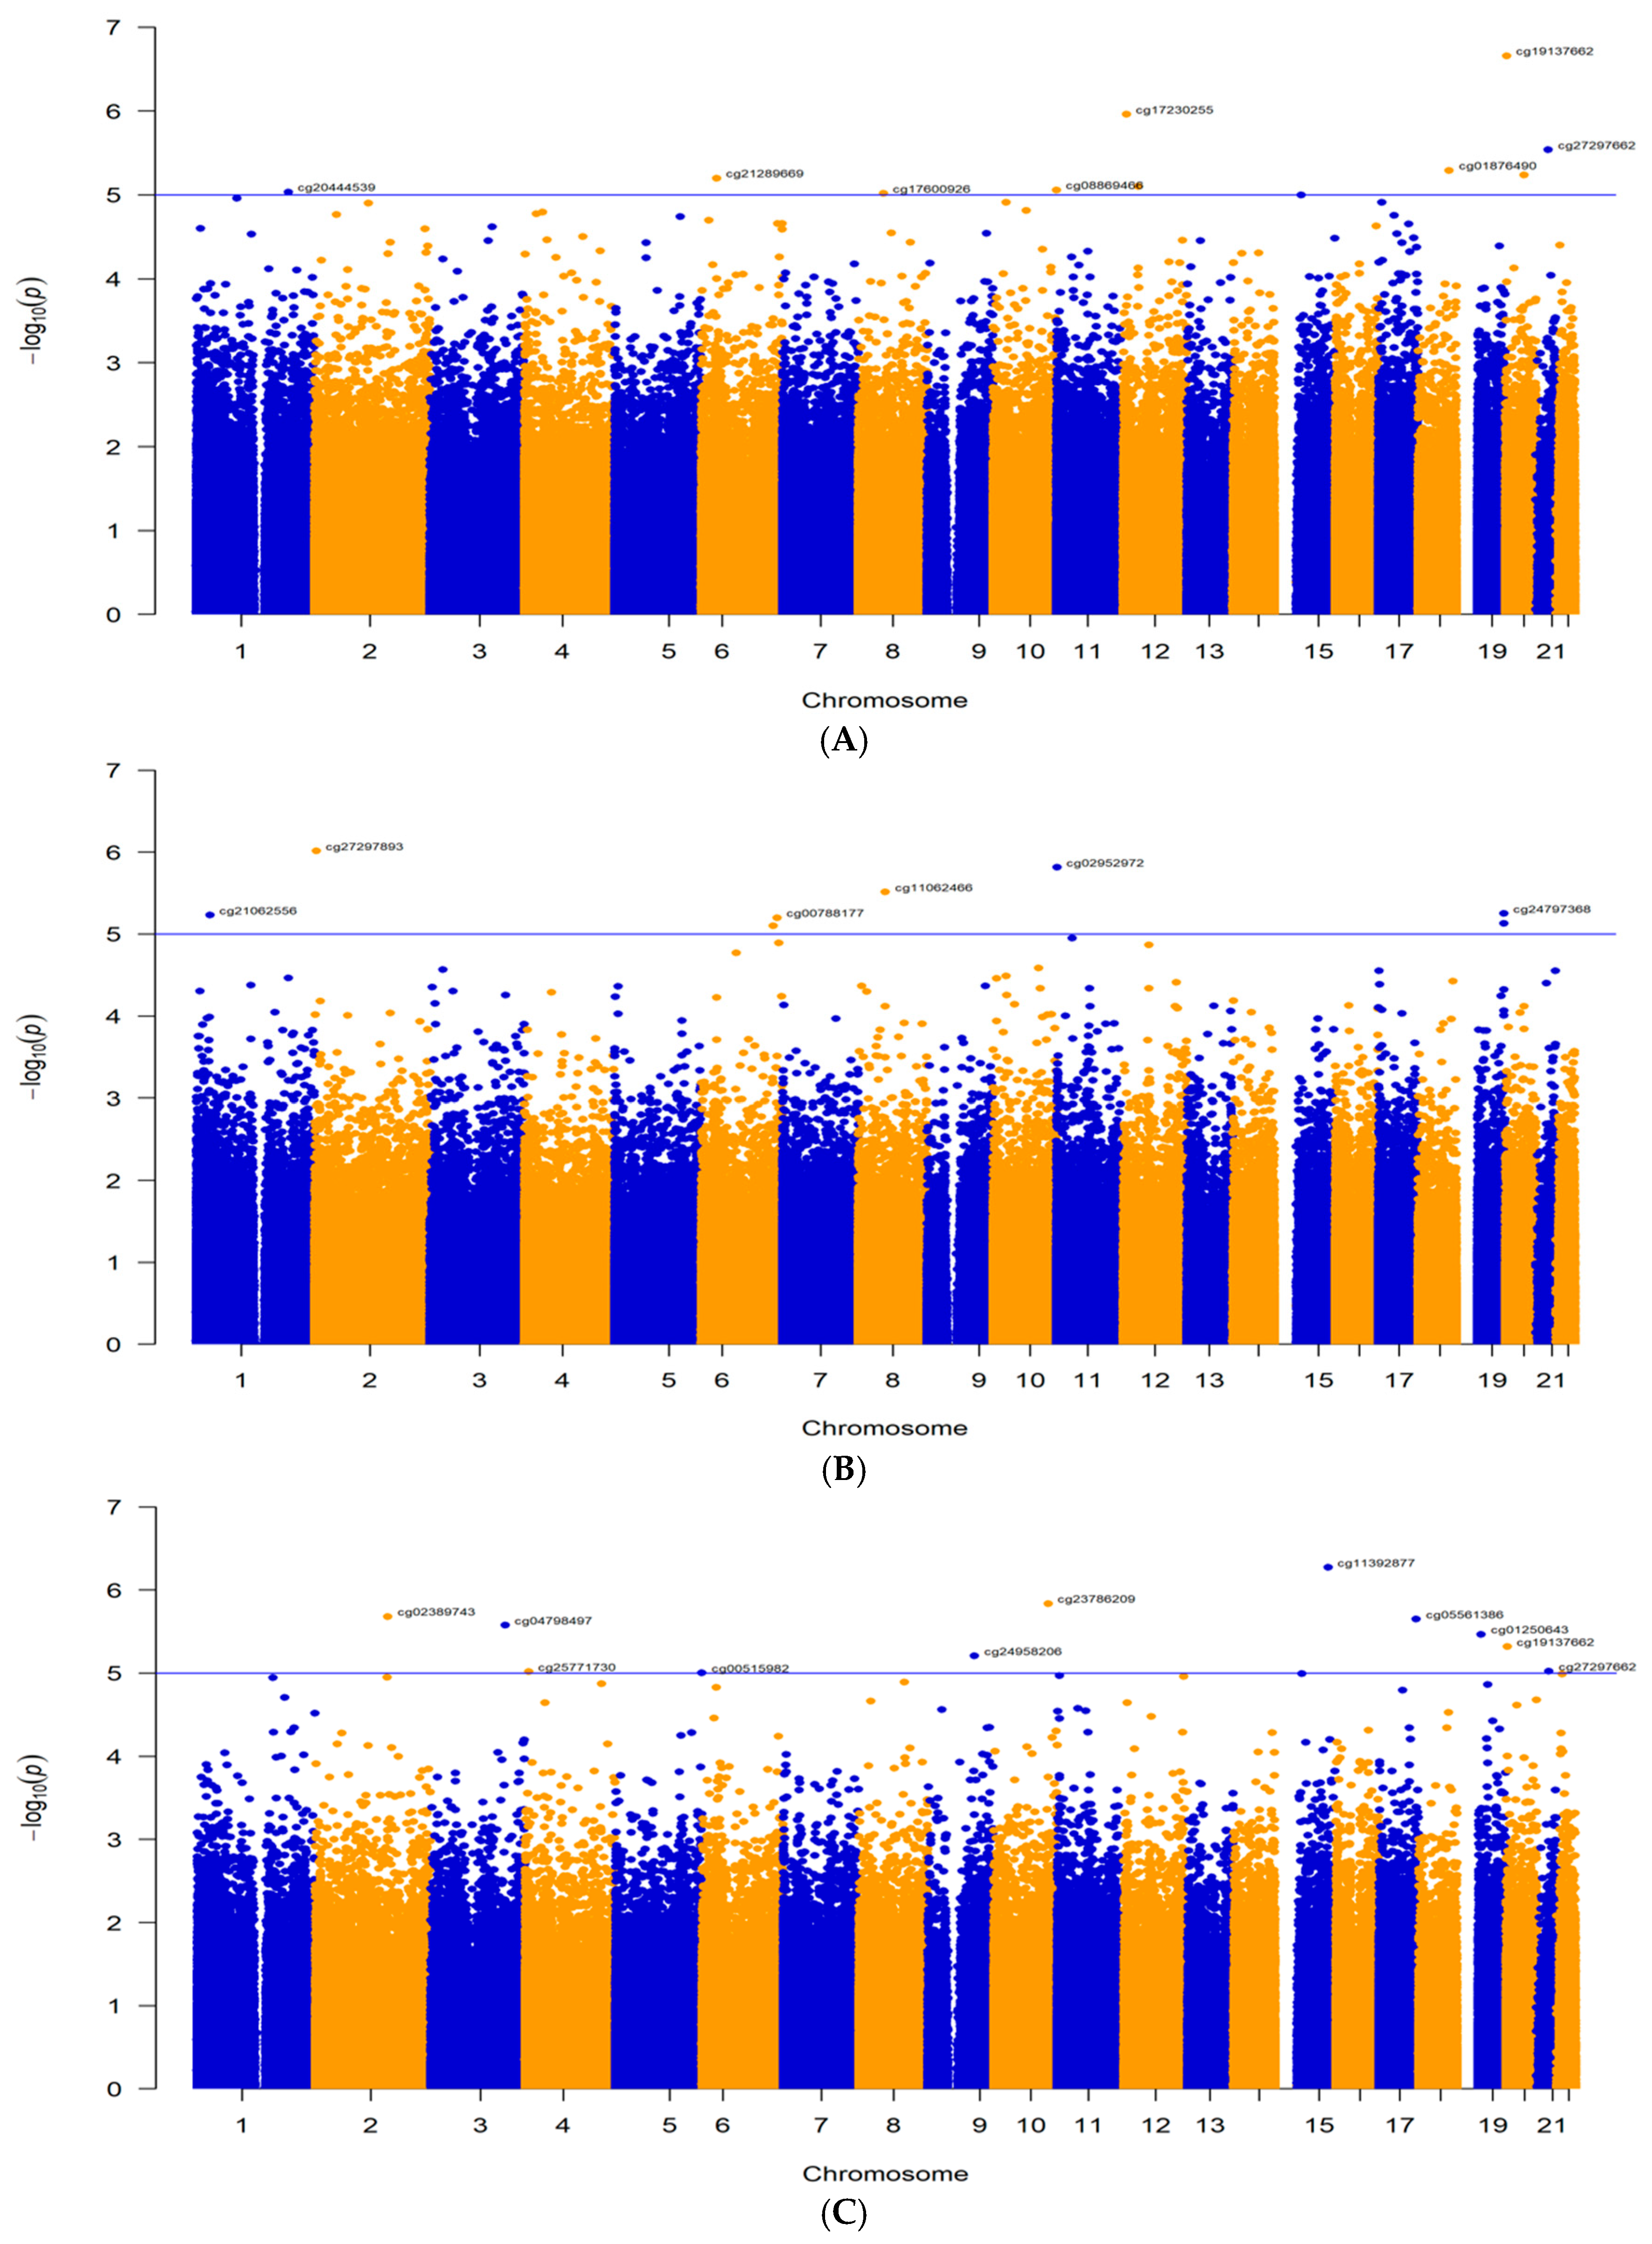
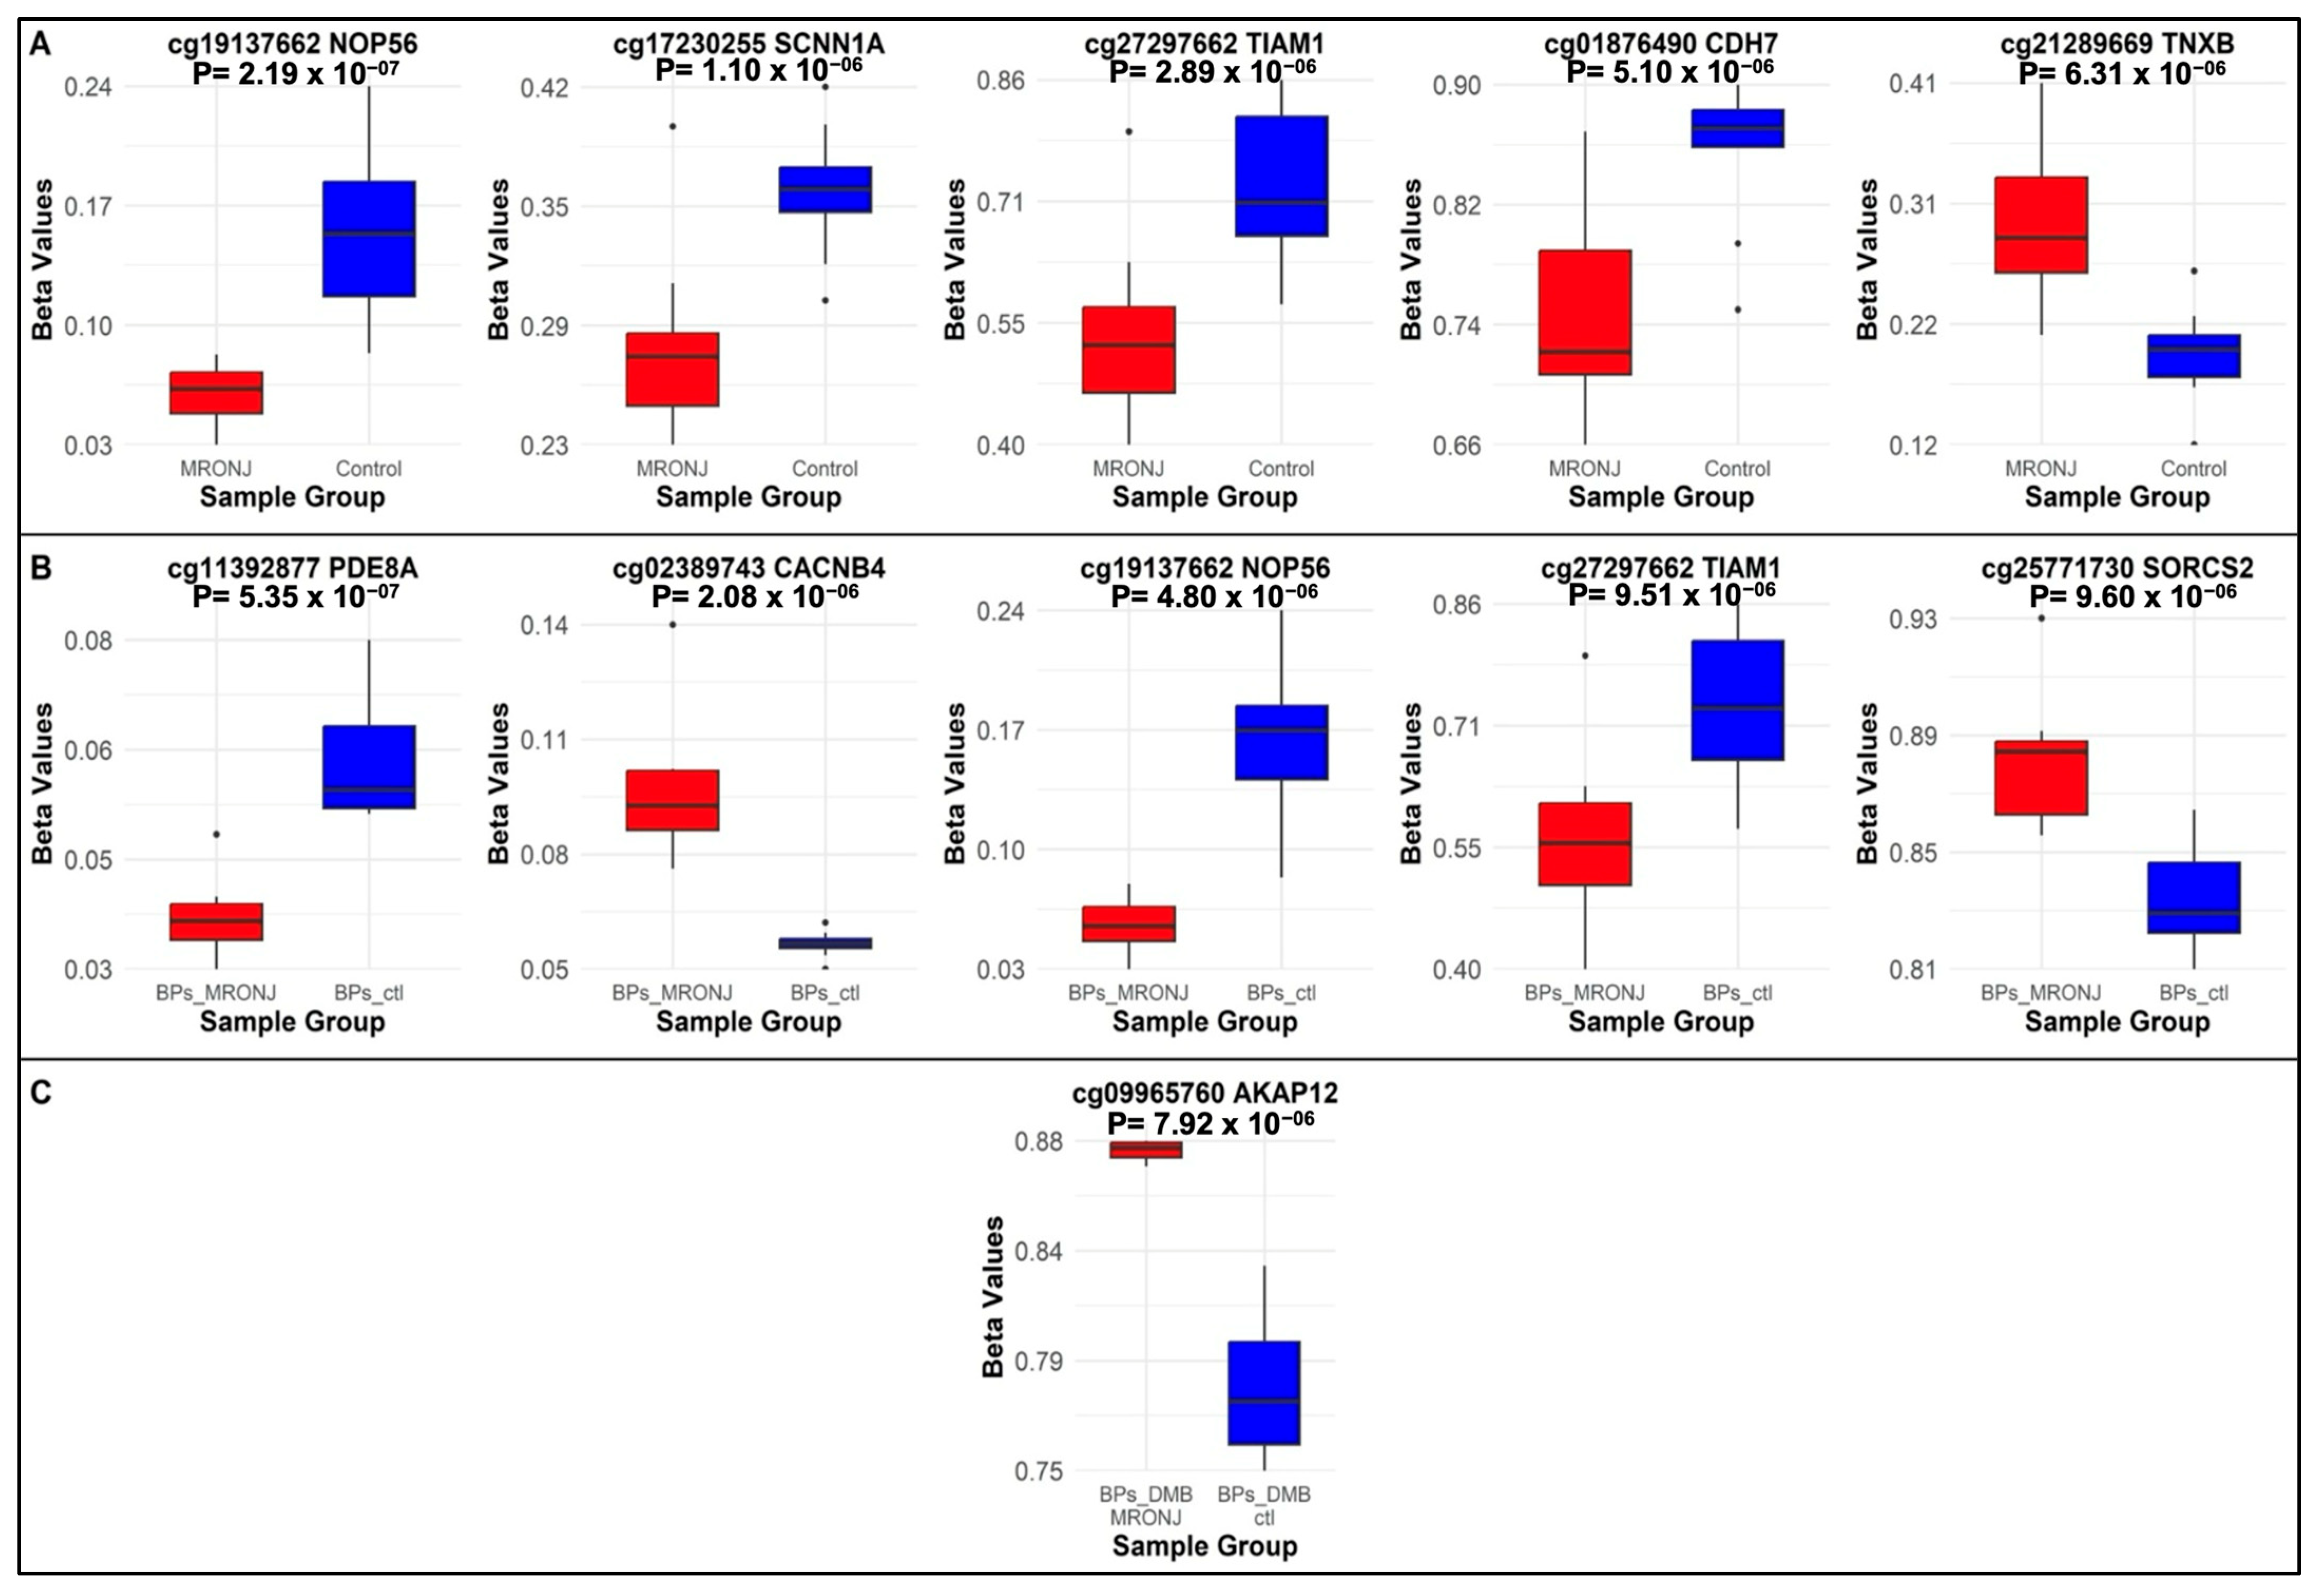
In the main analysis, none of the CpG sites reached the Bonferroni-corrected epigenome-wide significant threshold of 5.91 × 10⁻⁸. However, ten DMPs met the suggestive level of significance (p < 1 × 10⁻⁵) (Table S3; Figure 2A). Two of these DMPs are located in promoter regions, four in intronic regions, two in exons, one intergenic, and one in a 3′-untranslated region (UTR). Among these DMPs, five are hypomethylated and five are hypermethylated (Table S3). Five DMPs had a plausible mechanistic explanation for how they might be involved in the development of MRONJ: cg19137662 in the NOP56 promoter (p = 2.19 × 10⁻⁷, logFC = −1.38), cg17230255 in the SCNN1A promoter (p = 1.10 × 10⁻⁶, logFC = −0.60), cg27297662 in the TIAM1 intron (p = 2.89 × 10⁻⁶, logFC = −1.30), cg01876490 in the CDH7 intron (p = 5.10 × 10⁻⁶, logFC = −1.10), and cg21289669 in the TNXB exon (p = 6.31 × 10⁻⁶, logFC = 0.84) (Table 1). The beta values of these five DMPs in MRONJ vs. controls are shown in Figure 3A.

2.1.2. First Subgroup Analysis: BPs-MRONJ vs. BPs-Controls

Eleven DMPs were associated with BPs MRONJ at the suggestive level of p < 1 × 10⁻⁵ in the first subgroup analysis, eight were located in promoter regions and three in introns (Figure 2B, Table S4). Among these DMPs, four were hypermethylated and six were hypomethylated. Five DMPs are within genes that have plausible mechanistic explanations for MRONJ. These DMPs include cg11392877 in the PDE8A promoter (p = 5.35 × 10⁻⁷, logFC = −0.98), cg02389743 in the CACNB4 promoter (p = 2.08 × 10⁻⁶, logFC = 0.92), cg19137662 in the NOP56 promoter (p = 4.80 × 10⁻⁶, logFC = −1.61), cg27297662 in the TIAM1 intron (p = 9.51 × 10⁻⁶, logFC = −1.53), and cg20000507 in the RACK1 promoter (p = 9.94 × 10⁻⁶, logFC = −0.81) (Table 2). The beta values of these five DMPs in BPs-MRONJ and BPs-controls are illustrated in Figure 3B.

2.1.3. Second Subgroup Analysis: BPs/DMB MRONJ vs. BPs/DMB

Eight DMPs were associated with BPs/DMB-MRONJ at the suggestive level of p < 1 × 10⁻⁵ (Table S5). One DMP that is hypermethylated and has a possible mechanistic explanation is located in the intronic region of AKAP12 (p = 7.92 × 10⁻⁶, logFC = 0.89) (Figure 2C). The beta values of these five DMPs in BPs/DMB-MRONJ and BPs/DMB-controls are illustrated in Figure 3B.

2.2. DMRs

Four DMRs were identified at the suggestive level of p < 1 × 10⁻⁵ in the DMRs analysis and have plausible mechanistic explanations in MRONJ. Three of four DMRs were identified in the main analysis. Two DMRs were statistically significant, one DMR in the main analysis and another one in the first subgroup analysis. (Table 3 and Tables S6–S8).
The top DMR in the main analysis was TNXB, which included 20 DMPs (p = 3.30 × 10⁻¹⁰, mean methylation difference = 0.07). This DMR was associated with MRONJ in the first subgroup analysis of BPs MRONJ vs. BPs controls, with 10 DMPs found within the TNXB gene (p = 2.76 × 10⁻⁷, mean methylation difference = 0.09) (Table 3).
SPON2 was identified as a DMR in both the main analysis and the first subgroup analysis. In the main analysis, the DMR in SPON2 included 13 CpGs (p = 2.76 × 10⁻⁷, mean methylation difference = 0.03). In the first subgroup analysis, the DMR comprised 12 CpGs within SPON2 (p = 4.27 × 10⁻⁸, mean methylation difference = 0.04) were identified.
TRIM15 was significant in the first subgroup analysis, comprising 12 CpGs within TRIM15 (p = 3.30 × 10⁻¹⁰, mean methylation difference = 0.10), while this DMR was also associated with MRONJ in the main analysis with 9 CpGs (p = 4.13 × 10⁻⁵, mean methylation difference = 0.10) (Figures S1 and S2).
In addition, one DMR was unique and was marginally significant in the main analysis. It involved a group of Homeobox genes, HOXB-AS3, HOXB3, and HOXB4, including 15 CpGs (p = 4.27 × 10⁻⁸, mean methylation difference = 0.07).

2.3. Bone Protein Biomarkers

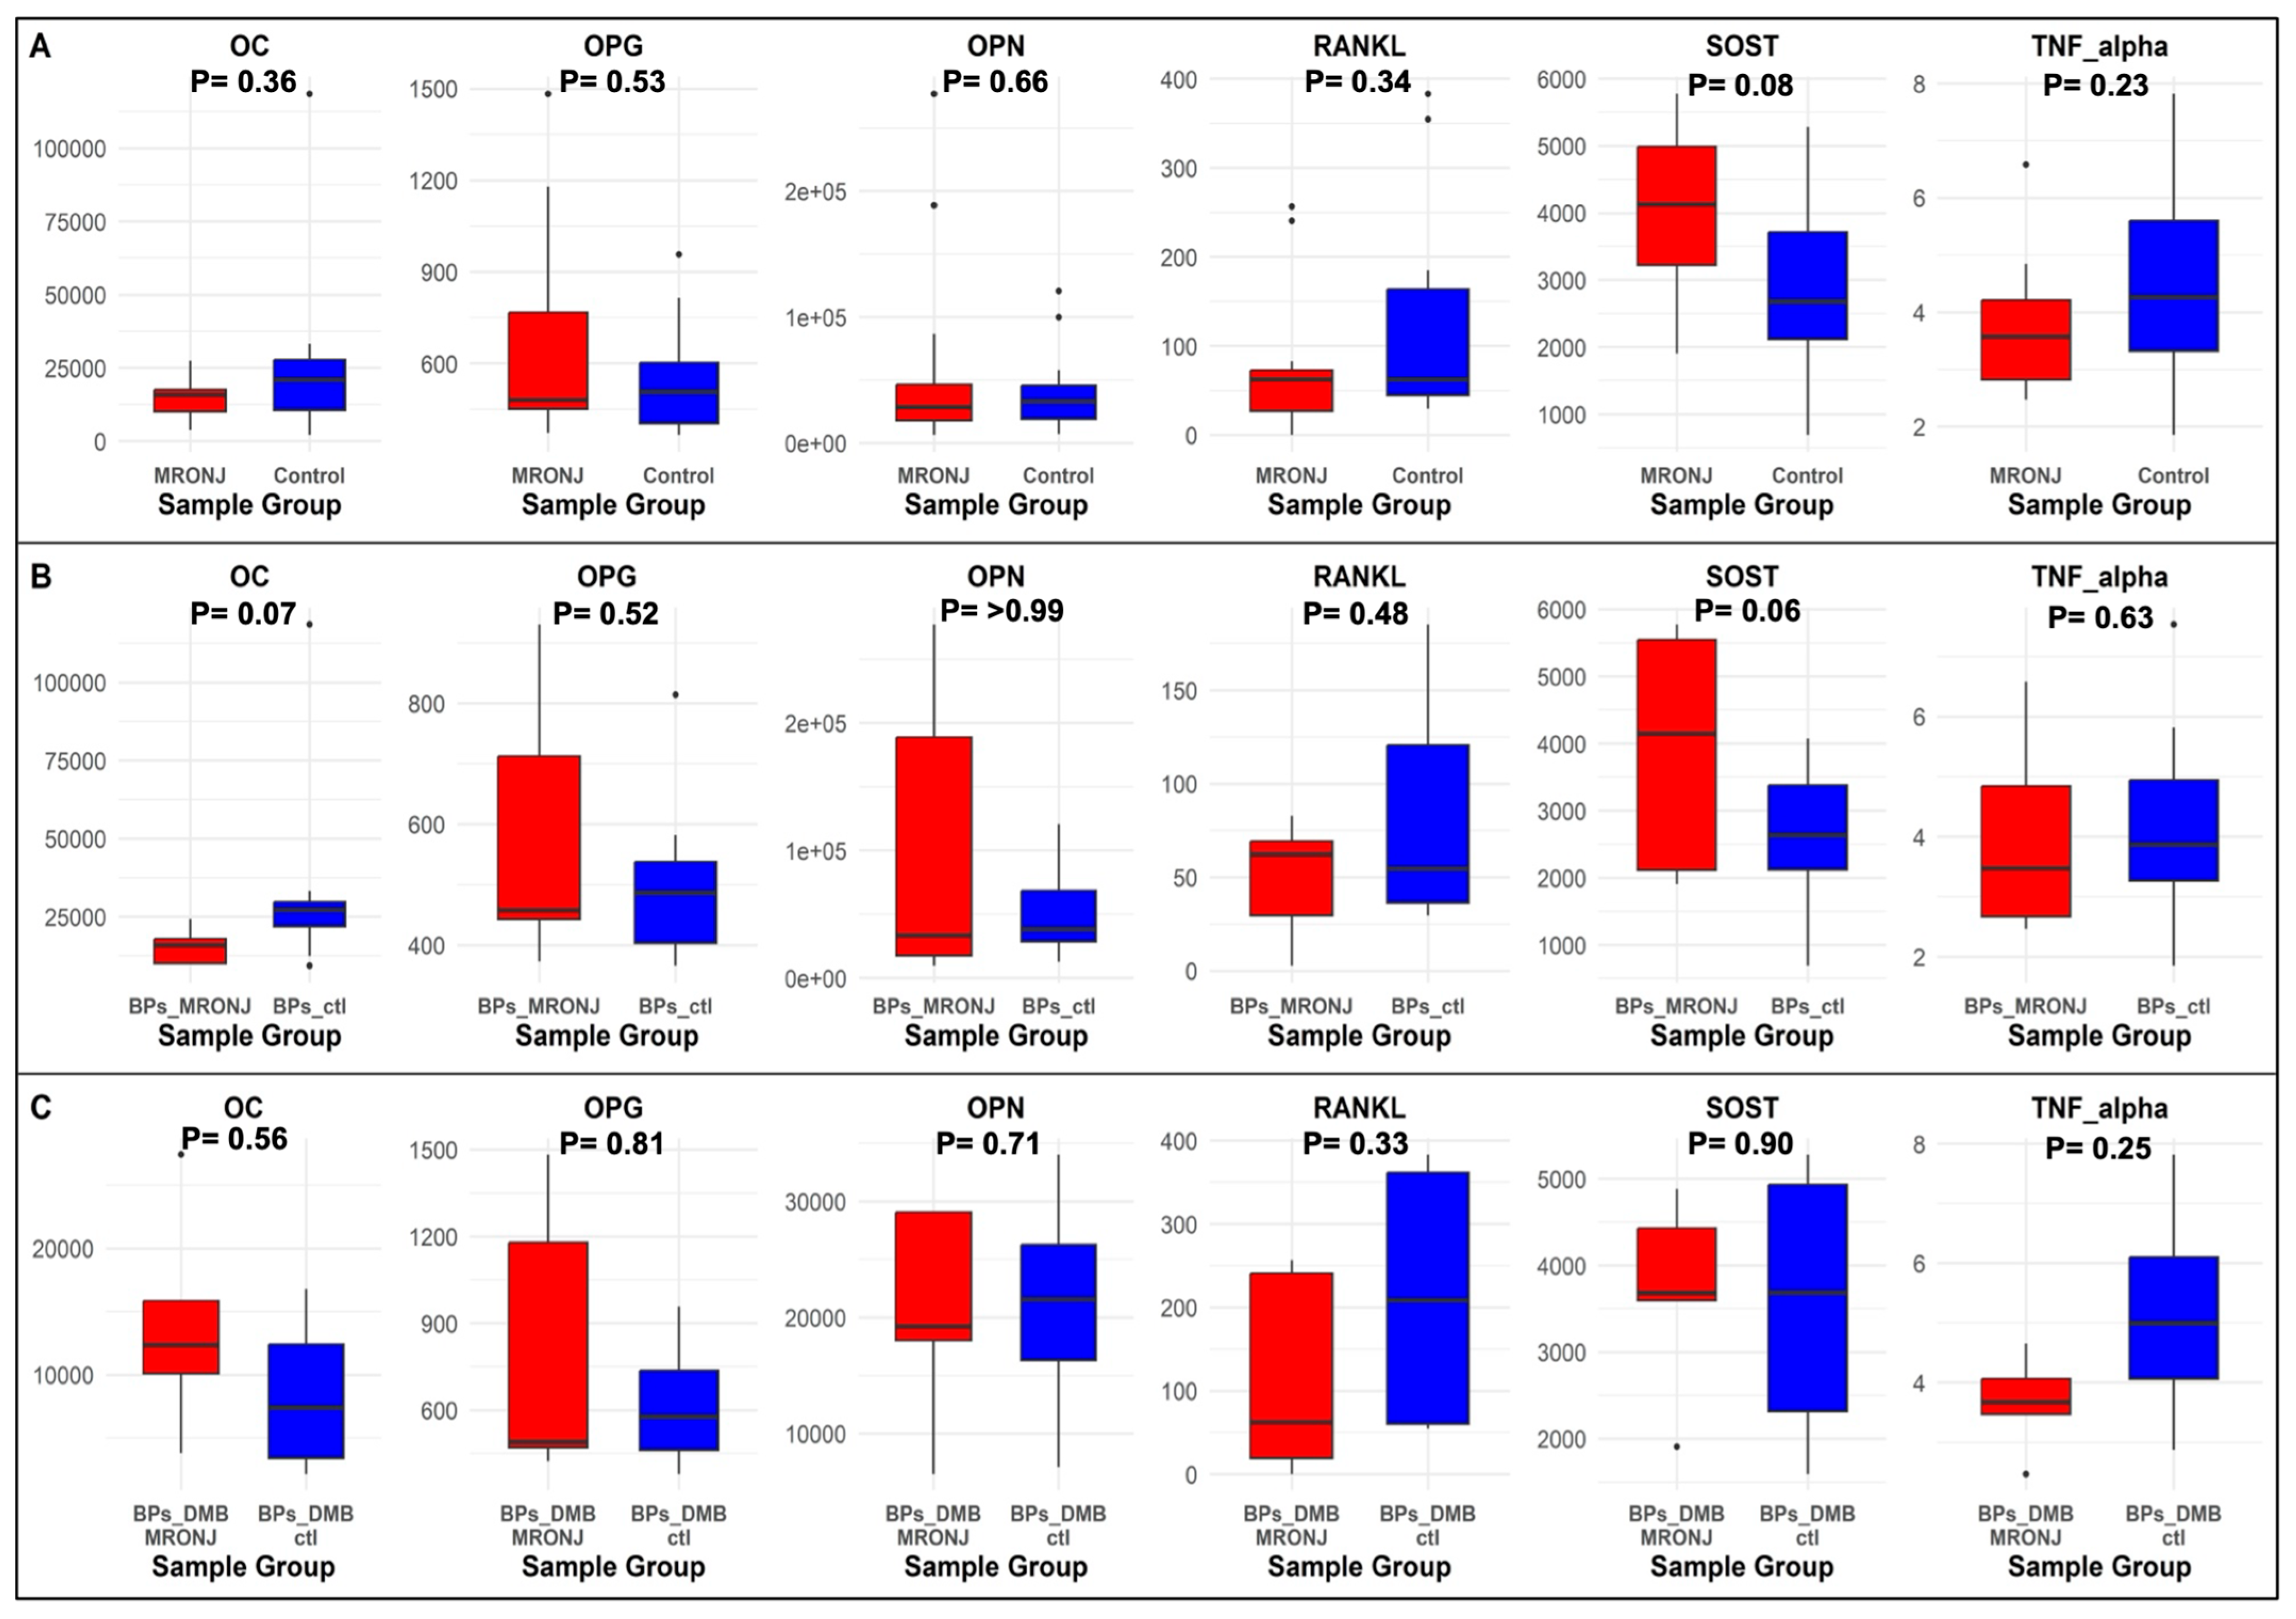
We also measured the protein levels of bone biomarkers OC, OPG, OPN, SOST, TNF-α, RANKL, IL-6, and IL-1B in these 24 patients. Six biomarkers passed quality control: OC, OPG, OPN, SOST, TNF-α, and RANKL (Table S9). The levels of these six protein biomarkers in MRONJ vs. controls are presented in Figure 4. In the main and subgroup analyses, none of the biomarkers had a significant difference between MRONJ and controls. Notably, the concentration of SOST was marginally higher in the MRONJ patients compared to controls in the main analysis (p = 0.08) and in the first subgroup analysis (p = 0.06) (Figure 4). The biomarker OC had a trend to be lower in the BP MRONJ patients compared to the BP controls in the first subgroup analysis (p = 0.07). However, the trend was in the opposite direction: higher in BPs/DMB MRONJ compared to BPs/DMB controls, among the patients treated with BPs/DMB sequentially. The p-value was 0.36 in the combined analysis of MRONJ vs. controls.

2.4. Correlation Analysis

To gain a more comprehensive understanding of the molecular mechanism of MRONJ, we assessed the correlation between DNA methylation and the bone protein biomarker levels in these patients. Pearson correlation analysis was performed to assess the relationship between bone biomarkers and significant DMPs in both the main analysis and subgroup analyses. In the main analysis, OC showed a significant moderate positive correlation with cg19137662, which is located in the promoter region of NOP56 (r = 0.48, p = 0.02) (Table 4; Figures S3 and S4). In the first subgroup analysis, the correlation coefficient was higher, indicating a stronger positive relationship (r = 0.57); however, the statistical significance was slightly reduced (p = 0.03) (Figures S5 and S6). The same DMP demonstrated a significant moderate positive correlation with RANKL in the second subgroup analysis (r = 0.73, p = 0.03) (Figures S7 and S8). Additionally, TNF-α showed a significant moderate correlation with cg17230255 in the promoter region of SCNN1A in both the main analysis and the first subgroup analysis (r = 0.56, p = 0.004; r = 0.66, p = 0.01). In contrast, SOST showed a borderline significant negative correlation with cg11392877 in the promoter region of PDE8A in the first subgroup analysis (r = −0.51, p = 0.05). The same DMP had a significantly positive correlation with OPG in the second subgroup analysis (r = 0.82, p = 0.01). However, in the second subgroup analysis, the correlation coefficient was not as strong (r = 0.63, p = 0.07). No other correlations tested reached statistical significance (p ≥ 0.05).

3. Discussion

In this first EWAS analysis of MRONJ, we evaluated DNA methylations in MRONJ cases vs. controls in cancer patients treated with BP or DMB. We also evaluated cases of MRONJ induced by BPs alone or sequential BPs/DMB treatments, comparing them with patients with the same treatments but who had not developed MRONJ. We identified a total of ten DMPs and four DMRs that provide plausible mechanistic explanations for the development of MRONJ. A few of these DMPs also correlated with bone protein marker levels in plasma.
The direct action of BPs is thought to be primarily or exclusively on osteoclasts [9]. DMB directly inhibits osteoclast differentiation and also has direct effects on immune cells [10]. Many of the genes that we found associated with DMPs and DMRs have previously been identified as being expressed in osteoclasts, and some are known regulators of osteoclast activity. The genes differentially regulated by methylation fall into several functional categories: regulators of ribosome formation, ion channels, cytoskeletal regulators, extracellular matrix components, cyclic AMP-phosphodiesterase, vesicle sorting apparatus proteins, signal transduction scaffold proteins, E3-ubiquitin ligases, and homeobox genes, including long non-coding RNAs.
The top hit DMP was cg19137662 in the promoter of the NOP56 gene, which encodes the NOP56 ribonuclear protein. cg19137662 is located in regions enriched for H3K4me3 and H3K27ac histone marks, which are typically associated with active promoter regions. This CpG also shows strong DNase I hypersensitivity signal intensity, indicating open chromatin accessibility, and is located near a defined transcription start site (TSS) peak, supporting its potential regulatory function [11]. NOP56 is a nucleolar protein involved in ribosome formation. It is unclear how this gene might be associated with MRONJ, but it is linked to cancer and the neurodegenerative disease, spinocerebellar ataxia type 36 [12]. In our study, we found an intriguing correlation of this CpG with plasma OC levels, which is a marker for bone turnover. In BPs-treated patients, a moderately significant positive correlation between methylation of cg19137662 and OC levels was detected in both MRONJ and controls. In patients who were treated with BPs, then shifted to DMB, higher methylation of cg19137662 significantly correlated with lower OC levels. This suggests that a fundamental change in bone turnover occurred that may be related to the increased rate of MRONJ in patients who switch from BPs to DMBs.
Two different DMPs associated with ion channels were identified. Cg17230255 is located in the promoter region of SCNN1A, a subunit of the epithelial sodium channel (ENaC). This DMP is in a region enriched with H3K4me3 and H3K27ac histone marks and overlaps with DNase I hypersensitivity peak, indicating open chromatin and active promoter-associated regulatory potential [11]. ENaC is expressed in osteoclasts and may have a regulatory function [13,14]. Interestingly, a study reported that BPs stimulate non-selective cation channels, including ENaC, and it was postulated that this might contribute to their ability to inhibit osteoclasts [15]. Methylation of the cg17230255 was moderately correlated with TNFα plasma levels, and GeneMANIA network analysis shows a link between SCNN1A and TNFα. The second channel identified was the voltage-gated calcium channel subunit gene CACNB4, which harbors DMP cg02389743 located in a CpG island and the CACNB4 promoter. This site overlaps with regions enriched for H3K4me3 and H3K27ac histone marks, as well as a DNase I hypersensitivity peak, indicating an active promoter and open chromatin configuration [11]. The CACNB4 gene codes for calcium voltage-gated channel auxiliary subunit beta 4, part of a voltage-dependent calcium channel complex that mediates calcium influx into cells upon membrane polarization. It is linked to neurological disorders, including episodic ataxia and epilepsy. In osteoclasts, calcium signaling plays a vital role, and voltage-gated calcium channels have been implicated [16]. The CACNB4 gene inhibits wnt/beta catenin signaling, which is a central regulatory pathway in bone formation by osteoblasts [17,18]. Changes in CACNB4 expression due to differential methylation could alter the bone response to BPs or DMB.
Osteoclasts depend on a complex cytoskeletal structure called the actin ring for bone resorption [19]. BPs disrupt the prenylation of rho-GTPases, vital regulators of actin ring formation [9]. Cg27297662 is an intron in the TIAM1, which encodes T-cell lymphoma invasion and metastasis-inducing protein 1 (TIAM1), a guanine exchange factor (GEF) that activates various rho-class GTPases [20]. This DMP lies within an enhancer-like structure enriched with H3K4me1 and weak H3K27ac signals and overlaps a DNase I hypersensitivity peak [11]. TIAM1 has been shown to be a crucial regulator of podosomes/invadapodia, which are discrete, dynamic, actin structures that in osteoclasts are organized to form actin rings [21,22]. Although TIAM1 has not been studied in osteoclasts, it is known to be associated with cortactin in other cell types, and cortactin is a crucial protein controlling the actin ring of osteoclasts [23,24,25].
TNXB has been identified as both a DMP and a DMR. Cg21289669 is in a CpG island in an exon of TNXB gene that encodes tenascin X. This DMP is located in a region characterized by enhancer-associated histone marks (H3K4me1 and H3K27ac) and DNase I hypersensitivity, consistent with open chromatin and active regulatory function [11]. This large extracellular matrix protein regulates the deposition of collagen and provides structural support for elastic fibers. Mutations result in Ehlers-Danlos syndrome, which includes bone loss as part of the pathology. This is due to increased osteoclast activity without affecting osteoblast bone formation [26]. Changes in expression of tenascin X due to differential methylation would be expected to alter bone remodeling by affecting the extracellular matrix.
Cyclic AMP is an important second messenger regulating bone remodeling [27]. The DMP cg11392877 is in the promoter of phosphodiesterase 8A (PDE8A), an enzyme that breaks down cAMP. Chromatin annotation indicates that this DMP lies within an enhancer–promoter region enriched with H3K4me1, H3K4me3, and H3K27ac histone marks and exhibits an elevated DNase I hypersensitivity signal, suggesting open and transcriptionally active chromatin [11]. In osteoclasts, cAMP inhibits resorptive activity [28] while in osteoblasts, cAMP promotes bone formation [29]. Knockdown of phosphodiesterase 8A by RNA interference inhibited the differentiation and activity of osteoblasts in vitro, providing evidence that it is involved in regulating bone remodeling [30]. Alterations in phosphodiesterase 8A expression would be expected to alter bone remodeling.
AKAP12 and RACK1 encode proteins that serve as scaffolding proteins in signal transduction pathways. A–kinase–anchoring protein-12 serves to compartmentalize components of the cyclic AMP-signaling pathway to sites in the plasma membrane [31]. It has been linked to the regulation of osteoclasts and osteoblasts and exacerbates rheumatoid arthritis [32]. Receptor for Activated Protein Kinase C 1 anchors protein kinase C, c-Src, and other signaling molecules to ribosomes and to focal adhesions at the plasma membrane [33,34]. Its interaction with c-Src was reported to be crucial for the organization of osteoclasts’ actin rings and bone resorption [35]. cg09965760 is found in an intron of AKAP12. cg00515982 is present in the promoter of RACK1.
A DMR was identified in TRIM15. This gene codes tripartite motif-containing protein 15, an E3 ubiquitin ligase that is involved in the regulation involving AKT/FOX01/LASP, which has been linked to oncogenesis [36]. Recent data from a study published in 2025 show that this regulation is involved in chondrocyte senescence and the progression of osteoarthritis [37].
A unique DMR was identified associated with HOXB-AS3, HOXB3, and HOXB4. These homeobox genes are part of a family that regulates organogenesis [38]. HOXB3 is linked to angiogenesis [39]. In endothelial cells, HOXB3 drives ephrin-A1 expression and promotes sprout-to-tube formation; notably, the endothelial cells that are maturing into capillaries show HOXB3 expression [40]. During endothelial differentiation of human mesenchymal stem cells, HOXB3 levels rise sharply by day 21 [41]. Given that MRONJ involves impaired vascularization and wound repair in the jaw, methylation shifts across the HOXB-AS3/HOXB3/HOXB4 locus could plausibly influence the angiogenic responses.
Plasma levels of OC, OPG, OPN, SOST, TNF-α, and RANKL were measured but did not differ significantly between MRONJ and controls in the main and the subgroups analyses. However, SOST levels showed a trend toward being higher in MRONJ patients in both the main analysis and the BP subgroup. This observation is biologically plausible, as sclerostin is a Wnt pathway inhibitor secreted by osteocytes that reduces osteoblast activity and bone formation. BPs have been shown to upregulate SOST expression, thereby further suppressing Wnt signaling and contributing to decreased bone formation [42]. Thus, higher circulating levels may reflect suppressed bone remodeling in MRONJ. On the other hand, OC levels showed more variability. In the BPs-treated subgroup, OC tended to be lower in MRONJ patients compared with controls, which may suggest impaired bone formation activity under bisphosphonate treatment. In contrast, in the sequential BPs/DMB subgroup, the trend was reversed, with higher OC levels in MRONJ compared with controls. Future research should prioritize local biomarker sources such as saliva or gingival crevicular fluid and employ larger sample sizes to enhance sensitivity in identifying molecular alterations linked to MRONJ.
This study has some limitations. First, we had a small sample size, which makes it difficult to capture significant signals at the epigenome-wide level. Based on that, a relaxed p-value threshold was used in DMPs and DMRs, and a less conservative approach was used in EWAS. We utilized 1 × 10⁻⁵ as a suggestive threshold to define suggestive DMPs. The same approach was used for the DMRs by using a p-value < 0.05 to define putative DMPs to obtain them. Secondly, we lacked information on patients’ oral hygiene practices and did not incorporate cancer type into our analyses. Both factors may influence MRONJ risk and therefore represent potential sources of residual confounding. The third limitation is that the DNA samples were taken from whole blood. As DNA methylation is tissue-specific, methylation differences between cases and controls could occur due to different cell types within and between individuals. We used the EpiDISH package to estimate cell type proportions in order to include them as covariates in our analysis. However, due to the limitation of a small sample size, there was a risk of overfitting, so we did include it in the final model. We also aimed to assess whether there were significant differences in estimated cell type proportions between MRONJ cases and controls. No statistically significant differences were observed, which may be attributed to the limited sample size. Since EpiDISH relies on reference-based deconvolution, the small sample size may have affected the accuracy and stability of the cell type estimations. The results of this analysis are provided in the Supplementary File (Tables S10–S12; Figure S9).
As MRONJ is a localized condition affecting the jawbone, and our study relies on methylation profiles derived from whole blood, there is an inherent limitation in tissue specificity. While blood is a practical and accessible surrogate tissue, its use assumes that systemic methylation changes reflect local disease processes in the jaw. This assumption is difficult to validate and may not hold true in all cases. It is possible that some of the differential methylation signals observed, particularly those related to immune pathways or inflammatory markers, reflect systemic immune changes rather than localized bone pathology. Future studies should aim to replicate and validate these findings in jawbone tissue or more localized biological sources, such as saliva.

4. Materials and Methods

This study was a retrospective case–control study. The data consists of de-identified clinical records from the Miami Cancer Institute and the University of Florida (UF) Dental Clinic. This study included 24 cancer patients treated with intravenous BPs (zoledronate or pamidronate) (n = 15) or BPs and DMB sequentially (n = 9). The definitions of cases and controls are as follows: patients who were treated with BPs or DMB and developed MRONJ according to the clinical criteria set by the AAOMS [1]. Controls are patients treated with BPs or DMB for at least two years without developing MRONJ and were matched to the MRONJ cases in terms of the type of medications. This study was approved by the Institutional Review Boards at the University of Florida (Gainesville, FL, USA) and Miami Cancer Institute (Miami, FL, USA) in the USA. Written informed consent was obtained from all participants in the study.

4.1. DNA Methylation Profiling and Processing

Whole blood samples were collected after initiation of antiresorptive medication and prior to the clinical diagnosis of MRONJ. Samples were processed at the Center for Pharmacogenomics and Precision Medicine at the College of Pharmacy at UF. DNA was isolated and extracted from buffy coat using the QIAamp DNA Mini Kit. Following Illumina’s guidelines, samples underwent bisulfite treatment with a consistent DNA input of 500 ng per sample. The analysis for genome-wide DNA methylation utilized the Illumina Infinium MethylationEPIC v2.0 BeadChip (Illumina Inc., San Diego, CA, USA) and was performed at the Illumina service center at the University of Miami Hussman Institute for Human Genomics, adhering strictly to the manufacturer’s provided protocols.

4.1.1. Data Processing and Quality Controls (QC)

The preprocessing of the original array data (IDAT files) as an RGChannel Set at the probe level (red and green) was carried out using R (version 4.3.3) and the Bioconductor (version 3.18) minfi package (version 1.48.0) [43] with the function read.metharray.exp to determine DNA methylation levels.

4.1.2. Assessment of Samples Quality and Normalization

A mean detection p-value cutoff of >0.01 was used to exclude poor-quality samples. None of the samples were excluded. Additionally, quantile normalization was performed to address technical variability and make methylation level distributions across all samples consistent which improved the reliability and accuracy of downstream statistical analyses.

4.1.3. Gender Confirmation

PlotSex in the minfi package was used to validate individual’s gender by checking the concordance between genetically estimated sex and self-reported gender [43].This function computed the median log2 of the total intensity value for each sex chromosome. It confirmed the accuracy of self-reported gender data.

4.1.4. Removing Poor-Quality Probes

To exclude poor-quality probes, a p-value threshold of 0.01 was used, as signals below this threshold were considered unreliable and indistinguishable from background noise. A total of 5205 probes with p-value > 0.01 were considered poor quality and excluded from further analyses.

4.1.5. Removing Probes at Sex Chromosomes and SNPs

In EWAS, it is a common practice to remove probes located on the sex chromosomes due to X chromosome inactivation, which can affect the results. Therefore, a total of 23,768 probes located on sex chromosomes were removed from the analysis. Additionally, probes located in SNPs were also excluded to avoid potential confounding effects. This was done using the basic function of the minfi package, dropLociWithSnps, which removed 12,979 probes. These steps were taken to enhance the accuracy and reliability of the methylation data analysis.

4.1.6. Removing Flagged Probes

Illumina identifies a list of probes as flagged probes, also known as cross-reactive probes, which can bind to multiple loci. These cross-reactive probes can produce unreliable signals because they can hybridize to more than one location in the genome, leading to ambiguous or misleading results. We removed 41,808 probes for this reason.
After the QC steps, 846,315 CpG probes were included in the analysis. The final DNA methylation beta values and M values were calculated. Beta values represent the percentage of methylation at each site, while M values are the logit transformation of beta values. M values were used in all statistical analyses due to better statistical properties [44], while beta values were also reported to better interpret the results. With a sample size of 24 and α = 5.9 × 10⁻⁸, there is ≥80% power to detect a 10% methylation difference at approximately 38.6% of CpG sites, as estimated using EPIC Array Power Calculations [45].

4.2. Assessment of Cytokine and Bone Protein Levels

The levels of OC, OPG, OPN, SOST, IL-6, IL-1B, TNF-α and RANKL in the plasma samples of the 24 patients were determined using Milliplex multiplex assay HBNMAG-51K and singleplex assay HRNKLMAG-51K-01 (EMD, Millipore, Burlington, MA, USA). Plasma was normalized based on volume as recommended by the manufacturer’s instructions. Data were obtained on a MAGPIX multiplex reader system running xPONENT 3.1 software (Luminex, Austin, TX, USA) and examined using a five-parameter logistic spline-curve fitting method and Milliplex Analyst V5.1 software (Vigene Tech, Carlisle, MA, USA).
During the QC process, protein concentrations below the lower limit of detection were assigned a value of half the lower detection limit. For concentrations exceeding the upper limit of detection, the highest measurable value was divided by two. These adjustments were applied to ensure data consistency and accuracy in subsequent analyses. Two proteins, IL-6 and IL-1B, had 83.3% and 66.7% of samples, respectively, with concentrations below the lower limit of detection and were excluded from further analysis.

4.3. Statistical Analysis

4.3.1. Descriptive Statistics

The patient characteristics were summarized by MRONJ status, including median, interquartile range (IQR for continuous variables, as well as frequency and percentage for categorical variables. To assess differences between MRONJ and controls, t-test was used for continuous variables that were normally distributed such as age, while the Wilcoxon rank-sum test was applied to variables that were not normally distributed such as BMI. For categorical variables such as sex and smoking status, Fisher’s exact test was utilized. t-test was used to assess the group difference in bone protein levels between MRONJ and controls in the three analyses.

4.3.2. Estimating Cell Type Proportions

DNA methylation is tissue-specific, with different cell types exhibiting distinct methylation patterns. The Epigenetic Dissection of Intra-Sample Heterogeneity (EpiDISH) package (version 2.18.0) was used as a reference-based method, utilizing the centDHSbloodDMC.m implemented reference. This method calculated the proportions of B cells, natural killer (NK) cells, CD4+ T cells, CD8+ T cells, monocytes, neutrophils, and eosinophils using three methods: Robust Partial Correlations (RPC), Cibersort (CBS), and Constrained Projection (CP), also known as Houseman.
Our initial goal was to include the estimated cell proportions as covariates in the EWAS model to adjust for potential confounding. However, due to the small sample size and the resulting risk of overfitting, we did not include these adjustments in the final model. Instead, we compared estimated cell type proportions between MRONJ cases and controls using the Wilcoxon rank-sum test.

4.3.3. DMPs Analysis

A multiple linear regression model was conducted using the limma package to identify DMPs. The M values for each CpG were used as the independent variable, with subject status (MRONJ or control) as the dependent variable, adjusting for age and sex as covariates. To account for multiple testing, we applied a Bonferroni correction across 846,315 CpG sites, resulting in a genome-wide significance threshold of p < 5.9 × 10⁻⁸. In addition, a cutoff of p < 1 × 10⁻⁵ was used as a suggestive threshold to identify potentially meaningful DMPs. DMPs were identified in the main analysis comparing MRONJ to controls. Given that some patients were treated with BPs or sequential therapy with BPs and DMB, two subgroup analyses based on prescribed medications were performed to further identify DMPs. The rationale for these analyses was two-fold: first, to determine whether a specific subgroup was driving the main analysis; second, to assess whether the identified DMPs were specific to certain medications or were associated with the main analysis independent of medications.
A DMP is assigned as a promoter feature if it is located within 2 KB upstream of the transcription start site (TSS) or is identified by the Encyclopedia of DNA Elements (ENCODE), Genome-wide integration of enhancers and target genes in GeneCards (GeneHancer) datasets or validated by the Eukaryotic Promoter Database, regardless of the genomic feature.

4.3.4. DMRs Analyses

To calculate DMRs, we first identified DMPs with a p-value < 0.05 as putative DMPs in each analysis separately. These DMPs were then used as input for the DMRcate package (version 2.16.1) [46], which uses a Gaussian kernel smoothing to adjust squared EWAS t statistics at each CpG site, and the significant CpG sites within a certain distance are combined to form DMRs. Specifically, a bandwidth of 1000–2000 nucleotides was applied to ensure that CpG sites within proximity were considered part of the same region.

5. Conclusions

We identified several genes that are differentially methylated in MRONJ and controls, which may serve as potential biomarkers. These findings suggest that MRONJ may be epigenetically influenced. However, given the small sample size, the study is at increased risk of type II error, and the results should be considered preliminary. Further investigations in larger, independent cohorts are warranted to validate and clarify the implications of these associations.

Supplementary Materials

The following supporting information can be downloaded at: https://www.mdpi.com/article/10.3390/ijms262211208/s1.

Author Contributions

Conceptualization, R.A.A. and Y.G.; Methodology R.A.A., Y.G., D.W.; Software R.A.A.; Formal Analysis R.A.A., Y.G.; Investigation M.T., L.S.H., Y.G.; Resources L.S.H., Y.G.; Data Curation, R.A.A., M.T., E.C.-H., M.A., A.V., J.K., L.S.H.; Writing—Original Draft R.A.A., Y.G., Writing—Review and Editing, R.A.A., M.T., D.W., E.C.-H., M.A., A.V., J.K., L.S.H., Y.G.; Supervision Y.G.; Funding Acquisition Y.G. All authors have read and agreed to the published version of the manuscript.

Funding

This research was funded in part by the National Institute of Health (NIH) R56DE030538. The content is solely the responsibility of the authors and does not necessarily represent the official views of the NIH.

Institutional Review Board Statement

The study received ethical approval from the Institutional Review Boards (IRBs) at the University of Florida (IRB 201800934, approved on 30 April 2018) and Miami Cancer Institute (IRB 202201262, approved on 17 June 2022).

Informed Consent Statement

Informed consent was obtained from all subjects involved in the study.

Data Availability Statement

The original data may be made available upon reasonable request from the corresponding author, subject to privacy considerations.

Acknowledgments

We acknowledge all the patients for their contribution to this study.

Conflicts of Interest

The authors declare no conflict of interest.

References

  1. Ruggiero, S.L.; Dodson, T.B.; Aghaloo, T.; Carlson, E.R.; Ward, B.B.; Kademani, D. American Association of Oral and Maxillofacial Surgeons’ Position Paper on Medication-Related Osteonecrosis of the Jaws-2022 Update. J. Oral Maxillofac. Surg. 2022, 80, 920–943. [Google Scholar] [CrossRef]
  2. Wajda, B.G.; Ferrie, L.E.; Abbott, A.G.; Elmi Assadzadeh, G.; Monument, M.J.; Kendal, J.K. Denosumab vs. Zoledronic Acid for Metastatic Bone Disease: A Comprehensive Systematic Review and Meta-Analysis of Randomized Controlled Trials. Cancers 2025, 17, 388. [Google Scholar] [CrossRef] [PubMed]
  3. Sarasquete, M.E.; García-Sanz, R.; Marín, L.; Alcoceba, M.; Chillón, M.C.; Balanzategui, A.; Santamaria, C.; Rosiñol, L.; de la Rubia, J.; Hernandez, M.T.; et al. Bisphosphonate-related osteonecrosis of the jaw is associated with polymorphisms of the cytochrome P450 CYP2C8 in multiple myeloma: A genome-wide single nucleotide polymorphism analysis. Blood 2008, 112, 2709–2712. [Google Scholar] [CrossRef] [PubMed]
  4. Nicoletti, P.; Cartsos, V.M.; Palaska, P.K.; Shen, Y.; Floratos, A.; Zavras, A.I. Genomewide pharmacogenetics of bisphosphonate-induced osteonecrosis of the jaw: The role of RBMS3. Oncologist 2012, 17, 279–287. [Google Scholar] [CrossRef]
  5. Yang, G.; Singh, S.; McDonough, C.W.; Lamba, J.K.; Hamadeh, I.; Holliday, L.S.; Wang, D.; Katz, J.; Lakatos, P.A.; Balla, B.; et al. Genome-wide Association Study Identified Chromosome 8 Locus Associated with Medication-Related Osteonecrosis of the Jaw. Clin. Pharmacol. Ther. 2021, 110, 1558–1569. [Google Scholar] [CrossRef]
  6. Buniello, A.; MacArthur, J.A.L.; Cerezo, M.; Harris, L.W.; Hayhurst, J.; Malangone, C.; McMahon, A.; Morales, J.; Mountjoy, E.; Sollis, E.; et al. The NHGRI-EBI GWAS Catalog of published genome-wide association studies, targeted arrays and summary statistics 2019. Nucleic Acids Res. 2019, 47, D1005–D1012. [Google Scholar] [CrossRef]
  7. Delgado-Calle, J.; Sañudo, C.; Fernández, A.F.; García-Renedo, R.; Fraga, M.F.; Riancho, J.A. Role of DNA methylation in the regulation of the RANKL-OPG system in human bone. Epigenetics 2012, 7, 83–91. [Google Scholar] [CrossRef] [PubMed]
  8. Li, Y. Modern epigenetics methods in biological research. Methods 2021, 187, 104–113. [Google Scholar] [CrossRef]
  9. Drake, M.T.; Clarke, B.L.; Khosla, S. Bisphosphonates: Mechanism of action and role in clinical practice. Mayo Clin. Proc. 2008, 83, 1032–1045. [Google Scholar] [CrossRef]
  10. Nagy, V.; Penninger, J.M. The RANKL-RANK Story. Gerontology 2015, 61, 534–542. [Google Scholar] [CrossRef] [PubMed]
  11. Moore, J.E.; Purcaro, M.J.; Pratt, H.E.; Epstein, C.B.; Shoresh, N.; Adrian, J.; Kawli, T.; Davis, C.A.; Dobin, A.; Kaul, R.; et al. Expanded encyclopaedias of DNA elements in the human and mouse genomes. Nature 2020, 583, 699–710. [Google Scholar] [CrossRef] [PubMed]
  12. Zhao, S.; Zhang, D.; Liu, S.; Huang, J. The roles of NOP56 in cancer and SCA36. Pathol. Oncol. Res. 2023, 29, 1610884. [Google Scholar] [CrossRef] [PubMed]
  13. Hu, S.Y.; Jin, X.D.; Zhang, H.; Chen, J.; Yang, G.Z.; Wang, X.D.; Tang, L.; Lu, X.Y.; Lu, L.; Li, Q.N. Role of epithelial sodium channel in rat osteoclast differentiation and bone resorption. J. South. Med. Univ 2016, 36, 1148–1152. [Google Scholar]
  14. Perin, M.; Chinigo, G.; Genova, T.; Mussano, F.; Munaron, L. The Impact of Plasma Membrane Ion Channels on Bone Remodeling in Response to Mechanical Stress, Oxidative Imbalance, and Acidosis. Antioxidants 2023, 12, 689. [Google Scholar] [CrossRef]
  15. Shao, W.; Orlando, R.C.; Awayda, M.S. Bisphosphonates stimulate an endogenous nonselective cation channel in Xenopus oocytes: Potential mechanism of action. Am. J. Physiol. Cell Physiol. 2005, 289, C248–C256. [Google Scholar] [CrossRef] [PubMed]
  16. Hwang, S.Y.; Putney, J.W., Jr. Calcium signaling in osteoclasts. Biochim. Biophys. Acta 2011, 1813, 979–983. [Google Scholar] [CrossRef]
  17. Wang, X.; Qu, Z.; Zhao, S.; Luo, L.; Yan, L. Wnt/beta-catenin signaling pathway: Proteins’ roles in osteoporosis and cancer diseases and the regulatory effects of natural compounds on osteoporosis. Mol. Med. 2024, 30, 193. [Google Scholar] [CrossRef]
  18. McClung, M.R. Sclerostin antibodies in osteoporosis: Latest evidence and therapeutic potential. Ther. Adv. Musculoskelet. Dis. 2017, 9, 263–270. [Google Scholar] [CrossRef]
  19. Han, G.; Zuo, J.; Holliday, L.S. Specialized Roles for Actin in Osteoclasts: Unanswered Questions and Therapeutic Opportunities. Biomolecules 2019, 9, 17. [Google Scholar] [CrossRef]
  20. Boissier, P.; Huynh-Do, U. The guanine nucleotide exchange factor Tiam1: A Janus-faced molecule in cellular signaling. Cell Signal 2014, 26, 483–491. [Google Scholar] [CrossRef] [PubMed]
  21. Shen, J.; Huang, Q.; Jia, W.; Feng, S.; Liu, L.; Li, X.; Tao, D.; Xie, D. YAP1 induces invadopodia formation by transcriptionally activating TIAM1 through enhancer in breast cancer. Oncogene 2022, 41, 3830–3845. [Google Scholar] [CrossRef]
  22. Wang, B.; Zheng, B.; Cao, L.; Liao, K.; Huang, D.; Zhang, Y.; Jiang, Y.; Zheng, S. T-lymphoma invasion and metastasis 1 promotes invadopodia formation and is regulated by the PI3K/Akt signaling pathway in hepatocellular carcinoma. Exp. Cell Res. 2021, 407, 112806. [Google Scholar] [CrossRef]
  23. Luxenburg, C.; Parsons, J.T.; Addadi, L.; Geiger, B. Involvement of the Src-cortactin pathway in podosome formation and turnover during polarization of cultured osteoclasts. J. Cell Sci. 2006, 119, 4878–4888. [Google Scholar] [CrossRef]
  24. Matsubara, T.; Myoui, A.; Ikeda, F.; Hata, K.; Yoshikawa, H.; Nishimura, R.; Yoneda, T. Critical role of cortactin in actin ring formation and osteoclastic bone resorption. J. Bone Miner. Metab. 2006, 24, 368–372. [Google Scholar] [CrossRef]
  25. Tehrani, S.; Faccio, R.; Chandrasekar, I.; Ross, F.P.; Cooper, J.A. Cortactin has an essential and specific role in osteoclast actin assembly. Mol. Biol. Cell 2006, 17, 2882–2895. [Google Scholar] [CrossRef]
  26. Kajitani, N.; Yamada, T.; Kawakami, K.; Matsumoto, K.I. TNX deficiency results in bone loss due to an increase in multinucleated osteoclasts. Biochem. Biophys. Res. Commun. 2019, 512, 659–664. [Google Scholar] [CrossRef]
  27. Rodan, G.A.; Bourret, L.A.; Harvey, A.; Mensi, T. Cyclic AMP and cyclic GMP: Mediators of the mechanical effects on bone remodeling. Science 1975, 189, 467–469. [Google Scholar] [CrossRef]
  28. Chabre, O.; Conklin, B.R.; Lin, H.Y.; Lodish, H.F.; Wilson, E.; Ives, H.E.; Catanzariti, L.; Hemmings, B.A.; Bourne, H.R. A recombinant calcitonin receptor independently stimulates 3′,5′-cyclic adenosine monophosphate and Ca2+/inositol phosphate signaling pathways. Mol. Endocrinol. 1992, 6, 551–556. [Google Scholar] [CrossRef]
  29. Martin, T.J. PTH1R Actions on Bone Using the cAMP/Protein Kinase A Pathway. Front. Endocrinol. 2021, 12, 833221. [Google Scholar] [CrossRef]
  30. Pekkinen, M.; Ahlstrom, M.E.B.; Riehle, U.; Huttunen, M.M.; Lamberg-Allardt, C.J.E. Effects of phosphodiesterase 7 inhibition by RNA interference on the gene expression and differentiation of human mesenchymal stem cell-derived osteoblasts. Bone 2008, 43, 84–91. [Google Scholar] [CrossRef]
  31. Qasim, H.; McConnell, B.K. AKAP12 Signaling Complex: Impacts of Compartmentalizing cAMP-Dependent Signaling Pathways in the Heart and Various Signaling Systems. J. Am. Heart Assoc. 2020, 9, e016615. [Google Scholar] [CrossRef]
  32. Chen, Y.J.; Chang, W.A.; Hsu, Y.L.; Chen, C.H.; Kuo, P.L. Deduction of Novel Genes Potentially Involved in Osteoblasts of Rheumatoid Arthritis Using Next-Generation Sequencing and Bioinformatic Approaches. Int. J. Mol. Sci. 2017, 18, 2396. [Google Scholar] [CrossRef]
  33. Johnson, A.G.; Lapointe, C.P.; Wang, J.; Corsepius, N.C.; Choi, J.; Fuchs, G.; Puglisi, J.D. RACK1 on and off the ribosome. RNA 2019, 25, 881–895. [Google Scholar] [CrossRef]
  34. Kershner, L.; Welshhans, K. RACK1 is necessary for the formation of point contacts and regulates axon growth. Dev. Neurobiol. 2017, 77, 1038–1056. [Google Scholar] [CrossRef]
  35. Park, J.H.; Jeong, E.; Lin, J.; Ko, R.; Kim, J.H.; Yi, S.; Choi, Y.; Kang, I.C.; Lee, D.; Lee, S.Y. RACK1 interaction with c-Src is essential for osteoclast function. Exp. Mol. Med. 2019, 51, 1–9. [Google Scholar] [CrossRef]
  36. Yang, C.; Jin, X.; Liu, X.; Wu, G.; Yang, W.; Pang, B.; Jiang, J.; Liao, D.; Zhang, Y. TRIM15 forms a regulatory loop with the AKT/FOXO1 axis and LASP1 to modulate the sensitivity of HCC cells to TKIs. Cell Death Dis. 2023, 14, 47. [Google Scholar] [CrossRef]
  37. Li, Z.; Zhang, W.; Wei, X.Y.; Hu, J.Z.; Hu, X.; Liu, H.; Lu, J.; Shen, S.; Ji, M.L. TRIM15 drives chondrocyte senescence and osteoarthritis progression. Sci. Transl. Med. 2025, 17, eadq1735. [Google Scholar] [CrossRef]
  38. Peraldi, R.; Kmita, M. 40 years of the homeobox: Mechanisms of Hox spatial-temporal collinearity in vertebrates. Development 2024, 151, dev202508. [Google Scholar] [CrossRef]
  39. Myers, C.; Charboneau, A.; Boudreau, N. Homeobox B3 promotes capillary morphogenesis and angiogenesis. J. Cell Biol. 2000, 148, 343–351. [Google Scholar] [CrossRef]
  40. Kachgal, S.; Mace, K.A.; Boudreau, N.J. The dual roles of homeobox genes in vascularization and wound healing. Cell Adh Migr. 2012, 6, 457–470. [Google Scholar] [CrossRef]
  41. Chung, N.; Jee, B.K.; Chae, S.W.; Jeon, Y.W.; Lee, K.H.; Rha, H.K. HOX gene analysis of endothelial cell differentiation in human bone marrow-derived mesenchymal stem cells. Mol. Biol. Rep. 2009, 36, 227–235. [Google Scholar] [CrossRef]
  42. Gatti, D.; Viapiana, O.; Adami, S.; Idolazzi, L.; Fracassi, E.; Rossini, M. Bisphosphonate treatment of postmenopausal osteoporosis is associated with a dose dependent increase in serum sclerostin. Bone 2012, 50, 739–742. [Google Scholar] [CrossRef] [PubMed]
  43. Aryee, M.J.; Jaffe, A.E.; Corrada-Bravo, H.; Ladd-Acosta, C.; Feinberg, A.P.; Hansen, K.D.; Irizarry, R.A. Minfi: A flexible and comprehensive Bioconductor package for the analysis of Infinium DNA methylation microarrays. Bioinformatics 2014, 30, 1363–1369. [Google Scholar] [CrossRef] [PubMed]
  44. Du, P.; Zhang, X.; Huang, C.C.; Jafari, N.; Kibbe, W.A.; Hou, L.; Lin, S.M. Comparison of Beta-value and M-value methods for quantifying methylation levels by microarray analysis. BMC Bioinform. 2010, 11, 587. [Google Scholar] [CrossRef]
  45. EPIC Array Power Calculations. Available online: https://epigenetics.essex.ac.uk/shiny/EPICDNAmPowerCalcs/ (accessed on 11 November 2025).
  46. Peters, T.J.; Buckley, M.J.; Statham, A.L.; Pidsley, R.; Samaras, K.; Lord, R.V.; Clark, S.J.; Molloy, P.L. De novo identification of differentially methylated regions in the human genome. Epigenetics Chromatin 2015, 8, 6. [Google Scholar] [CrossRef]
Figure 1. Flowchart of EWAS quality control steps and analyses.
Ijms 26 11208 g001
Figure 2. Manhattan plots for the three EWAS of MRONJ: (A). the main analysis (λ = 1.45); (B). the first subgroup analysis (λ = 1.09); (C). the second subgroup analysis (λ = 1.16). The x-axis represents the chromosome position, and the y-axis represents the −log10(p) value. Each blue or yellow dot represents a CpG site across chromosomes.
Ijms 26 11208 g002
Figure 3. Boxplots showing the methylation differences in the beta values of the top DMPs: (A) in the main analysis; (B) in the first subgroup analysis; (C) in the second subgroup analysis.
Ijms 26 11208 g003
Figure 4. Boxplots of bone protein biomarker levels: (A). in the main analysis; (B). in the first subgroup analysis; (C). in the second subgroup analysis.
Ijms 26 11208 g004
Table 1. Clinical characteristics of study participants.
VariableAll Participants (n = 24)
Cases (n = 12)Control (n = 12)p Value
* Continuous
Age (years)68.5 (59.25–71.5)67.5 (57.0–72.0)0.73
BMI (kg/m2)28.4 (24.5–32.1)27.25 (25.4–28.8)0.71
* Categorical
Sex at birth>0.99
Female8 (66.7.%)9 (75%)
Male4 (33.3%)3 (25%)
Race Groups0.32
White8 (66.7%)11 (91.7%)
Black 4 (33.3%)1 (8.3%)
Smoking status>0.99
Current smoker0 (0.0%)1 (8.3%)
Previous smoker7 (58.3%)7 (58.3%)
Never smoke5 (41.7%)4 (33.3%)
AAOMS Staging of MRONJ
Stage 17 (58.3%)-
Stage23 (25%)-
Stage30 (0.0%)-
Stage40 (0.0%)-
NA2 (16.7%)
Lesion location
Maxilla2 (16.7%)-
Mandible7 (58.3%)-
Anterior–posterior1 (8.3%)-
Lingual/buccal0 (0.0%)-
NA2 (16.7%)-
Medications
Bisphosphonates7 (58.3%)8 (66.7%)>0.99
Sequential therapy (BPs/DMB)5 (41.7%)4 (33.3%)
Abbreviations: MRONJ: medication-related osteonecrosis of the jaw; BMI: body mass index; AAOMS: American Association of Oral and Maxillofacial Surgeons; NA: Not Available. * For continuous variables, median and (IQR) were reported; for categorical variables, numbers (%) were presented. Age was compared between groups using t-test, and BMI using Wilcoxon rank-sum test.
Table 2. Summary of DMPs associated with MRONJ in the main and subgroup analyses.
NoIlumina IDCHRMAP INFOGene NameFeatureMain AnalysisFirst Subgroup AnalysisSecond Subgroup Analysis
logFCplogFCplogFCp
1cg19137662 *chr202652716NOP56Promoter−1.382.19 × 10−7−1.604.80 × 10−6−1.010.01
2cg17230255 *chr126364225SCNN1APromoter−0.601.10 × 10−6−0.682.27 × 10−5−0.450.01
3cg27297662chr2131136999TIAM1Intron−1.302.89 × 10−6−1.539.51 × 10−6−0.850.02
4cg01876490chr1865766883CDH7Intron−1.105.10 × 10−6−1.170.0002−0.970.01
5cg21289669chr632096987TNXBExon0.846.31 × 10−60.880.00030.820.005
6cg11392877chr1584981545PDE8APromoter−0.550.0005−0.985.35 × 10−70.130.48
7cg02389743 *chr2152099098CACNB4Promoter0.520.00060.922.08 × 10−6−0.070.71
8cg25771730chr47425468SORCS2Intron0.420.0040.829.60 × 10−6−0.170.38
9cg00515982chr5181243930RACK1Promoter−0.510.0004−0.819.94 × 10−6−0.020.91
10cg09965760chr6151300350AKAP12Intron0.440.00030.150.220.897.92 × 10−6
Illumina ID: CpG name in Illumina database; CHR: Chromosome; MAPINFO: Genomic coordinates; FC: fold change; p: p-value; * Novel discovery of DMPs.
Table 3. Summary of DMRs associated with MRONJ in the main analysis and subgroup analyses.
NoCHRGene NameMain AnalysisFirst Subgroup AnalysisSecond Subgroup Analysis
No. CpGMean DiffpNo. CpGMean DiffpNo. CpGMean Diffp
1chr6TNXB200.073.30 × 10−10100.092.76 × 10−7NDNDND
2chr17HOXB-AS3, HOXB3, HOXB415−0.064.27 × 10−8NDNDNDNDNDND
3chr4SPON213−0.032.76 × 10−712−0.044.27 × 10−8NDNDND
4chr6TRIM1590.071.43 × 10−5120.13.30 × 10−10NDNDND
DMRs: Differentially methylated region; CHR: Chromosome; p: p-value; ND: Not detected; Mean Diff: Mean methylation difference.
Table 4. Correlation between DMPs and bone protein biomarkers.
No.DMPMethylation StatusRegionMain Analysis
(n = 24)
First Subgroup Analysis
(n = 15)
Second Subgroup Analysis
(n = 9)
Biomarker
rprprp
1cg19137662
(NOP56)
HypomethylationPromoter0.480.020.570.03−0.400.28OC
0.320.130.380.160.730.025RANKL
2cg17230255
(SCNN1A)
HypomethylationPromoter0.560.0040.660.010.440.24TNF-
alpha
3cg11392877
(PDE8A)
HypomethylationPromoter−0.280.19−0.510.050.630.07SOST
0.240.250.090.750.820.01OPG
DMP: Differentially methylated probes.
Disclaimer/Publisher’s Note: The statements, opinions and data contained in all publications are solely those of the individual author(s) and contributor(s) and not of MDPI and/or the editor(s). MDPI and/or the editor(s) disclaim responsibility for any injury to people or property resulting from any ideas, methods, instructions or products referred to in the content.